Article

Transcriptome Analysis of Wheat–Tilletia indica Interaction Provides Defense and Pathogenesis-Related Genes

by
Malkhan Singh Gurjar
1,*,
Shekhar Jain
1,2,
Rashmi Aggarwal
1,
Mahender Singh Saharan
1,
Tej Pratap Jitendra Kumar
1 and
Lalit Kharbikar
3
1
Division of Plant Pathology, ICAR-Indian Agricultural Research Institute, New Delhi 110012, India
2
Faculty of Life Sciences, Mandsaur University, Mandsaur 458001, India
3
Biotechnology Section, ICAR–National Institute of Biotic Stress Management, Raipur 493225, India
*
Author to whom correspondence should be addressed.
Plants 2022, 11(22), 3061; https://doi.org/10.3390/plants11223061
Submission received: 20 September 2022 / Revised: 21 October 2022 / Accepted: 31 October 2022 / Published: 11 November 2022
(This article belongs to the Special Issue Effector Arsenal of Plant Parasites and Ecological Implications)

Abstract

:
Karnal bunt (Tilletia indica Mitra) is an internationally quarantined disease of wheat. Until now, very little information has been available on the molecular basis of resistance and pathogenicity of T. indica. To investigate the molecular basis of host–pathogen interaction, the transcriptome of T. indica inoculated resistant (HD29) and susceptible (WH542) genotypes of wheat were analyzed. Approximately 58 million reads were generated using RNA sequencing by the Illumina NextSeq500 platform. These sequence reads were aligned to a reference genome of wheat to compare the expression level of genes in resistant and susceptible genotypes. The high-quality reads were deposited in the NCBI SRA database (SRP159223). More than 80,000 genes were expressed in both the resistant and susceptible wheat genotypes. Of these, 76,088 were commonly expressed genes, including 3184 significantly upregulated and 1778 downregulated genes. Four thousand one hundred thirteen and 5604 genes were exclusively expressed in susceptible and resistant genotypes, respectively. Based on the significance, 503 genes were upregulated and 387 genes were downregulated. Using gene ontology, the majority of coding sequences were associated with response to stimuli, stress, carbohydrate metabolism, developmental process, and catalytic activity. Highly differentially expressed genes (integral component of membrane, exonuclease activity, nucleic acid binding, DNA binding, metal ion binding) were validated in resistant and susceptible genotypes using qPCR analysis and similar expression levels were found in RNA-Seq. Apart from the wheat, the mapping of T. indica was 7.07% and 7.63% of resistant and susceptible hosts, respectively, upon infection, which revealed significant pathogenesis-related genes. This first study provided in-depth information and new insights into wheat–T. indica interaction for managing Karnal bunt disease of wheat.

1. Introduction

Wheat (Triticum aestivum, AABBDD 2n = 42) is the most widely grown crop in the world, including in India, where its production has reached to 107.59 million tons with 3421 kg/ha productivity [1] (Anonymous, 2020–21). India is the second largest producer of wheat in the world. Among biotic factors, Karnal bunt disease is the most important restriction, causing huge monetary losses in its trade caused by a hemibiotrophic fungus Tilletia indica. It was first reported from the Karnal district of India in the year of 1931 [2]. It has since been found in major wheat-growing states of India, as well as in other countries [3]. The pathogen is an international quarantine fungal pathogen. The disease has been reported in many countries, such as Afghanistan, Pakistan, Nepal, Mexico, some parts of the United States, Iraq, Iran, Lebanon, Syria, Sweden, Turkey, and South Africa. Presently it is a major biosecurity concern to export wheat [4,5,6]. The disease has been warned of due to climate change conditions in coming years [7].
T. indica is a soil, seed, and air-borne fungus, which infects mainly the floral parts of wheat [8,9]. Identification of Karnal bunt disease in the field is complex because the symptoms are not very evident. The distinctive symptom of bunt sori development is only on a few grains in the head instead of the whole head [10]. Another peculiar symptom is that infected grains emit a rotten fishy smell due to the presence of the trimethylamine compound [11,12]. Seed- or soil-borne teliospores seem to initiate in Karnal bunt infection [13,14,15].
Genetic diversity in T. indica was thought to be due to its genetic recombination [16,17,18]. Recently, a few draft genomes of T. indica has been sequenced, and putative virulence genes were validated [19,20,21]. Still, there is a need for complete genome sequencing of T. indica. The screening of wheat genotypes against Karnal bunt is very challenging. Karnal bunt-resistant wheat cultivars can reduce the severity of the disease. However, the development of resistant cultivars is very difficult since the pathogen-resistant genetic architecture in wheat is not fully identified. Understanding the molecular mechanisms of the pathogen during the infection process is essential for identifying targets for disease management [22]. Few pathogenesis-related genes (TiHog1, Ti57, and Ti198) have been validated in T. indica under in planta conditions [23].
Keeping this in view, we initiated the transcriptome analysis to understand mechanism and pathways during wheat-T. indica interactions in both resistant and susceptible wheat genotypes. The transcriptome analysis aimed to identify in three ways (i) the wheat genes, which are differentially expressed in both resistant and susceptible genotypes, respectively, (ii) the genes which are associated with the defense mechanism, and (iii) the identification of virulence related genes in Tilletia indica. Comparative transcriptome analysis has revealed the role of host genes, which exclusively regulate the infection in resistant as well as susceptible wheat genotypes.

2. Results

2.1. RNA Sequence Analysis and Mapping with Reference Wheat Genome

RNA-seq generated more than 5 Gb of transcriptome data from each library constructed out of a resistant and susceptible genotype, respectively. The high-quality reads were deposited in the NCBI SRA database (SRP159223). The average library fragment size was 473 bp to 504 bp. The average GC contents in the libraries were 51.38% and 49.48% for resistant (HD29) and susceptible genotypes (WH542), respectively. Resistant and susceptible genotypes generated 29,321,161 and 29,062,661 high-quality reads, respectively. About 94 percent of reads from resistant (HD29) and 92 percent of reads from susceptible genotypes (WH542) aligned to a wheat reference genome (Table 1). The remaining 6 percent of reads from the resistant genotype and 8 percent of reads from the susceptible genotype remained unmapped.

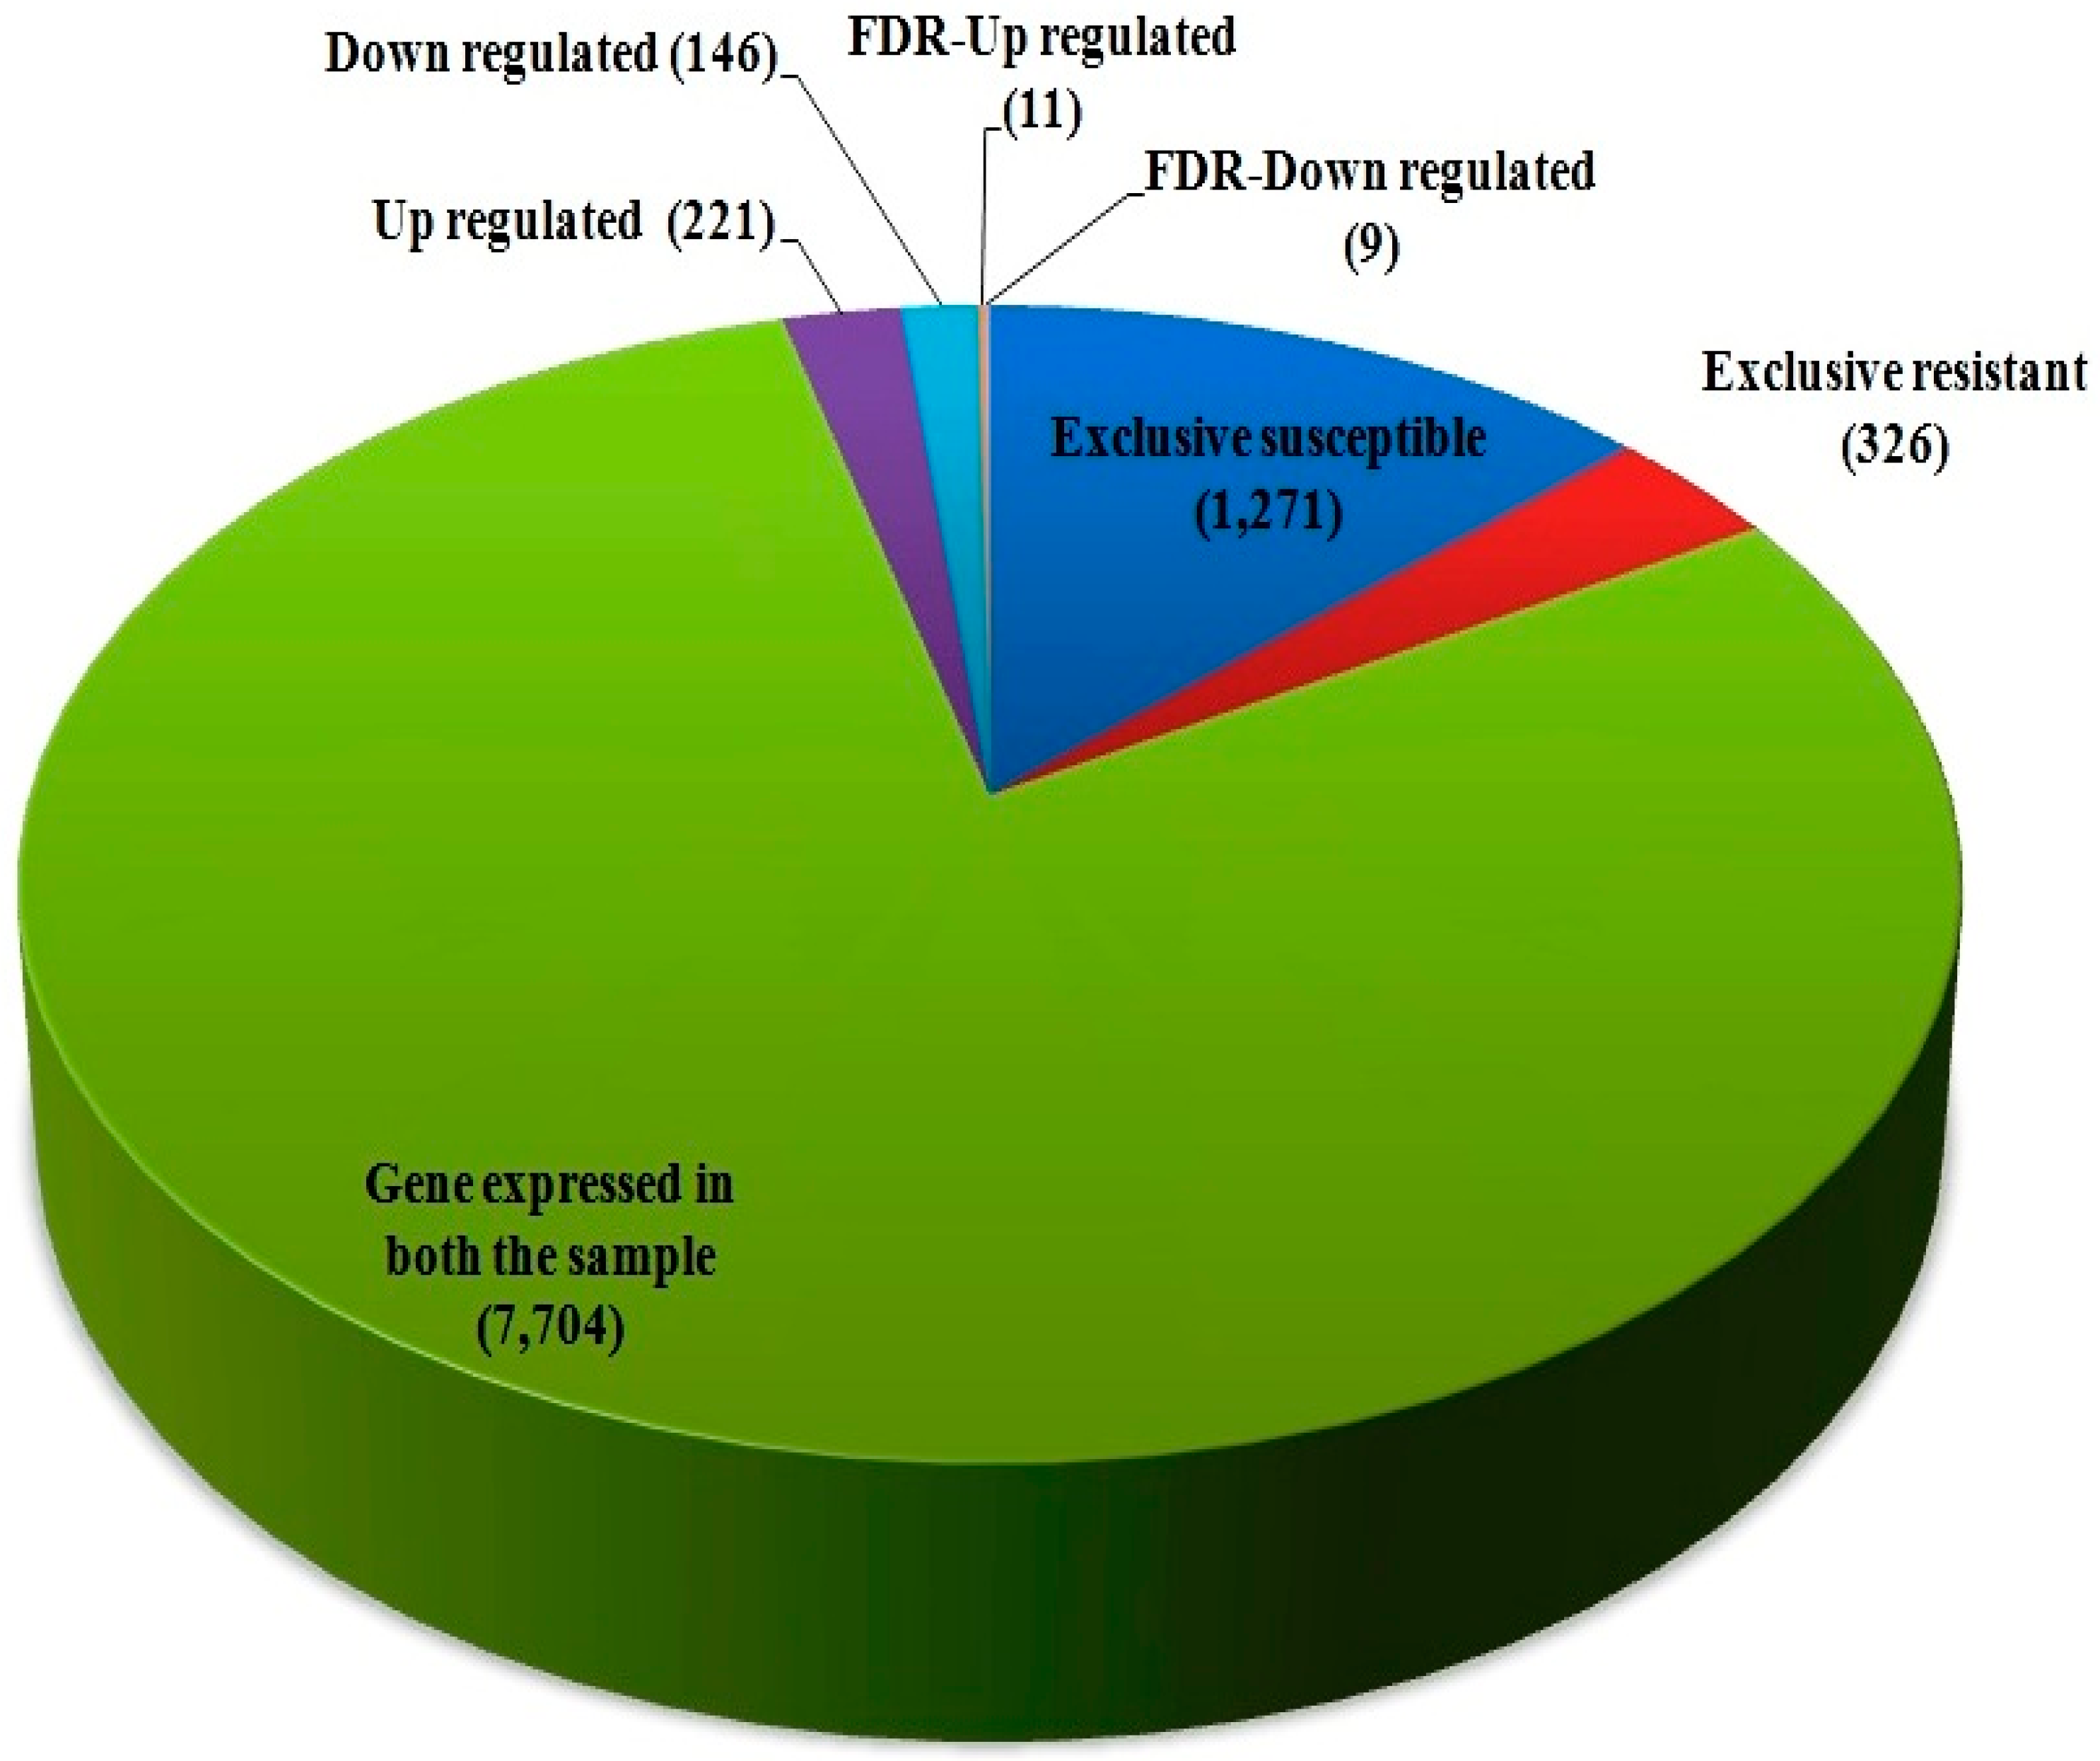
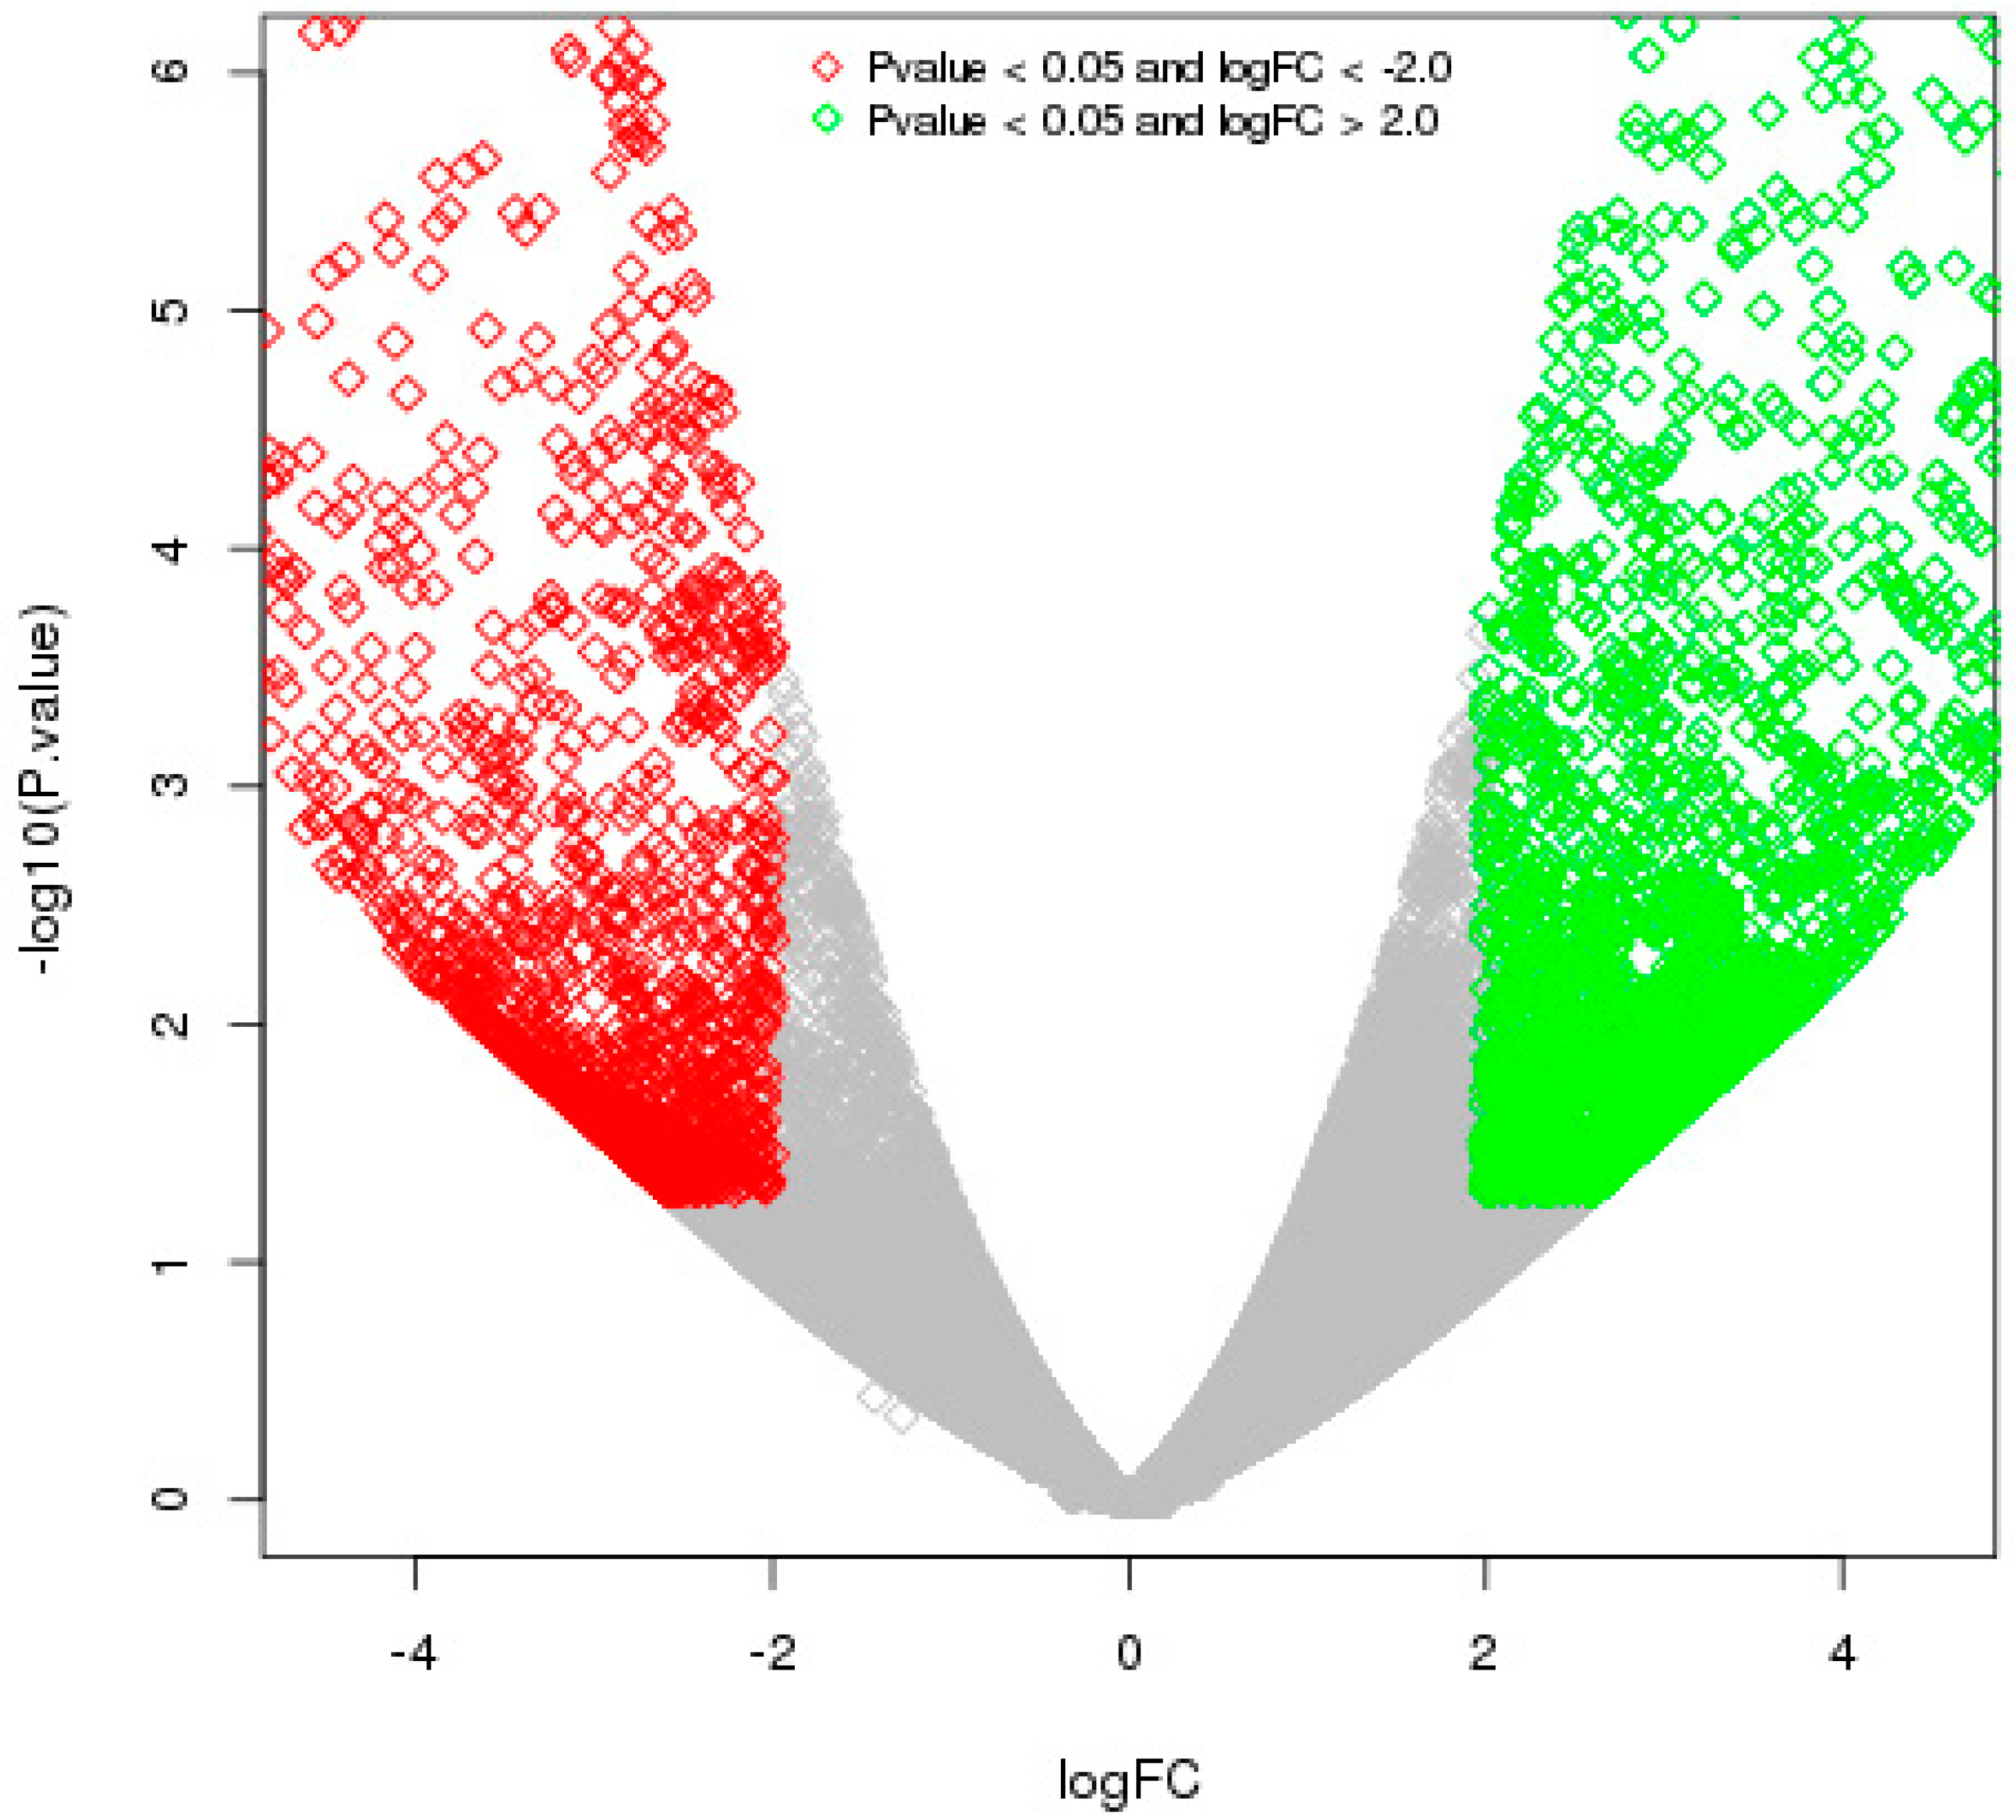
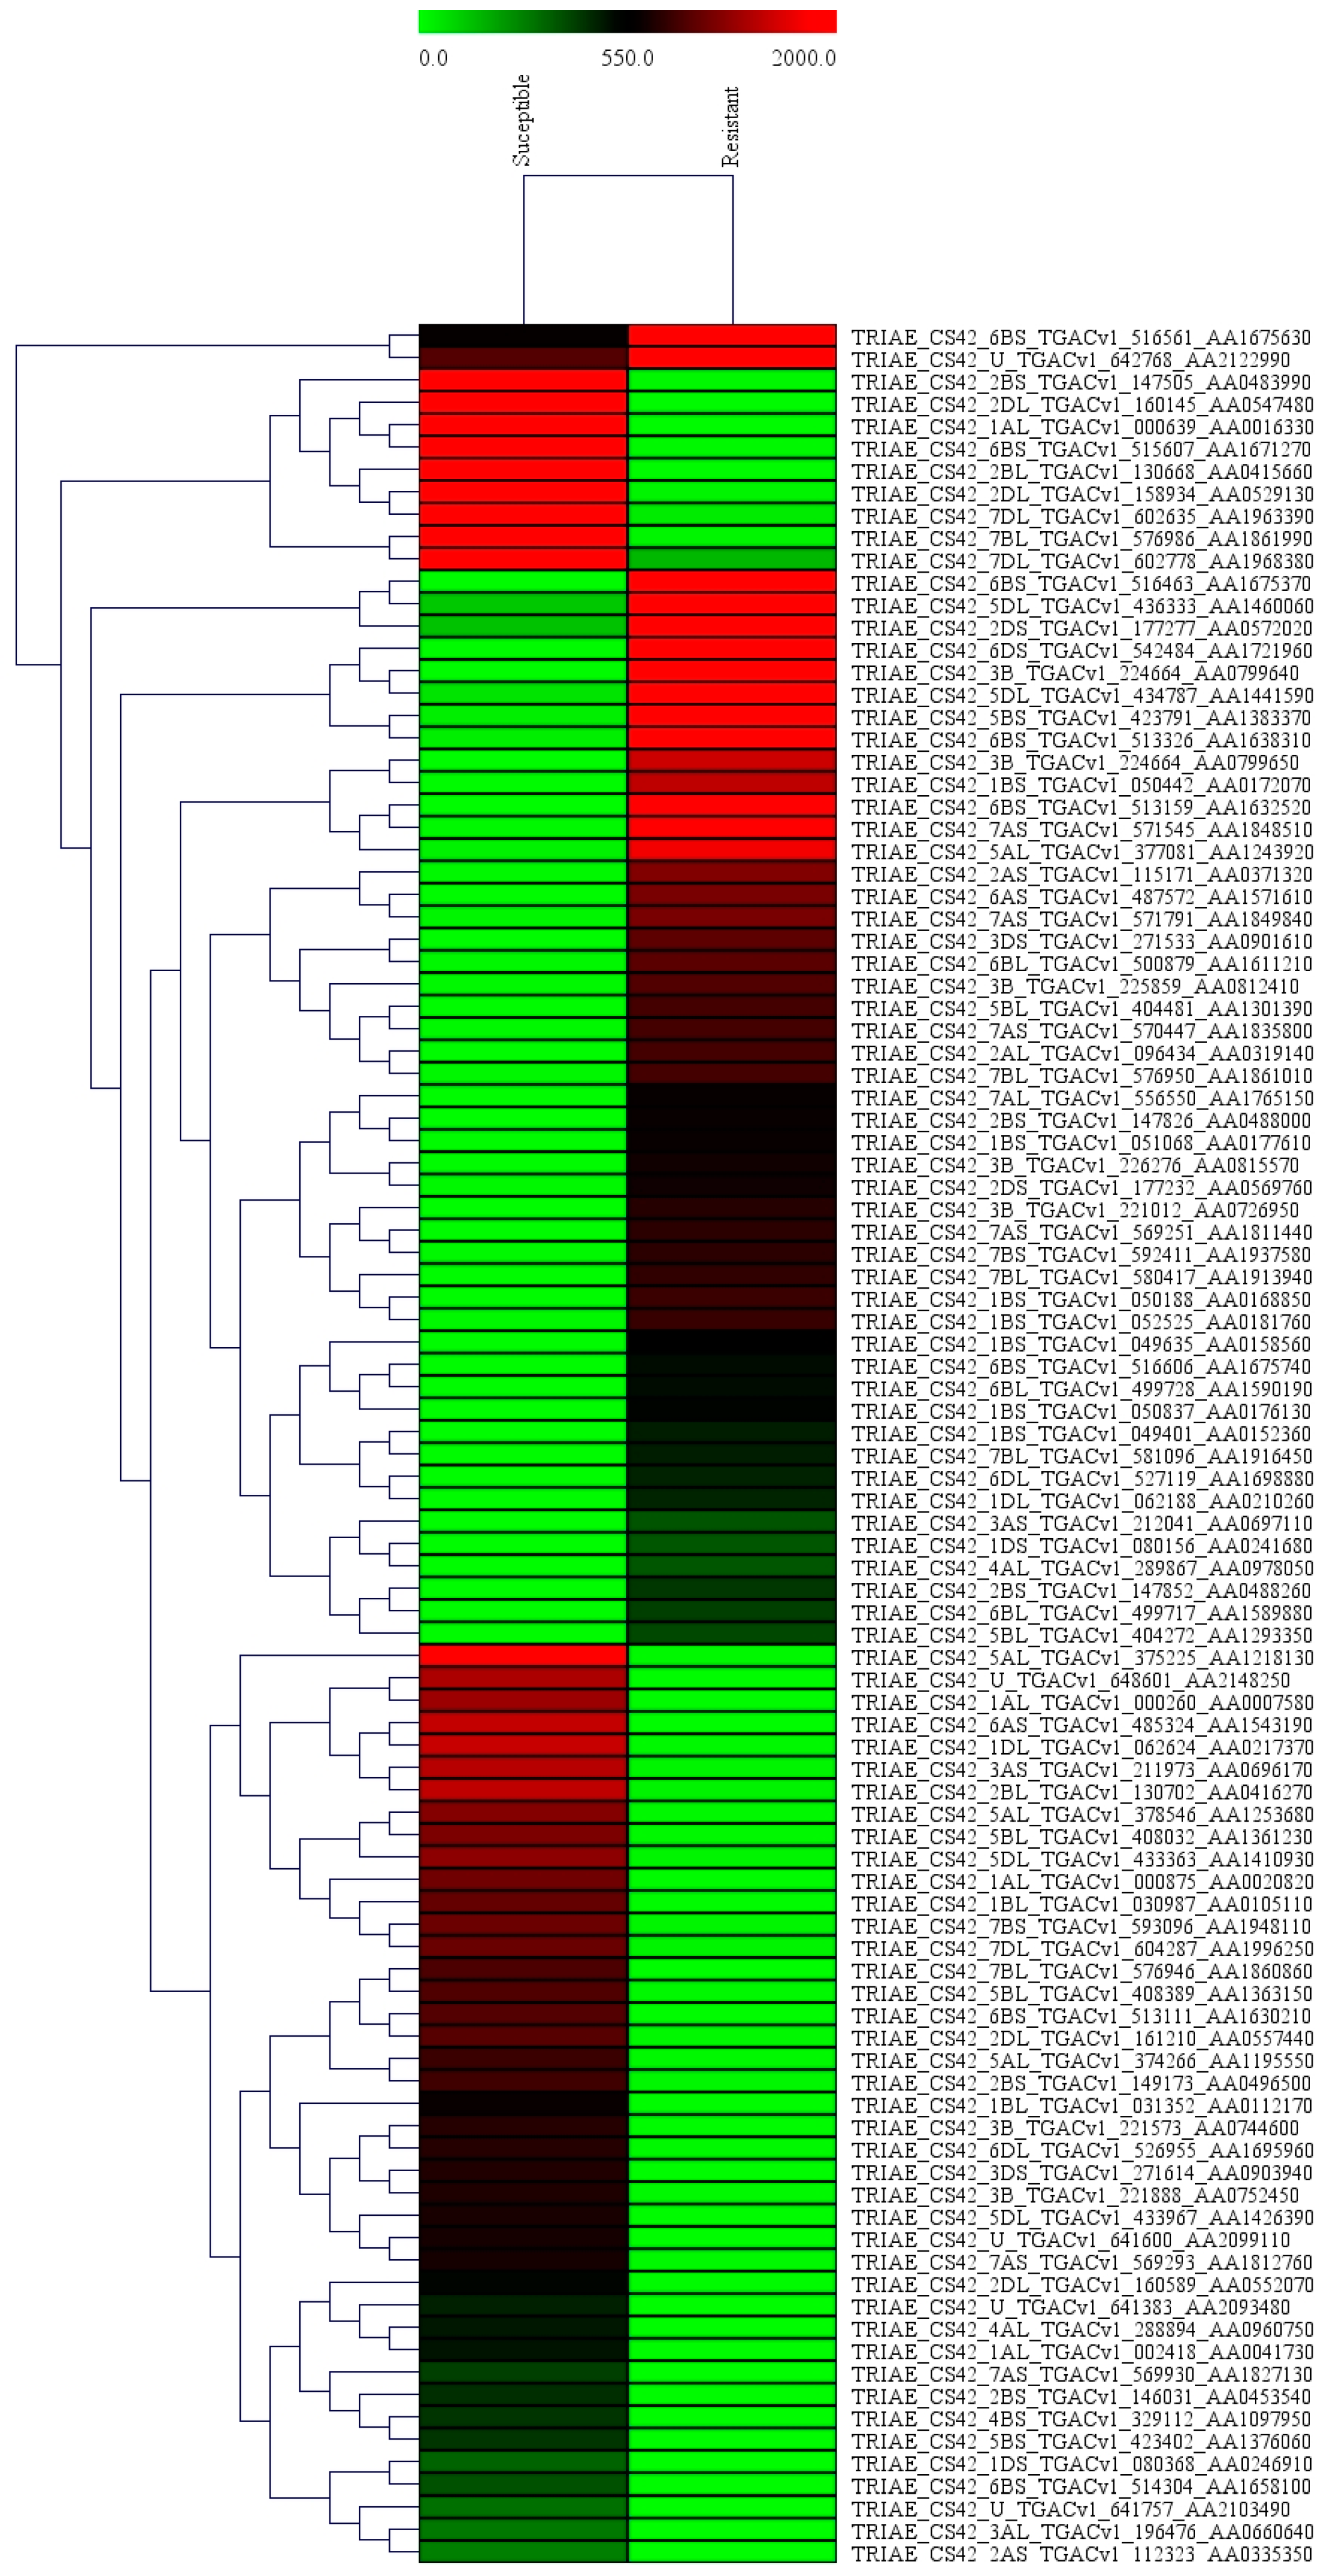
2.2. Differential Gene Expression Patterns

The differentially expressed genes were recognized through the libraries constructed from T. indica-infected susceptible (WH542) and resistant (HD29) wheat transcripts. In total, 76,088 genes were found to be expressed in both the susceptible and resistant genotypes. In comparison of T. indica-infected resistant and susceptible genotypes, 3184 (around 4.2%) genes were found to be upregulated, while 1778 (around 2.4%) genes were found to be downregulated. On the other hand, 5604 and 4113 genes were found to be exclusively expressed, respectively, in resistant (HD29) and susceptible (WH542) genotypes, while 66,371 were found to be commonly expressed (Figure 1). Further study based on the FDR showed that 503 genes were significantly upregulated and 387 significantly downregulated at a cut-off of 10% FDR (Table S1). In the volcano plots illustration, a red block showed the significantly upregulated genes, whereas a green block represented the significantly downregulated genes. A gray block represented the non-differentially expressed genes (Figure 2). Relatively high expression values for upregulated DEGs (indicated in red colour) compared to low expression values for downregulated DEGs (indicated in green colour) were obtained (Figure 3).

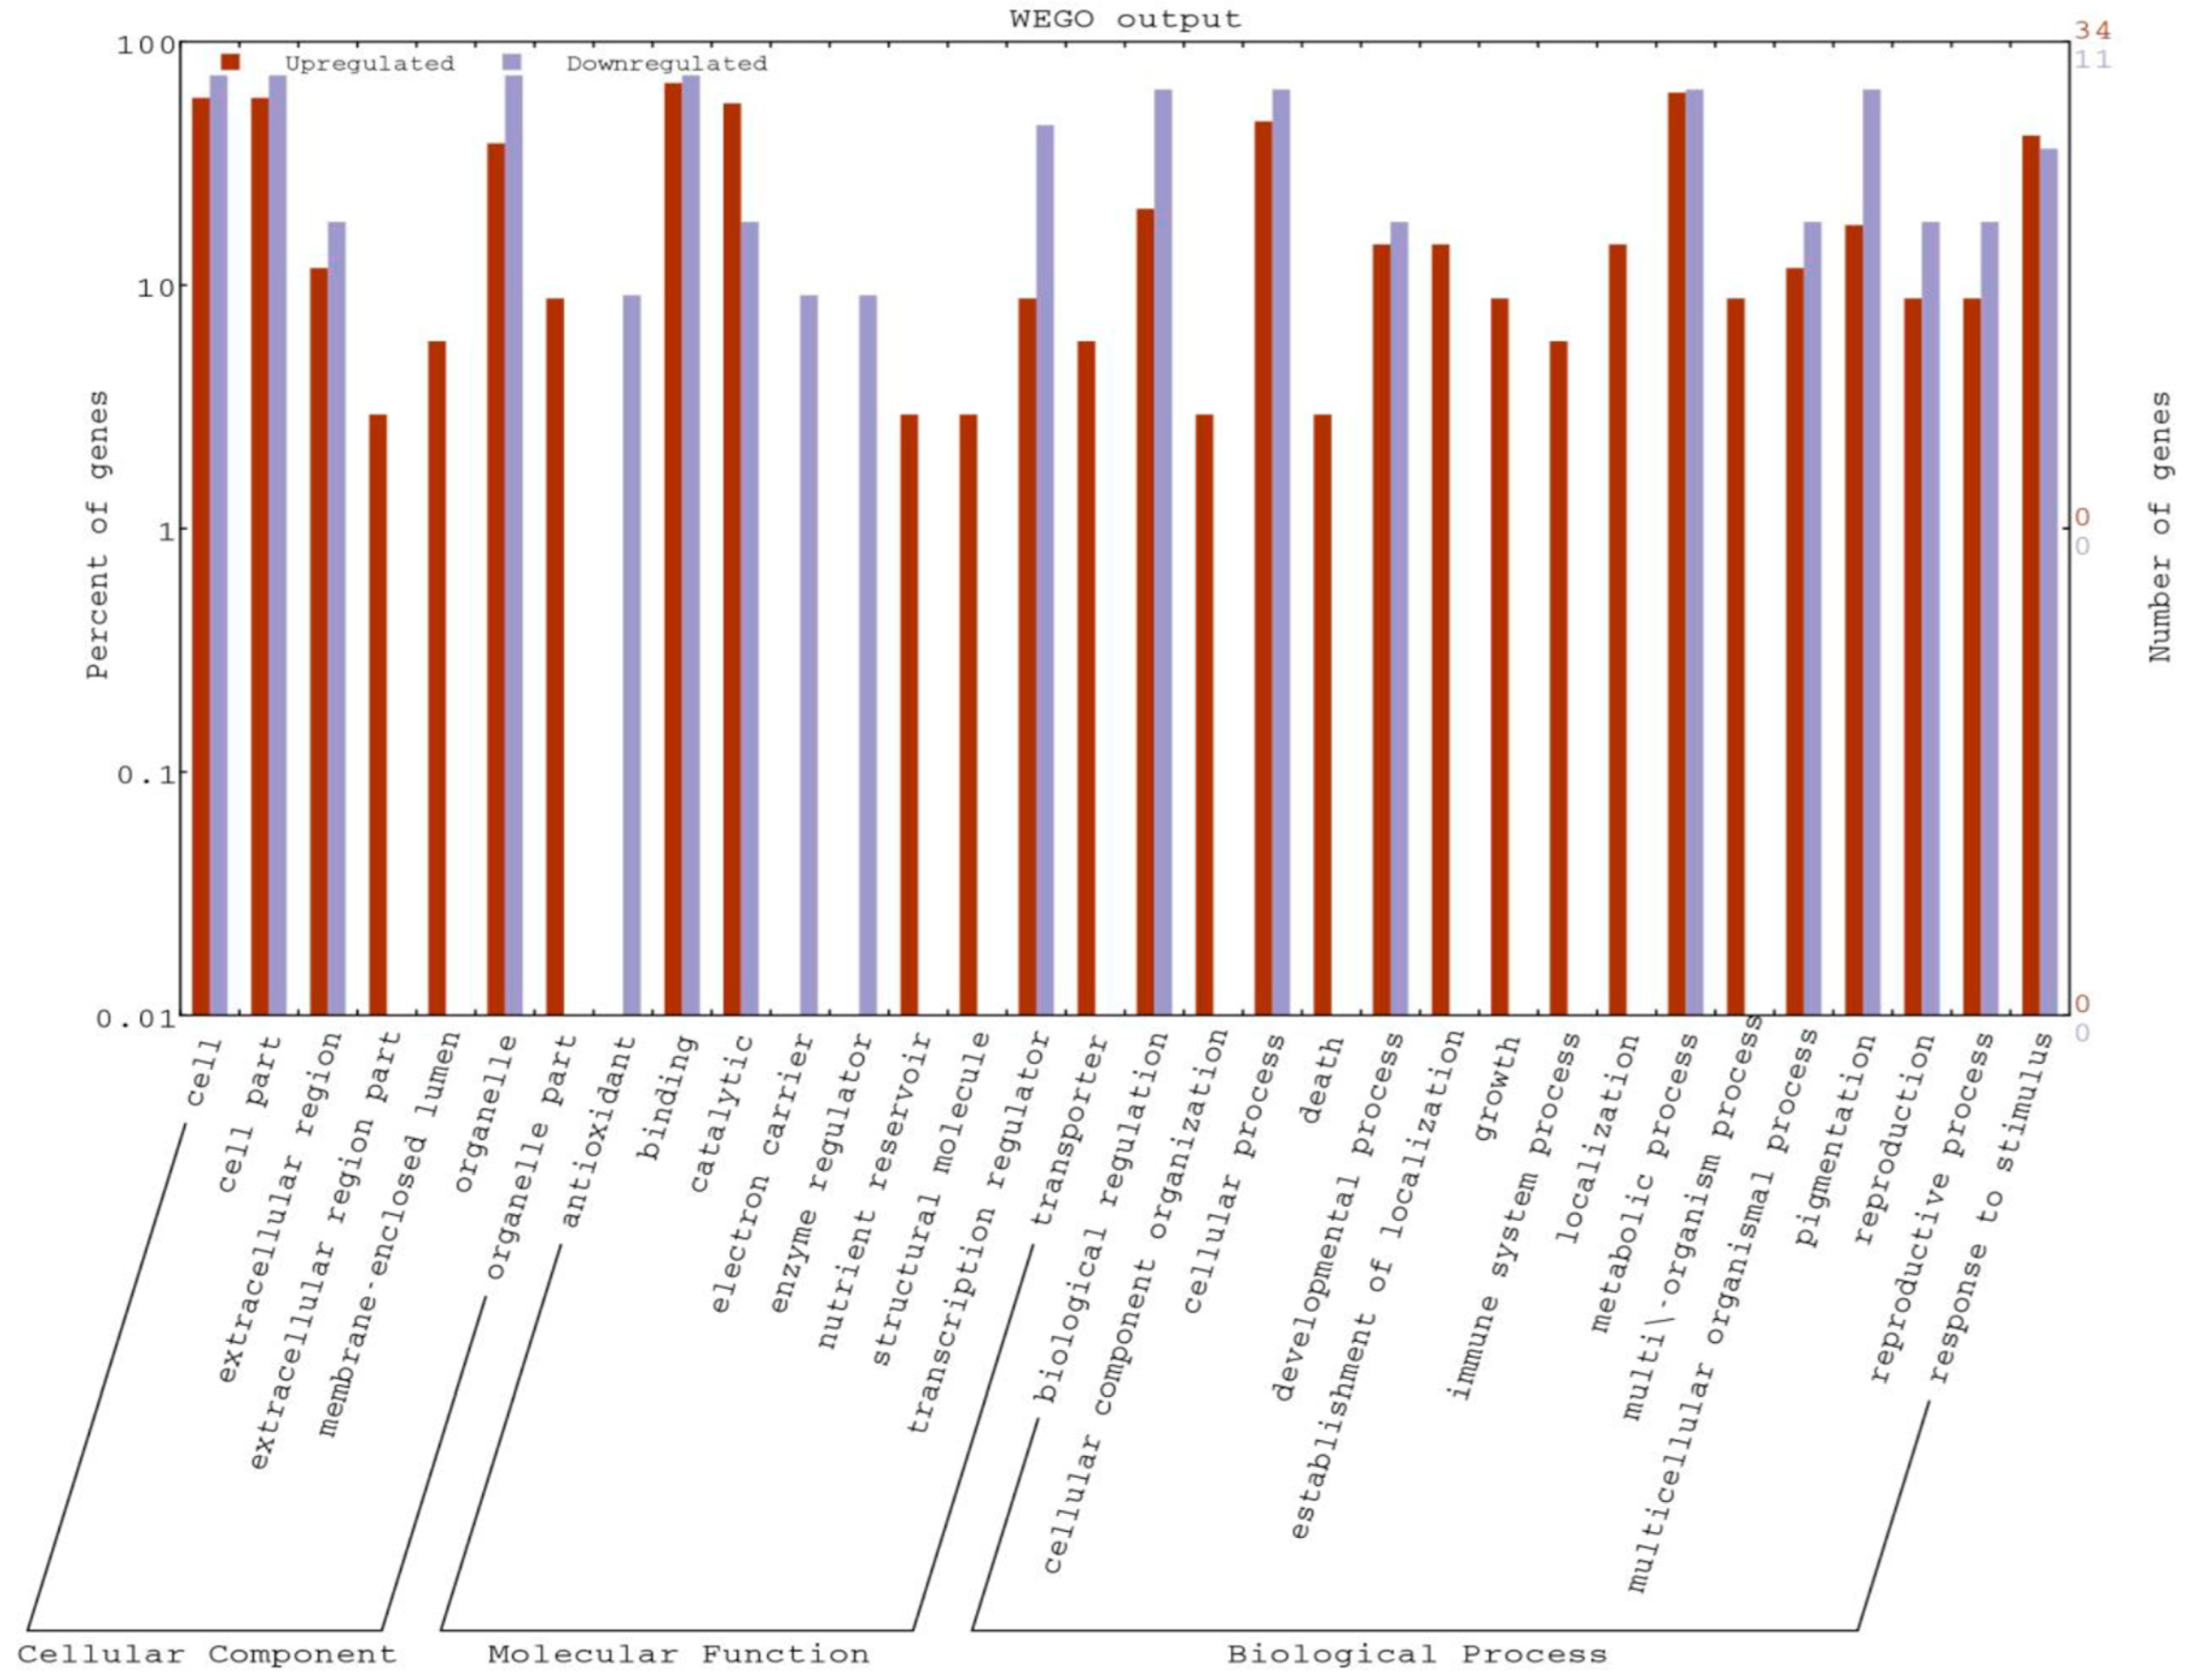
2.3. Gene Ontology Enrichment Study of DEGs and Pathways Analysis

The gene ontology analysis was carried out to evaluate the potential DEG functions. The GO analysis revealed the GO term representations in both the genotypes. In the cellular component category, most of the DEGs were associated with cell, cell part, extracellular parts, and organelle. Meanwhile, in the molecular function categories, the high numbers of DEGs were associated in binding and catalytic activity as well as transcription regulators. In the third category, i.e., biological process, DEGs related to metabolic process, cellular processes, biological regulation, and response to stimulus were localized. Overall, the GO analysis indicated that most of the DEGs were involved in the biological regulation, and metabolism. Most of the coding sequences (CDS) were associated with response to stimuli (abiotic and chemical), response to stress, carbohydrate metabolism, developmental process, and catalytic activity (Table 2, Figure 4).
In total, 392 GO terms were significantly expressed in both genotypes (Table S2). Importantly, two significant GO terms, involved in responses to stimulus (GO: 0050896) and stress (GO: 0006950), were obtained for genes expressed only in resistant genotype (Table S3), while four significant GO terms involved in biological regulation (GO: 0065007), regulation of biological process (GO: 0050789), cellular biosynthetic process (GO: 0044249), and biosynthetic process (GO: 0009058) were obtained for genes expressed only in susceptible genotypes (Table S4). Out of total GO terms, 15 GO were significantly upregulated, while 40 GO were significantly downregulated. In addition, KEGG pathway mapping was also carried out, and the results showed that 208 pathways were identified under 22 functional categories (Table S5). The defense-related genes altered after the infection of the wheat with T. indica. One hundred eighteen defense-related genes were identified in the global transcriptome analysis. The expression of the gene encoding proteins was responsible for the pathogen recognition, defense response to fungus, response to biotic stimulus, metal ion binding, and defense reinforcement. The pathogenesis-related genes viz. chitinase, peroxidase, and glucanase genes altered during T. indica infection (Table S6).

2.4. Mapping and DEGs in T. indica Transcripts

High-quality reads were mapped with T. indica RAKB_UP_1 reference genome sequence for in silico proof of wheat infection by T. indica; 7.07% reads of resistant genotype, while 7.63% reads of susceptible genotype were mapped. (Table 3). In total, 7704 commonly expressed genes of T. indica were obtained, which includes 221 significantly upregulated and 146 significantly downregulated genes (Table 4, Table S7). One thousand two hundred sixty-seven and 326 genes of T. indica were exclusively expressed in the susceptible and resistant genotypes, respectively. Based on FDR value, 11 genes were significantly upregulated viz. the oxidation–reduction process, translation, and metabolic process, and nine genes were significantly downregulated viz. response to stress, intracellular transport, and single organism biosynthetic pathway (Table 4).

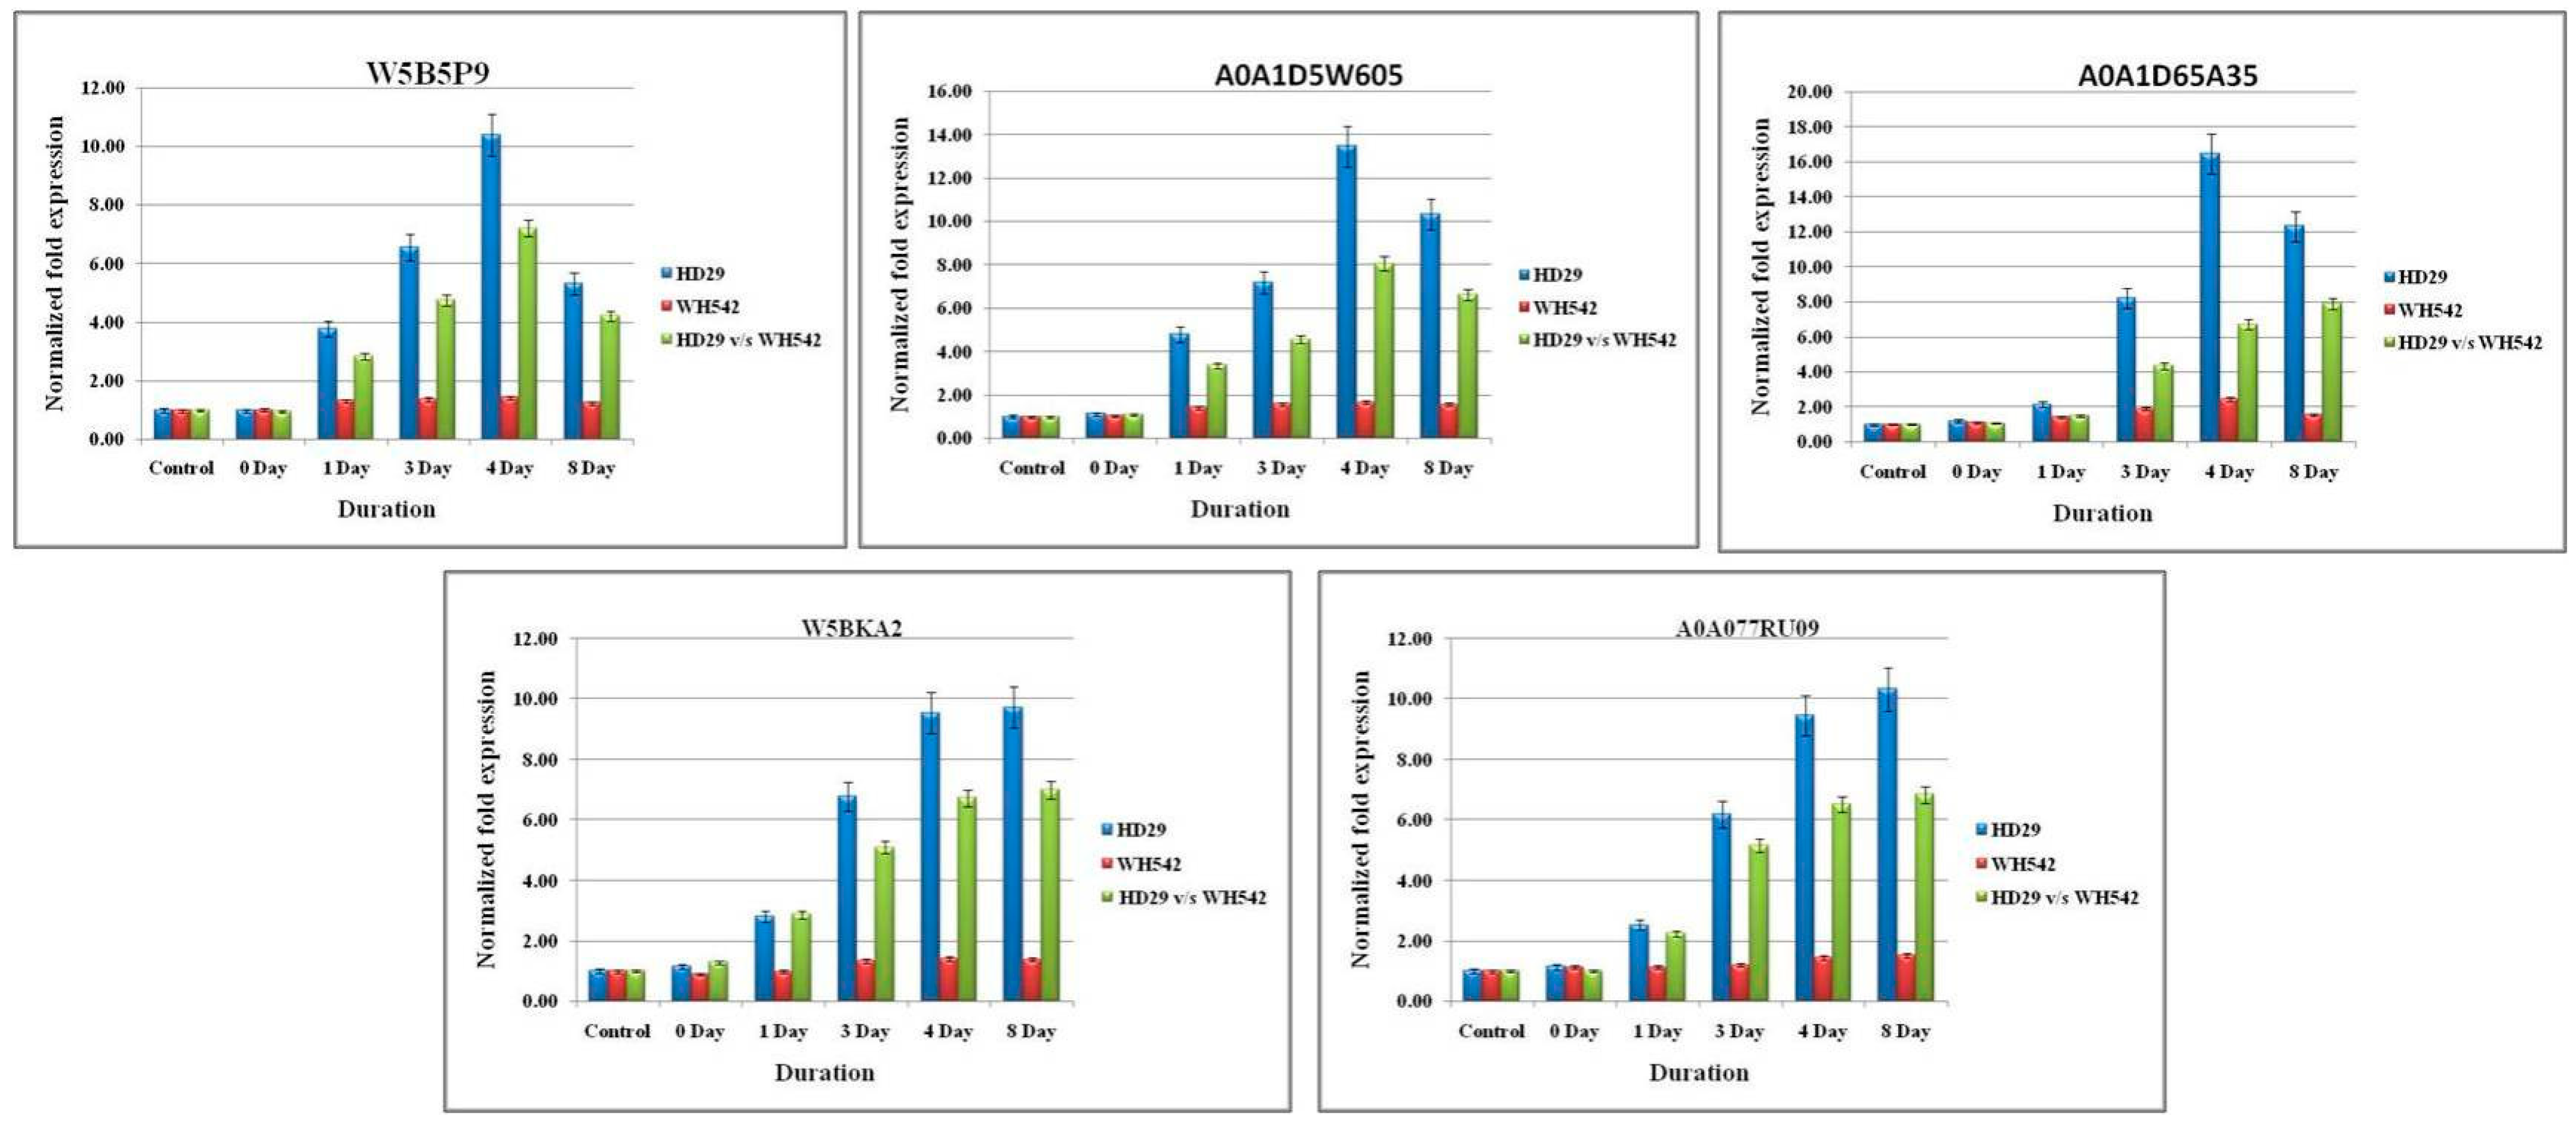
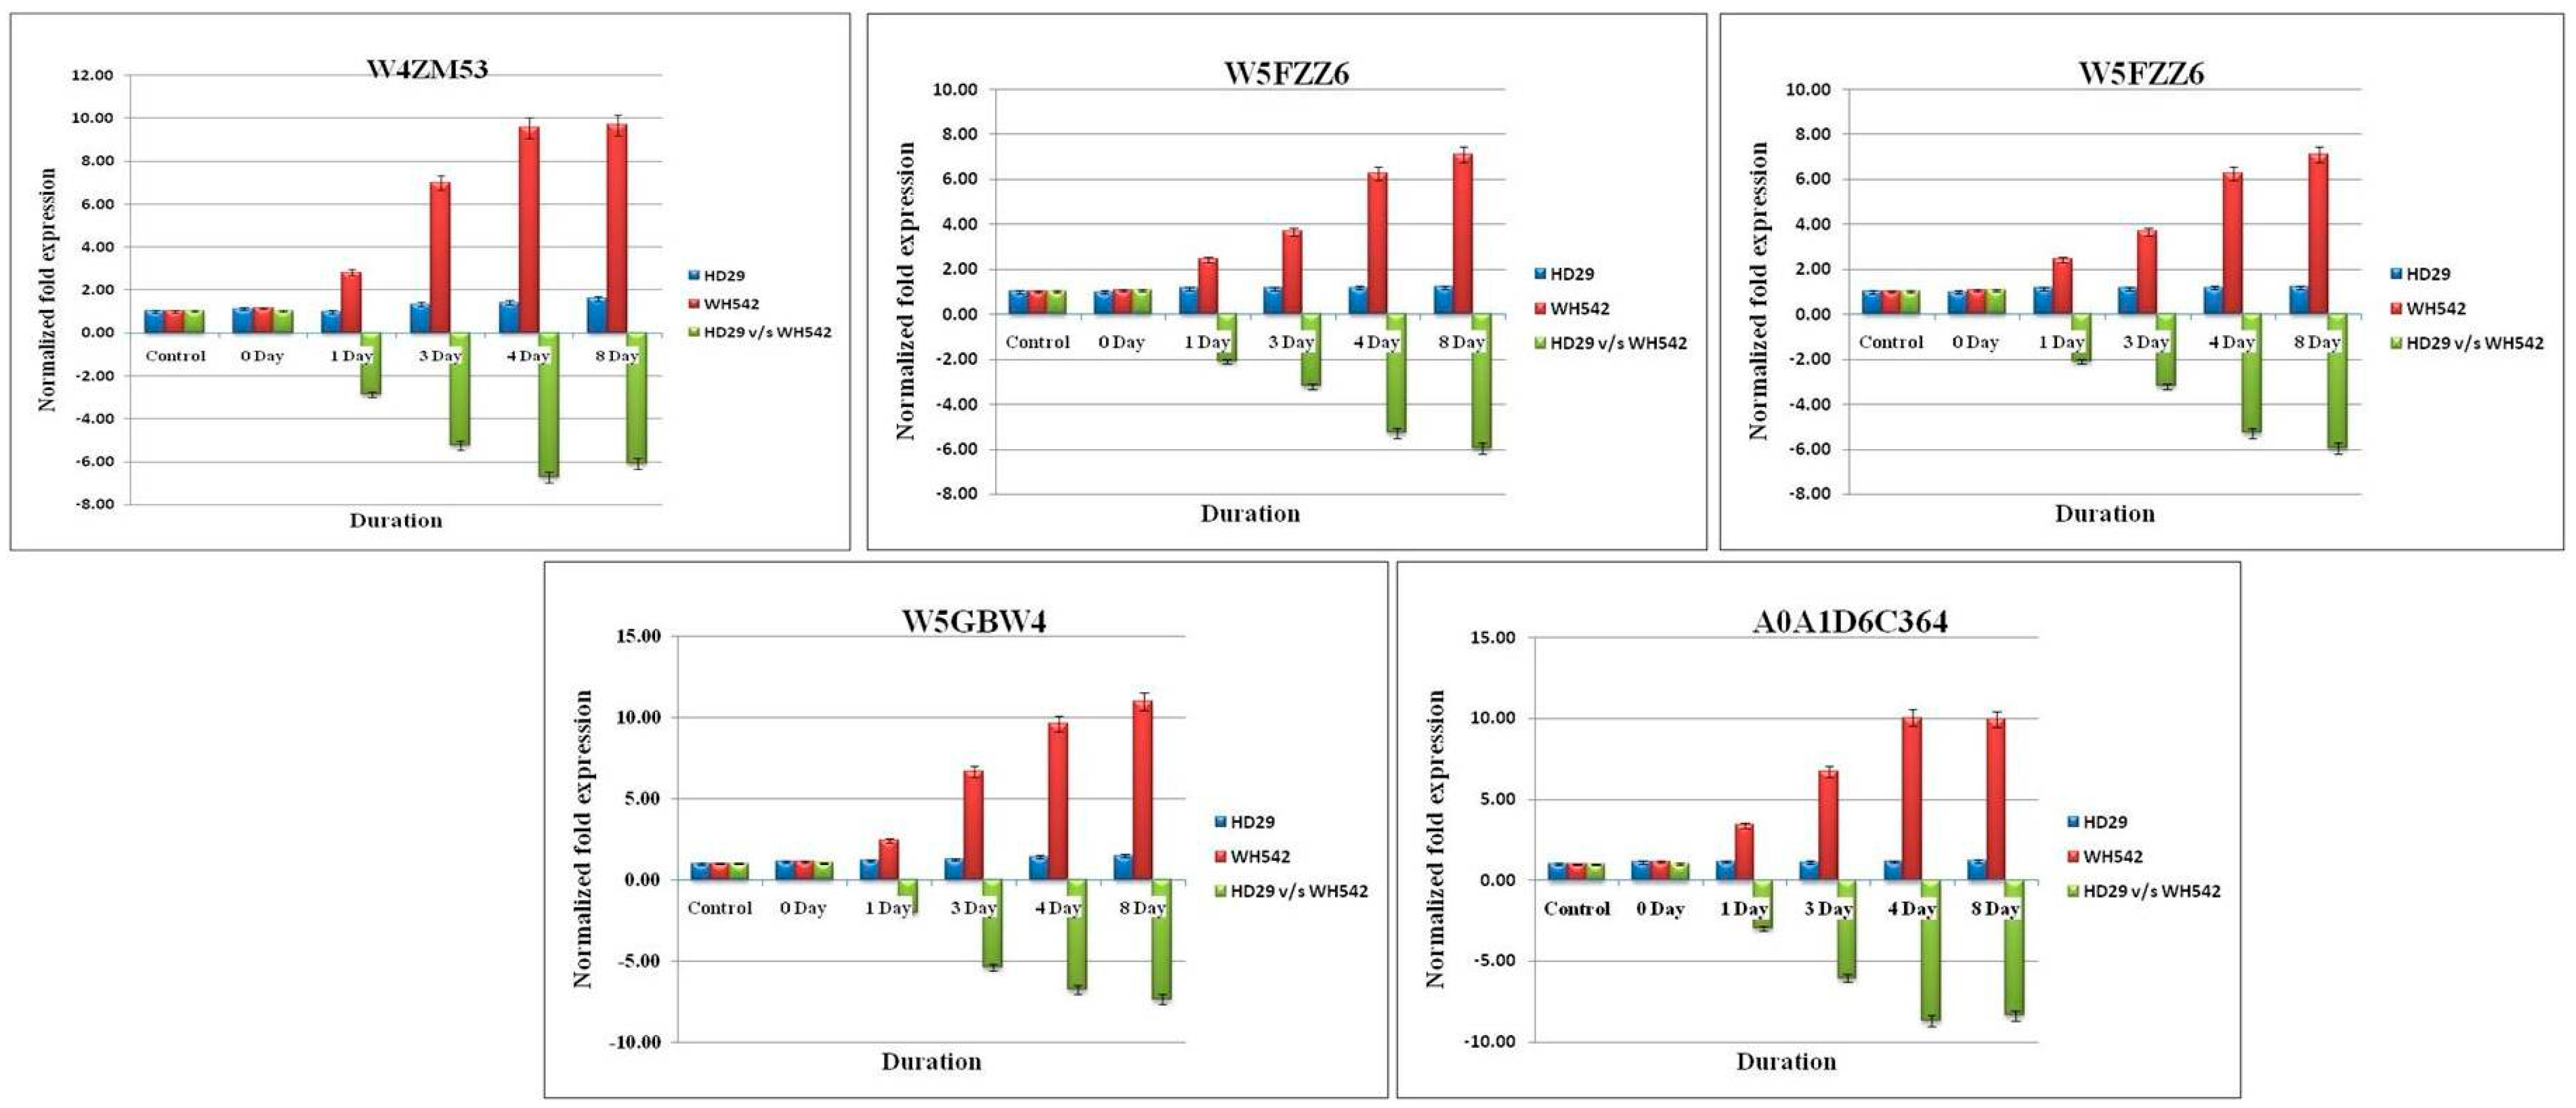
2.5. Validation of Differentially Expressed Genes (DEGs) Using qPCR Analysis

A total of 10 transcripts were subjected for differential gene expression (DEGs) between the resistant (HD29) and susceptible (WH542) genotypes. Ten randomly taken DEGs (five upregulated and downregulated DEGs; Table 5) were validated using the gene-specific primers through qPCR. The expression level of these DEGs was similar to the level of expression in RNA-Seq analysis at different time points (0, 1, 3, 4, and 8 days, respectively) (Figure 5 and Figure 6).
Although a significant and similar pattern of expression was found for all the selected genes wherein the expression level was different in terms of fold changes. The expression level of five-selected upregulated genes (W5B5P9, A0A1D5W605, A0A1D65A35, W5BKA2, and A0A077RU09) were found in the range of 6.8- to 8.06-fold higher in the resistant genotype (HD29) with respect to the same time point of susceptible genotype (WH542). The highest upregulation was found in the transcript profile of A0A077RU09 and A0A1D65A35 resistant genotype with 8.06- and 7.9-fold increases, respectively, as compared to susceptible genotype as control. The pattern of upregulation was found to be similar for all selected genes wherein the highest-level expression was observed on the 4th to 8th days. Within the T. indica-inoculated wheat genotype (HD29), the highest upregulation was also observed for A0A1D65A35 and A0A077RU09 transcripts with 16.46- and 13.46-fold increase, respectively, against the control (un-inoculated HD29 genotype), while no significant upregulation was observed in the WH542 samples. On the other hand, five selected downregulated genes likewise patterns were in an opposite manner of upregulated genes. In downregulated genes viz. W4ZM53, W5A6W5, W5FZZ6, W5GBW4, and A0A1D6C364, the highest downregulation was observed in the transcripts of A0A1D6C364 and W5GBW4 in the resistant genotype) with −8.87- and −7.36-fold, respectively.

3. Discussion

Karnal bunt of wheat is the most serious disease incited by T. indica. The genome sequencing of T. indica revealed a molecular basis of a unique mode of infection as well as survival and the dormancy of teliospores. However, when it comes to studying the plant-pathogen interaction, in-depth transcriptomic analysis is crucial to revealing the molecular mechanisms that control disease progress [24]. Plant–pathogen interaction is a very complex process that triggers many molecular responses at different levels of infection, mainly in bunt pathogens infecting wheat. Until now, no information on wheat-T. indica interaction transcript levels has been available upon infection. Therefore, it is essential to understand transcripts in the host–pathogen interaction stress [25]. The transcriptome analysis investigated wheat crops with other bunt pathogen infection against T. laevis [26] and T. controversa [27]. Keeping this in view, the transcriptome analysis of wheat–T. indica interaction in resistant and susceptible genotypes was conducted to understand the resistance mechanism
The establishment of pathogen infection in the host plant is a prerequisite for any transcriptomic study investigating the plant–pathogen interaction. In the present study, T. indica was inoculated at the boot leaf stage of the wheat plant, which resulted in spikes with severe Karnal bunt symptoms after 3 days of inoculation. The spikes were found to be ideal for the transcriptomic analysis of wheat-T. indica interaction after 3 days of inoculation. Hence, two time points (0 and 1 day) before and two time points (4 and 8 days) after were taken into account for detailed investigation. In one of the previous few studies on the infection mechanism of T. indica, it was established through histo-pathological and radiotracer techniques that the pathogen favors the boot stage for infection [28]. It could also successfully establish the Karnal bunt infection after 3 days of inoculation at the boot leaf stage of wheat plants [29].
Upon the fungal plant infection, plants trigger different defense-related genes to overcome the disease severity in different crops [27]. Few defense-related genes against T. indica, such as Puroindoline protein PINB, β-1,4-glucanase, and chitinase were highly expressed in resistant host as compared to susceptible host [30]. The genes encoding chitinase, lipase, and defensins were expressed in wheat crops upon T. controversa infection [31]. Defense genes play an important role in overcoming the severity of disease. In our study, 118 defense-related genes were identified, which encode the pathogen recognition, defense response to fungus, response to biotic stimulus, and metal ion binding. Additionally, responses to stimulus (uncharacterized protein in wheat) belonging to cell surface receptor signaling pathway and stress genes (peroxidase and uncharacterized protein) were significantly expressed in resistant genotypes only. These transcriptional changes may have a role in the resistance against T. indica inciting Karnal bunt of wheat.
In the present study, the DEGs could be classified into three functional categories viz., the biological processes, molecular functions, and cellular components. In the biological process, the majority of the DEGs were related to stimulus response, defense response to fungus, catabolic process, and response to wounding. In the molecular functions, most of the DEGs were related to metal ion binding, transferase activity, DNA binding, ATPase activity, heme binding, and sequence-specific DNA binding. Further, in the cellular component category, most of the DEGs were related to the integral component of the membrane, extracellular region, carbohydrate metabolic process, and nucleus. Similar findings were obtained on the RNA-seq analysis of tomato-Verticillium dahliae interaction, where the DEGs of response to stimuli were highly associated with biological processes [32,33]. However, unlike in this study, the DEGs for metabolic and cellular processes were also highly associated with the biological processes instead of the cellular components. This indicates the different array of expression exhibited by similar gene types upon T. indica infection in resistant as well as susceptible genotypes of wheat, respectively. This was evident in the present study as only a few genes, such as like integral component of membrane, exonuclease activity, nucleic acid binding, DNA binding, metal ion binding, ATP binding, methionine adenosyl transferase activity, and transferase activity differed in their expression under both resistant and susceptible genotypes.
In the functional annotations, DEGs were mainly involved in the important biological functions, such as signal transduction, secondary metabolite biosynthesis, and responses to stimulus. It is a well-established fact that signal transduction during plant-pathogen interactions largely depends on the biosynthesis of various secondary metabolites. These findings suggest that the biosynthesis of secondary metabolites upon T. indica infection at the boot stage of wheat induces signal transduction pathways leading to either expression or repression of the pathogenesis-related (PR) protein genes. Fungal growth, development, infection, and virulence are dependent on signaling cascades [34]. The biosynthesis of secondary metabolites upon Verticillium dahliae infection induced the signal transduction pathways leading to the expression of PR protein genes in the resistant tomato genotypes and repression in the susceptible genotypes [35]. Few pathogenicity-related genes, such as chitinase and MAP kinase Hog1, were characterized in T. indica [36,37].
In our present investigation, the KEGG analysis identified 208 pathways involved in 22 functional groups, mainly plant hormonal signal transduction, plant–pathogen interaction, phenyl-propanoid biosynthesis, and translation during plant-pathogen interaction. The maximum number of DEGs were categorized into amino acid metabolism, biosynthesis of secondary metabolites, and carbohydrate metabolism. Amino acids played crucial roles in plants, such as stress defense, development, and acting as hormone precursors [38,39]. During the plant–pathogen interaction, the phenyl-propanoid pathway has been reported to play a critical role in plant defense against pathogenic fungi [40]. Certain genes exclusively involved in a phenyl-propanoid pathway have also been reported to induce a compatible interaction of lettuce and Botrytis cineraria [41].

4. Materials and Methods

4.1. Fungus Material and Inoculum Preparation

Wheat Karnal pathogen T. indica isolate RAKB_UP_1 (NCBI Genbank accession-KX369242) was used for the present study. The isolate was cultured on potato dextrose agar (PDA) media manufactured by HiMedia Laboratories Pvt. Ltd., India and incubated at 16 ± 2 °C under 12 h of light/dark conditions in the incubator. The inoculum of secondary sporidia at a concentration of 1 × 10⁴ sporidia mL−1 was prepared after three weeks with the help of the hemocytometer under microscope.

4.2. Plant Growth Conditions and Inoculation

Healthy seeds of wheat genotypes viz. HD29 (resistant) and WH542 (susceptible) were taken from Division of Genetics, ICAR-IARI, New Delhi, India. Plants were grown under the net house conditions during the rabi season (November–April) and raised up to the boot leaf stage (Z-49 stage). Inoculation of T. indica was done by injecting sporidia (ca. 1 × 10⁴ sporidia mL−1) using a sterile syringe in the boot of wheat spikes [42,43]. After inoculation, infected boot stage samples were collected at different time points after inoculation, viz. 0 days, 1 day, 3 days, 4 days, and 8 days, and stored at −80 °C for further study.

4.3. RNA Extraction and Library Construction

Transcriptome analysis of two wheat genotypes viz. HD29 (resistant) and WH542 (susceptible) inoculated with T. indica at boot stage was performed. RNA sequencing (RNA-seq) of RNA isolated from infected wheat spikes was used. Total RNA was isolated from all the infected samples using the TRizol method with minor modifications. The quality of the isolated RNA was checked on a high-sensitivity RNA D1000 Screen Tape, and the quantifications were done using a Qubit 3.0 fluorometer, Thermo Fisher, US. RNA samples from each group (resistant and susceptible at different time points) were pooled in an equimolar concentration for library preparation. The RNA-Seq paired-end sequencing libraries were prepared from the total RNA using Illumina TruSeq stranded mRNA sample preparation kit, Illumina Inc, US. Briefly, mRNA was enriched from the total RNA using poly-T attached magnetic beads, followed by the enzymatic fragmentation and 1st strand cDNA conversion. The 1st strand cDNA was then synthesized to the second strand using the second strand mix and Act-D mix to facilitate RNA-dependent synthesis. The ds-cDNA samples were then purified using Ampure XP beads followed by A-tailing, adapter ligation, and then enriched by the limited number of PCR cycles.

4.4. Illumina Sequencing and Reads Mapping

The sequenced raw data was processed to obtain the high-quality clean reads through the Trimmomatic v0.35 (http://www.usadellab.org/cms/?page=trimmomatic, accessed on 1 June 2021) to eliminate adapter sequences, ambiguous reads, and low-quality sequences [44]. A minimum length of 100 nucleotides (nt) after trimming was applied. High-quality reads obtained from both the resistant and susceptible genotypes were applied for mapping with a reference genome of Triticum aestivum (Taxon ID: 4565) using BWA mem, version: 0.7.12-r1039 (https://github.com/lh3/bwa, accessed on 1 June 2021) with default parameters.

4.5. Analysis of Differentially Expressed Genes (DEGs)

The differential gene expression analysis was performed using the samtools (v 0.1.18) and bedtools (v 2.17.0) (http://www.htslib.org/, accessed on 1 June 2021) to count the number of reads mapped on individual genes. The gene name and coordinate information were obtained from the Ensembl GFF (gene feature file) file of T. aestivum. A gene was defined as expressed if more than five reads were mapped. The genes having less than an arbitrary threshold of five mapped reads were filtered out.
A Benjamin-Hochberg correction for multiple testing was performed using DESeq to identify the significantly expressed genes. These genes were further divided based on their statistical significance (which can be either “yes” or “no”), depending on whether the p-value is less than 0.05 and the false discovery rate (FDR) is 0.05. The FDR corrected significant gene expression analysis was carried out considering the Log2 fold values (Log2 fold value > 0 for upregulation and Log2 fold value < 0 for downregulation) and significance “yes” for p-value less than 0.05.
The hierarchical cluster analysis was conducted on the top 100 DEGs through a multiple experiments viewer, MeV v4.9.0 (https://mev.tm4.org/#/about, accessed on 1 June 2021). A heat map was generated using the log-transformed and normalized values of genes based on the Euclidean distance as well as the average linkage method. The expression levels were represented as log2 ratios of gene abundance between the resistant and susceptible genotypes. The Eurofins proprietary R script was used for the graphical representation of DEGs, distributed among the resistant and susceptible genotypes in a volcano plot.

4.6. Functional Annotation and Gene Ontology Enrichment Analysis

The functional annotations of genes were carried out against the curated KEGG GENES database using the KAAS, KEGG Automatic Annotation Server (https://www.genome.jp/kegg/kaas/, accessed on 1 June 2021) [45]. The KEGG Orthology (KO) was assigned to each gene to associate with its KEGG metabolic pathway. The KEGG orthology database of Arabidopsis thaliana was taken as a reference for the pathway mapping using the bidirectional best hit (BBH) method.
A further study, the gene ontology (GO) enrichment analysis, was done using the singular enrichment analysis (SEA) of agriGO (http://bioinfo.cau.edu.cn/agriGO; accessed on 1 June 2017)) to target three main domains, namely cellular component, molecular function, and biological process. The GO term enrichment of target genes was computed by comparing them with T. aestivum reference genes using the SEA analysis. The hypergeometric tests with the Hochberg FDRs were performed using the default parameters to adjust the p-value < 0.05 for obtaining the significant GO terms.

4.7. Differential Expression Analysis in T. indica upon Infection

The high-quality reads of both the resistant and susceptible genotypes were mapped against T. indica genome RAKB_UP_1 (MBSW01000000) using the BWA mem (Version: 0.7.12-r1039) aligner. The differential gene expression analysis of T. indica genes was carried out using samtools v 0.1.18 (http://www.htslib.org/, accessed on 1 June 2021) between the susceptible and resistant genotypes to count the number of reads mapped on individual genes. A gene was defined as expressed if more than five reads were mapped. Those genes that had less than an arbitrary threshold of five mapped reads were filtered out.

4.8. Validation of Differentially Expressed Genes by Quantitative Real-Time PCR

The expression profile of ten randomly selected DEGs at different time points was analyzed using a two-step real-time qPCR. The primers were designed using the Integrated DNA Technologies (IDT) primer designing tool. The designed primers were synthesized from GCC Biotech Pvt., West Bengal, India (Table 5). Total RNA and cDNA synthesis were performed as described in a previous study [46]. The qPCR was carried out in a real-time PCR system (BioRad). The qPCR conditions were standardized to identify the ideal Tm of primers for each selected gene in a gradient thermal cycler. The SYBR green was used as a detection dye. The SYBR Green PCR Master Mix (Thermo Fisher, US) was used. The reaction was set up in a final volume of 20 μL. The standard thermal profile was used: pre-incubation (95 °C for 15 min), denaturation (95 °C for 15 s), annealing, and extension (60 °C for 1 min with 40 cycles of amplification). The RPS17 gene was used as a reference for normalization. The gene expression was normalized by subtracting the mean CT values for a reference gene RPS17 from ΔCT values of DEGs. The fold change values were calculated (ΔΔCT represent = ΔCT condition of target gene—ΔCT control gene) according to the 2−ΔΔCT method [47].

5. Conclusions

Transcriptome analysis suggested that most of the DEGs involved in the responses to stimuli and metabolic processes were expressed upon T. indica infection. In the molecular functions, DEGs were the binding and catalytic activity. The KEGG pathway analyses revealed the DEGs involved in the signal transduction, carbohydrate metabolism, and energy metabolisms affected during early infection of the disease. The present results may help in finding new markers to develop resistant varieties. It also provides interesting information on gene expression patterns in wheat, upon T. indica infection, revealing the molecular signaling mechanisms and complex regulatory processes. The functional characterization of the DEGs identified will further help researchers to understand the resistance and infection mechanism of T. indica. This is the first report on global transcriptome analysis of wheat-T. indica interaction, which will further provide insights in host-pathogen interaction.

Supplementary Materials

The following supporting information can be downloaded at: https://www.mdpi.com/article/10.3390/plants11223061/s1, Table S1: Gene expression analysis with annotation in the resistant (HD29) and the susceptible (WH542) genotypes; Table S2: Significantly expressed GO terms in both the genotypes; Table S3: Significantly expressed GO terms in the resistant genotype (HD29); Table S4: Significantly expressed GO terms in the susceptible genotype (WH542); Table S5: Identified KEGG pathways and functional categories; Table S6: Differentially expressed defense-related genes; Table S7: Gene expression analysis with annotation with T. indica in the resistant and susceptible genotypes.

Author Contributions

Conceptualization, M.S.G.; methodology, M.S.G.; S.J. and T.P.J.K.; validation, S.J. and M.S.G.; writing—original draft preparation, M.S.G. and S.J.; writing—review and editing, S.J., M.S.G., L.K., M.S.S. and R.A.; supervision, M.S.G. and R.A. All authors have read and agreed to the published version of the manuscript.

Funding

This work was financially supported by the Indian Council of Agricultural Research-ICAR-Consortium Research Platform on Genomics (ICAR-G/CRP-Genomics/2015-2720/IARI-12-151) to carry out the present research work.

Institutional Review Board Statement

Not applicable.

Informed Consent Statement

Not applicable.

Data Availability Statement

The data presented in this study are available on the NCBI SRA database (SRP159223).

Acknowledgments

The authors are also highly thankful to Director and Joint Director (Research), ICAR-IARI, New Delhi and Head, Division of Plant Pathology, IARI, New Delhi for providing valuable guidance and facilities during course of investigation.

Conflicts of Interest

The authors declare no conflict of interest.

References

  1. Anonymous. Annual Report, 2020–2021, Department of Agriculture, Cooperation & Farmers’ Welfare Ministry of Agriculture & Farmers’ Welfare Government of India Krishi Bhawan, New Delhi-110 001; Department of Agriculture, Cooperation & Farmers’ Welfare: Quezon City, Philippines, 2020–2021; p. 6. Available online: www.agricoop.nic.in (accessed on 1 April 2021).
  2. Mitra, M. A new bunt of wheat in India. Ann. Appl. Biol. 1931, 18, 178–179. [Google Scholar] [CrossRef]
  3. Bonde, M.R.; Berner, D.K.; Nester, S.E.; Peterson, G.L.; Olsen, M.W.; Cunfer, B.M.; Sim, T. Survival of T. indica teliospores in different soils. Plant Dis. 2004, 88, 316–324. [Google Scholar] [CrossRef] [PubMed] [Green Version]
  4. Warham, E.J. Studies on Karnal Bunt of Wheat. Ph.D. Thesis, University of Wales, Aberystwyth, UK, 1987. [Google Scholar]
  5. Tan, M.K.; Brennan, J.P.; Wright, D.; Murray, G.M. A review of the methodology to detect and identify Karnal bunt—A serious biosecurity threat. Australas. Plant Pathol. 2013, 42, 95–102. [Google Scholar] [CrossRef]
  6. Bishnoi, S.K.; He, X.; Phuke, R.M.; Kashyap, P.L.; Alakonya, A.; Chhokar, V.; Singh, R.P.; Singh, P.K. Karnal bunt: A re-emerging old foe of wheat. Front. Plant Sci. 2020, 11, 569057. [Google Scholar] [CrossRef] [PubMed]
  7. Gurjar, M.S.; Jogawat, A.; Kulshreshtha, D.; Sharma, S.; Gogoi, R.; Aggarwal, R. Intraspecific variation in T. indica isolates a pathogen causing Karnal bunt of Wheat. Indian Phytopathol. 2016, 69, 352–356. [Google Scholar]
  8. Bains, S.S.; Dhaliwal, H.S. Release of secondary sporidia of Neovossia indica from inoculated wheat spikes. Plant Soil 1989, 115, 83–87. [Google Scholar] [CrossRef]
  9. Carris, L.M.; Castlebury, L.A.; Goates, B.J. Nonsystemic bunt fungi- Tilletia indica and T. horrida: A review of history, systematics, and biology. Annu. Rev. Phytopathol. 2006, 44, 113–133. [Google Scholar] [CrossRef] [Green Version]
  10. Dhaliwal, H.S.; Singh, D.V. Up-to-date life cycle of Neovossia indica (Mitra) Mundkur. Curr. Sci. 1988, 57, 675–677. [Google Scholar]
  11. Mitra, M. Studies on the stinking smut or bunt of wheat in India. Ind. J. Agric. Sci. 1937, 7, 459–477. [Google Scholar]
  12. Aujla, S.S.; Grewal, A.S.; Gill, K.S.; Sharma, I. Effect of Karnal bunt on chappati making properties of wheat grains. Crop Improv. 1980, 7, 147–149. [Google Scholar]
  13. Dhaliwal, H.S. Multiplication of secondary sporidia of Tilletia indica on soil and wheat leaves and spikes and incidence of Karnal bunt. Can. J. Bot. 1989, 67, 2387–2390. [Google Scholar] [CrossRef]
  14. Babadoost, M.; Mathre, D.E.; Johnston, R.H.; Bonde, M.R. Survival of teliospores of Tilletia indica in soil. Plant Dis. 2004, 88, 56–62. [Google Scholar] [CrossRef] [Green Version]
  15. Goates, B.J. Survival of secondary sporidia of floret infecting Tilletia species: Implications for epidemiology. Phytopathology 2010, 100, 655–662. [Google Scholar] [CrossRef] [PubMed] [Green Version]
  16. Aggarwal, R.; Tripathi, A.; Yadav, A. Pathogenic and genetic variability in T. indica monosporidial culture lines using universal rice primer-PCR. Eur. J. Plant Pathol. 2010, 128, 333–342. [Google Scholar] [CrossRef]
  17. Thirumalaisamy, P.P.; Singh, D.V. Variability of Indian isolates of T. indica assessed by pathogenicity and molecular markers. J. Phytopathol. 2012, 160, 525–531. [Google Scholar] [CrossRef]
  18. Gurjar, M.S.; Aggarwal, R.; Jain, S.; Sharma, S.; Singh, J.; Gupta, S.; Agarwal, S.; Saharan, M.S. Multilocus sequence typing and single nucleotide polymorphism analysis in Tilletia indica isolates inciting Karnal bunt of wheat. J. Fungi 2021, 7, 103. [Google Scholar] [CrossRef]
  19. Sharma, P.; Tiwari, R.; Saharan, M.S.; Sharma, I.; Kumar, J.; Mishra, S.; Muthusamy, S.K. Draft genome sequence of two monosporidial lines of the Karnal bunt fungus Tilletia indica Mitra (PSWKBGH-1 and PSWKBGH-2). Genome Announc. 2016, 4, e00928-16. [Google Scholar] [CrossRef] [Green Version]
  20. Kumar, A.; Pandey, V.; Singh, M.; Pandey, D.; Saharan, M.S.; Marla, S.S. Draft genome sequence of Karnal bunt pathogen (Tilletia indica) of wheat provides insights into the pathogenic mechanisms of quarantined fungus. PLoS ONE 2017, 12, e0171323. [Google Scholar] [CrossRef] [Green Version]
  21. Gurjar, M.S.; Aggarwal, R.; Jogawat, A.; Kulshreshtha, D.; Sharma, S.; Solanke, A.U.; Dubey, H.; Jain, R.K. Genome sequencing and secretome analysis of T. indica inciting Karnal bunt of wheat provides pathogenesis-related genes. 3 Biotech 2019, 9, 219. [Google Scholar] [CrossRef]
  22. Chittem, K.; Yajima, W.R.; Goswami, R.S.; del Río Mendoza, L.E. Transcriptome analysis of the plant pathogen Sclerotinia sclerotiorum interaction with resistant and susceptible canola (Brassica napus) lines. PLoS ONE 2020, 15, e0229844. [Google Scholar] [CrossRef] [Green Version]
  23. Singh, J.; Aggarwal, R.; Gurjar, M.S.; Sharma, S.; Jain, S.; Saharan, M.S. Identification and expression analysis of pathogenicity-related genes in Tilletia indica inciting Karnal bunt of wheat. Australas. Plant Pathol. 2020, 49, 393–402. [Google Scholar] [CrossRef]
  24. Dobon, A.; Bunting, D.C.E.; Cabrera-Quio, L.E.; Uauy, C.; Saunders, D.G.O. The host-pathogen interaction between wheat and yellow rust induces temporally coordinated waves of gene expression. BMC Genom. 2016, 17, 380. [Google Scholar] [CrossRef] [PubMed] [Green Version]
  25. Desmond, O.J.; Manners, J.M.; Schenk, P.M.; Maclean, D.J.; Kazan, K. Gene expression analysis of the wheat response to infection by Fusarium pseudograminearum. Physiol. Mol. Plant Pathol. 2008, 73, 40–47. [Google Scholar] [CrossRef]
  26. He, T.; Ren, Z.; Muhae-Ud-Din, G.; Guo, Q.; Liu, T.; Chen, W.; Gao, L. Transcriptomics Analysis of Wheat Tassel Response to Tilletia laevis Kühn, Which Causes Common Bunt of Wheat. Front. Plant Sci. 2022, 13, 823907. [Google Scholar] [CrossRef] [PubMed]
  27. Ren, Z.; Liu, J.; Din, G.M.U.; Zhang, H.; Du, Z.; Chen, W.; Liu, T.; Zhang, J.; Zhao, S.; Gao, L. Transcriptome analysis of wheat spikes in response to Tilletia controversa Kühn which cause wheat dwarf bunt. Sci. Rep. 2020, 10, 21567. [Google Scholar] [CrossRef] [PubMed]
  28. Munjal, R.L.; Chatrath, M.S. Studies on the mode of infection of Neovossia indica incitant of Karnal bunt of wheat. J. Nucl. Agric. Biol. 1976, 5, 40–41. [Google Scholar]
  29. Aggarwal, R.; Singh, D.V.; Srivastava, K.D. Host-pathogen interaction in Karnal bunt of wheat. Indian Phytopathol. 1994, 47, 381–385. [Google Scholar]
  30. Tripathi, A.; Aggarwal, R.; Yadav, A. Differential expression analysis of defense related genes responsive to T. indica infection in wheat. Turk. J. Biol. 2013, 37, 606–613. [Google Scholar] [CrossRef]
  31. Muhae-Ud-Din, G.; Chen, D.; Liu, T.; Chen, W.; Gao, L. Characterization of the wheat cultivars against Tilletia controversa Kühn, causal agent of wheat dwarf bunt. Sci. Rep. 2020, 10, 9029. [Google Scholar] [CrossRef]
  32. Tan, G.; Liu, K.; Kang, J.; Xu, K.; Zhang, Y.; Hu, L.; Zhang, J.; Li, C. Transcriptome analysis of the compatible interaction of tomato with Verticillium dahliae using RNA-sequencing. Front. Plant Sci. 2015, 6, 428. [Google Scholar] [CrossRef] [Green Version]
  33. Zhang, Y.; Wang, X.F.; Ding, Z.G.; Ma, Q.; Zhang, G.R.; Zhang, S.L.; Li, Z.K.; Wu, L.Q.; Ma, Z.Y. Transcriptome profiling of Gossypium barbadense inoculated with Verticillium dahliae provides a resource for cotton improvement. BMC Genom. 2013, 14, 637. [Google Scholar] [CrossRef] [PubMed] [Green Version]
  34. Lengeler, K.B.; Davidson, R.C.; D’souza, C.; Harashima, T.; Shen, W.C.; Wang, P.; Pan, X.; Waugh, M.; Heitman, J. Signal transduction cascades regulating fungal development and virulence. Microbiol. Mol. Biol. Rev. 2000, 64, 74685. [Google Scholar] [CrossRef] [Green Version]
  35. Yadeta, K.A.; Thomma, B.P.J. The xylem as battleground for plant hosts and vascular wilt pathogens. Front. Plant Sci. 2013, 4, 97. [Google Scholar] [CrossRef] [Green Version]
  36. Gurjar, M.S.; Jogawat, A.; Saharan, M.S.; Aggarwal, R. Response of putative pathogenicity-related genes in T. indica inciting Karnal Bunt of wheat. Cereal Res. Commun. 2018, 46, 89–103. [Google Scholar] [CrossRef] [Green Version]
  37. Gurjar, M.S.; Jogawat, A.; Sharma, S.; Aggarwal, R. Functional expression of MAP kinase TiHOG1 gene in T. indica inciting Karnal bunt of wheat. Indian Phytopathol. 2018, 71, 325–335. [Google Scholar] [CrossRef]
  38. Maeda, H.; Dudareva, N. The shikimate pathway and aromatic amino acid biosynthesis in plants. Annu. Rev. Plant Biol. 2012, 63, 73–105. [Google Scholar] [CrossRef]
  39. Trovato, M.; Funck, D.; Forlani, G.; Okumoto, S.; Amir, R. Editorial: Amino acids in plants: Regulation and functions in development and stress defense. Front. Plant Sci. 2021, 12, 772810. [Google Scholar] [CrossRef]
  40. Gayoso, C.; Pomar, F.; Novo Uzal, E.; Merino, F.; de Ilárduya, O.M. The Ve-mediated resistance response of the tomato to Verticillium dahliae involves H2O2, peroxidase and lignins and drives PAL gene expression. BMC Plant Biol. 2010, 10, 232–250. [Google Scholar] [CrossRef] [Green Version]
  41. De Cremer, K.; Mathys, J.; Vos, C.; Froenicke, L.; Michelmore, R.W.; Cammue, B.P.A.; De Coninck, B. RNAseq-based transcriptome analysis of Lactuca sativa infected by the fungal necrotroph Botrytis cinerea. Plant Cell Environ. 2013, 36, 1992–2007. [Google Scholar]
  42. Zadoks, J.C.; Chang, T.T.; Konzak, C.F. A decimal code for the growth stages of cereals. Weed Res. 1974, 14, 415–421. [Google Scholar] [CrossRef]
  43. Aujla, S.S.; Grewal, A.S.; Gill, K.S.; Sharma, I. Artificial creation of Karnal bunt disease of wheat. Cereal Res. Commun. 1982, 10, 171–175. [Google Scholar]
  44. Bolger, A.M.; Lohse, M.; Usadel, B. Trimmomatic: A flexible trimmer for Illumina sequence data. Bioinformatics 2014, 30, 2114–2120. [Google Scholar] [CrossRef] [PubMed] [Green Version]
  45. Moriya, Y.; Itoh, M.; Okuda, S.; Yoshizawa, A.; Kanehisa, M. KAAS: An automatic genome annotation and pathway reconstruction server. Nucleic Acids Res. 2007, 35, W182–W185. [Google Scholar] [CrossRef] [PubMed] [Green Version]
  46. Kharbikar, L.L.; Majumdar, B.A. Low-cost disruption of rhizospheric microorganisms for the extraction of total RNA using modified RNeasy mini kit protocols. Ann. Microbiol. 2015, 65, 1797–1801. [Google Scholar] [CrossRef]
  47. Schmittgen, T.D.; Livak, K.J. Analyzing real-time PCR data by the comparative CT method. Nat. Protoc. 2008, 3, 1101–1108. [Google Scholar] [CrossRef]
Figure 1. Differentially expressed genes (DEGs) between susceptible (WH542) and resistant (HD29) genotypes of wheat.
Plants 11 03061 g001
Figure 2. A volcano plot showing the distribution of DEGs among resistant and susceptible genotypes of wheat upon T. indica infection. DESeq analysis was performed to show the distribution of DEGs. Green spots correspond to genes with p-value < 0.05 and logFC > 2, while red spots correspond to genes with p-value < 0.05 and logFC <−2.
Plants 11 03061 g002
Figure 3. A Heat map of differentially expressed genes of T. indica. The color codes (red for upregulated genes and green for downregulated genes) are shown to indicate the relative expression of DEGs.
Plants 11 03061 g003
Figure 4. Representation of differentially expressed genes (DEGs) in a WEGO plot.
Plants 11 03061 g004
Figure 5. Real-time quantitative PCR (RT-qPCR) validation of RNA sequencing (RNA-Seq) data through randomly selected upregulated DEGs in the wheat infection. Relative fold change values were generated for RT-qPCR samples by comparing the expression of genes at each time point of infected resistant (HD29) vs. susceptible (WH542) wheat varieties. Data are presented as means ± standard error (SE) from three independent replicates.
Plants 11 03061 g005
Figure 6. Real-time quantitative PCR (RT-qPCR) validation of RNA sequencing (RNA-Seq) data through randomly selected downregulated DEGs in the wheat infection. Relative fold change values were generated for RT-qPCR samples by comparing the expression of genes at each time point of infected resistant (HD29) vs. susceptible (WH542) wheat varieties. Data are presented as means ± standard error (SE) from three independent replicates.
Plants 11 03061 g006
Table 1. Summary statistics of reads generated in RNA-Seq analysis of resistant and susceptible genotypes of wheat upon T. indica infection.
DescriptionResistant Genotype (HD29)Susceptible Genotype (WH542)
Total Reads29,321,161 (100%)29,062,661 (100%)
Number of bases8,611,180,1998,531,647,691
Total data in Gb8.6 Gb8.5 Gb
Mapped reads93.67%92.11%
Uniquely mapped reads92.94%90.47%
Multiple mapped reads0.72%1.63%
Unmapped reads6.32%7.88%
% GC content51.38%49.48%
Table 2. Gene ontology descriptions of significantly upregulated genes.
GO TermsOntologyDescriptionsTotal Input List
GO:0050896Presponse to stimulus13
GO:0006950Presponse to stress11
GO:0005975Pcarbohydrate metabolic process9
GO:0008152Pmetabolic process21
GO:0042221Presponse to chemical stimulus7
GO:0009628Presponse to abiotic stimulus5
GO:0044238Pprimary metabolic process17
GO:0032502Pdevelopmental process5
GO:0009056Pcatabolic process6
GO:0065007Pbiological regulation7
GO:0004553Fhydrolase activity, hydrolyzing O-glycosyl compounds7
GO:0016798Fhydrolase activity, acting on glycosyl bonds7
GO:0005488FBinding23
GO:0003824Fcatalytic activity19
GO:0016787Fhydrolase activity9
Table 3. Mapping statistics with T. indica genome.
ParticularsNumber of Mapped Reads % Mapping
Resistant genotype (HD29)4,146,2577.07
Susceptible genotype (WH542)4,434,2947.63
Table 4. DESeq analysis of T. indica up on infection.
DescriptionsNumber of Genes
Exclusive susceptible (HD29) genotype1271
Exclusive resistant (WH542) genotype326
Gene expressed both resistant and susceptible hst (HD29 & WH542)7704
Upregulated221
Downregulated146
FDR-Upregulated11
FDR-Downregulated09
Table 5. List of differentially expressed genes used for expression analysis.
Gene IDSLog2 Fold ChangeUniProtKB/TrEMBL IDGO TermsForward Primer (5′-3′)Reverse Primer (5′-3′)Protein NameFunctions
Five Up Regulated Genes in Wheat-T. indica Interaction
TRIAE_CS42_2AS_TGACv1_115171_AA03713206.590434W5B5P9Integral component of membraneGTGATGTGTCCATTGCATGTGAAACGCAGTCCATATAGCCAGUncharacterized protein-
TRIAE_CS42_3B_TGACv1_224664_AA07996409.915167A0A1D5W605-CGCAGCTTATCACGACAATGGCTAGTAAAAGGGACAGGGACUncharacterized protein-
TRIAE_CS42_6BS_TGACv1_513159_AA16325208.262696A0A1D65A353′-5′ exonuclease activity, nucleic acid bindingGAATCCACCTCTCACCATCCACGGAACAGACCAGCATAAGUncharacterized protein-
TRIAE_CS42_2BS_TGACv1_147826_AA04880006.692584W5BKA2integral component of membraneACGGCCTCAGAGCTTATGTGGGTTTGCACTTGACCACAACAUncharacterized protein-
TRIAE_CS42_3B_TGACv1_221012_AA07269506.968122A0A077RU09DNA binding, protein heterodimerization activityTCACCTCCTCGTAGAGTGCTAGGCAGGCACCGTTACTATTHistone H2BCore component of nucleosome. DNA repair, DNA replication and chromosomal stability.
Five Down Regulated Genes in Wheat-T. indica Interaction
TRIAE_CS42_1AL_TGACv1_000260_AA0007580−7.39315W4ZM53transferase activity, transferring acyl groups other than amino-acyl groupsGCGGCTTTCAATCTTTTCAGGTGCTCTGTTTGGTGATGGTGUncharacterized protein-
TRIAE_CS42_1BL_TGACv1_030856_AA0102410−5.23889W5A6W5serine-type, carboxypeptidase activityAACTTGCTGTTCCTGGACTCTCGCTAACTGTGGAATGTAGTGCarboxypeptidasecleave peptides from the C-terminus at a speed of one residue each time
TRIAE_CS42_5DL_TGACv1_435993_AA1457050−5.12949W5FZZ6coenzyme bindingTCTTCCACATTGCATCACCTGGTTTCGTCCCTAATCCTCACTGUncharacterized protein-
TRIAE_CS42_6BS_TGACv1_515607_AA1671270−7.7181W5GBW4metal ion binding, ATP binding, methionine, adenosyl transferase activityCACAATGACAATGGTGCTATGGATGGGTTGAGATGGAAGATGGS-adenosylmethionine synthase (EC 2.5.1.6)Catalyzes the formation of S-adenosylmethionine from methionine and ATP.
TRIAE_CS42_7BL_TGACv1_576986_AA1861990−9.32268A0A1D6C364-CTTGTCTTATTCCCTCACCCACACCTGACCCCTAATTGCTTGUncharacterized protein-
Publisher’s Note: MDPI stays neutral with regard to jurisdictional claims in published maps and institutional affiliations.

