Abstract
Methylated flavones, and tricin in particular, have been implicated in protecting wheat plants against a variety of biotic and abiotic stresses. Methylated flavones are produced via O-methylation of the hydroxyl groups in flavones, which is catalyzed by O-methyltransferases (OMTs). To examine the role of wheat OMT2 in methylated flavone biosynthesis and facilitate interrogation of tricin functions in wheat-environment interactions, loss-of-function mutants of OMT2 homoeologs, omt-A2 and omt-B2, were identified from a tetraploid wheat Targeting Induced Local Lesions in Genomes (TILLING) mutant population and crossed to generate the omt-A2 omt-B2 double mutant. Although tricin and most other soluble phenolics did not differ in leaves and glumes of TILLING control and the omt-A2, omt-B2, and omt-A2 omt-B2 mutants, chlorogenic acid was increased in glumes of omt-A2 omt-B2 relative to TILLING control, suggesting that it might serve as a substrate for OMT2. The omt2 mutant lines showed similar growth phenotypes as well as comparable lignin deposition in cell walls of stems compared to TILLING control. These results collectively suggest that OMT2 and its close homolog OMT1 may possess overlapping activities in tricin production, with OMT1 compensating for the missing OMT2 activities in the omt2 mutant lines.
1. Introduction
Flavones are a class of phenolic specialized metabolites that are produced to help plants endure a wide range of biotic and abiotic stresses [1]. Methylated flavones, and tricin (5,7,4′-trihydroxy-3′,5′-dimethoxyflavone) in particular, have been implicated in protecting against fungal growth [2,3,4], ultraviolet radiation [5], and cold-temperature stress [6]. Tricin has also been identified as a component of lignin in wheat [7], maize [8], and giant reed (Arundo donax) [9] and was suggested to serve as a nucleation site for lignin polymerization in monocots [10].
Several enzymatic steps are employed for the conversion of apigenin (5,7,4′-trihydroxyflavone) into tricin, according to studies in rice [11] (Figure 1). Apigenin is hydroxylated at the 3′ position to form luteolin (5,7,3′4′-tetrahydroxyflavone), which is then methylated by an O-methyltransferase (OMT) to produce chrysoeriol (5,7,4′-trihydroxy-3′-methoxyflavone). The hydroxylation of chrysoeriol at the 5′ position gives rise to selgin (5,7,4′,5′-tetrahydroxy-3′-methoxyflavone). The final step of tricin biosynthesis is its O-methylation by an OMT, performing the 5′-O-methylation of selgin to tricin [11] (Figure 1). The OMTs for tricin biosynthesis belong to the broader class of caffeic acid 3-O-methyltransferase (COMT) family of OMTs that transfer a methyl group from S-adenosyl-L-methionine (SAM) to hydroxyl groups of diverse substrate structures [12].
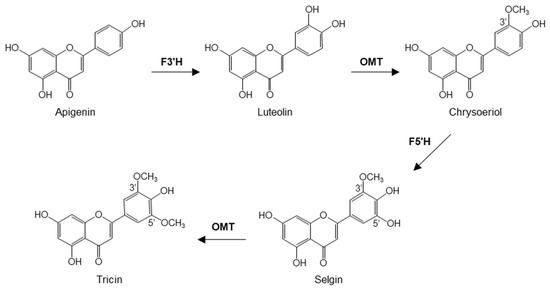
Figure 1.
Biosynthesis of tricin from apigenin. F3′H, flavonoid 3′-hydroxylase; OMT, O-methyltransferase; F5′H, flavonoid 5′-hydroxylase.
Wheat is one of the major staple crops. It supplies over 730 million metric tons of grain annually, but its production is challenged around the world by a variety of environmental stresses such as extreme temperatures, drought, and fungal diseases. In view of the defense functions demonstrated by tricin in other plant species, understanding the biosynthesis and role of tricin in wheat and its interactions with the environment can potentially improve wheat growth and yield. Both the 3′- and 5′-O-methylation reactions in tricin biosynthesis were proposed to be carried out by the enzyme OMT2 in wheat [13]. In in vitro reactions, wheat OMT2 catalyzed the stepwise 3′-, 5′-, then 4′-O-methylation of tricetin (5,7,3′,4′,5′-pentahydroxyflavone) to selgin, then tricin, and finally 3′,4′,5′-O-trimethyltricetin, respectively, utilizing SAM as a methyl donor [13,14]. OMT2 had the highest in vitro activity on tricetin and was highly active towards luteolin and 5-hydroxyferulic acid [13]. However, the function of wheat OMT2 has not been investigated in planta.
To understand the in planta activity of OMT2 and examine the role of tricin in wheat growth and environmental interactions, mutants of OMT2 homoeologs (omt-A2 and omt-B2) were identified from a tetraploid wheat Targeting Induced Local Lesions in Genomes (TILLING) mutant population. The omt-A2 omt-B2 double mutant was also generated through crossing omt-A2 and omt-B2 and genotyping the segregating progenies. The single and double mutants of omt-A2 and omt-B2, along with the control plants, were evaluated for growth and biochemical phenotypes.
2. Results
2.1. TILLING Mutants with Premature Stop Codons in OMT-A2 and OMT-B2 Were Isolated and the Double Mutant of omt-A2 omt-B2 Was Generated
To identify omt-A2 and omt-B2 mutants, the tetraploid wheat cv. Kronos TILLING mutant database [15] was searched using OMT-A2 and OMT-B2 sequences from hexaploid wheat cv. Chinese Spring as a query. A total of 73 high-confidence (minimum coverage of 5 or more reads) mutations were identified within the OMT-A2 open reading frame (ORF) that include 27 synonymous substitutions and 46 non-synonymous substitutions (data not shown). Of the non-synonymous substitutions, 44 are missense mutations, and 2 are nonsense mutations that result in premature stop codons in OMT-A2 (lines 3521 and 2348) (Figure 2a). Within the ORF of OMT-B2, 52 high-confidence mutations were identified that include 17 synonymous substitutions and 35 non-synonymous substitutions (data not shown). Of the non-synonymous substitutions, one caused a premature stop codon in OMT-B2 (line 388) (Figure 2a).
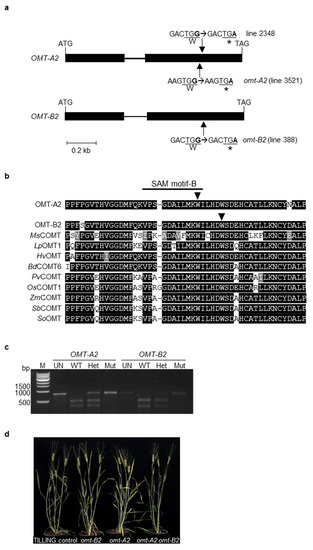
Figure 2.
Isolation and molecular characterization of TILLING mutants of wheat O-methyltransferase 2 (OMT2) homoeologs. (a) Intron-exon organization of OMT-A2 and OMT-B2. Boxes and lines signify exons and introns, respectively. Arrows indicate sites of premature stop-codon mutations. (b) Protein sequence alignment of selected plant OMTs. The arrows indicate the sites of stop codon mutations in OMT-A2 and OMT-B2. The GenBank accession numbers of the plant OMTs are: BdCOMT6, XP_003573470.1; HvOMT, ABQ58825.1; LpOMT1, AAD10253.1; MsCOMT, P28002.1; OsCOMT1, XP_015650053.1; PvCOMT, ADX98508.1; SbCOMT, ADW65743.1; SoOMT, O82054.1; ZmCOMT, Q06509.1. Bd, Brachypodium distachyon; Hv, Hordeum vulgare; Lp, Lolium perenne; Ms, Medicago sativa; Os, Oryza sativa; Pv, Panicum virgatum; Sb, Sorghum bicolor; So, Saccharum officinarum; Zm, Zea mays. (c) Cleaved amplified polymorphic sequence (CAPS) markers for OMT-A2 and OMT-B2. The PCR products were either undigested (UN) or incubated with the respective restriction enzyme and then separated on a 1% agarose gel. M, molecular marker; WT, wild-type plant; Het, heterozygous mutant plant; Mut, homozygous mutant plant; bp, base pair. (d) Three-month-old TILLING control and mutant plants.
The premature stop codons in OMT-A2 (mutant line 3521; designated omt-A2) and OMT-B2 (line 388; designated omt-B2) lead to truncated proteins that lack 98 and 93 amino acids from the C-terminal end, respectively (Figure 2a). These missing amino acids are located within a highly conserved region among plant OMTs and encompass one of the previously reported SAM binding motifs (Figure 2b) [16]. As such, the resultant truncated OMT2 proteins do not possess the amino acids critical for enzyme activity and likely lead to loss-of-function mutants.
To generate the omt-A2 omt-B2 double mutant with knockouts in both OMT-A2 and OMT-B2 activities, omt-A2 was backcrossed with the parental line Kronos to reduce the level of background mutations; the homozygous omt-A2 mutant (BC1F2) was then crossed with the homozygous omt-B2 mutant (M4). Homozygous wild type (OMT-A2 OMT-B2; designated TILLING control), single mutant (omt-A2, omt-B2), and double mutant (omt-A2 omt-B2) plants were identified from the segregating progenies using cleaved amplified polymorphic sequence (CAPS) markers (Figure 2c) and subjected to further analysis.
2.2. The omt2 Mutants Showed Similar Growth Phenotypes to TILLING Control
TILLING control and the omt2 mutant plants did not display obvious differences in their growth and development (Figure 2d). To further assess the growth parameters of these plants, the height, number of spikes, straw biomass, spike biomass, total biomass, and pseudo-harvest index of the mature omt-A2, omt-B2, and omt-A2 omt-B2 mutants and TILLING control plants were determined and compared (Figure 3). The height for all mutant lines tended to be slightly greater than that of TILLING control, with omt-A2 plants being significantly taller (p < 0.05) (Figure 3a). All of the omt2 mutants possessed a comparable number of spikes relative to TILLING control (Figure 3b), though the spike biomass of the omt-A2 and omt-B2 single mutants was lower than that of TILLING control and the omt-A2 omt-B2 double mutant (Figure 3c). The omt2 mutant lines also had a trend of lower straw biomass compared to TILLING control, with the straw of omt-A2 mutant lines being significantly lighter (p < 0.05) (Figure 3d). Additionally, the total biomass of omt-A2 and omt-B2 was lower than TILLING control and omt-A2 omt-B2 (Figure 3e). Furthermore, omt-A2 mutants displayed a significantly reduced (p < 0.05) pseudo-harvest index (mass of spike over total biomass) relative to TILLING control (Figure 3f).
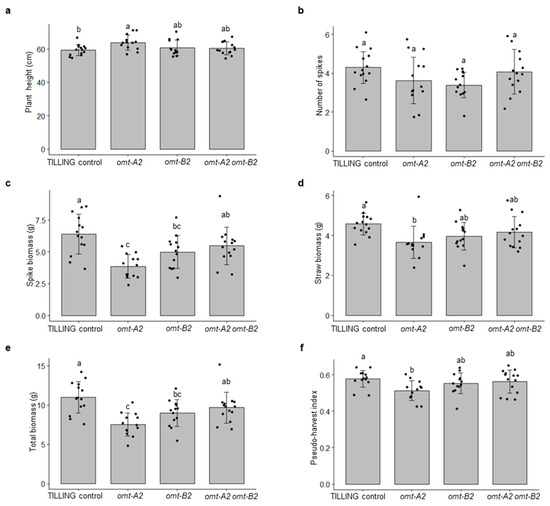
Figure 3.
Growth data of TILLING control and mutant plants of wheat O-methyltransferase 2 (OMT2) homoeologs. Means ± S.D. of TILING control (n = 14), omt-A2 (n = 13), omt-B2 (n = 13), and omt-A2 omt-B2 (n = 14) for plant height (a), number of spikes (b), spike biomass (c), straw biomass (d), total biomass (e), and pseudo-harvest index (f) are shown. Different letters indicate significant differences (p < 0.05) between genotypes for each growth parameter.
2.3. OMT2 Homoeologs Showed Relatively Higher Expression Levels in Reproductive Tissues and the Peduncle
To understand the expression and potential function of the OMT-A2 and OMT-B2 homoeologs in different wheat tissues, transcript levels of OMT-A2 and OMT-B2 were obtained from the Wheat Expression Browser (www.wheat-expression.com; accessed on 18 November 2021), which contains comprehensive transcriptome data across multiple wheat cultivars and tissues [17]. OMT-A2 and OMT-B2 exhibited similar expression profiles in various tissues at different developmental stages (Figure 4). While low levels of OMT-A2 and OMT-B2 expression were observed for leaves, roots, awns, and glumes at all developmental stages, higher amounts of OMT-A2 and OMT-B2 transcripts were present in the spike, particularly when the spike begins to emerge (Figure 4). Besides the reproductive tissues, OMT-A2 and OMT-B2 showed the highest expression levels in the peduncle at the 30% spike and ear emergence stages (Figure 4).
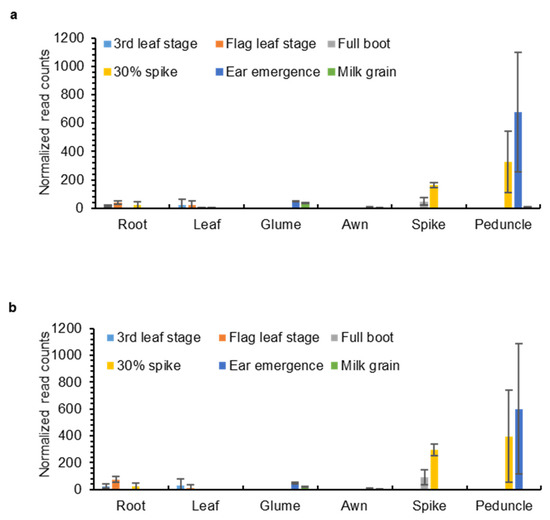
Figure 4.
Expression levels of OMT-A2 (a) and OMT-B2 (b) in different wheat tissues. Data were obtained from www.wheat-expression.com (accessed on 18 November 2021) and graphed based on cv. Azhurnaya. Normalized read counts (means ± S.D. of three biological replicates) in roots, leaves, glumes, awns, spikes, and peduncles at 3rd leaf, flag leaf, full boot, 30% spike, ear emergence, and milk grain stages are shown.
2.4. Chlorogenic Acid Showed Increased Accumulation in Leaves of omt-A2 omt-B2 Whereas Other Phenolic Metabolites Did Not Measurably Differ
To understand whether tricin is produced in leaves and glumes where the OMT2 homoeologs showed relatively low expression (Figure 4), the glume tissue together with leaves was examined for the accumulation of tricin using high-performance liquid chromatography (HPLC) (Figure 5). The peak eluted at 24.6 min of leaf and glume phenolic metabolite extracts matches the retention time and absorption spectrum of the authentic tricin standard (Figure 5a), and it appears to be more abundant in glumes than leaves. The 24.6 min peak was collected from multiple HPLC runs of glume extracts, pooled, and subjected to mass spectrometry (MS) analysis, which showed a mass spectrum that matches the tricin standard (Figure 5b,c).
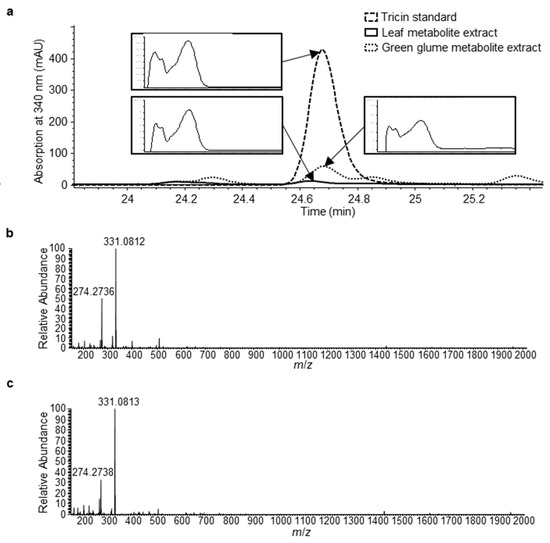
Figure 5.
Identification of tricin in leaf and green glume tissues of tetraploid wheat cv. Kronos. (a) HPLC chromatograms (absorption at 340 nm) of tricin standard, leaf extract, and green glume extract. Absorption spectra of the indicted peaks are shown in inserts. (b) Mass spectrum of the tricin authentic standard. (c) Mass spectrum of the HPLC peak from green glume metabolite extract (indicated in panel (a)).
To investigate the effect of omt2 mutations on phenolic metabolite profiles, leaves from four 4-week-old plants and glumes from 8-week-old plants were collected and processed for metabolite extraction and HPLC analysis. Most of the phenolic metabolites, including tricin, did not show significant changes in their accumulation when either or both OMT-A2 and OMT-B2 homoeologs are knocked out (Figure 6). However, a significantly greater accumulation of chlorogenic acid (3-caffeoyl quinate; eluting at 12.5 min) was displayed in glumes of omt-A2 omt-B2 relative to TILLING control (Figure 6).
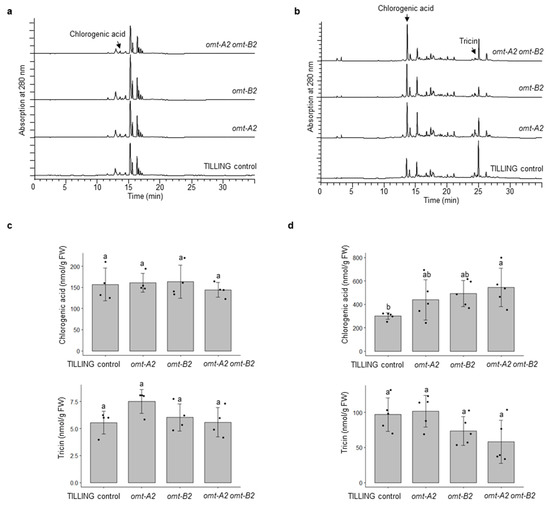
Figure 6.
Phenolic profiling of TILLING control and mutant plants. HPLC chromatograms of TILLING control, and the omt-A2, omt-B2, and omt-A2 omt-B2 mutants in 4-week-old leaves (4 biological replicates) (a), and 8-week-old glumes (5 biological replicates) (b) are shown. The peaks corresponding to chlorogenic acid and tricin were quantified and compared among the genotypes for leaves (c) and glumes (d). Different letters indicate significant differences (p < 0.05) between genotypes for each metabolite. FW, fresh weight.
2.5. The omt2 Mutants and TILLING Control Did Not Differ in Lignin Deposition in the Cell Walls of Wheat Stems
To assess the effect of omt-A2, omt-B2, and omt-A2 omt-B2 mutations on lignin deposition in cell walls, Mäule staining was performed on these mutants and TILLING control under light microscopy (Figure 7). The Mäule staining detected both sinapyl alcohol monomers of lignins that stained red and coniferyl and coumaroyl alcohol monomers of lignins that stained brown (Figure 7). Four stem sections from multiple plants of each of the genotypes were collected, prepared, and stained. Three technical replicates were observed from each plant to assess lignin deposition. Overall, no qualitative differences in lignin deposition were identified among these genotypes (representative images are shown in Figure 7).
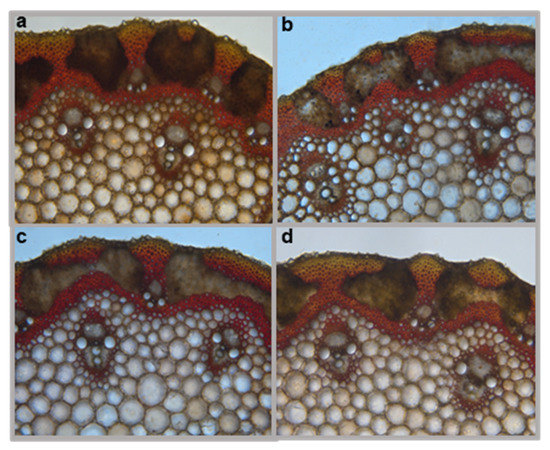
Figure 7.
Histochemical analysis of lignin in cross-sections of wheat stems. Representative Mäule staining images of (a) TILLING control, (b) omt-B2 mutant, (c) omt-A2 mutant, and (d) omt-A2 omt-B2 mutant are shown.
3. Discussion
Although the enzymatic activity of OMT2 was previously characterized using in vitro assays, this is the first study that explores the function of OMT2 homoeologs in tetraploid wheat employing a genetic approach. The mutated OMT2 proteins are truncated in (OMT-A2) and around (OMT-B2) a SAM binding domain located in a highly conserved region of OMTs, thus are expected to lead to loss-of-function mutants. The omt-A2 omt-B2 double mutant was generated that abolished the activities of both OMT2 homoeologs and allows the assessment of OMT2 function in tetraploid wheat.
Tricin is still produced in leaves and glumes of wild-type plants where low expression of OMT2 homoeologs was observed, suggesting that OMT2 is functional in these tissues (Figure 4 and Figure 5). However, the omt2 mutants and TILLING control showed similar soluble phenolic metabolite profiles, including tricin, in leaves and glumes (Figure 6), suggesting that the loss of OMT2 activities had a small impact on the metabolite profile of the tissues. This could be due to additional OMT activities present in the omt2 mutants, potentially OMT1, which can compensate for the loss of OMT2 in omt-A2 omt-B2. The protein sequences of OMT-A1 and OMT-A2 share 94.7% identity, and OMT-B1 and OMT-B2 are 94.4% identical, respectively (Figure 8a). In addition, the OMT1 and OMT2 homoeologs exhibited similar expression profiles in different tissues at various developmental stages (Figure 4 and Figure 8b,c). Furthermore, OMT1 also preferred tricetin as a substrate in enzyme assays and was able to add more than one methyl group to tricetin [18]. However, OMT1 was considered to be distinct from OMT2 because, unlike OMT2, it only had low activities towards caffeic acid, 5-hydroxyferulic acid, and flavonols [18]. Interestingly, the expression of OMT-A1 and OMT-B1, but not OMT-A2 and OMT-B2, was induced in wheat leaves subjected to heat stress for 6 h or infected with powdery mildew (Blumeria graminis f. sp. tritici) for 24 h (Figure 9), suggesting that OMT1 and OMT2 may play different roles in wheat under biotic and abiotic stress conditions. TILLING mutants of OMT1 are currently being isolated to determine its function in tricin production. It will also be useful to knockout both OMT1 and OMT2 activities to discern the overlapping activities of the two OMTs and to determine whether additional OMTs, besides OMT1 and OMT2, are involved in producing tricin.
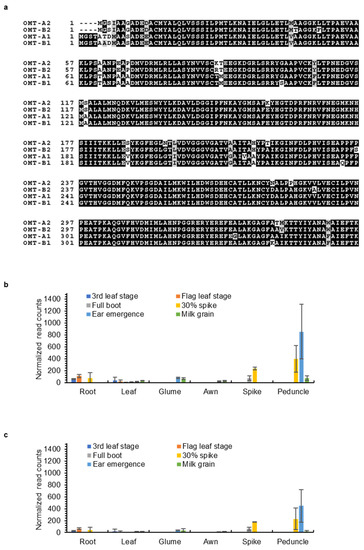
Figure 8.
Sequences and expression of wheat OMT-A1 and OMT-B1 homoeologs. (a) Protein sequence alignment of wheat OMT1 and OMT2 homoeologs. Expression levels of OMT-A1 (b) and OMT-B1 (c) in different wheat tissues. Data were obtained from www.wheat-expression.com (accessed on 18 November 2021) and graphed based on cv. Azhurnaya. Normalized transcript counts (means ± S.D. of three biological replicates) in roots, leaves, glumes, awns, spikes, and peduncles at 3rd leaf, flag leaf, full boot, 30% spike, ear emergence, and milk grain stages are shown.
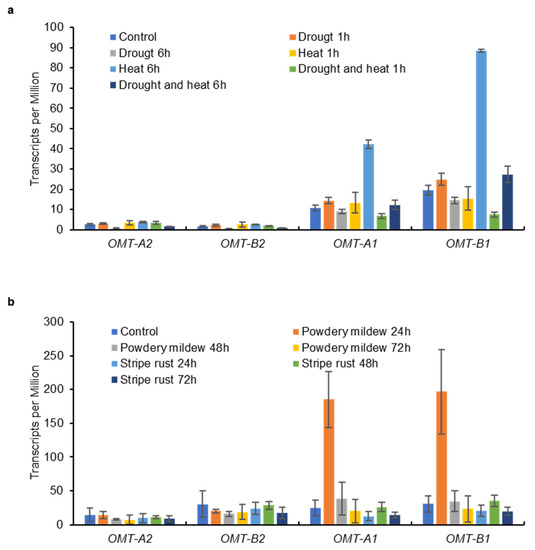
Figure 9.
Expression levels of OMT1 and OMT2 homoeologs in wheat leaves subjected to abiotic (a) and biotic (b) stresses. Data on leaves of hexaploid wheat cv. TAM 107 exposed to drought and heat stresses were obtained from Liu et al., 2015 [21] and those on leaves of hexaploid wheat cv. N9134 inoculated with powdery mildew and stripe rust pathogens were obtained from Zhang et al., 2014 [22]. Transcripts per Million [means ± S.D. of two (drought and heat stresses) or three (fungal pathogens) biological replicates] are shown.
An unexpected observation is the significantly (p < 0.05) increased chlorogenic acid in omt-A2 omt-B2 relative to TILLING control (Figure 6b). The omt-A2 and omt-B2 single mutants also showed a trend of increased accumulation of chlorogenic acid (Figure 6b). This raises the interesting possibility that chlorogenic acid may serve as a substrate for OMT2 in wheat as the lack of OMT2 activity causes a buildup of chlorogenic acid—a reaction that has not been explored previously. On the other hand, chlorogenic acid is one of the most abundant phenolic antioxidants in the human diet [19]. It will be interesting to explore the accumulation of chlorogenic acid in edible tissues of wheat for enhanced dietary chlorogenic acid using the omt2 TILLING mutants.
While the current analysis assessed soluble phenolics [metabolites extractable in 70% (v/v) methanol] (Figure 6), it is possible that tricin produced is incorporated in lignin and not extracted with this method. However, Mäule staining of the omt2 mutants and TILLING control plants did not reveal any apparent differences in lignin deposition in the cell walls of stems (Figure 7). Future studies that involve lignin hydrolysis and subsequent biochemical analysis will help determine if altered OMT2 activities in the mutants lead to a difference in lignin composition, e.g., changes in lignin nucleation caused by fluctuations in tricin levels.
Overall, the TILLING mutant-based genetic approach allowed exploration of OMT2 function in wheat plants and suggested the overlapping activities of OMT1 and OMT2 towards the production of methylated flavones and lignin biosynthesis. Because the current results strongly suggest compensating activities of OMT1 in the wheat omt2 mutants, it will be useful to examine the role of tricin in wheat stress resistance using plants lacking both functional OMT1 and OMT2. In addition, overexpression of OMT2 can be conducted in the future in biotic and abiotic stress assays. To these ends, CRISPR (Clustered Regularly Interspaced Short Palindromic Repeats)/CRISPR-associated (Cas)-based genome editing has demonstrated its utility in wheat functional genomics, providing a powerful tool to increase, decrease, or eliminate expression/function of target genes [20]. A better understanding of OMT functions and the role of tricin in wheat-environment interactions can then be applied to wheat improvement also through the genome editing approaches.
4. Materials and Methods
4.1. Plant Growth and Measurement of Plant Growth Parameters
Wheat seeds were sterilized in a solution of 1% (w/v) sodium hypochlorite and 0.1% (v/v) Triton X-100 (Sigma-Aldrich, St. Louis, MO, USA) for 15 min, followed by multiple rinses with water. The sterilized seeds were incubated at 4 °C for 1 week and then placed under a fluorescent light at room temperature for 2 days. The germinated seedlings were planted in soil and grown in a temperature-controlled greenhouse.
To determine the growth parameters of TILLING control and the omt-A2, omt-B2, and omt-A2 omt-B2 mutants, plants were grown in a randomized arrangement in the greenhouse. Upon natural senescence (about 4 months after seed germination), the number of spikes on each plant was counted, and the height of the tallest stem was recorded from the soil line to the top of the spike (not including the awns). Spikes were separated from the straw, and the straw was dried in an oven at 60 °C for 1 week and subsequently weighed. The spikes were dried at 37 °C for 1 week and weighed separately. The pseudo-harvest index was determined via dividing spike weight by total biomass (i.e., weight of straw and spikes).
4.2. Identification and Molecular Characterization of omt-A2 and omt-B2 TILLING Mutants
To identify tetraploid wheat omt-A2 and omt-B2 mutants in the Kronos background, the TILLING mutant database was searched using OMT-A2 and OMT-B2 sequences from hexaploid wheat cv. CS as a query via the program Basic Local Alignment Search Tool (BLASTn). Line 3521 (omt-A2) was backcrossed with the parental line Kronos to reduce the level of background mutations. The backcrossed plants were self-pollinated, and progenies genotyped using CAPS markers to identify homozygous omt-A2 plants.
To generate the omt-A2 omt-B2 double mutant, the homozygous omt-A2 (line 3521, BC1F2) was crossed with the homozygous omt-B2 (line 388, M4). The progeny of the cross was allowed to self-pollinate and subsequently genotyped. Homozygous wild-type (OMT-A2 OMT-B2), single mutants (omt-A2, omt-B2), and double mutant (omt-A2 omt-B2) plants were identified. The polymorphic CAPS markers are OMT-A2, amplification with the primers 5′-AGTTTGCCCTCATGTAGTAGC-3′ (forward) and 5′- AATTAATGCATCAGATGGGAG-3′ (reverse), followed by digestion with the restriction enzyme BamHI; and OMT-B2, amplification with the primers 5′-TGTTCAGACAGTAGTAGCATCTCC-3′ (forward) and 5′-CATCAGAGGGGTAGACTCG-3′ (reverse), followed by digestion with the restriction enzyme BsrI.
To examine the expression of OMT-A2 and OMT-B2, transcriptome data of wheat cv. Azhurnaya based on the publication by Ramírez-González et al. [17] were obtained from www.wheat-expression.com (accessed on 18 November 2021). Means and standard deviations of normalized read counts were calculated according to three biological replicates for each tissue type at each developmental stage and used for the preparation of bar graphs. Transcriptome data of hexaploid wheat cv. TAM 107 exposed to drought and heat stresses, and cv. N9134 inoculated with powdery mildew and stripe rust were obtained from Liu et al., 2015 [21] and Zhang et al., 2014 [22], respectively. Means and standard deviations of Transcripts per Million were calculated for 2 (drought and heat stresses) or 3 (pathogens) biological replicates and used for the preparation of bar graphs. For comparison of OMT sequences, the protein sequences were aligned with Multiple sequence comparison by Log-Expectation (MUSCLE) [23], and the alignment was graphed using the BoxShade server (https://embnet.vital-it.ch/software/BOX_form.html (accessed on 18 November 2021)).
4.3. Metabolite Analysis
Leaves from 4-week-old greenhouse-grown wheat plants and green glumes from spikes at approximate anthesis (plants at ~8 weeks old) were collected and immediately frozen in liquid nitrogen. The leaf and green glume tissues were ground in liquid nitrogen into a fine powder using a mortar and pestle. Approximately 100 mg of ground tissue was extracted in 350 µL of 70% (v/v) methanol with sonication for 20 min at room temperature and then centrifuged twice at 17,000× g for 10 min each. The supernatant recovered from each sample was transferred to an HPLC vial, and 10 µL was used for injection.
Wheat metabolite extracts were separated on a reverse-phase HPLC using a Zorbax Stablebond C18 column (Agilent, Santa Clara, CA, USA) following a gradient between A (0.1% formic acid in water) and B (acetonitrile) at a flow rate of 1 mL min−1 as described previously [24]. Commercial standards, including tricin, tricetin, apigenin, luteolin, quercetin, kaempferol, myricetin, chlorogenic acid, caffeic acid, and trans-cinnamic acid (all from Sigma-Aldrich), were also analyzed using the same HPLC system. Individual peaks of interest were collected from multiple HPLC runs, concentrated in a vacuum centrifuge, and subjected to MS analysis. The MS analysis was performed with a Thermo Electron LTQ-Orbitrap mass spectrometer (Thermo Scientific, Waltham, MA, USA) in the positive mode using electrospray ionization and with a flow rate of 0.2 mL min−1. Ten μL of sample was injected for each run, and the m/z was observed between 200 and 2000 Da.
4.4. Histochemical Staining of Lignin in Wheat Stem Sections
Stems of 3-month-old wheat plants were cut at the midpoint between the flag leaf node and the spike into 2–3 cm sections using a razor blade. The stem sections were embedded in 5% agarose and sliced off into 50 µm sections using a Vibratome 1000 Plus sectioning system (The Vibratome Company, St. Louis, MO, USA). The Mäule staining procedure was modified slightly from a previously established method [25]. Briefly, sectioned wheat stems were incubated in 1 mL of 0.5% (w/v) potassium permanganate (Alfa Aesar, Haverhill, MA, USA) solution for 4 min and rinsed with water. The stem sections were then incubated in 1 mL of 3.7% (v/v) hydrochloric acid (Sigma-Aldrich) for 5 min. The hydrochloric acid solution was quickly removed, and 1 mL of ammonium hydroxide (EMD Millipore, Burlington, MA, USA) was added immediately. Following removal of 500 µL of ammonium hydroxide, stem sections were pipetted onto 1 mm-thick glass slides and imaged using a RogRes CT Scan digital camera (Jenoptik, Jenna, Germany) with 10 × objective on an Olympus BH-2 compound microscope (Olympus Optical Co., Ltd., Tokyo, Japan).
4.5. Data Analysis
The plant growth and metabolite data were analyzed in R using Analysis of Variance (ANOVA) and Tukey’s Honestly Significant Difference (HSD) test.
Author Contributions
L.T. conceived of the project; A.B.C., S.Y., and L.T. designed the experiments; A.B.C. performed the experiments; A.B.C., S.Y., and L.T. analyzed the data; A.B.C., S.Y., and L.T. wrote the manuscript. All authors have read and agreed to the published version of the manuscript.
Funding
This work was funded by USDA-NIFA to L.T. (2017-67013-26164). A.B.C. was supported by the Henry A. Jastro Research Award. S.Y. was supported by the Henry A. Jastro Research Award, a China Scholarship Council Scholarship, and the UC Davis Department of Plant Sciences Graduate Research Fellowship.
Institutional Review Board Statement
Not applicable.
Informed Consent Statement
Not applicable.
Data Availability Statement
The data presented in this study are available in the article.
Acknowledgments
We thank Judy Jernstedt for assistance with wheat stem sectioning and Cody Bekkering for the critical reading of the manuscript.
Conflicts of Interest
The authors declare no conflict of interest.
Abbreviations
ANOVA, Analysis of Variance; BLAST, Basic Local Alignment Search Tool; Cas, CRISPR-associated; COMT, caffeic acid 3-O-methyltransferase; CRISPR, Clustered Regularly Interspaced Short Palindromic Repeats; HPLC, High-Performance Liquid Chromatography; HSD, Honestly Significant Difference; MS, Mass Spectrometry; MUSCLE, Multiple sequence comparison by Log-Expectation; OMT, O-methyltransferase; ORF, open reading frame; SAM, S-adenosyl-L-methionine; TILLING, Targeting Induced Local Lesions in Genomes.
References
- Fini, A.; Brunetti, C.; Di Ferdinando, M.; Ferrini, F.; Tattini, M. Stress-induced flavonoid biosynthesis and the antioxidant machinery of plants. Plant Signal. Behav. 2011, 6, 709–711. [Google Scholar] [CrossRef]
- Kong, C.-H.; Xu, X.-H.; Zhang, M.; Zhang, S.-Z. Allelochemical tricin in rice hull and its aurone isomer against rice seedling rot disease. Pest. Manag. Sci. 2010, 66, 1018–1024. [Google Scholar] [CrossRef]
- Liu, X.; Tian, F.; Tian, Y.; Wu, Y.; Dong, F.; Xu, J.; Zheng, Y. Isolation and identification of potential allelochemicals from aerial parts of Avena fatua L. and their allelopathic effect on wheat. J. Agric. Food Chem. 2016, 64, 3492–3500. [Google Scholar] [CrossRef]
- Yang, X.-F.; Lei, K.; Kong, C.-H.; Xu, X.-H. Effect of allelochemical tricin and its related benzothiazine derivative on photosynthetic performance of herbicide-resistant barnyardgrass. Pestic. Biochem. Physiol. 2017, 143, 224–230. [Google Scholar] [CrossRef] [PubMed]
- van de Staaij, J.; de Bakker, N.V.; Oosthoek, A.; Broekman, R.; van Beem, A.; Stroetenga, M.; Aerts, R.; Rozema, J. Flavonoid concentrations in three grass species and a sedge grown in the field and under controlled environment conditions in response to enhanced UV-B radiation. J. Photochem. Photobiol. B 2002, 66, 21–29. [Google Scholar] [CrossRef]
- Moheb, A.; Ibrahim, R.K.; Roy, R.; Sarhan, F. Changes in wheat leaf phenolome in response to cold acclimation. Phytochemistry 2011, 72, 2294–2307. [Google Scholar] [CrossRef] [PubMed]
- del Río, J.C.; Rencoret, J.; Prinsen, P.; Martínez, Á.T.; Ralph, J.; Gutiérrez, A. Structural characterization of wheat straw lignin as revealed by analytical pyrolysis, 2D-NMR, and reductive cleavage methods. J. Agric. Food Chem. 2012, 60, 5922–5935. [Google Scholar] [CrossRef] [Green Version]
- Lan, W.; Morreel, K.; Lu, F.; Rencoret, J.; Carlos Del Río, J.; Voorend, W.; Vermerris, W.; Boerjan, W.; Ralph, J. Maize tricin-oligolignol metabolites and their implications for monocot lignification. Plant Physiol. 2016, 171, 810–820. [Google Scholar] [CrossRef] [Green Version]
- You, T.-T.; Mao, J.-Z.; Yuan, T.-Q.; Wen, J.-L.; Xu, F. Structural elucidation of the lignins from stems and foliage of Arundo donax Linn. J. Agric. Food Chem. 2013, 61, 5361–5370. [Google Scholar] [CrossRef]
- Lan, W.; Lu, F.; Regner, M.; Zhu, Y.; Rencoret, J.; Ralph, S.A.; Zakai, U.I.; Morreel, K.; Boerjan, W.; Ralph, J. Tricin, a flavonoid monomer in monocot lignification. Plant Physiol. 2015, 167, 1284–1295. [Google Scholar] [CrossRef] [Green Version]
- Lam, P.Y.; Liu, H.; Lo, C. Completion of tricin biosynthesis pathway in rice: Cytochrome P450 75B4 is a unique chrysoeriol 5′-hydroxylase. Plant Physiol. 2015, 168, 1527–1536. [Google Scholar] [CrossRef] [Green Version]
- Koirala, N.; Thuan, N.H.; Ghimire, G.P.; Thang, D.V.; Sohng, J.K. Methylation of flavonoids: Chemical structures, bioactivities, progress and perspectives for biotechnological production. Enzyme Microb. Technol. 2016, 86, 103–116. [Google Scholar] [CrossRef]
- Zhou, J.-M.; Gold, N.D.; Martin, V.J.J.; Wollenweber, E.; Ibrahim, R.K. Sequential O-methylation of tricetin by a single gene product in wheat. Biochim. Biophys. 2006, 1760, 1115–1124. [Google Scholar] [CrossRef]
- Zhou, J.-M.; Lee, E.; Kanapathy-Sinnaiaha, F.; Park, Y.; Kornblatt, J.A.; Lim, Y.; Ibrahim, R.K. Structure-function relationships of wheat flavone O-methyltransferase: Homology modeling and site-directed mutagenesis. BMC Plant Biol. 2010, 10, 156. [Google Scholar] [CrossRef] [Green Version]
- Krasileva, K.V.; Vasquez-Gross, H.A.; Howell, T.; Bailey, P.; Paraiso, F.; Clissold, L.; Simmonds, J.; Ramirez-Gonzalez, R.H.; Wang, X.; Borrill, P.; et al. Uncovering hidden variation in polyploid wheat. Proc. Natl. Acad. Sci. USA 2017, 114, E913–E921. [Google Scholar] [CrossRef] [Green Version]
- Joshi, C.P.; Chiang, V.L. Conserved sequence motifs in plant S-adenosyl-L-methionine-dependent methyltransferases. Plant Mol. Biol. 1998, 37, 663–674. [Google Scholar] [CrossRef]
- Ramírez-González, R.H.; Borrill, P.; Lang, D.; Harrington, S.A.; Brinton, J.; Venturini, L.; Davey, M.; Jacobs, J.; Van Ex, F.; Pasha, A.; et al. The transcriptional landscape of polyploid wheat. Science 2018, 361, eaar6089. [Google Scholar] [CrossRef] [PubMed] [Green Version]
- Zhou, J.M.; Seo, Y.W.; Ibrahim, R.K. Biochemical characterization of a putative wheat caffeic acid O-methyltransferase. Plant Physiol. Biochem. 2009, 47, 322–326. [Google Scholar] [CrossRef]
- Upadhyay, R.; Mohan Rao, L.J. An outlook on chlorogenic acids—Occurrence, chemistry, technology, and biological activities. Crit. Rev. Food Sci. Nutr. 2013, 53, 968–984. [Google Scholar] [CrossRef] [PubMed]
- Shan, Q.; Wang, Y.; Li, J.; Gao, C. Genome editing in rice and wheat using the CRISPR/Cas system. Nat. Protoc. 2014, 9, 2395–2410. [Google Scholar] [CrossRef] [PubMed]
- Liu, Z.; Xin, M.; Qin, J.; Peng, H.; Ni, Z.; Yao, Y.; Sun, Q. Temporal transcriptome profiling reveals expression partitioning of homeologous genes contributing to heat and drought acclimation in wheat (Triticum aestivum L.). BMC Plant Biol. 2015, 15, 152. [Google Scholar] [CrossRef] [PubMed] [Green Version]
- Zhang, H.; Yang, Y.; Wang, C.; Liu, M.; Li, H.; Fu, Y.; Wang, Y.; Nie, Y.; Liu, X.; Ji, W. Large-scale transcriptome comparison reveals distinct gene activations in wheat responding to stripe rust and powdery mildew. BMC Genom. 2014, 15, 898. [Google Scholar] [CrossRef] [PubMed] [Green Version]
- Edgar, R. MUSCLE: Multiple sequence alignment with high accuracy and high throughput. Nucl. Acids Res. 2004, 32, 1792–1797. [Google Scholar] [CrossRef] [PubMed] [Green Version]
- Knollenberg, B.J.; Liu, J.; Yu, S.; Lin, H.; Tian, L. Cloning and functional characterization of a p-coumaroyl quinate/shikimate 3′-hydroxylase from potato (Solanum tuberosum). Biochem. Biophys. Res. Commun. 2018, 496, 462–467. [Google Scholar] [CrossRef]
- Pradhan Mitra, P.; Loqué, D. Histochemical staining of Arabidopsis thaliana secondary cell wall elements. J. Vis. Exp. 2014, 87, 51381. [Google Scholar] [CrossRef] [Green Version]
Publisher’s Note: MDPI stays neutral with regard to jurisdictional claims in published maps and institutional affiliations. |
© 2022 by the authors. Licensee MDPI, Basel, Switzerland. This article is an open access article distributed under the terms and conditions of the Creative Commons Attribution (CC BY) license (https://creativecommons.org/licenses/by/4.0/).