Article

Compost Addition Attenuates the Negative Impacts of High Soil Mineral Nitrogen Levels on Rhizosphere Microbial Characteristics and Enhances Cucumber Growth in Monoculture Systems

1
College of Agriculture, Ningxia University, Helanshan Xilu No. 489, Yinchuan 750021, China
2
College of Horticulture, China Agricultural University, Yuanmingyuan West Road No. 2, Haidian District, Beijing 100193, China
*
Authors to whom correspondence should be addressed.
Plants 2022, 11(13), 1621; https://doi.org/10.3390/plants11131621
Submission received: 26 May 2022 / Revised: 15 June 2022 / Accepted: 17 June 2022 / Published: 21 June 2022
(This article belongs to the Special Issue Plant Metabolic Responses to Biotic and Abiotic Stress)

Abstract

:
Due to the increase in the human population, it is necessary to seek efficient methods of increasing crop productivity and, simultaneously, sustaining the soil. One way is to grow high demand crops continuously without rotating with other crops. This practice is often accompanied by increased rates of fertilizer application that can affect efficient nitrogen (N) cycling in the plant rhizosphere soil which, in turn, affects both plant growth and environmental pollution. In the present study, twelve various cucumber soils were selected from monoculture systems presenting different cropping years and divided into two groups including soils with relatively high mineral N (HMN) content (N > 100 mg kg−1 soil) and those with a lower mineral N (LMN) content (N < 100 mg kg−1 soil). All soils were amended with the addition of compost alone or in combination with bacterial inoculation to evaluate their effects on plant growth, microbial numbers, N mineralization, and N cycling genes. In general, the HMN soils increased (p < 0.05) net N mineralization (NNM) but did not statistically (p > 0.05) affect plant biomass compared to the LMN soils; however, compost addition increased both NNM and plant biomass in the HMN soils. In addition, the HMN soils had higher fungal pathogen numbers (FPNs) but lower total microbial biomass (TMB) and bacterial numbers (BNs) compared to the LMN soils; however, compost addition decreased FPNs but increased TMB and BNs in the HMN soils (all p < 0.05). Plant biomass was positively related to TMB, BN and NNM but was negatively related to FPN (all p < 0.05). In summary, compost addition reduced the high mineral N levels’ adverse effects on the rhizosphere soil and plant growth.

1. Introduction

Monoculture is extremely common in agricultural production systems for economically important crops such as vegetables. In addition, this cropping system is becoming more prevalent due to the increased intensity of human intervention on agricultural production through promoting agricultural mechanization and increasing inputs of external resources such as fertilizers and pesticides [1]. In spite of this, monoculture often results in a decrease in crop yields with the passage of time, because there is an increasing trend of soil-borne pathogen-induced disease occurrence, soil microbial activity disturbance, and mineral element imbalance [1,2]. Although a number of practices have been used to alleviate or even reverse the adverse effects of monoculture on crop production [2], this cropping system remains a challenge.
Excessive input of N fertilizers is a common practice used by crop growers in China in order to meet yield demand in monoculture systems [3,4]. Despite this, the N use efficiency of crops tends to reduce, resulting in potential environmental risks due to the leaching of unabsorbed N in the form of nitrate and the emission of N in the volatilized form [4]. Therefore, excessive input of N fertilizers may easily lead to high mineral N levels in soils and thereby induce environmental risks such as groundwater contamination.
In order to maintain a relatively high level of crop yields while at the same time avoiding environmental risks, it is critical to enhance the N use efficiency of crops as well as to inhibit the occurrence of the soil-borne pathogen-induced diseases in monoculture. An efficient practice is to improve soil quality by application of organic composts (OCs). It has been sufficiently demonstrated that OCs have several beneficial effects on soil quality such as the promotion of the capacity of soils to hold water and nutrients, an increase in soil porosity, enhancement of the activity of soil microbes, and the inhibition of the occurrence of the soil-borne pathogen-induced diseases [5,6]. In spite of this, various OCs often have different abilities to inhibit soil-borne pathogen-induced diseases in plants, because there is a need to regulate OCs’ physical and chemical characteristics before their application in crop production systems [6,7]. Thus, the addition of microbial strains that are beneficial to crop growth to OCs is an efficient disease control method when OCs are added into soils to enhance soil quality [7].
Despite the advantages of OCs mentioned above, their promoting effects may not occur in soils characterized by high mineral N concentrations. Under this circumstance, the nutrients (especially N) released by OCs in the mineral form due to the fact of mineralization may not be necessary for plants to absorb, because soil mineral N is enough for plants. Recently, a growing body of research has demonstrated that N cycling in soils is closely associated with the concentration of mineral N, which can be significantly influenced by either the growth status of crops or the activity of soil microbes [8,9]. In specific, if soil mineral N exhibits a low concentration, the N released by OCs in the mineral form may meet the nutrient demands by both crops and soil microbes, resulting in low levels of N losses due to the fact of leaching and emission [8]. Despite this, high inputs of N fertilizers can easily inhibit soil N cycling and increase the occurrence of N leaching and emission [8,9]. Nitrogen cycling is especially important in the plant root rhizosphere, where the efficiency of N uptake is most directly affected. Thus, it is significant to explore the link among soil mineral N levels and N cycling bacteria and enzymes in the rhizosphere as well as to investigate how this relationship is affected by compost addition.
The monoculture in combination with high inputs of N fertilizers often leads to an incredible increase in soil mineral N concentrations [4,10]. The high levels of mineral N concentrations are hypothesized to inhibit the activities of soil microbes and enzymes that are closely associated with N cycling compared to lower levels of mineral N concentrations in soils. Furthermore, it is also hypothesized that the application of OCs attenuate the negative impacts of high mineral N levels on N cycling bacteria activity as measured by enzyme activity and N cycling gene abundance.
The rhizosphere of cucumber can be efficiently used to investigate soil N cycling and its related soil microbes and enzymes, because cucumber soils generally cover a wide range of mineral N concentration in monoculture systems. This crop shows rapid growth and high yield in soils and is widely grown in most regions of the world. The diversity and abundance of N cycling microorganisms occurring in cucumber rhizosphere are poorly understood. Furthermore, causal relationships between these microorganisms and N cycling rates are difficult to predict in the rhizosphere soil [11,12]. Yet, N cycling in rhizosphere soils due to the fact of microbial activity has great potential to affect cucumber growth and other microbial processes as well as potential pollution impacts.
In the present study, twelve various cucumber soils were selected from monoculture systems presenting different cropping years in northern China. These soils have extremely high and variable mineral N contents. The aims of the present study were to decipher (i) whether soils having high mineral N concentrations show different levels of N cycling microorganisms and enzymes and plant biomass than those with lower mineral N concentrations; (ii) how N cycling in cucumber rhizosphere soils with high mineral N content and plant biomass are probably influenced by application of OCs alone or in combination with bacterial inoculation used as disease biological control agent.

2. Materials and Methods

2.1. Experimental Site Description and Experiment Design

Twelve cucumber soils were selected from monoculture systems presenting various cropping years (1~22 years) in greenhouse vegetable production bases located in the Beijing area (north latitude: 39″26′–41″03′; east longitude: 115″25′–117″30′) in February 2012. The sampling area has an average annual rainfall of approximately 480 mm and an average air temperature of approximately 14.0 °C. The selected soils had various nutrient levels, pH, and electrical conductivities (ECs) under protected cultivation. A description of each site is presented in Table 1. Methods for soil analysis, including the N parameters, are also provided (see below).
According to the concentrations of the mineral N, the selected soils were divided into two groups: soils with a relatively high mineral N (HMN) content (N > 100 mg kg−1 soil; range 104–684 mg kg−1 soil, mean 279 mg kg−1 soil); soils with a lower mineral N (LMN) content (N < 100 mg kg−1 soil; range 44.8–78.3 mg kg−1 soil, mean 62.5 mg kg−1 soil) (Table 1). This grouping method provided an efficient approach for examining the impact of mineral N levels on N cycling in soils.
Soil organic matter (OM) was determined by the dichromate oxidation and titration method [13], and total nitrogen (TN) was analyzed using the classical micro-Kjeldahl method [14]. The pH (soil/water: 1:2.5) was analyzed with a pH meter combined with a glass electrode, and the EC (soil/water: 1:5.0) was measured with an EC meter combined with a glass electrode. Ammonium nitrogen (AN) and nitrate nitrogen (NN) were measured using the methods described in [15,16] after extraction with 2 M KCl. Available phosphorus (AP) was analyzed using the method described in [17] after extraction with 0.5 M NaHCO3. Available K was measured as described in [18] after extraction with 1 M NH4OAc. The properties of straw compost (SC) used in this study are shown in Table 2. The SC was prepared from plant straw mixed with chicken manure.
Bacillus subtilis LY-A, a bacterial strain isolated from cucumber soil and which is beneficial to crop growth and plant disease control, was purchased from the China Center of Industrial Culture Collection. It was prepared as described in [19]. It was used as an inoculant in this study to control disease caused by Fusarium oxysporum, and the normal concentration of spores in the culture was 109 spores of Bacillus subtilis L−1.
Cucumber (Cucumis sativus L.) plants were grown in all twelve soils, each of which was treated with different amendments to create four treatments including (i) the untreated soil (S), (ii) the compost-amended soil (SC; 6% compost), (iii) the Bacillus subtilis-amended soil (SI; 2.5 × 10⁴ spores g−1 soil), and (iv) the compost combined with Bacillus subtili-amended soil (SCI; 6% compost + 2.5 × 10⁴ spores g−1 soil). For each treatment there were four replicates (four pots per replicate).
Cucumber (Cucumis sativus cv. Zhongnong No. 16) seeds were sterilized (soaking for 1.5 min in 3% sodium hypochlorite and for 1.5 min in 70% ethanol, followed by washing with sterile water three times) and then germinated in soils filled in PVC pots (5 kg of soil per pot). The diameter and height of the pot were 25 and 30 cm, respectively. Each pot contained one plant. All pots were placed in a plastic greenhouse having a day/night (26 °C/15 °C) cycle of 10/14 h and an 80% relative humidity.
On day 80 after treatments, plants were harvested, and the rhizosphere soils were sampled by vigorously shaking the root systems of the cucumber plants in order to discard soils that were loosely adhered onto the root surface. After vigorous shaking, each root system held 100–200 g of fresh weight soil (i.e., tightly adhering soil), which was removed from roots, collected, and designated as rhizosphere soil. The rhizosphere soil samples were stored at −20 °C until further analysis. The duration of the experiment was one cropping season in order to compare the response of rhizosphere microbial characteristics and cucumber growth to soil mineral N levels and amendments under the same environment conditions.

2.2. DNA Extraction and Quantitative PCR

To extract the genomic DNA of the rhizosphere soil, 0.25 g of fresh sample was treated by the recommended method of the Power Soil DNA Kit produced by MoBio Laboratories Inc. in Sancramento, California, USA. The extracted DNA was loaded on an agarose gel (1%) to check its integrity using electrophoresis. Moreover, its purity was also checked and quantified by a spectrophotometer (NanoDrop ND-1100, Thermo Scientific, Shanghai, China).
The gene abundance was measured using qPCR [20]. The numbers of bacteria, fungi, archaea, Bacillus subtilis, and Fusarium oxysporum f. sp. cucumerinum were measured based on quantifying small subunit rRNA genes. Functional genes measured included the AOA and AOB amoA genes for bacterial and archaeal ammonia oxidizers, the nirK and nirS genes for nitrate reducers, and the nosZ gene for denitrifer [12]. F. oxysporum f. sp. cucumerinum is a major soil-borne pathogen that induces wilt disease in cucumber roots around the world. For all tested genes, the specific primers, fragment lengths, and related thermal profiles are shown in Table 3. The gene abundance was measured through estimating the copy number of a gene in comparison with its standard curve [20].

2.3. Nitrogen Mineralization

Nitrogen (N) mineralization of the rhizosphere soil was measured using the incubation method as described in [21]. Briefly, for each replicate approximately 40 g of fresh sample was treated with sterilized deionized water to make its soil water content into 24% (w/w, dry weight) and then placed in a 4 °C refrigerator for 2 days to obtain equilibrated soils.
The equilibrated soils were further used to analyze net N mineralization. To meet this need, for each replicate, 10 g of soil sample was filled in a 50 mL small flask sealed with a polyethylene film that allows gas but not water to permeate, and then it was placed in a 28 °C incubator for 28 days under dark conditions. Subsequently, for each replicate, both initial (unincubated) and incubated soils were extracted with 2 M KCl to measure AN [15] and NN [16] using the colorimetric method. The net ammonification for a soil was expressed as the difference of AN in the incubated soil comparted to its initial soil, while the net nitrification was the difference of NN (incubated soil vs. initial soil). With respect to net N mineralization, it was expressed as the difference of inorganic N (AN plus NN) (incubated soil vs. initial soil).

2.4. Statistical Analysis

SPSS17.0 (SPSS Inc., Chicago, IL, USA) was used to conduct statistical analyses. Soil properties and crop parameters were analyzed by two-way analysis of variance (ANOVA). The factors considered in the ANOVA were soil mineral level, soil amendment treatment, and the interactions of soil mineral level × soil amendment treatment. Once significant differences (p ≤ 0.05) were generated by the ANOVA, multiple comparisons were performed by Tukey’s honestly significance difference post hoc test (HSD). The log-transformation was applied if the data did not show normality or equal variance. A two-tailed Student’s t-test with homogeneous variances was conducted to analyze significant differences in the data between LMN and HMN soils, and p-values are presented.
All variables were used to conduct Pearson correlation analysis to obtain the correlation coefficient®. To determine the main factors in N cycling genes affecting the N mineralization, canonical correspondence analysis (CCA) [22] in R package vegan (v2.0-8) (University of Oulu, Oulu, Finland) [23] was performed using data matrices of log-transformed N cycling gene abundance data and the variables of N mineralization retained. N cycling gene-related properties (the main matrix) and N mineralization data (the second matrix) were also subjected to multivariate analysis by PC-ORD version 5.0 [24] and plotted using non-metric multidimensional scaling (NMS) to examine whether there is a separation between the high mineral soils and the low mineral N soils, or among the soil amendment treatments (for more details, see [25]).

3. Results

3.1. Mineral N content

According to the concentration of mineral N (MN), our 12 continuously cropped cucumber soils were divided into two parts, i.e., the high mineral N (HMN) soils (MN > 100 mg kg−1) and the low mineral N (LMN) soils (MN < 100 mg kg−1). The HMN soils included soils 3, 4, 6, 9, 10, and 11 with an average MN of 279 mg kg−1 soil, while the LMN soils included soils 1, 2, 5, 7, 8, and 12 with an average MN of 62.5 mg kg−1 soil. Means between LMN and HMN soils were statistically (p < 0.05) different for NO3-N and total mineral N but not for other variables measured (all p > 0.05; Table 1).

3.2. Microbial Numbers

The MN levels in the soils significantly influenced the total microbial biomass (TMB) and the numbers of bacteria and Fusarium oxysporum (all p < 0.05) but not other tested microbial numbers (all p > 0.05; Table 4). The TMB and bacterial numbers were statistically lower in the HMN soils compared to the LMN soils (both p < 0.05). However, a reverse trend was observed for the number of Fusarium oxysporum between these two groups (p < 0.05).
Overall, the effects of compost addition on the tested microbial numbers (SC vs. S, SCI vs. SI) was more pronounced than that of bacteria inoculation (compare SI vs. S and SCI vs. SC) (Table 4). The total microbial biomass, bacterial numbers, and fungal numbers were statistically increased by compost addition (all p < 0.05; SC vs. S; SCI vs. SI). The abundance of Fusarium oxysporum f. sp. cucumerinum statistically (p < 0.05) decreased by all soil amendment treatments in the HMN soils (SC, SCI, and SI vs. S).

3.3. Nitrogen Cycling Genes

To examine whether the HMN soils had different abundances of N cycling microbes and enzymes in cucumber rhizosphere than the LMN soils, we analyzed the possible differences in N cycling genes in response to soil mineral N levels (Table 5). The LMN soils did not show a statistically significant (p = 0.475) difference in AOB amoA gene abundance but higher (p < 0.001) AOA amoA abundance than the HMN soils, resulting in a relatively low AOB/AOA ratio in the LMN soils. Furthermore, the LMN soils showed a significantly (p = 0.016) higher nirS abundance but did not show a statistically significant difference in the abundances of nirK and nosZ genes (both p > 0.05) compared to HMN soils. In contrast, the compost addition generally increased (p < 0.05) the nirK and nosZ gene abundances but had no impact (p > 0.05) om the nirS abundance (compare SC vs. S and SCI vs. SI). Although the compost addition had no effect (p > 0.05) on the amoA gene abundance of either AOB or AOA, the AOB: AOA ratio was statistically (p < 0.05) lower in the compost-treated HMN soils compared to the untreated HMN soils. In general, there was no effect of bacterial inoculation on the N cycling-related gene abundances and the AOB: AOA ratio (SI vs. S and SCI vs. SC).

3.4. Nitrogen Mineralization

In general, the soil mineral N level significantly affected all these N cycling processes (all p < 0.001), and the HMN soils showed significantly higher cumulative N ammonification (Figure 1A) and nitrification (Figure 1B) than the LMN soils, resulting in relatively high cumulative N mineralization in the HMN soils (Figure 1C). Interestingly, the cumulative net N ammonification value was positive in the HMN soils but was negative in the LMN soils (Figure 1A). The cumulative net N nitrification and mineralization were higher in the compost-treated soils as compared to untreated soils, but this trend was only significant (p < 0.05) in the HMN soils (SC vs. S and SCI vs. SI; Figure 1B,C). In general, no effect of bacterial inoculation on the tested N cycling processes was found (SI vs. S and CI vs. SC).

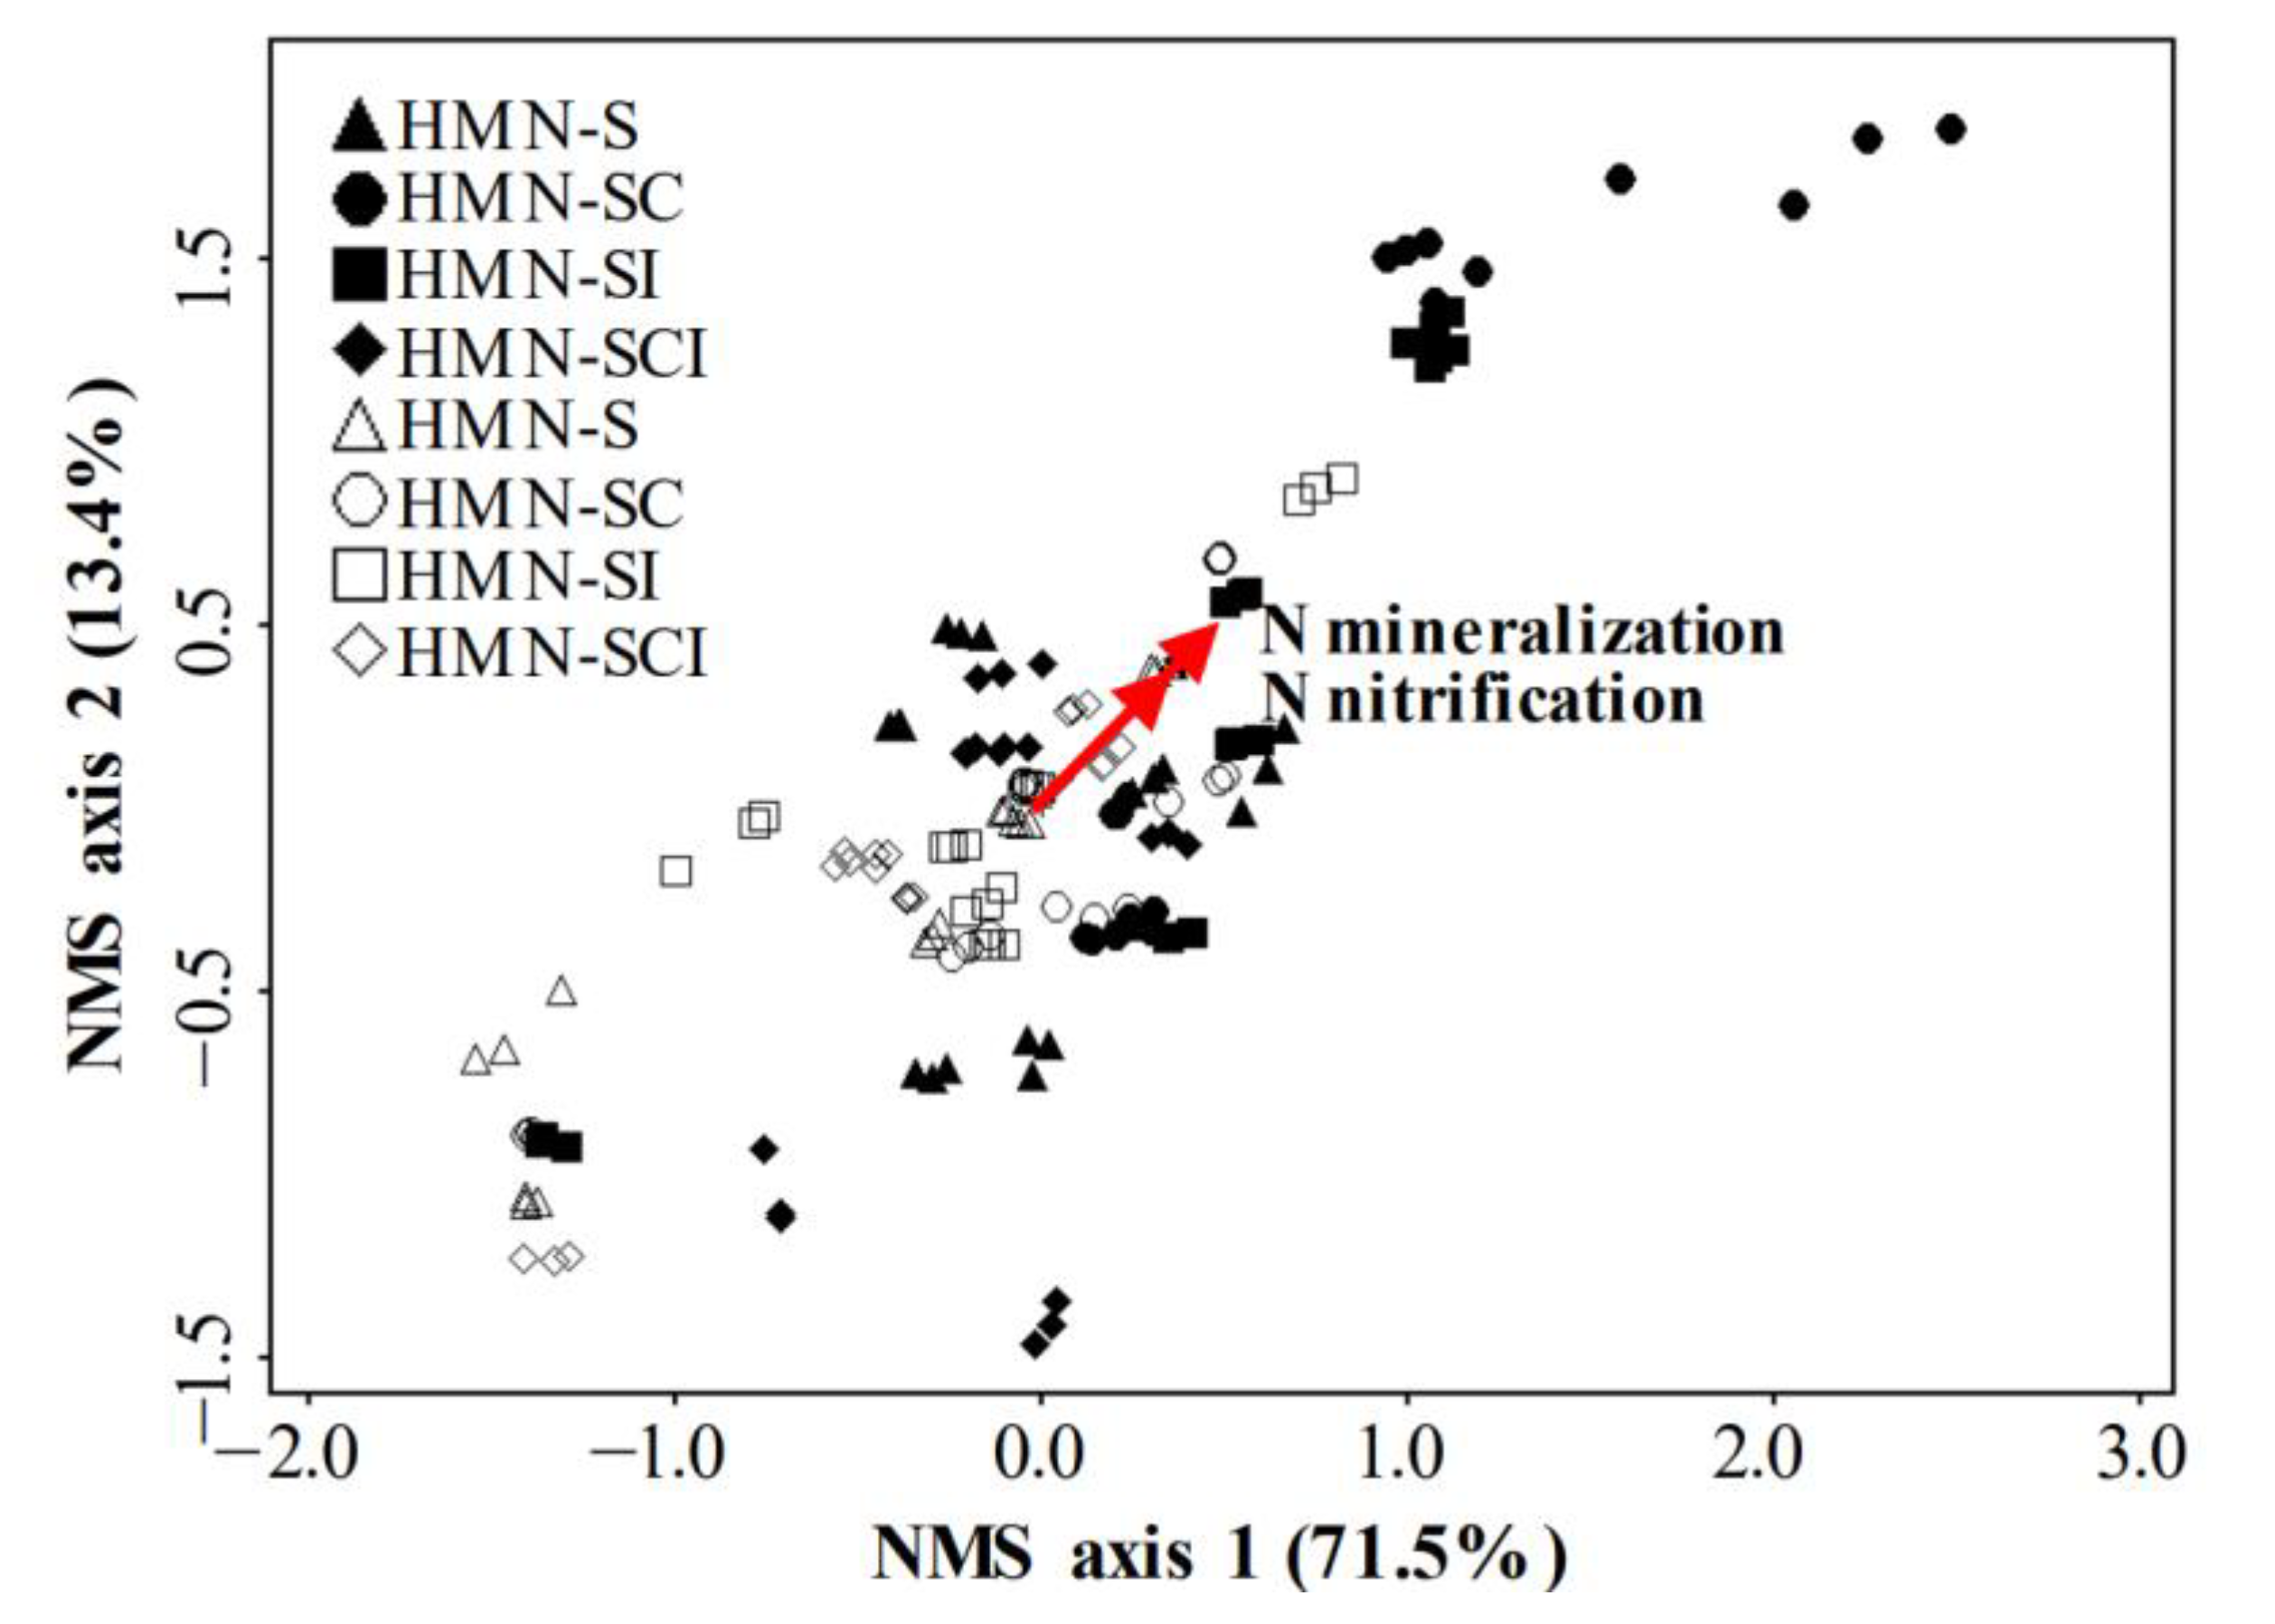
3.5. Relationships between N Cycling Genes and N Mineralization

The HMN soils generally had different levels of N cycling genes and processes than the LMN soils in cucumber rhizosphere. Thus, we further examined whether the relationship between N mineralization and the abundance of genes associated with N cycling in the HMN and LMN soils was different. Net N ammonification was significantly correlated with the abundance of amoA gene of either AOA or AOB (both p < 0.001) but not the nirK and nirS gene abundances (both p > 0.05) in the HMN soils. In contrast, a reverse trend was observed in the LMN soils (Table 6). Furthermore, net N ammonification showed a significant and negative correlation with the nosZ abundance in the HMN soils (r = −0.405, p < 0.001) but a significant and positive correlation with the nosZ abundance in the LMN soils (r = 0.384, p < 0.001) (Table 6). It was noted that, although both nirK and nirS are genes for nitrate reducers, reverse relationships were found between these two genes and the net N ammonification in the LMN soils. In general, no statistical (p > 0.05) correlation was found among the abundances of tested N cycling genes and net N nitrification and mineralization in both HMN and LMN soils (Table 6). Since each N cycling process is generally affected by more than one gene, the net N mineralization is generally affected by the equilibrium of different related genes rather than one specific gene. Thus, we further calculated the ratios of different related genes and found that net N nitrification and mineralization were significantly positively correlated with the nosZ/nirS and nirK/nirS ratios in the HMN soils (all p < 0.001) but significantly negatively correlated with the AOB/AOA ratio in the LMN soils (p < 0.05) (Table 6).
To further confirm the result that the N mineralization was affected by the equilibrium of different related genes rather than one specific gene, we performed canonical correspondence analysis (CCA) to determine the main factors in N cycling genes affecting the N mineralization (Figure 2). The results of CCA showed that in both the HMN and LMN soils, the net N ammonification, nitrification, and mineralization were mainly affected by the ratios of different related genes rather than one specific gene. N ammonification was mainly affected by the AOB/AOA and nosZ/nirK ratios in the HMN soils (Figure 2A), but mainly affected by the nosZ/(nirK + nirS) ratio in the LMN soils (Figure 2B). In both the HMN and LMN soils, N nitrification and mineralization were mainly affected by the nosZ/nirS ratio.

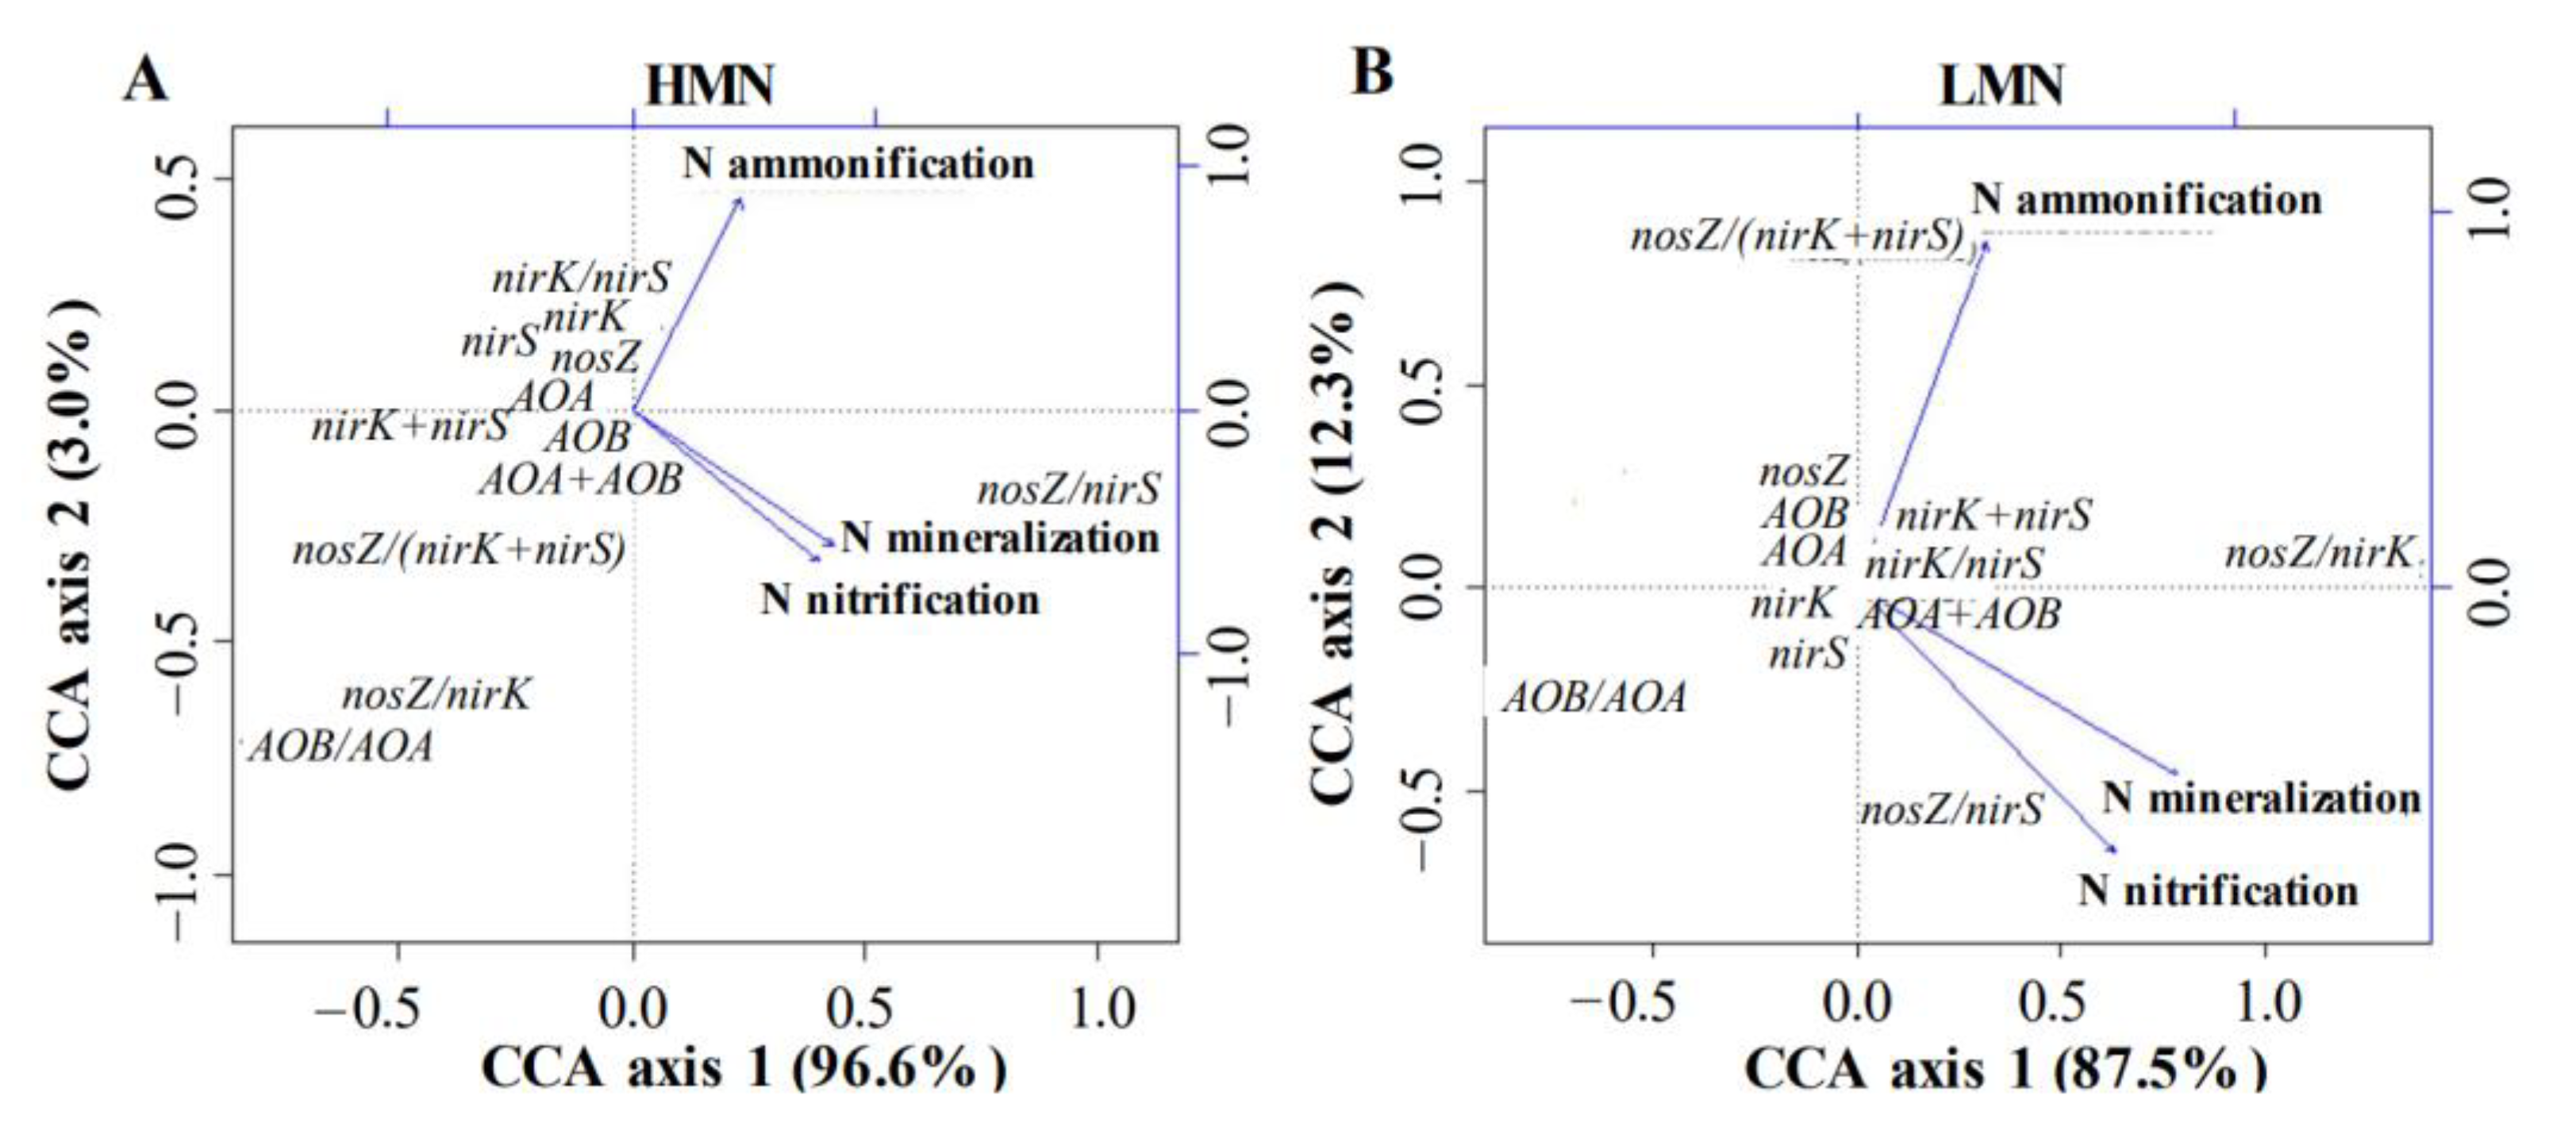
3.6. Effects of Soil Mineral N Levels and Soil Amendments on N Cycling
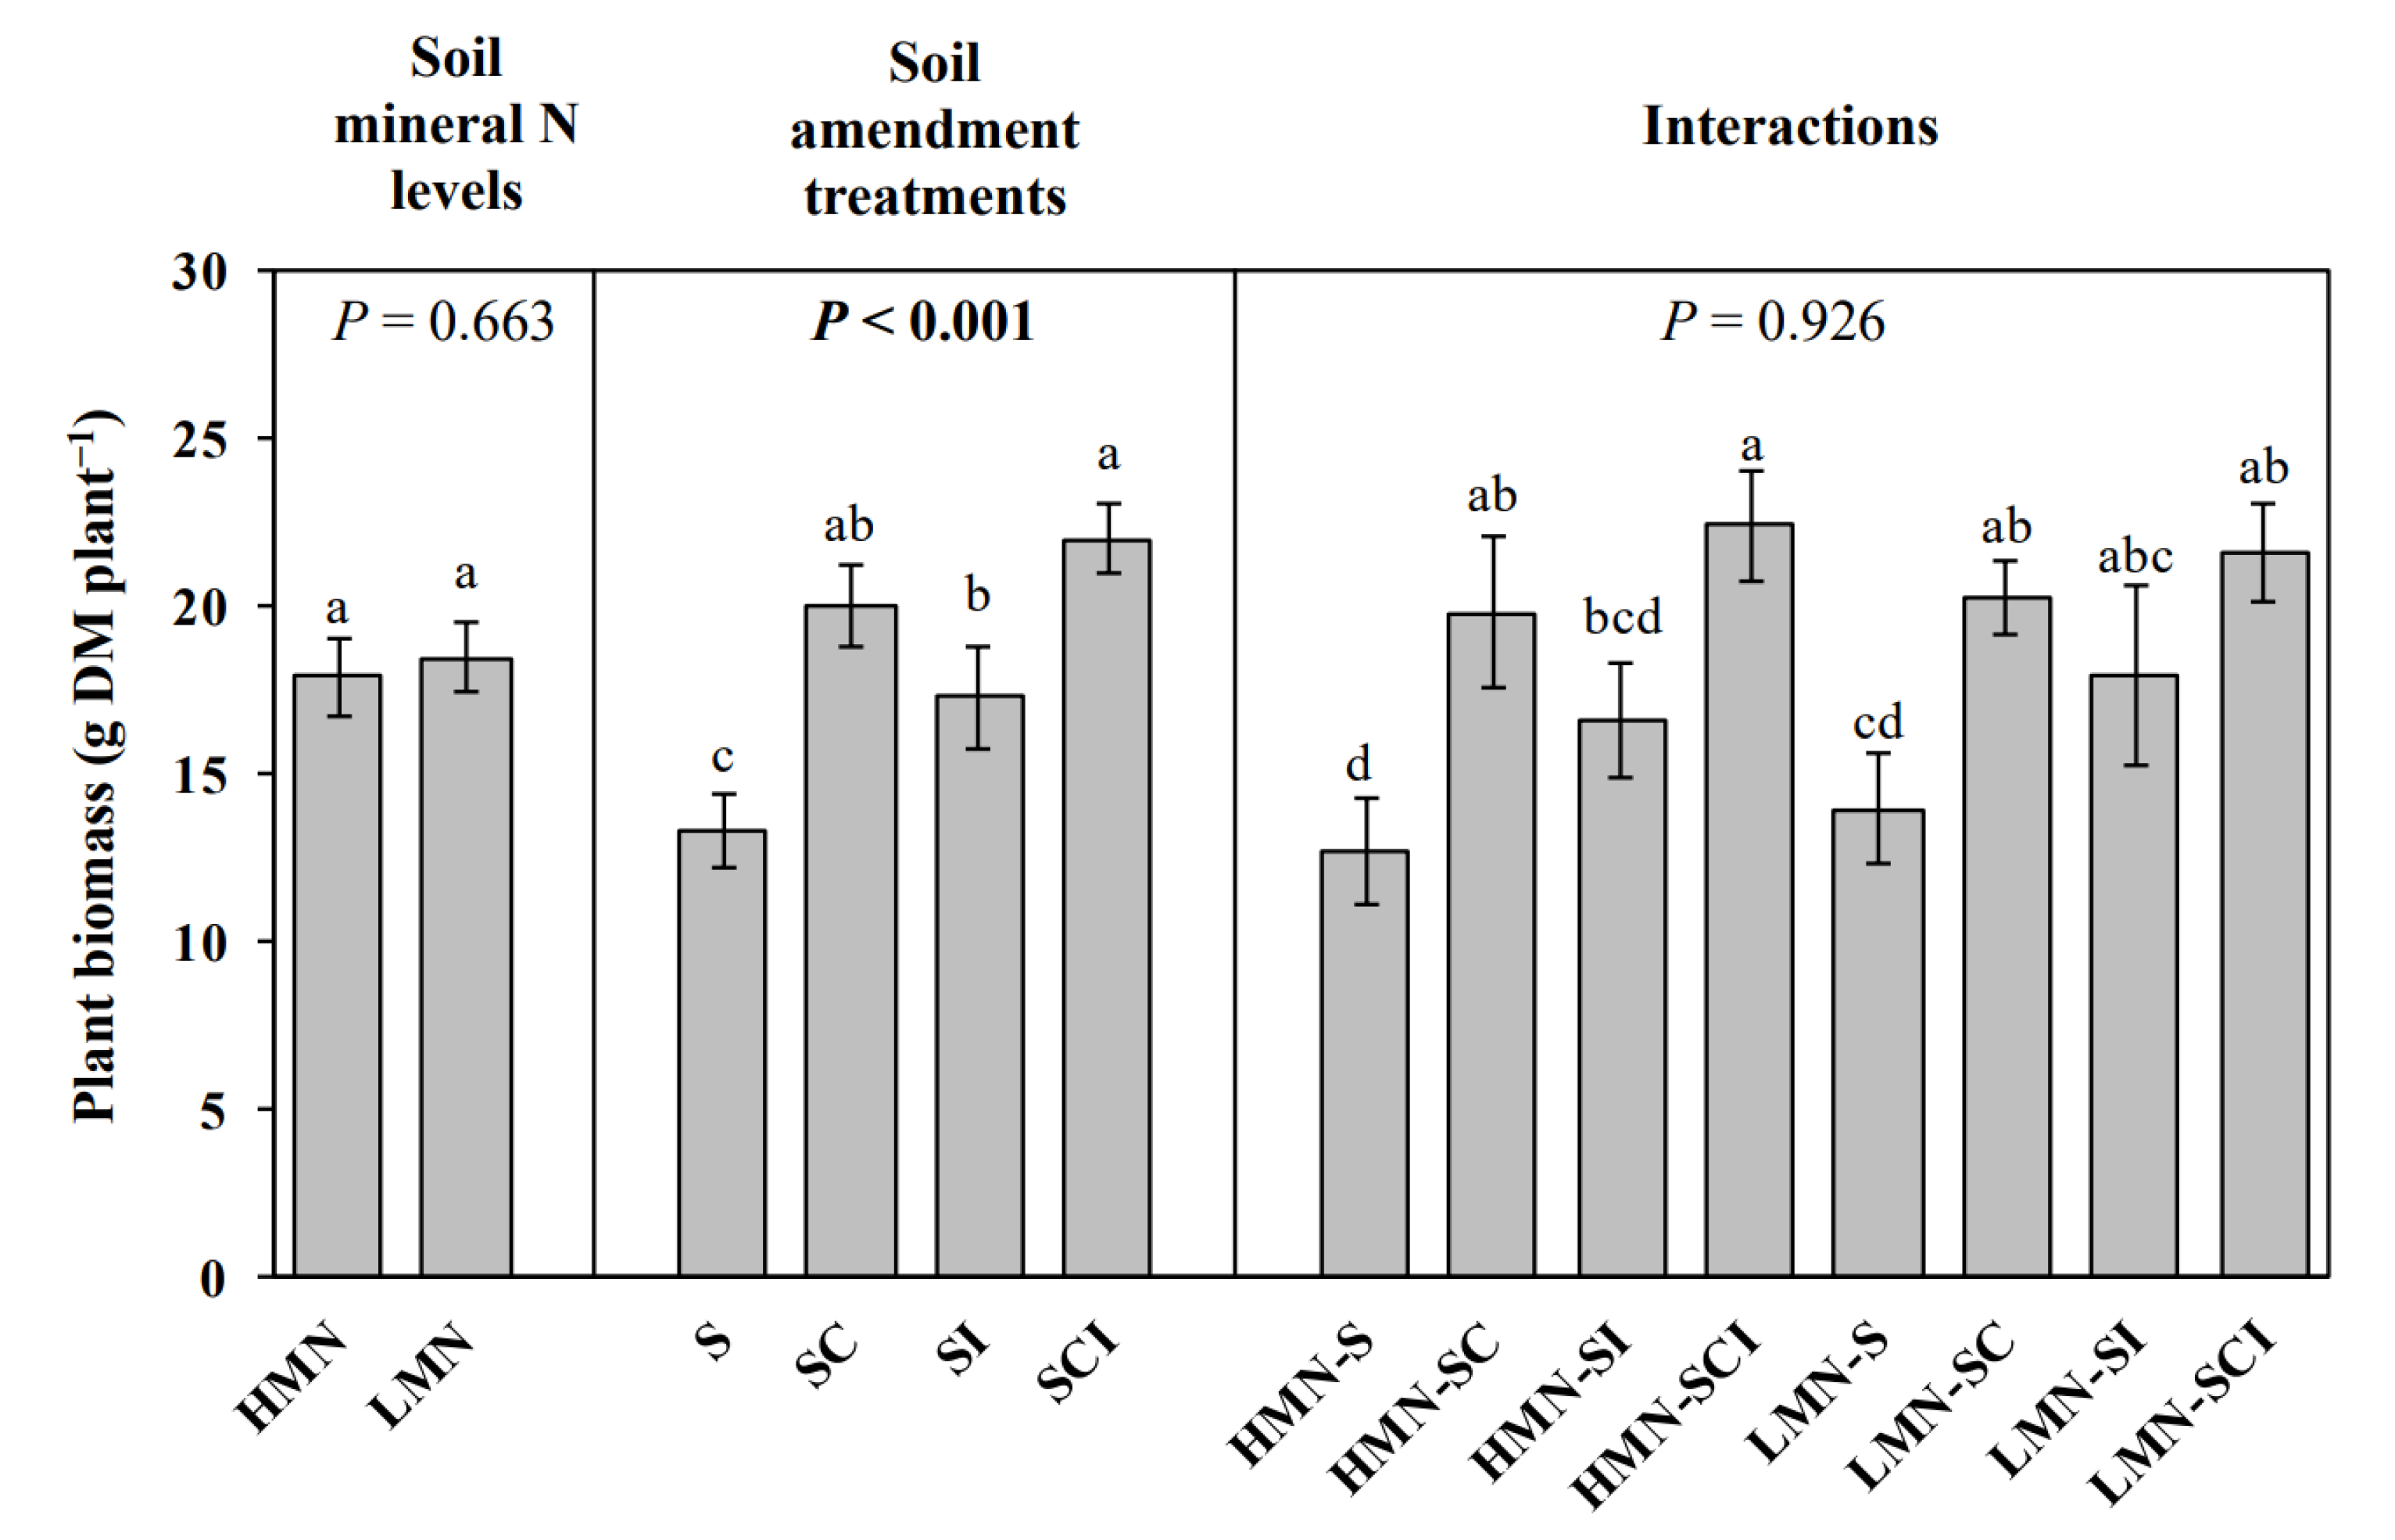
To examine whether there is a separation between the HMN soils and the LMN soils, or among soil amendment treatments in N cycling in cucumber rhizosphere soils, we subjected N cycling gene-related properties and N mineralization data to multivariate analysis and plotted using nonmetric multidimensional scaling (NMS) (Figure 3). The results of NMS showed that the N nitrification and mineralization were the main factors influencing the final ordination solution. Generally, under the same treatment, there was a clear separation between the HMN (closed symbols) and LMN soils (open symbols). Compost addition induced the greatest changes in N cycling in cucumber rhizosphere soils (SCI vs. SI and SC vs. S). However, the effect of bacterial inoculation on changes in soil N cycling was generally not obvious.

3.7. Plant Biomass

Plant biomass was significantly affected with the soil amendment treatments (p < 0.001) rather than the mineral N level of soils (p = 0.663) (Figure 4).
On average, plants were larger (e.g., greater plant biomass) in the compost-treated soils compared to untreated soils (SC vs. S and SCI vs. SI). Similarly, the plant biomass was generally increased by bacteria inoculation (SI vs. S and SCI vs. SC). Plant biomass had a positive correlation with the total microbial biomass, bacteria, and net N mineralization but negatively correlated with archaea and Fusarium oxysporum f. sp. cucumerinum (all p < 0.05; Table 7).

4. Discussion

We investigated rhizosphere soil N cycling of monoculture cucumbers growing in soils that represented various cropping years. For cucumber rhizosphere soil, N cycling was mainly affected by soil mineral N levels. Thus, we quantified how soil mineral N levels influenced microbial populations, N cycling genes, and net N mineralization occurring in cucumber rhizosphere soils.

4.1. Soil Mineral N Level and Microbial Population

Interestingly, the total microbial biomass and bacterial numbers showed an increasing trend in HMN soils compared to LMN soils, but a reverse trend was found for the number of Fusarium oxysporum (Table 4). Similarly, several previous studies also showed that a higher fertility level might induce more disease in plants [26,27]. Although the related mechanisms have remained undeciphered, it is indeed that plant diseases can be affected by the nitrogen form [26]. Additionally, greater Fusarium oxysporum numbers in HMN soils probably resulted from the reduction of either total microbial biomass or bacterial numbers, which may lead to decreased microbial diversity [28]. A recent study [29] demonstrated the critical role played by soil microbial diversity in determining the occurrence of microbial pathogens in soils.

4.2. Soil Mineral N Level and N Cycling

The HMN soils had different abundances of N cycling genes than the LMN soils. Generally, the HMN soils had lower abundances of the AOA amoA and nirS genes (Table 5) but higher net N ammonification, nitrification, and mineralization (Figure 1) compared with the LMN soils. This is inconsistent with established biochemical and microbial physiology principles, because if there is abundant mineral N present, there is no need for microorganisms to expend energy to mineralize and nitrify organic N [30]. In fact, in these HMN soils, the level of mineral N was extremely high compared to many soils where N cycling studies have been conducted [12,31] and, thus, the need for N mineralization in our soils would be even less required.
Surprisingly, although both the AOA and AOB mediate the same microbial process (i.e., ammonia-oxidation), the AOB amoA abundance was not statistically (p = 0.475) affected by the soil mineral N level (Table 5). Since ammonia oxidation was the first step limiting the nitrification rate, it was long thought that this process was driven by the bacterial amoA gene alone [32]. However, there is increasing evidence that archaeal ammonia monooxygenase genes are distributed widely in marine and terrestrial environments [33,34,35]. This has resulted in a revision in the current knowledge regarding N cycling in soils.
The abundance of AOA often exceeds that of AOB in soil systems [34]. However, the present study showed that the amoA had a greater abundance in AOB compared to AOA in both the HMN and LMN soils (Table 5). The results of several recent advanced studies have shown that AOB was often predominant in agricultural soils with a high fertility level [31,36]. Furthermore, the AOA community often has a greater abundance in soils with low fertility level [37,38], similar to our finding that the LMN soils had a greater abundance of AOA amoA gene compared to the HMN soils (Table 5). This may have been due to the fact that the AOA community tends to thrive in environments that are more nutrient limiting [39]
The nirS and nirK genes encode nitrite reductases with similar functions. In this study, the soil mineral N levels significantly (p = 0.016) affected nirS abundance but not nirK abundance (p = 0.980) in the cucumber rhizosphere (Table 5). Several recent studies have suggested that the microorganisms carrying nirS and nirK have different patterns of resource utilization or different habitat preferences [12,40,41]. Our results suggest that the denitrifiers carrying nirS are more adapted to low mineral N conditions, while the nirK bearing denitrifiers are relatively stable in cucumber rhizosphere soils with different mineral N levels. In addition, the HMN and LMN soils in this study contrasted with respect to soil mineral N level (p < 0.05) but not the other tested soil properties (e.g., pH, EC, and most tested nutrients; all p > 0.05; Table 1), indicating that soil mineral N levels may have a profound influence on the composition of the denitrifying communities (e.g., the average nirK/nirS ratio in the HMN and LMN soils was 6.28 and 2.84, respectively; p < 0.001). Several studies have verified that nirS rather than nirK plays an important role in soils under wet conditions [12,42,43]. Similar to this, our results suggest that nirS rather than nirK plays a critical role in soils characterized by low mineral N content (Table 5).
Recent findings have shown that the abundance of genes associated with N cycling can be used to predict the rates of potential nitrification and denitrification [12]. Since the net N nitrification had a significant correlation with the nosZ/nirS and nirK/nirS ratios in the HMN soils (both p < 0.001; Table 6), the increased net N nitrification in cucumber rhizosphere soil may be mediated by the equilibrium between nosZ and nirS and/or between nirK and nirS under soil environments with high mineral N.

4.3. Soil Amendment and N Cycling

Compost addition affected the N cycling in cucumber rhizosphere soils. Generally, the compost-treated soils showed not only higher abundances of the nirK and nosZ genes (Table 5) but also higher net N nitrification and mineralization (Figure 1) (SCI vs. SI and SC vs. S). Because the addition of compost resulted in a significant (p < 0.001) increase in nirK abundance but not nirS abundance (Table 5), nirK but not nirS plays an important ecological role in soils treated with compost. The NosZ gene has been demonstrated as a strong predictor for potential denitrification rates, because its abundance was significantly correlated to potential denitrification rates [12]. This gene can also be strongly affected by environmental factors such as soil organic matter and nitrate [12,40,42]. In this study, the nosZ gene was only significantly affected by the compost addition in the LMN soils but not in the HMN soils (Table 5), which means that the compost addition combined with a low soil mineral N level may enhance potential denitrification rates.

4.4. The Responses of Plant Biomass to Mineral N Level, Amendments and N Cycling

Although the soil mineral N level significantly affected the net N ammonification, nitrification, and mineralization (all p < 0.001; Figure 1), it did not statistically affect the plant biomass at harvest (p = 0.663; Figure 4). This means that, when mineral N content is already high in soils, production of mineral N via N mineralization may exceed the N uptake demands of plants and microorganisms in plant rhizosphere [8], ultimately resulting in increases in soil ecosystem N loss [8,9]. As previously stated, this seems contrary to what would be expected, since the microbial population in rhizospheres of the HMN soils would not need to continue to mineralize N if sufficient amounts were already present. On the other hand, even if plant growth may benefit from soils having high levels of mineral N, the potential of high mineral N level to cause more plant disease may result in negative effect on plant growth (Table 4).
The trend in continued mineralization of N, even in the HMN soils, can be reversed, however, if the HMN soils are amended with compost. Indeed, the compost addition significantly increased both the plant biomass (p < 0.05; Figure 4) and net N nitrification in the HMN soils (p < 0.05; Figure 1). The increased net N nitrification in cucumber rhizosphere soils may result from the increased N uptake demands induced by plant growth [8], removing the nitrate-N pool from the rhizosphere under compost addition treatments compared to the untreated control. The result would be microorganisms striving to restore nitrate in the rhizosphere and, thus, a stimulation of nitrification. In addition, although a high mineral N level has the potential to cause more plant disease, this could be reduced by compost addition (Table 4).

5. Conclusions

In summary, soil mineral N levels strongly influenced N cycling in cucumber rhizosphere soils. Although the high mineral N level tended to increase the net N mineralization, it had the potential to cause more plant disease but less microbial biomass and bacterial numbers in cucumber rhizosphere soil. Plant biomass was not closely associated with the mineral N level of soils, but it could be increased by amending soils with compost addition, which increased net N mineralization but decreased fungal pathogen numbers in cucumber rhizosphere soil.

Author Contributions

Y.C. and Y.T., field research work, data collection, and writing; Y.G. and J.L., data analysis, confirmation and writing correction; Y.T. and J.L., supervision of the research work. All authors have read and agreed to the published version of the manuscript.

Funding

The Key Research and Development Program of Ningxia (2021BBF02005) and the Helan Mountain Scholars Program of Ningxia University.

Institutional Review Board Statement

Not applicable.

Informed Consent Statement

Not applicable.

Data Availability Statement

Not applicable.

Acknowledgments

The authors appreciate the support received from the Key Research and Development Program of Ningxia (2021BBF02005) and the Helan Mountain Scholars Program of Ningxia University.

Conflicts of Interest

The authors declare no conflict of interest.

References

  1. Bennett, A.J.; Bending, G.D.; Chandler, D.; Hilton, S.; Mills, P. Meeting the demand for crop production: The challenge of yield decline in crops grown in short rotations. Biol. Rve. 2012, 87, 52–71. [Google Scholar] [CrossRef] [PubMed]
  2. Ray, D.K.; Ramankutty, N.; Muelle, N.D.; West, P.C.; Foley, J.A. Recent patterns of crop yield growth and stagnation. Nature Commun. 2012, 3, 1293. [Google Scholar] [CrossRef] [PubMed] [Green Version]
  3. Vitousek, P.M.; Naylor, R.; Crews, T.; David, M.B.; Drinkwater, L.E.; Holland, E. Nutrient imbalances in agricultural development. Science 2009, 324, 1519–1520. [Google Scholar] [CrossRef] [PubMed]
  4. Guo, R.; Li, X.; Christie, P.; Chen, Q.; Jiang, R.; Zhang, F. Influence of root zone nitrogen management and a summer catch crop on cucumber yield and soil mineral nitrogen dynamics in intensive production systems. Plant Soil 2008, 313, 55–70. [Google Scholar] [CrossRef] [Green Version]
  5. Chalhoub, M.; Garnier, P.; Coquet, Y.; Mary, B.; Lafolie, F.; Houot, S. Increased nitrogen availability in soil after repeated compost applications: Use of the PASTIS model to separate short and long-term effects. Soil Biol. Biochem. 2013, 65, 144–157. [Google Scholar] [CrossRef] [Green Version]
  6. Hadar, Y. Suppressive compost: When plant pathology met microbial ecology. Phytoparasitica 2011, 39, 311–314. [Google Scholar] [CrossRef] [Green Version]
  7. Sant, D.; Casanova, E.; Segarra, G.; Avilés, M.; Reis, M.; Trillas, M.I. Effect of Trichoderma asperellum strain T34 on Fusarium wilt and water usage in carnation grown on compost-based growth medium. Biol. Control 2010, 53, 291–296. [Google Scholar] [CrossRef]
  8. Pardo, L.H.; Templer, P.H.; Goodale, C.L.; Duke, S.; Groffman, P.M.; Adams, M.B. Regional assessment of N saturation using foliar and root δ15 N. Biogeochemistry 2006, 80, 143–171. [Google Scholar] [CrossRef]
  9. Liu, X.; Zhang, Y.; Han, W.; Tang, A.; Shen, J.; Cui, Z. Enhanced nitrogen deposition over China. Nature 2013, 494, 459–462. [Google Scholar] [CrossRef]
  10. Tian, Y.; Liu, J.; Zhang, X.; Gao, L. Effects of summer catch crop, residue management, soil temperature and water on the succeeding cucumber rhizosphere nitrogen mineralization in intensive production systems. Nut. Cycl. Agroecosyst. 2010, 88, 429–446. [Google Scholar] [CrossRef]
  11. Wankel, S.D.; Mosier, A.C.; Hansel, C.M.; Paytan, A.; Francis, C.A. Spatial variability in nitrification rates and ammonia-oxidizing microbial communities in the agriculturally impacted Elkhorn Slough estuary, California. Appl. Environ. Microbiol. 2011, 77, 269–280. [Google Scholar] [CrossRef] [PubMed] [Green Version]
  12. Petersen, D.G.; Blazewicz, S.J.; Firestone, M.; Herman, D.J.; Turetsky, M.; Waldrop, M. Abundance of microbial genes associated with nitrogen cycling as indices of biogeochemical process rates across a vegetation gradient in Alaska. Environ. Microbiol. 2012, 14, 993–1008. [Google Scholar] [CrossRef] [PubMed]
  13. Kalembasa, S.J.; Jenkinson, D.S. A comparative study of titrimetric and gravimetric methods for the determination of organic carbon in soil. J. Sci. Food Agri. 1973, 24, 1085–11090. [Google Scholar] [CrossRef]
  14. Bremner, J.M. Nitrogen-Total. In Methods of Soil Analysis. Part 3-Chemical Methods; Sparks, D.L., Ed.; SSSA: Madison, WI, USA, 1996; pp. 1085–1121. [Google Scholar]
  15. Kandeler, E.; Gerber, H. Short-term assay of soil urease activity using colorimetric determination of ammonium. Biol. Fert. Soils 1988, 6, 68–72. [Google Scholar] [CrossRef]
  16. Miranda, K.M.; Espey, M.G.; Wink, D.A. A rapid, simple spectrophotometric method for simultaneous detection of nitrate and nitrite. Nitric Oxide 2001, 5, 62–71. [Google Scholar] [CrossRef]
  17. Olsen, S.R.; Cole, C.V.; Watanabe, F.S.; Dean, L.A. Estimation of Available Phosphorus in Soils by Extraction with Sodium Bicarbonate; Government Printing Office, USDA: Washington, DC, USA, 1954; Volume 939.
  18. Sparks, D.L.; Huang, P.M. Physical chemistry of soil potassium. In Potassium in Agriculture; Munson, R.E., Ed.; ASA, CSSA and SSSA: Madison, WI, USA, 1985; pp. 201–276. [Google Scholar]
  19. Chung, S.; Kong, H.; Buyer, J.S.; Lakshman, D.K.; Lydon, J.; Kim, S.D.; Roberts, D.P. Isolation and partial characterization of Bacillus subtilis ME488 for suppression of soilborne pathogens of cucumber and pepper. Appl. Microbiol. Biotechnol. 2008, 280, 115–123. [Google Scholar] [CrossRef]
  20. Chen, X.P.; Zhu, Y.G.; Xia, Y.; Shen, J.P.; He, J.Z. Ammonia-oxidizing archaea: Important players in paddy rhizosphere soil? Environ. Microbiol. 2008, 10, 1978–1987. [Google Scholar] [CrossRef]
  21. Robertson, G.P.; Wedin, D.; Groffman, P.M.; Blair, J.M.; Holland, E.A.; Nadelhoffer, K.J.; Harris, D. Soil carbon and nitrogen availability. In Standard Soil Methods for Long-Term Ecological Research; Robertson, G.P., Bledsoe, C.S., Coleman, D.C., Sollins, P., Eds.; Oxford University Press: New York, NY, USA, 1999; pp. 258–265. [Google Scholar]
  22. Ter Braak, C.J. Canonical correspondence analysis: A new eigenvector technique for multivariate direct gradient analysis. Ecology 1986, 67, 1167–1179. [Google Scholar] [CrossRef] [Green Version]
  23. Oksanen, J.; Blanchet, F.G.; Kindt, R.; Legendre, P.; Minchin, P.R.; O’Hara, R.B. Package ‘Vegan’, Community Ecology Package. Version 2.0-8. Available online: http://cran.r-project.org (accessed on 18 October 2013).
  24. Grandin, U. PC-ORD version 5: A user-friendly toolbox for ecologists. J. Veg. Sci. 2006, 17, 843–844. [Google Scholar] [CrossRef]
  25. Brockett, B.F.; Prescott, C.E.; Grayston, S.J. Soil moisture is the major factor influencing microbial community structure and enzyme activities across seven biogeoclimatic zones in western Canada. Soil Biol. Biochem. 2012, 44, 9–20. [Google Scholar] [CrossRef]
  26. Huber, D.M.; Watson, R.D. Nitrogen form and plant disease. Annu. Rev. Phytopathol. 1974, 12, 139–165. [Google Scholar] [CrossRef] [PubMed]
  27. Van Bruggen, A.H.C. Plant disease severity in high-input compared to reduced-input and organic farming systems. Plant Dis. 1995, 79, 976–984. [Google Scholar] [CrossRef]
  28. Garbeva, P.; Van Veen, G.A.; Van Elsas, J.D. Microbial diversity in soil: Selection of microbial populations by plant and soil type and implications for disease suppressiveness. Annu. Rev. Phytopathol. 2004, 42, 243–270. [Google Scholar] [CrossRef] [PubMed]
  29. van Elsas, J.D.; Chiurazzi, M.; Mallon, C.A.; Elhottovā, D.; Krištůfek, V.; Salles, J.F. Microbial diversity determines the invasion of soil by a bacterial pathogen. Proc. Natl. Acad. Sci. USA 2012, 109, 1159–1164. [Google Scholar] [CrossRef] [Green Version]
  30. Manzoni, S.; Porporato, A. Soil carbon and nitrogen mineralization: Theory and models across scales. Soil Biol. Biochem. 2009, 41, 1355–1379. [Google Scholar] [CrossRef]
  31. Di, H.J.; Cameron, K.C.; Shen, J.P.; Winefield, C.S.; O’Callaghan, M.; Bowatte, S.; He, J.Z. Nitrification driven by bacteria and not archaea in nitrogen-rich grassland soils. Nat. Geosci. 2009, 2, 621–624. [Google Scholar] [CrossRef]
  32. Kowalchuk, G.A.; Stephen, J.R. Ammonia-oxidizing bacteria: A model for molecular microbial ecology. Annu. Rev. Microbiol. 2001, 55, 485–529. [Google Scholar] [CrossRef] [Green Version]
  33. Francis, C.A.; Roberts, K.J.; Beman, J.M.; Santoro, A.E.; Oakley, B.B. Ubiquity and diversity of ammonia-oxidizing archaea in water columns and sediments of the ocean. Proc. Natl. Acad. Sci. USA 2005, 102, 14683–14688. [Google Scholar] [CrossRef] [Green Version]
  34. Leininger, S.; Urich, T.; Schloter, M.; Schwark, L.; Qi, J.; Nicol, G.W.; Prosser, J.I.; Schuster, S.C.; Schleper, C. Archaea predominate among ammonia-oxidizing prokaryotes in soils. Nature 2006, 442, 806–809. [Google Scholar] [CrossRef]
  35. Zhang, L.M.; Offre, P.R.; He, J.Z.; Verhamme, D.T.; Nicol, G.W.; Prosser, J.I. Autotrophic ammonia oxidation by soil thaumarchaea. Proc. Natl. Acad. Sci. USA 2010, 107, 17240–17245. [Google Scholar] [CrossRef] [Green Version]
  36. Jia, Z.; Conrad, R. Bacteria rather than Archaea dominate microbial ammonia oxidation in an agricultural soil. Environ. Microbiol. 2009, 11, 1658–1671. [Google Scholar] [CrossRef] [PubMed]
  37. Tourna, M.; Freitag, T.E.; Nicol, G.W.; Prosser, J.I. Growth, activity and temperature responses of ammonia-oxidizing archaea and bacteria in soil microcosms. Environ. Microbiol. 2008, 10, 1357–1364. [Google Scholar] [CrossRef] [PubMed]
  38. Schleper, C. Ammonia oxidation: Different niches for bacteria and archaea? ISME J. 2010, 4, 1092–1094. [Google Scholar] [CrossRef] [PubMed]
  39. Valentine, D.L. Adaptations to energy stress dictate the ecology and evolution of the Archaea. Nat. Rev. Microbiol. 2007, 5, 316–323. [Google Scholar] [CrossRef]
  40. Hallin, S.; Jones, C.M.; Schloter, M.; Philippot, L. Relationship between N-cycling communities and ecosystem functioning in a 50-year-old fertilization experiment. ISME J. 2009, 3, 597–605. [Google Scholar] [CrossRef]
  41. Knapp, C.W.; Dodds, W.K.; Wilson, K.C.; O’Brien, J.M.; Graham, D.W. Spatial heterogeneity of denitrification genes in a highly homogenous urban stream. Environ. Sci. Technol. 2009, 43, 4273–4279. [Google Scholar] [CrossRef]
  42. Philippot, L.; Cuhel, J.; Saby, N.P.A.; Cheneby, D.; Chrona-kova, A.; Bru, D.; Arrouays, D.; Martin-Laurent, F.; Simek, M. Mapping field-scale spatial patterns of size and activity of the denitrifier community. Environ. Microbiol. 2009, 11, 1518–1526. [Google Scholar] [CrossRef]
  43. Abell, G.C.J.; Revill, A.T.; Smith, C.; Bissett, A.P.; Volkman, J.K.; Robert, S.S. Archaeal ammonia oxidizers and nirS-type denitrifiers dominate sediment nitrifying and denitrifying populations in a subtropical macrotidal estuary. ISME J. 2010, 4, 286–300. [Google Scholar] [CrossRef]
Figure 1. Net N ammonification (A), nitrification (B), and mineralization (C) in the high (HMN) and low mineral N (LMN) soils under the S (control soil), SC (soil treated with straw compost), SI (soil treated with bacterial inoculation), and SCI (soil treated with straw compost combined with bacterial inoculation) treatments. Different letters denote a significant difference (p ≤ 0.05). p-Values in bold text denote significant differences among treatments (p < 0.05). Bars denote the means ± SE.
Plants 11 01621 g001
Figure 2. CCA plots for N cycling genes and N mineralization associated with cucumber rhizosphere soils with (A) high (HMN) or (B) low mineral N (LMN) levels. The diagrams representing the CCA models were generated with standardized parameters based on F-statistic significant tests. The blue lines’ length and angle were used to reflect correlations among CCA axes and N mineralization processes. amoA denotes the gene for ammonia oxidizing (AO) bacteria (AOA) or archaea (AOB); nirK and nirS represent genes for nitrate reducers; nosZ is the gene for denitrifer.
Plants 11 01621 g002
Figure 3. NMS plots for N cycling gene-related properties (the main matrix) and N mineralization data (the second matrix) (n = 144) in the high (HMN) and low mineral N (LMN) soils under the S (control soil), SC (soil treated with straw compost), SI (soil treated with bacterial inoculation), and SCI (soil treated with straw compost combined with bacterial inoculation) treatments. The red lines’ length and angle were used to reflect correlations between NMS axes and the N nitrification and mineralization.
Plants 11 01621 g003
Figure 4. Plant biomass in the high (HMN) and low mineral N (LMN) soils under the S (control soil), SC (soil treated with straw compost), SI (soil treated with bacterial inoculation), and SCI (soil treated with straw compost combined with bacterial inoculation) treatments. Different letters denote a significant difference (p ≤ 0.05). p-Values in bold text denote the significant differences among treatments (p < 0.05). Bars denote the means ± SE. DM represents dry matter.
Plants 11 01621 g004
Table 1. The selected properties of twelve cucumber soils from various cropping years.
Mineral N LevelSoil Codes aCropping
Years
Organic
Matter
Total
Nitrogen
Ammonium
Nitrogen
Nitrate
Nitrogen
Mineral
Nitrogen
Available
Phosphorus
Available
Potassium
pHElectrical
Conductivity
(g kg−1)(g kg−1)(mg kg−1)(mg kg−1)(mg kg−1)(mg kg−1)(mg kg−1) (mS cm−1)
LMN aSoil-120 years25.6 ± 0.81.57 ± 0.096.63 ± 0.2850.8 ± 0.857.4 ± 3.4144 ± 5599 ± 277.09 ± 0.480.50 ± 0.01
Soil-216 years9.10 ± 0.10.55 ± 0.0212.4 ± 0.4260.5 ± 3.672.9 ± 4.6148 ± 5450 ± 197.16 ± 0.070.39 ± 0.03
Soil-522 years29.3 ± 1.12.66 ± 0.1711.2 ± 0.1733.6 ± 1.344.8 ± 2.4104 ± 6314 ± 97.52 ± 0.370.50 ± 0.01
Soil-77 years13.7 ± 1.00.84 ± 0.037.22 ± 0.0442.0 ± 1.749.2 ± 1.779.1 ± 2.931.0 ± 27.46 ± 0.050.40 ± 0.02
Soil-81 year15.3 ± 1.10.93 ± 0.017.32 ± 0.4064.9 ± 4.072.2 ± 2.8167 ± 148.3 ± 0.17.44 ± 0.350.57 ± 0.02
Soil-123 years19.2 ± 1.01.18 ± 0.038.02 ± 0.3570.3 ± 4.578.3 ± 0.3176 ± 11132 ± 36.75 ± 0.470.84 ± 0.03
HMN bSoil-310 years19.0 ± 0.31.16 ± 0.0216.8 ± 0.4285 ± 6303 ± 16113 ± 3500 ± 67.15 ± 0.231.30 ± 0.09
Soil-44 years25.6 ± 0.91.89 ± 0.038.40 ± 0.3896.1 ± 1.1104 ± 766.1 ± 4374 ± 217.31 ± 0.350.61 ± 0.02
Soil-615 years11.8 ± 0.10.76 ± 0.0310.4 ± 0.5143 ± 11153 ± 9131 ± 2238 ± 127.51 ± 0.140.76 ± 0.01
Soil-918 years20.8 ± 1.21.27 ± 0.0212.8 ± 0.2241 ± 14254 ± 16341 ± 7293 ± 206.28 ± 0.071.75 ± 0.03
Soil-1012 years27.8 ± 0.82.90 ± 0.1727.1 ± 0.8657 ± 21684 ± 27358 ± 5687 ± 305.87 ± 0.155.52 ± 0.43
Soil-115 years20.3 ± 0.21.21 ± 0.5714.9 ± 0.6162 ± 6177 ± 14137 ± 2230 ± 26.41 ± 0.431.17 ± 0.07
Means cLMN 18.7 ± 3.11.29 ± 0.318.80 ± 0.9853.7 ± 5.862.5 ± 5.7136 ± 15262 ± 947.24 ± 0.120.53 ± 0.07
HMN 20.9 ± 2.31.53 ± 0.3015.1 ± 2.7264 ± 83279 ± 86191 ± 51387 ± 736.76 ± 0.271.85 ± 0.75
p-Value 0.5830.5910.0540.0310.0310.3300.3200.1330.111
a Soils 1, 2, 5, 7, 8, and 12 were designated low mineral N (LMN) soils (total mineral N < 100 mg kg−1 soil). b Soils 3, 4, 5, 9, 10, and 11 were designated high mineral N (HMN) soils (total mineral N > 100 mg kg−1 soil). c Means between LMN and HMN soils were significantly (p < 0.05) different for NO3-N and total mineral N but not for other variables measured.
Table 2. The characteristics of the straw compost used to amend soils.
DNA ExtractMicrobial Properties a (Gene Copies (g−1 Dry Compost))
(μg DNA g−1 Dry Compost)BacteriaFungiArchaeaAOB amoAAOA amoAnirKnirSnosZ
16.26 ± 3.147.05 × 1012
± 0.52 × 10¹²
1.25 × 10¹²
± 0.02 × 10¹²
2.76 × 10¹⁰
± 0.06 × 10¹⁰
6.20 × 10⁸
± 0.12 × 10⁸
1.01 × 10⁷
± 0.07 × 10⁷
2.54 × 10⁸
± 0.11 × 10⁸
7.75 × 10⁹
± 0.29 × 10⁹
7.87 × 10⁹
± 0.09 × 10⁹
Organic
carbon
Total
nitrogen
Ammonium
nitrogen
Nitrate
nitrogen
Mineral
nitrogen
Available
phosphorus
Available
potassium
pHElectrical
conductivity
(g kg−1)(g kg−1)(g kg−1)(g kg−1)(g kg−1)(g kg−1)(g kg−1) (mS cm−1)
297.9 ± 6.317.11 ± 0.460.17 ± 0.011.90 ± 0.092.07 ± 0.143.58 ± 0.2316.35 ± 1.316.25 ± 0.214.05 ± 0.03
a The abundances of various genes were measured using qPCR. The numbers of bacteria, fungi, and archaea were measured based on quantifying small subunit rRNA genes. amoA denotes the gene for ammonia oxidizing (AO) bacteria (AOA) or archaea (AOB); nirK and nirS represent genes for nitrate reducers; nosZ is the gene for denitrifer.
Table 3. The specific primers and qPCR conditions for the tested genes.
TargetPrimer NamePrimer Sequence 5’ to 3’Fragment LengthThermal ProfileNumber of CyclesReference
BacteriaEub338ACTCCTACGGGAGGCAGCAG181 bp95 °C-5 min 1Fierer et al. (2005)
Petersen et al. (2012)
Eub518ATTACCGCGGCTGCTGG95 °C-60 s/53 °C-30 s/
72 °C-60 s
40
Fungi5.8 sCGCTGCGTTCTTCATCG300 bp 95 °C-5 min1Fierer et al. (2005)
ITS1fTCCGTAGGTGAACCTGCGG95 °C-60 s/53 °C-30 s/
72 °C-60 s
40
ArchaeaArch344TTCGCGCCTGSTGCRCCCCG572 bp95 °C-3 min1Mori et al. (2003)
Petersen et al. (2012)
Arch915GTGCTCCCCCGCCAATTCCT95 °C-30 s/65 °C-30 s/
72 °C-45 s
40
AOB amoAamoA1FGGGGTTTCTACTGGTGGT491 bp94 °C-5 min1Rotthauwe et al. (1997)
Petersen et al. (2012)
amoA2RCCCCTCKGSAAAGCCTTCTTC94 °C-30 s/55 °C-45 s/
72 °C-60 s
40
AOA amoAArch-amoAFSTAATGGTCTGGCTTAGACG635 bp94 °C-5 min1Francis et al. (2005)
Petersen et al. (2012)
Arch-amoARGCGGCCATCCATCTGTATGT94 °C-30 s/53 °C-45 s/
72 °C-60 s
40
nirKNirK876
NirK1040
ATYGGCGGVAYGGCGA
GCCTCGATCAGRTTRTGGTT
165 bp95 °C-5 min1Henry et al. (2004)
Petersen et al. (2012)
95 °C-15 s/63–58 °C-30 s/
72 °C-30 s
6 (touchdown)
95 °C-15 s/58 °C-30 s/72 °C-30 s40
niSCd3FGT(C/G)AACGT(C/G)AAGGA(A/G)
AC(C/G)GG
407 bp95 °C-5 min
95 °C-15 s/63–58 °C-30 s/
72 °C-30 s
95 °C-15 s/58 °C-30 s/72 °C-30 s
1
6 (touchdown)
40
Michotey et al. (2000)
Throbäck et al. (2004)
Petersen et al. (2012)
R3cdGA(C/G)TTCGG(A/G)TG(C/G)GTCT
TGA
nosZNosZ2F
NosZ2R
CGCRACGGCAASAAGGTSMSSGT
CAKRTGCAKSGCRTGGCAGAA
267 bp95 °C-5 min1Henry et al. (2006)
Petersen et al. (2012)
95 °C-30 s/65–60 °C-30 s/
72 °C-30 s
6 (touchdown)
95 °C-15 s/60 °C-15 s/
72 °C-30 s
40
BacillusBsub5FAAGTCGAGCGGACAGATGG595 bp95 °C-5 min1Wattiau et al. (2001)
subtilisBsub3RCCAGTTTCCAATGACCCTCCCC95 °C-60 s/65 °C-30 s/
72 °C-60 s
40
F. oxysporum
f. sp. cucumerinum
FocF3
FocR7
AAACGAGCCCGCTATTTGAG
TATTTCCTCCACATTGCCATG
244 bp95 °C-5 min
95 °C-15 s/60 °C-45 s/
72 °C-60 s
1
40
Lievens et al. (2007)
Table 4. Total microbial biomass and the number of selected microorganisms as affected by soil mineral N levels and soil amendment treatments.
Treatments aTotal Microbial
Biomass b
Selected Microorganisms (Genes g−1 Soil)
(×103 DNA ng g−1 Soil)Bacteria
(×109)
Fungi
(×109)
Archaea
(×108)
Bacillus subtilis
(×108)
Fusarium oxysporum f. sp. Cucumerinum
(×105)
Soil mineral N levels:
HMN9.57 b c10.61 b7.296.911.6115.01 a
LMN11.01 a14.12 a7.819.531.931.53 b
p-Value d0.0000.0000.4500.0960.0910.038
Soil amendment treatments:
S8.16 c10.23 b5.15 b10.011.91 ab26.52 a
SC12.02 a14.36 a10.01 a6.101.43 b2.03 b
SI9.18 b10.21 b6.09 b9.412.12 a1.89 b
SCI11.71 a14.50 a8.93 a7.231.51 b2.59 b
p-Value0.0000.0000.0000.2350.0190.024
Interactions:
HMN-S7.77 e8.40 c5.85 cd8.40 ab1.41 bc51.90 a
HMN-SC11.53 b12.04 bc9.03 ab4.30 b1.00 c2.57 b
HMN-SI8.99 cde9.85 bc7.65 bc9.11 ab2.42 a2.79 b
HMN-SCI10.10 c12.23 b6.63 bcd5.82 ab1.49 bc2.66 b
LMN-S8.55 de12.02 b4.46 d11.71 a2.45 a1.11 b
LMN-SC12.60 ab16.60 a11.02 a8.03 ab1.87 ab1.49 b
LMN-SI9.36 cd10.62 bc4.54 d9.70 ab1.85 ab0.99 b
LMN-SCI13.31 a16.91 a11.21 a8.52 ab1.44 bc2.53 b
p-Value0.0070.3980.0010.8930.0080.019
a HMN: high mineral nitrogen; LMN: high mineral nitrogen; S: control soil; SC: soil treated with straw compost; SI: soil treated with bacterial inoculation; SCI: soil treated with straw compost combined with bacterial inoculation. b Total microbial biomass was represented by extracted DNA. c Different letters in the same column denote a significant difference (p ≤ 0.05). d p-Values in bold text denote significant differences among treatments (p < 0.05).
Table 5. Abundance of selected nitrogen cycling genes as affected by soil mineral N levels and soil amendment treatments.
Treatments aSelected N Cycling Genes b (Genes g−1 Soil)AOB/AOA
AOB amoA (×106)AOA amoA (×106)nirK (×107)nirS (×107)nosZ (×107)
Soil mineral N levels:
HMN4.522.24 b c3.802.34 b6.161.92 a
LMN5.003.32 a3.794.67 a6.811.46 b
p-Value d0.4750.0000.9800.0160.2360.029
Soil amendment treatments:
S4.902.61 3.03 b4.135.95 b1.79 a
SC4.452.92 4.34 a2.737.79 a1.45 b
SI5.772.68 3.51 b3.785.56 b2.13 a
SCI3.922.90 4.29 a3.406.63 ab1.39 b
p-Value0.2560.6530.0000.7570.0230.048
Interactions:
HMN-S4.50 ab2.02 d3.42 c1.51 bc6.14 abc2.01 a
HMN-SC3.70 b2.38 cd4.50 ab0.88 c7.32 abc1.47 b
HMN-SI6.55 a2.10 d4.05 bc2.26 bc5.84 bc2.76 a
HMN-SCI3.32 b2.45 bcd3.22 cd4.71 ab5.34 c1.43 b
LMN-S5.30 ab3.20 abc2.65 d6.76 a5.76 c1.57 b
LMN-SC5.20 ab3.46 a4.19 bc4.56 abc8.27 a1.44 b
LMN-SI5.00 ab3.27 ab2.96 d5.30 ab5.29 c1.49 b
LMN-SCI4.51 ab3.35 a5.36 a2.08 bc7.91 ab1.34 b
p-Value0.3690.9660.0000.0250.1510.041
a HMN: high mineral nitrogen; LMN: high mineral nitrogen; S: control soil; SC: soil treated with straw compost; SI: soil treated with bacterial-inoculation; SCI: soil treated with straw compost combined with bacterial inoculation. b amoA denotes the gene for ammonia oxidizing (AO) bacteria (AOA) or archaea (AOB); nirK and nirS represent genes for nitrate reducers; nosZ is the gene for denitrifer. c Different letters in the same column denote a significant difference (p ≤ 0.05). d p-Values in bold text denote the significant differences among treatments (p < 0.05).
Table 6. Pearson correlations coefficient (r) reflecting the responses of N cycling genes to net N ammonification, nitrification, and mineralization (n = 24).
N Cycling Genes aHMN bLMN
Net N
Ammonification
Net N
Nitrification
Net N
Mineralization
Net N
Ammonification
Net N
Nitrification
Net N
Mineralization
AOB amoA−0.395 ***c−0.137−0.180−0.213−0.144−0.221
AOA amoA−0.500 ***−0.005−0.0570.1190.0530.093
AOB + AOA−0.446 ***−0.119−0.167−0.130−0.097−0.145
nirK−0.0570.1310.1260.276 *−0.0470.030
nirS−0.175−0.019−0.038−0.259 *0.1430.081
nirK + nirS−0.2080.018−0.203−0.222−0.1620.113
nosZ−0.405 ***−0.113 −0.1570.384 ***0.0060.120
AOB/AOA−0.270 *−0.151 −0.181−0.267 *−0.248 *−0.351 **
nosZ/nirK−0.408 ***−0.149 −0.1940.0760.1420.179
nosZ/nirS0.2020.479 ***0.506 ***−0.0890.1930.187
nosZ/(nirK + nirS)−0.275 *−0.079−0.1080.375 ***−0.0970.004
nirK/nirS0.315 **0.448 ***0.487 ***−0.1720.2310.203
aamoA denotes the gene for ammonia oxidizing (AO) bacteria (AOA) or archaea (AOB); nirK and nirS represent genes for nitrate reducers; nosZ is the gene for denitrifer. b HMN: high mineral nitrogen; LMN: high mineral nitrogen. c Values in bold are statistically significant at p < 0.05. * p < 0.05, ** p < 0.01, and *** p < 0.001.
Table 7. Pearson correlation coefficients (r) reflecting the response of plant biomass to cumulative net N mineralization in cucumber rhizosphere soils (n = 48).
Total Microbial
Biomass
BacteriaFungiArchaeaFusarium oxysporum f. sp. cucumerinumNet N
Mineralization
r0.5150.4230.060−0.385−0.3900.599
p-Value<0.001 a0.0030.6850.0070.006<0.001
a p-Values in bold text denote the significant differences among treatments (p < 0.05).
Publisher’s Note: MDPI stays neutral with regard to jurisdictional claims in published maps and institutional affiliations.

