
Impacts of Anthropogenic Disturbance on Vegetation Dynamics: A Case Study of Wadi Hagul, Eastern Desert, Egypt


Abstract
1. Introduction
2. Materials and Methods
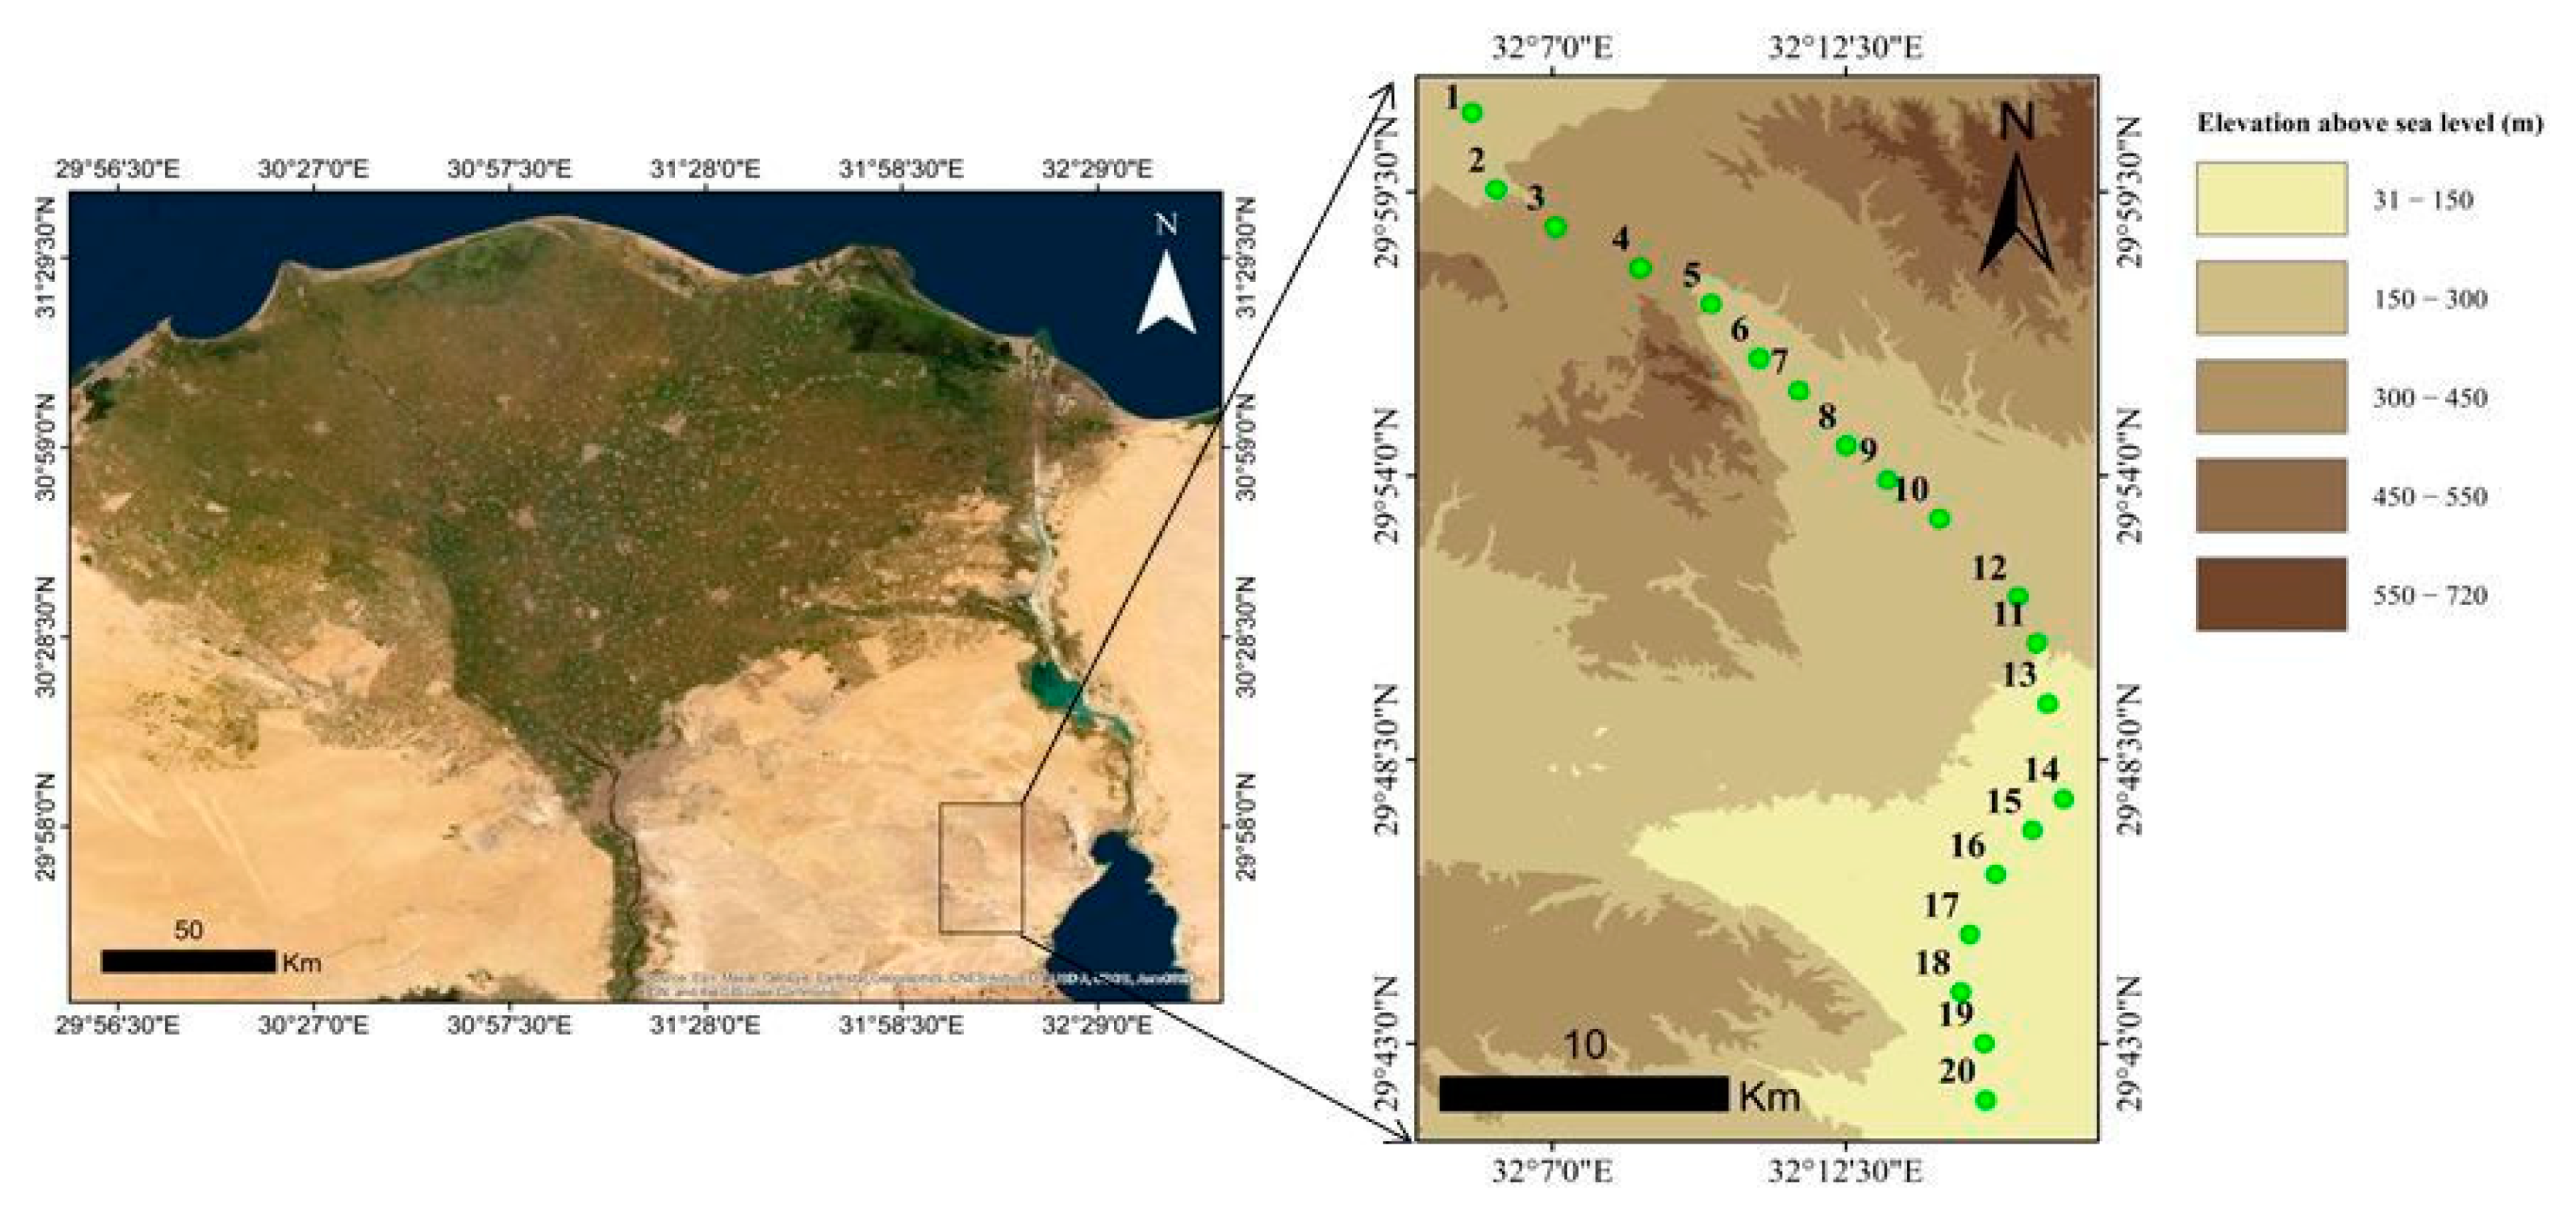
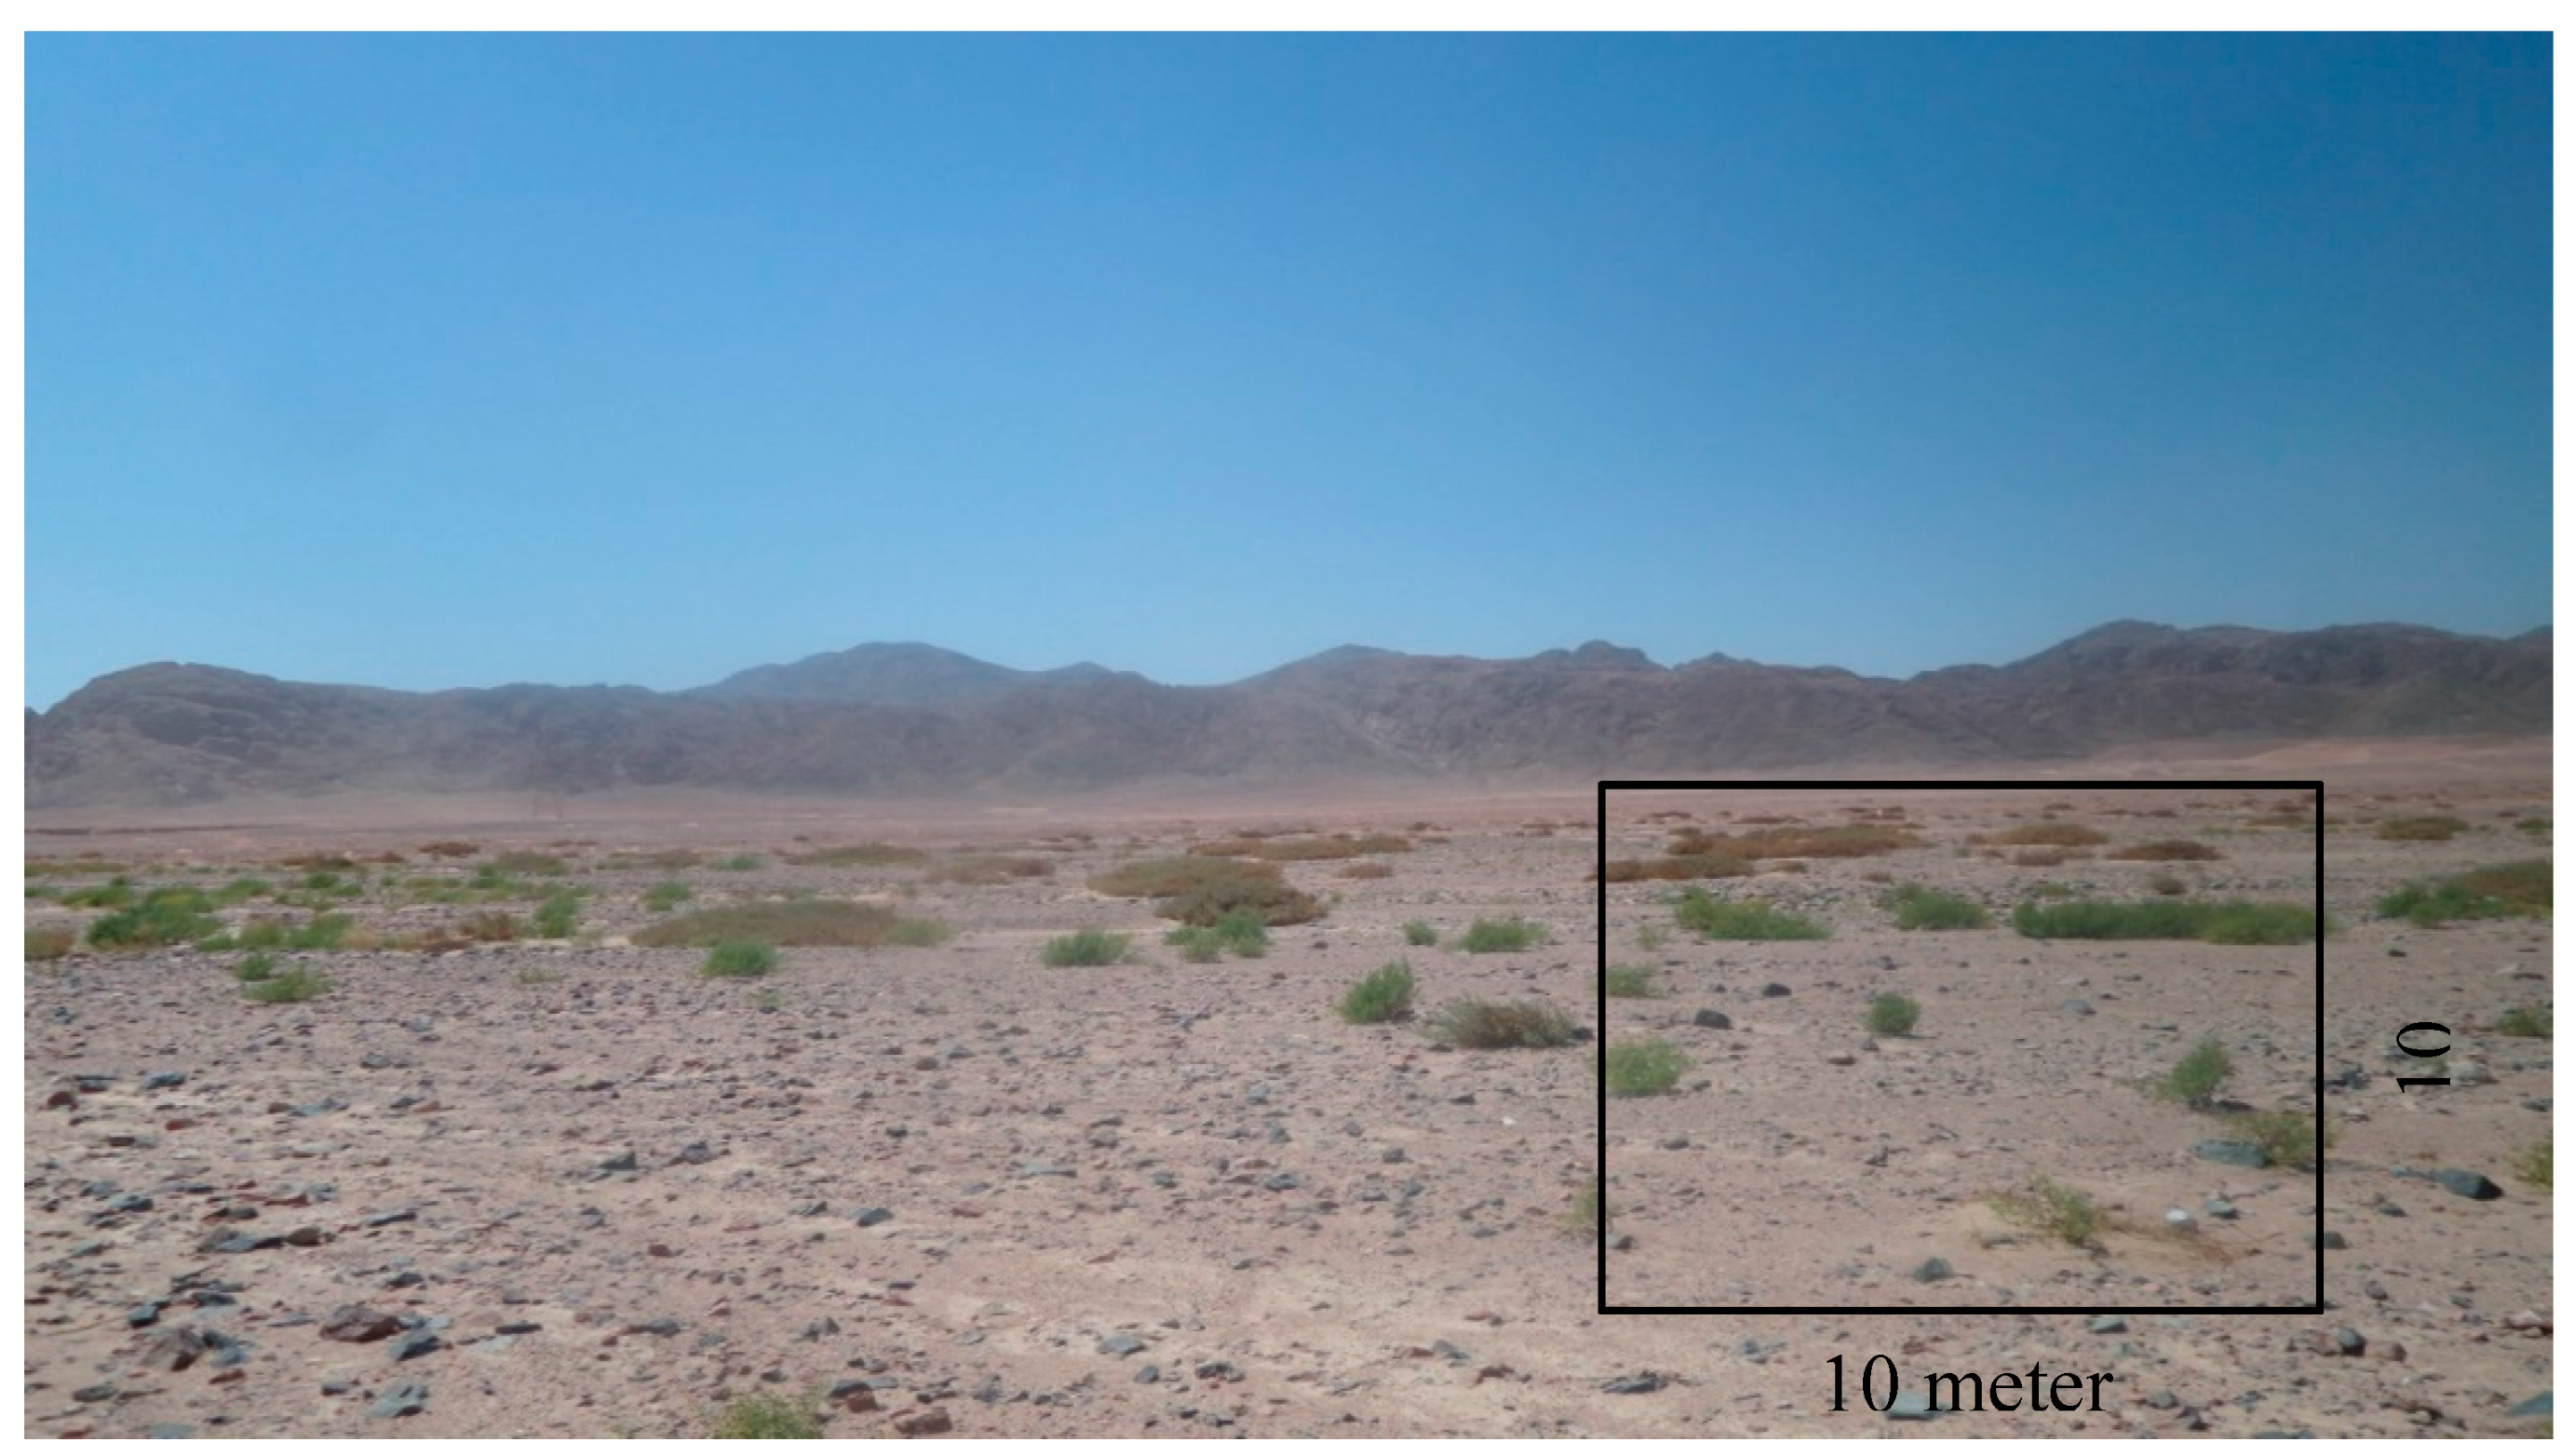
2.1. Study Area
2.2. Climate Data
2.3. Floristic Study
2.4. Soil Analyses
2.5. Statistical Analyses
2.6. Vegetation Change
3. Results
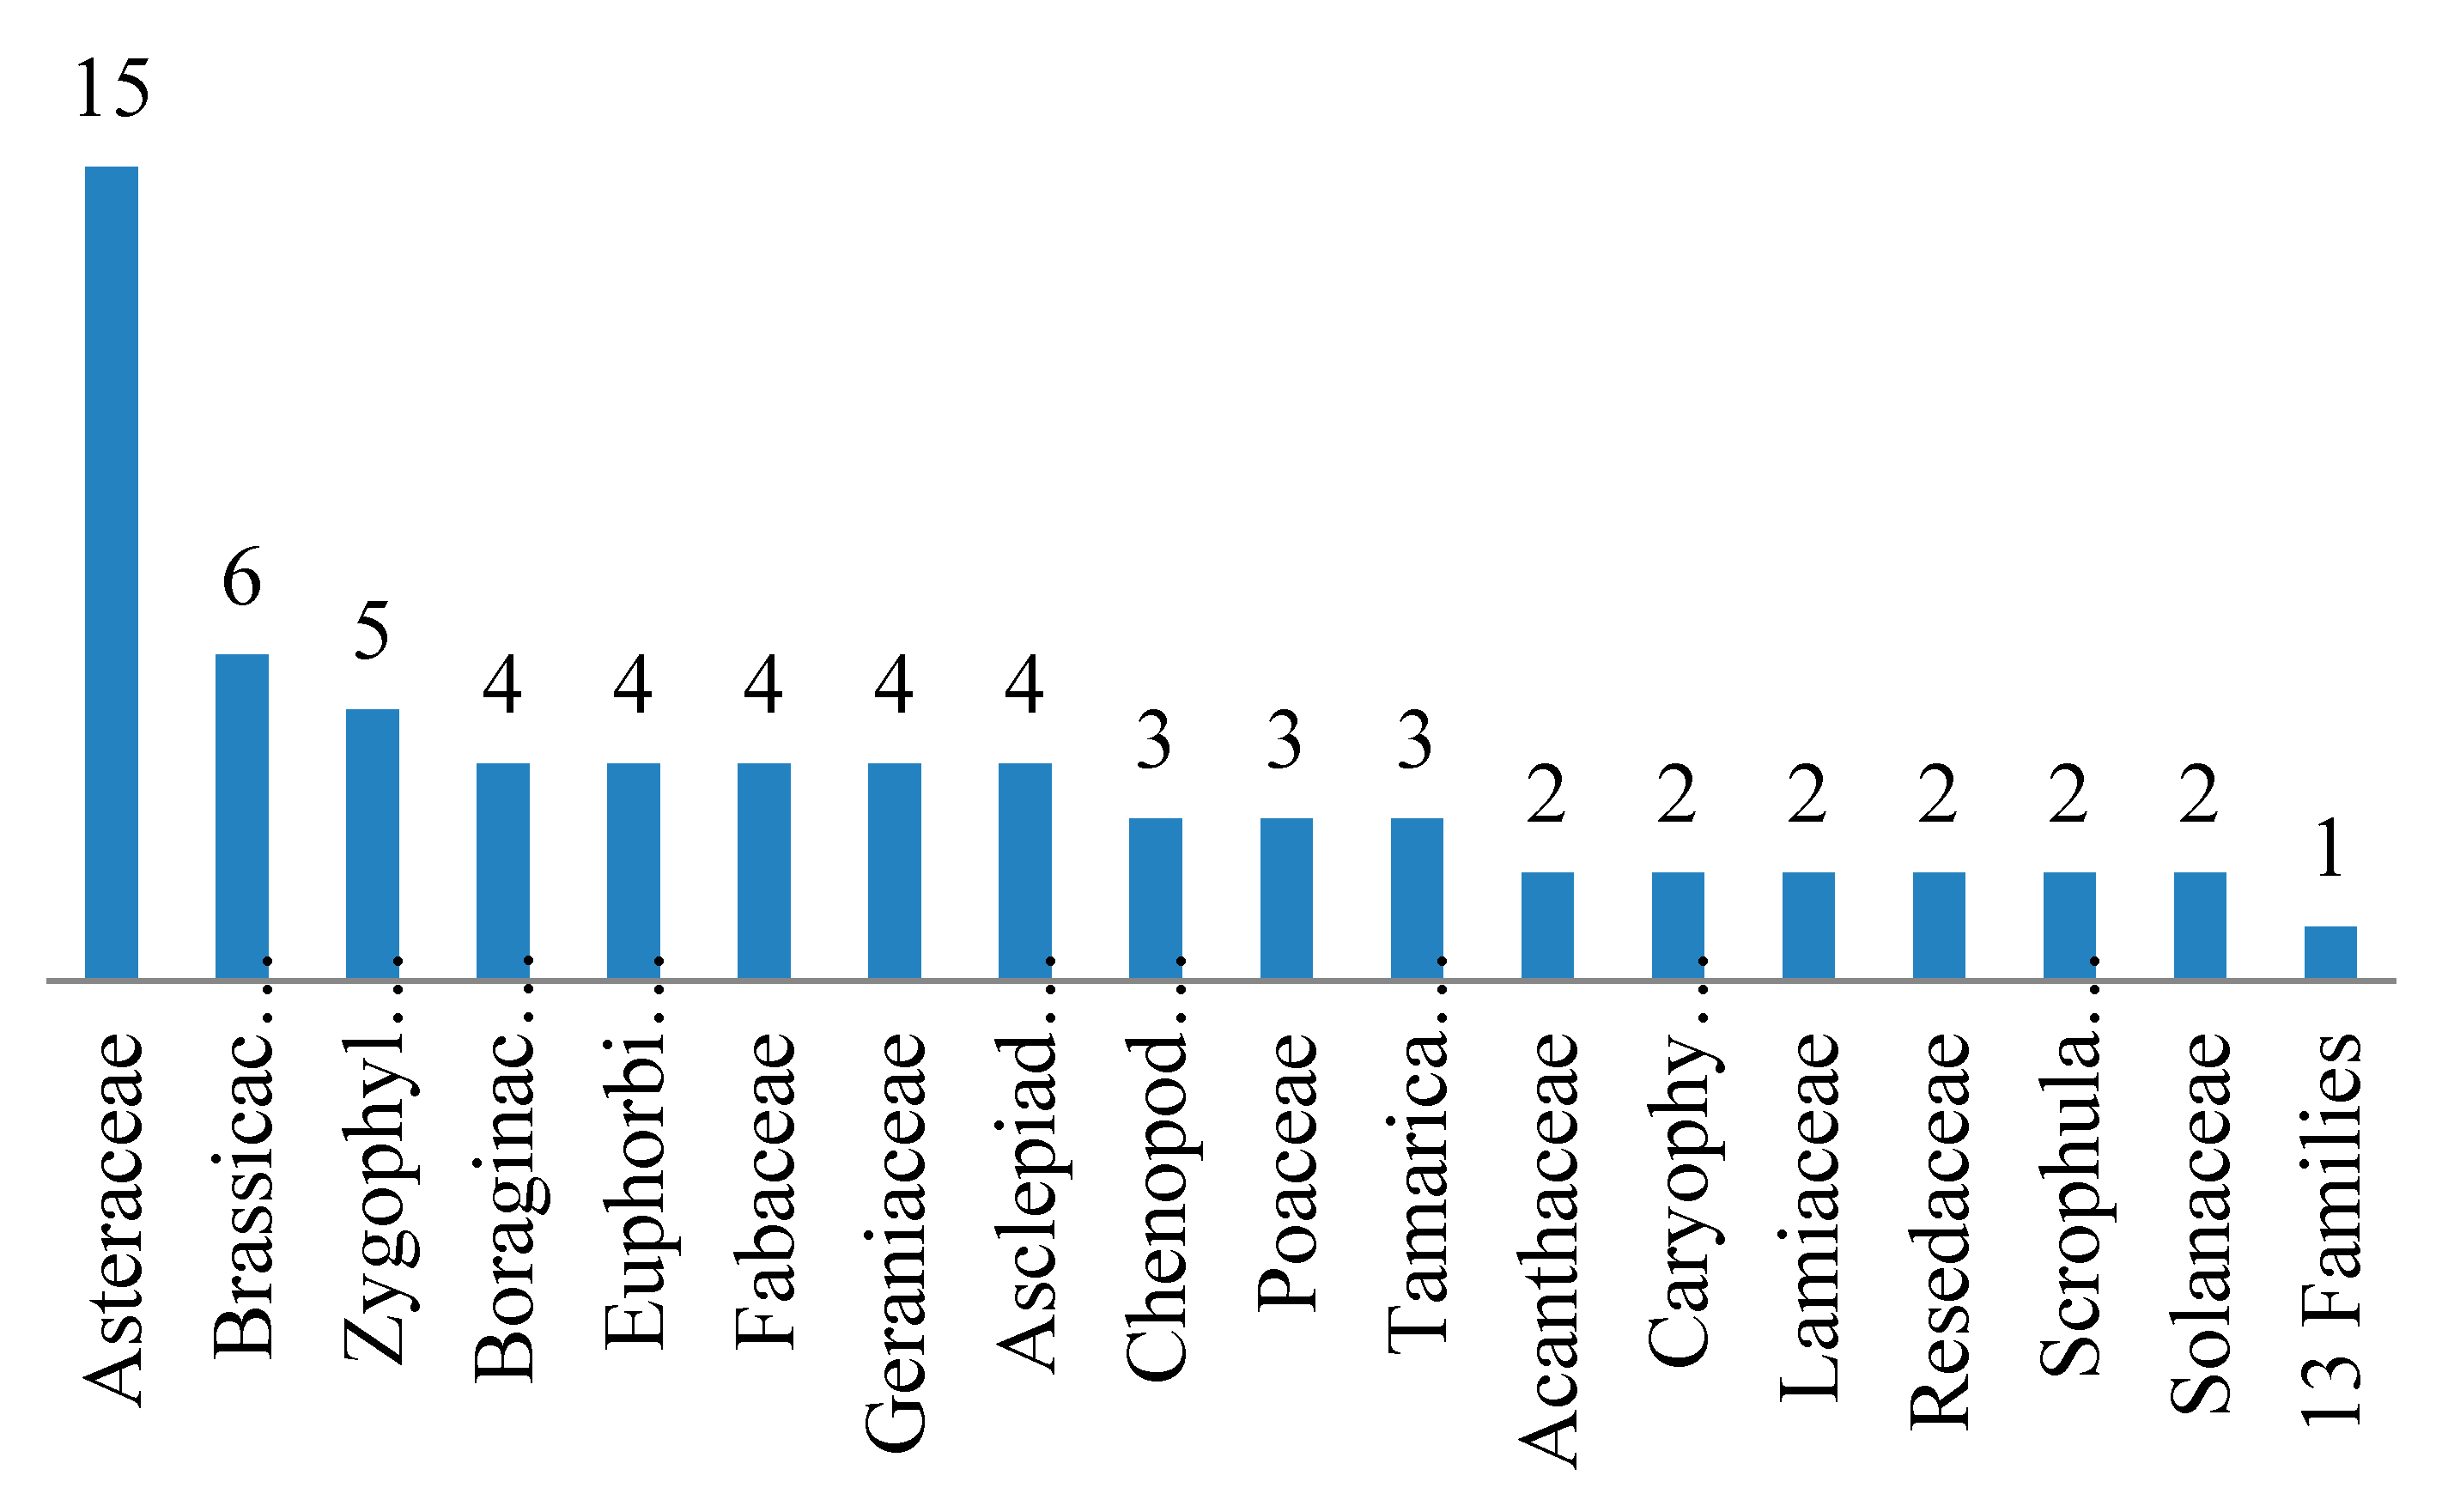
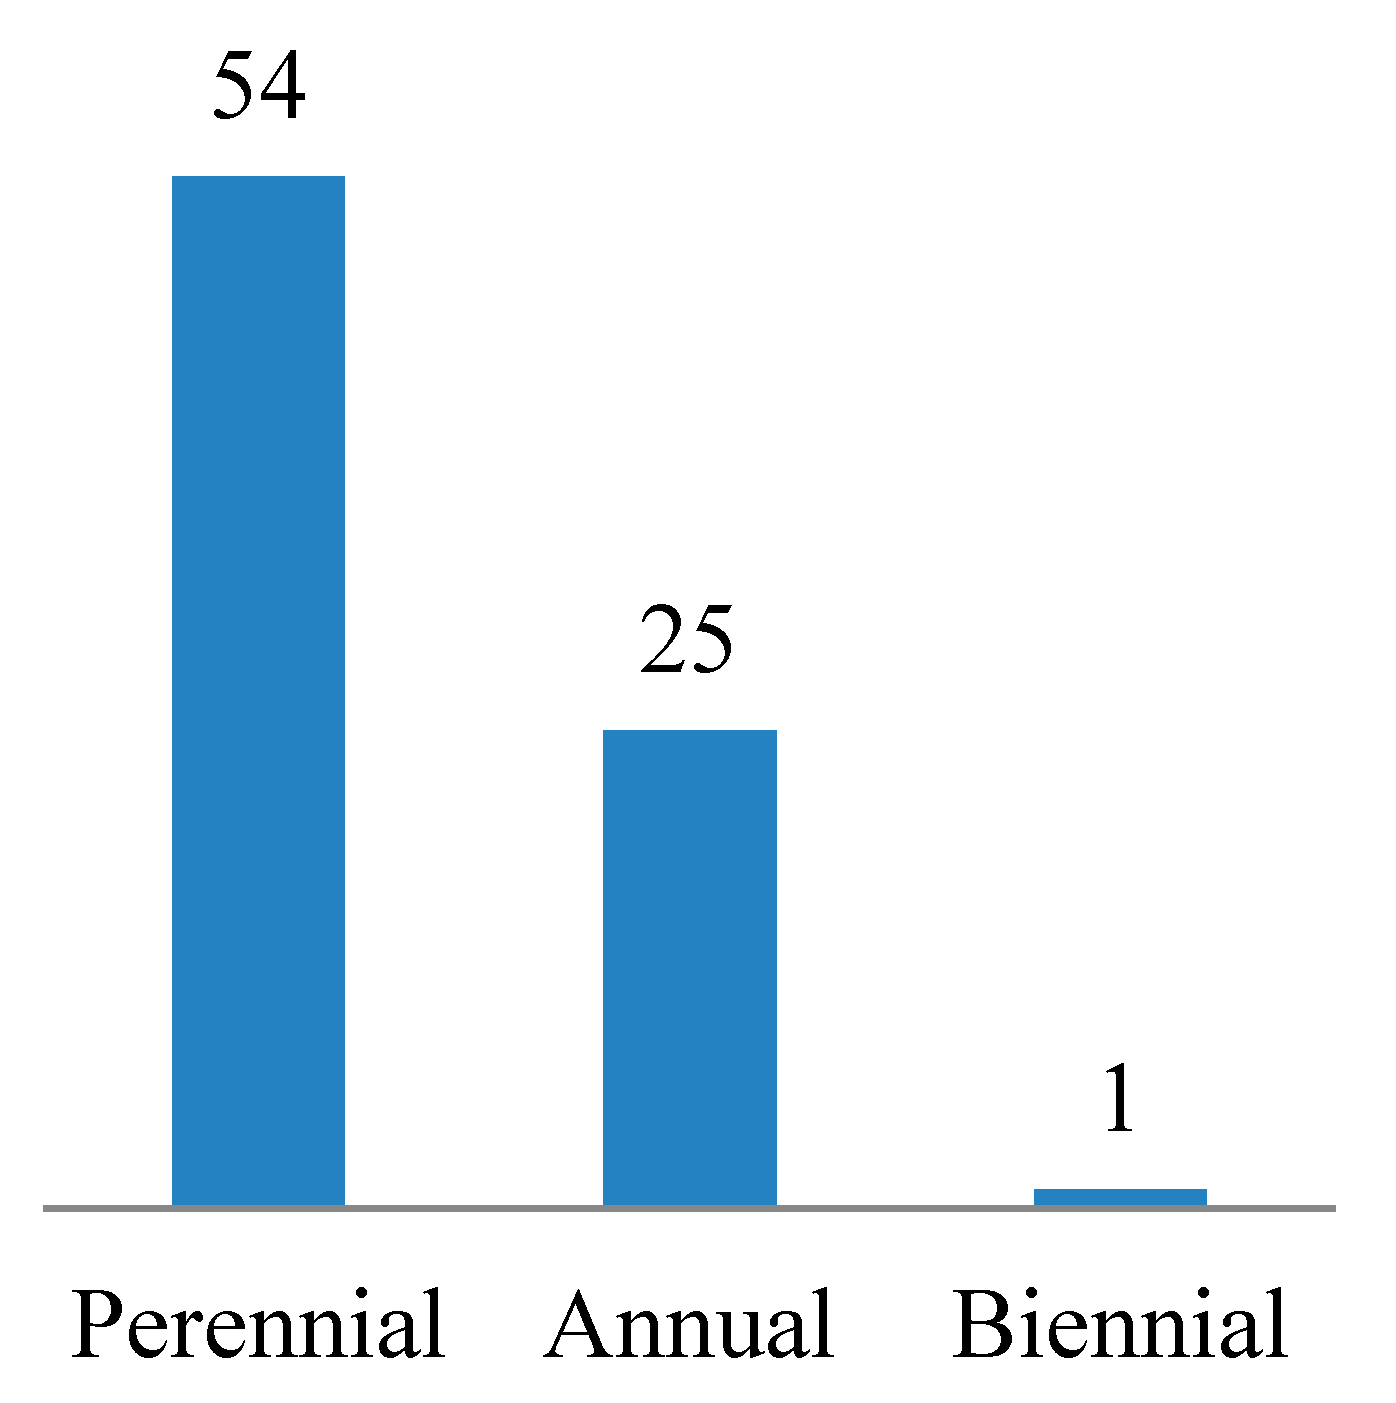
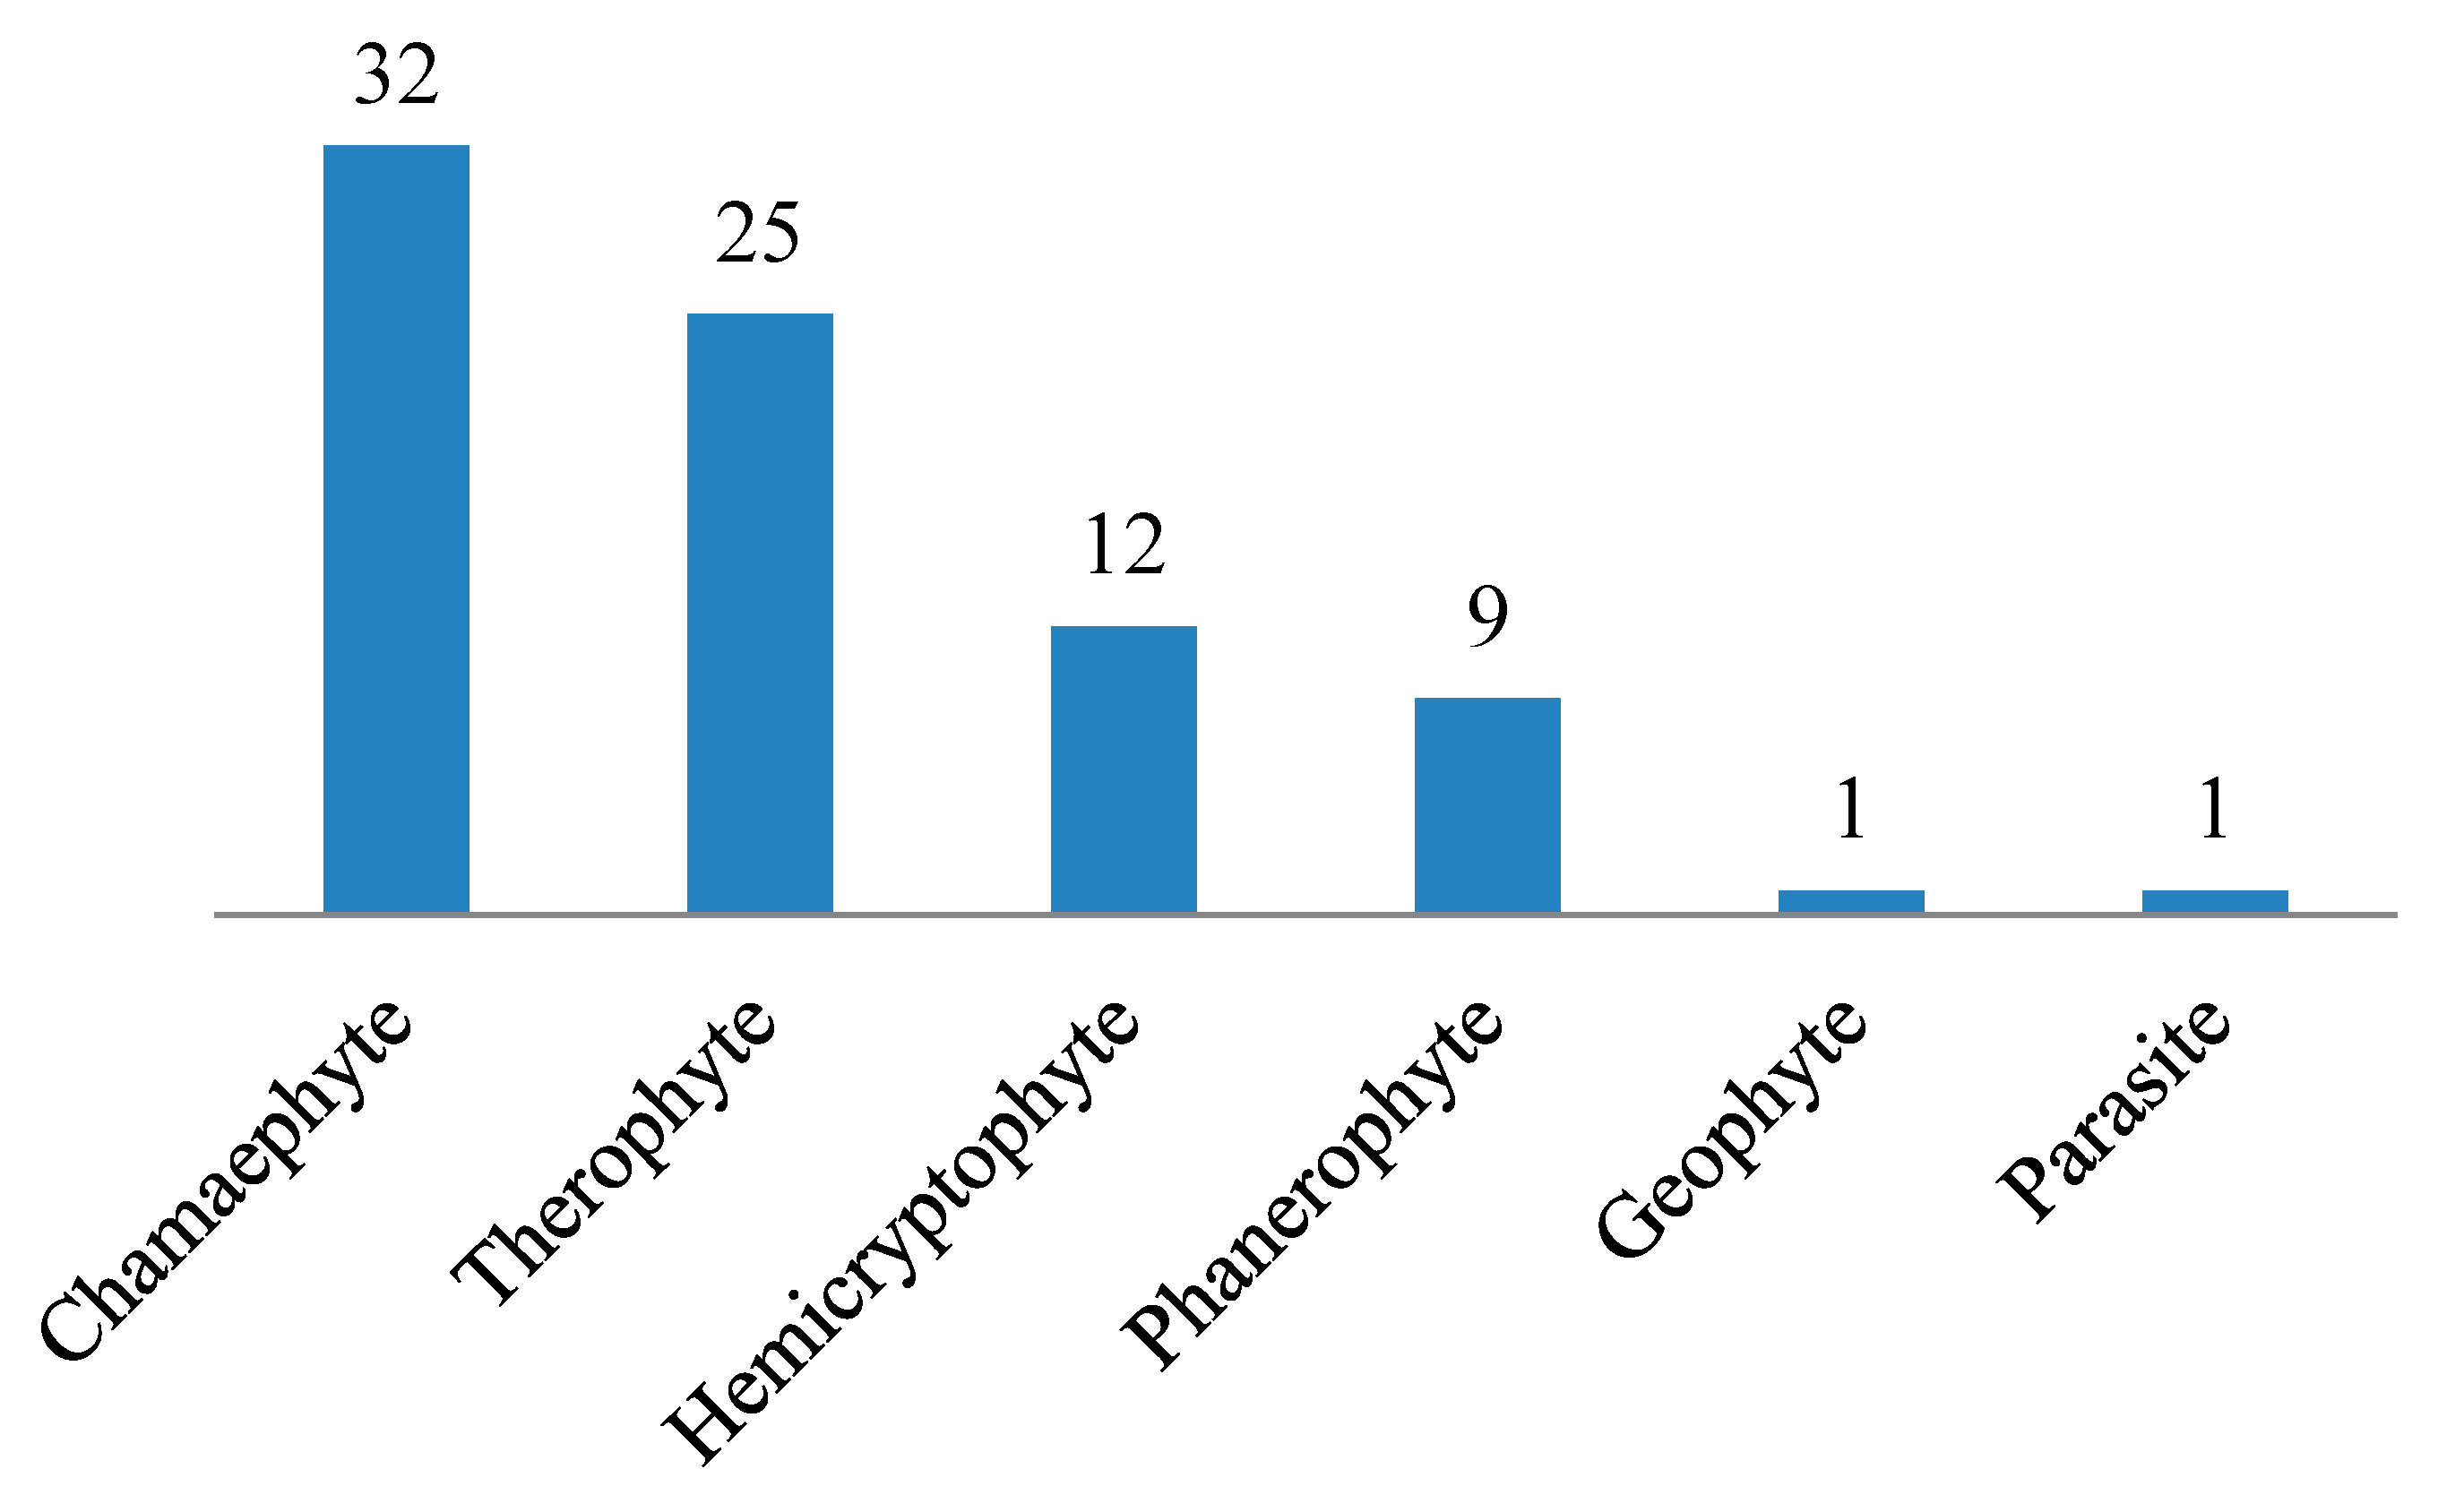
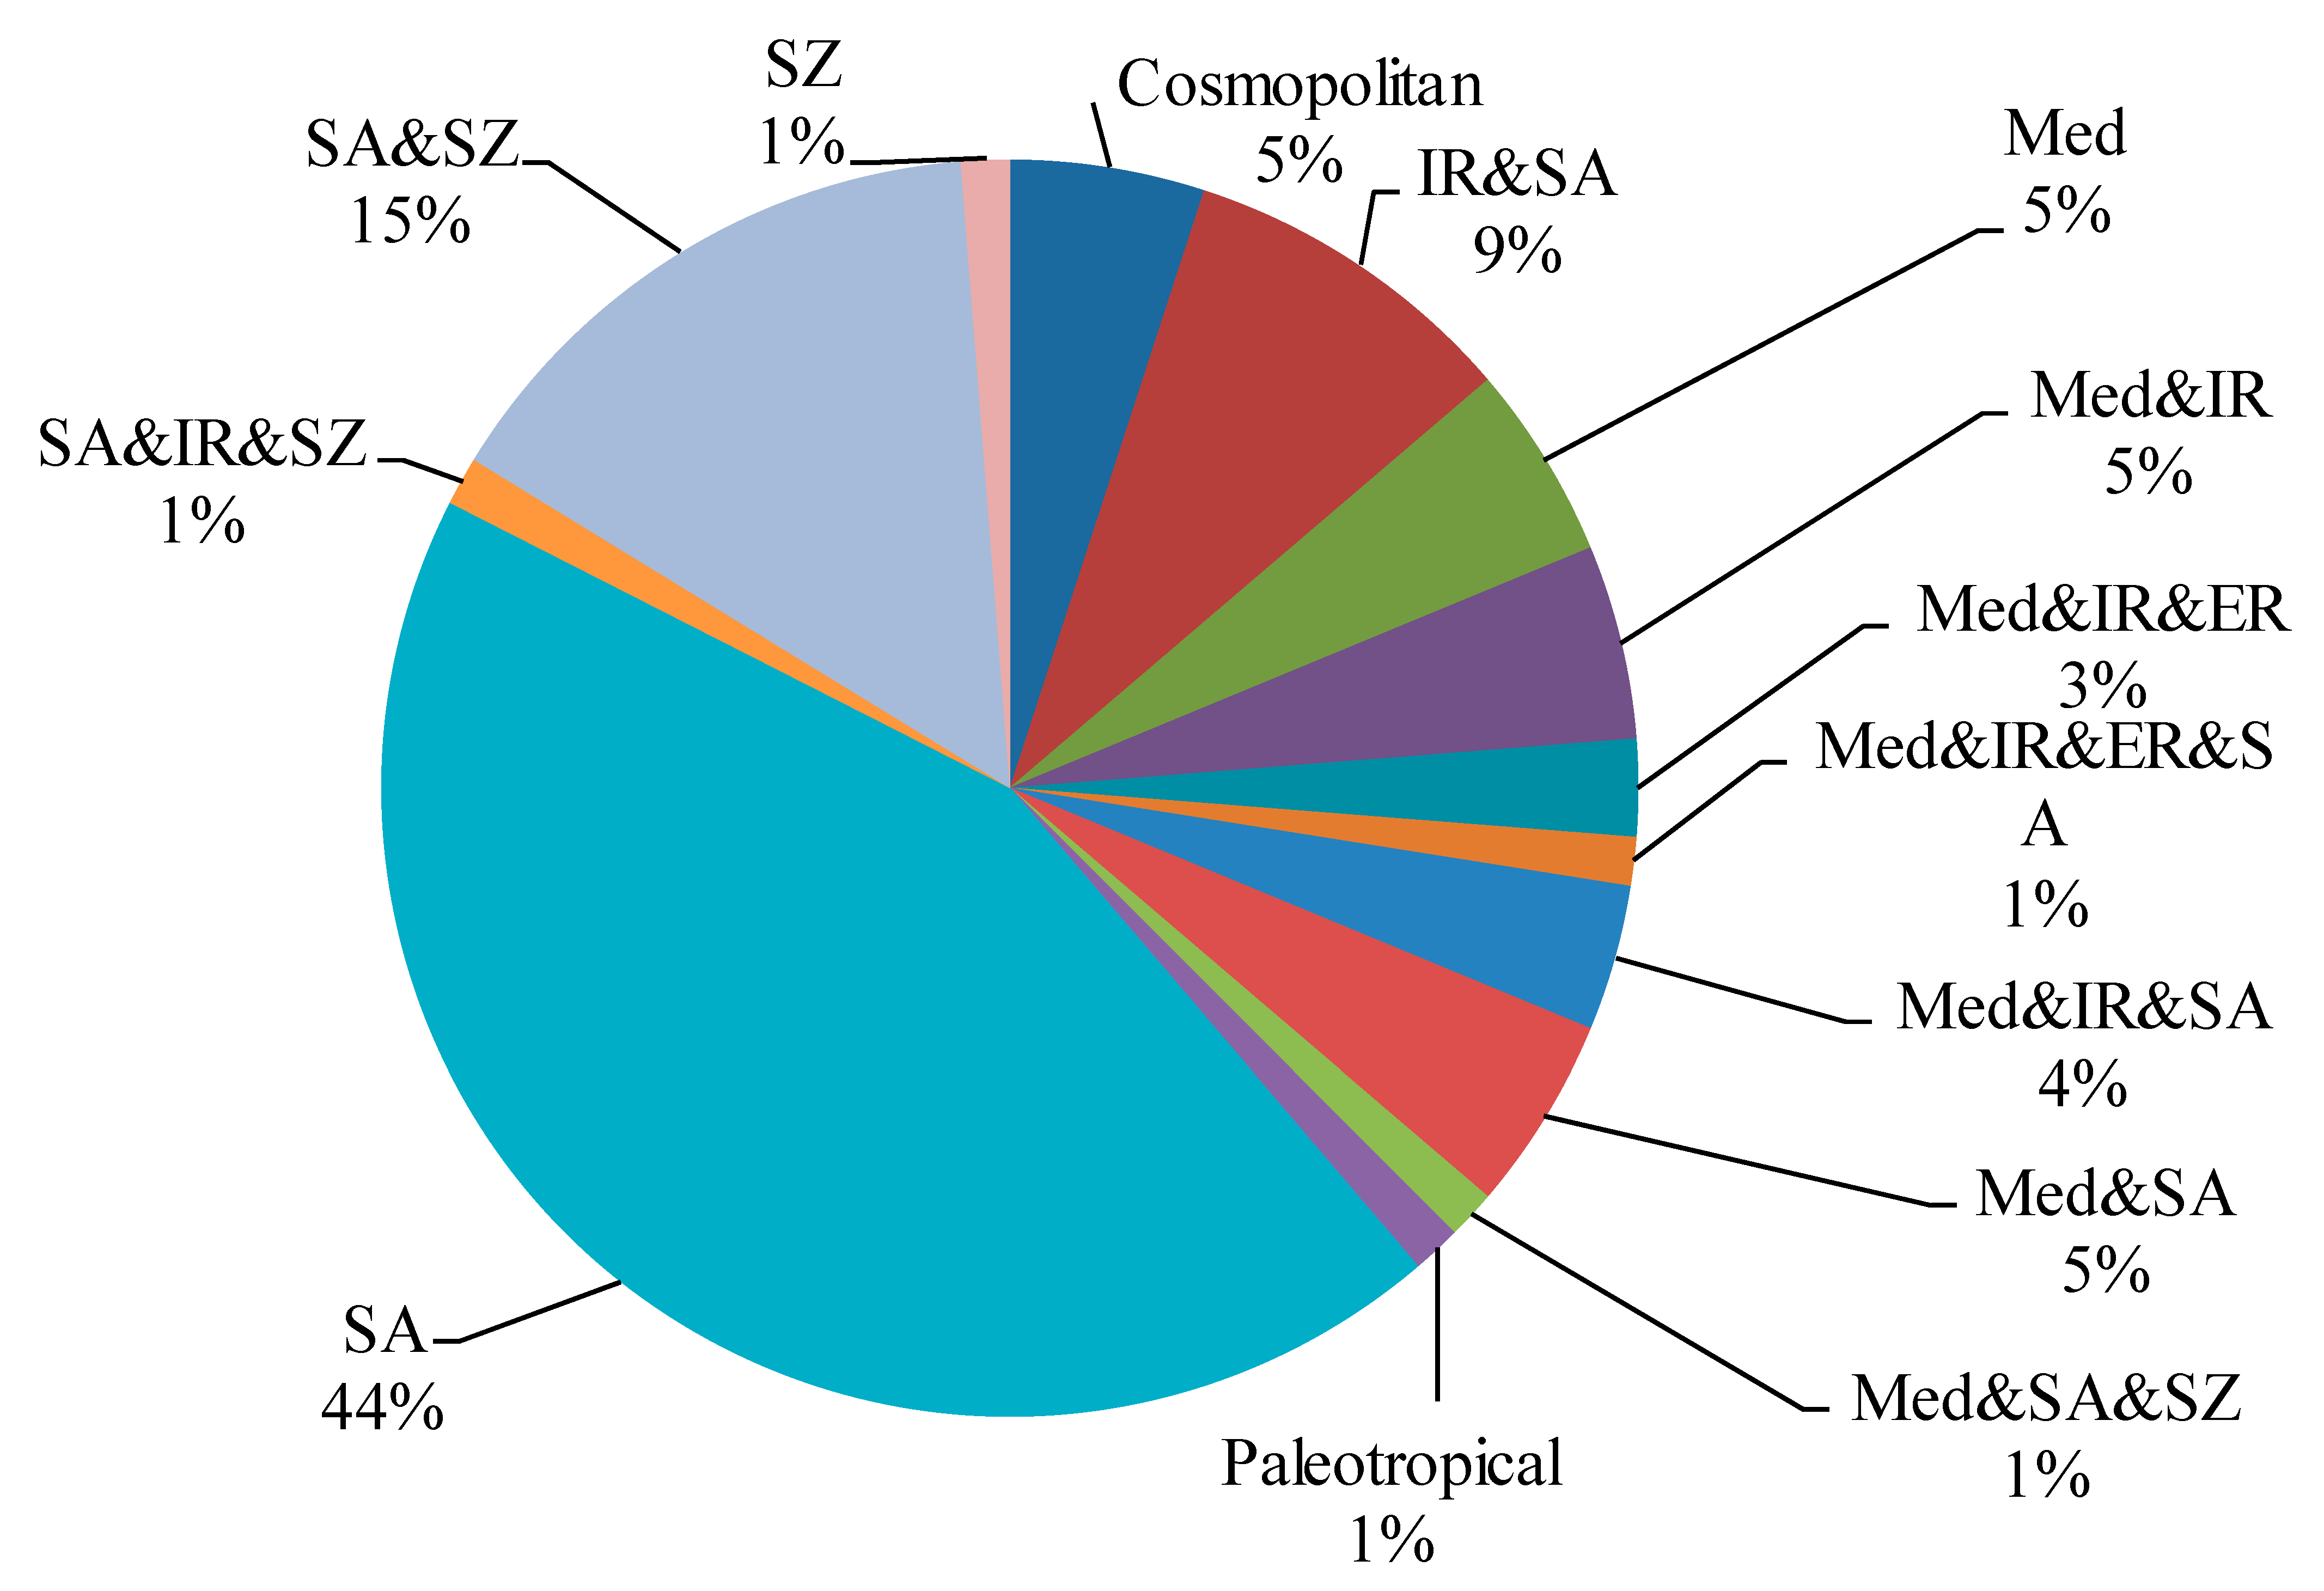
3.1. Floristic Composition
3.2. Soil Characteristics
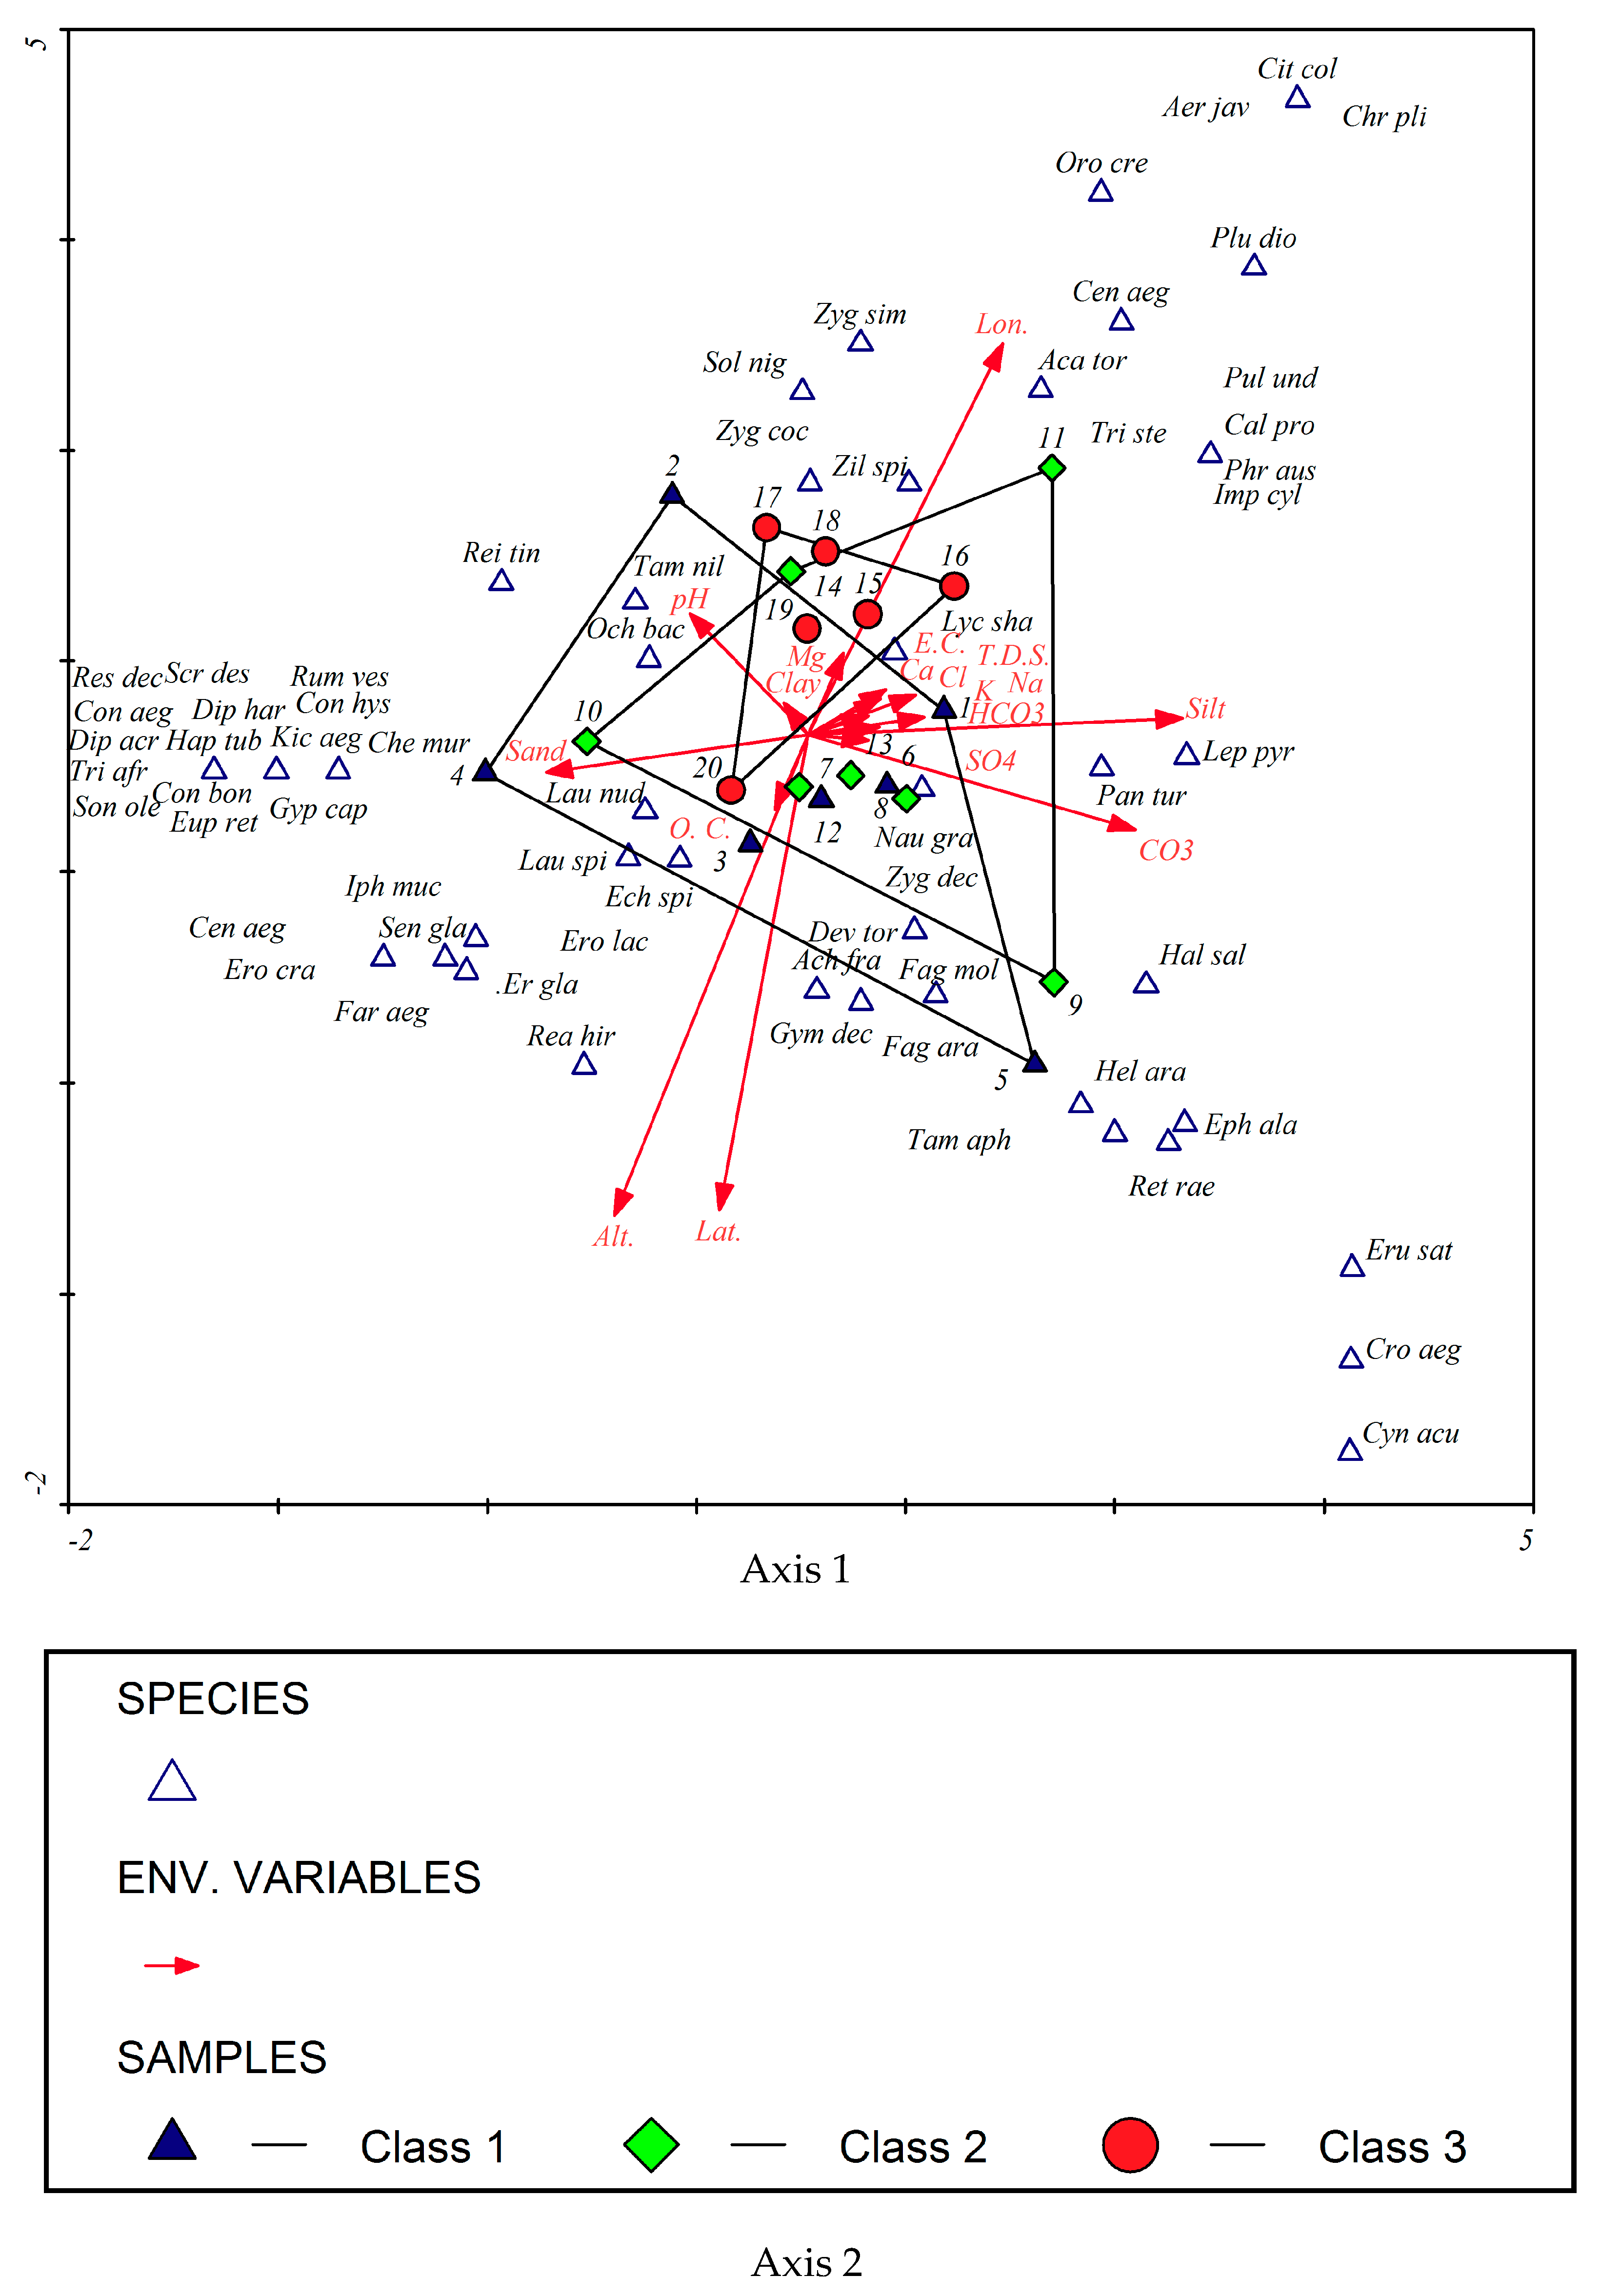
3.3. Effect of Environmental Factors on the Distribution of Plant Communities in the Studied Localities
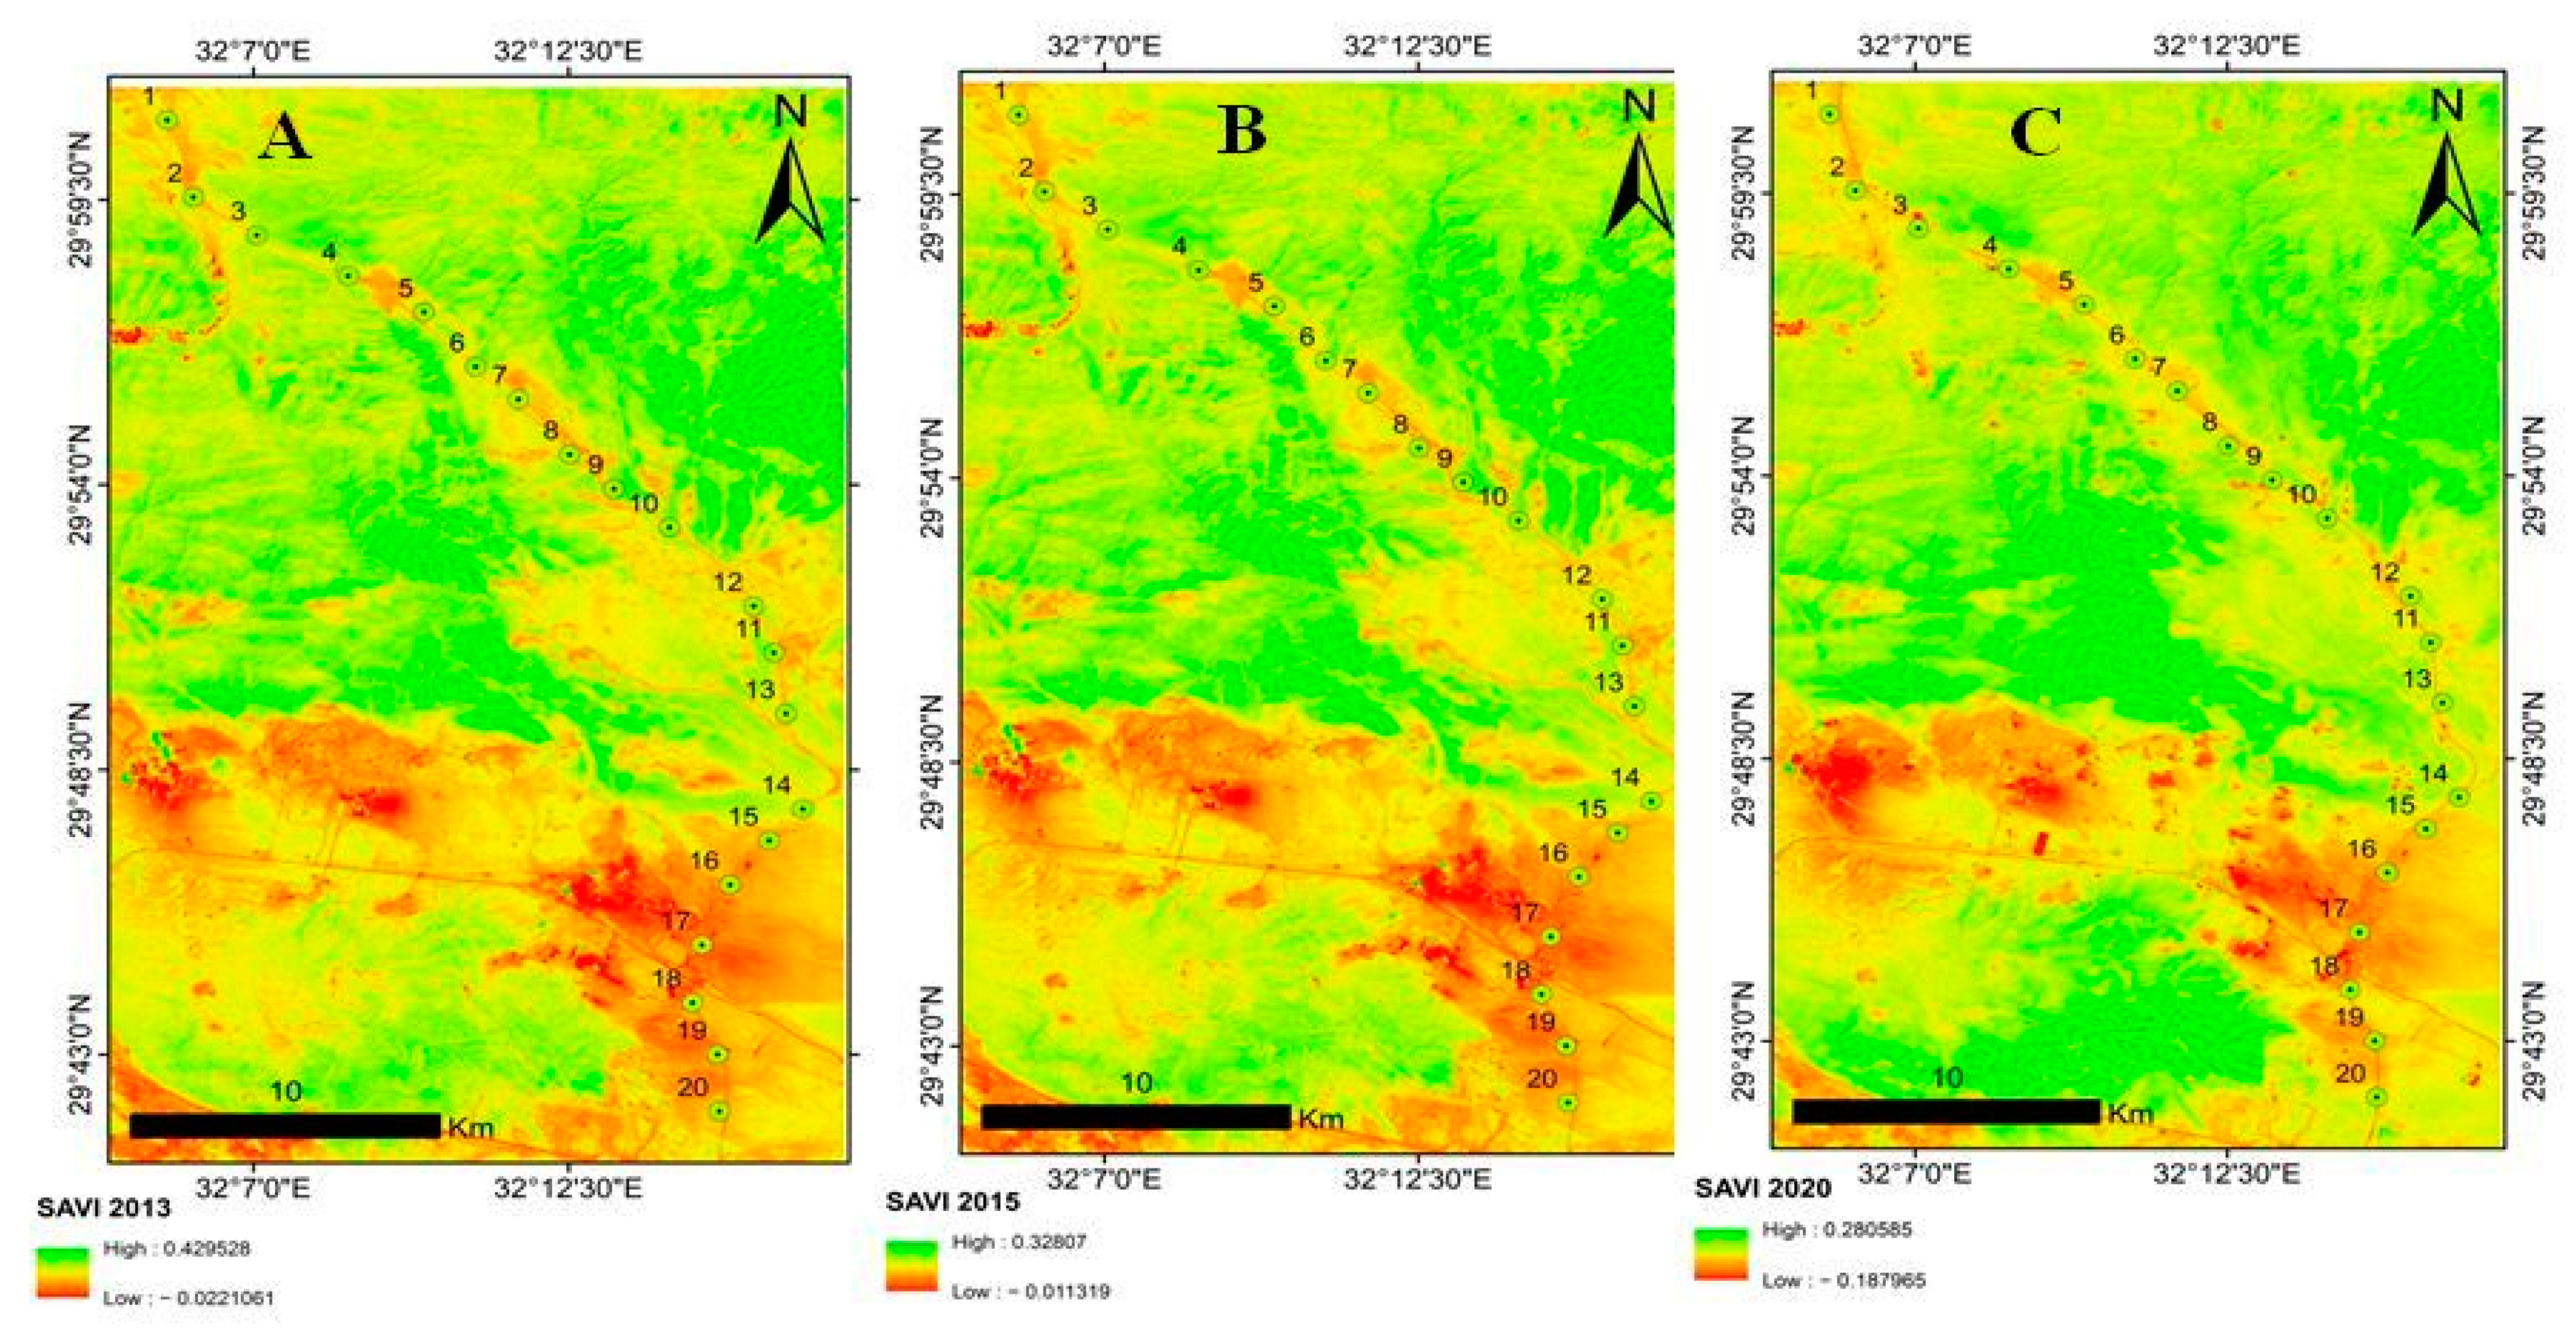
3.4. Vegetation Change
4. Discussion
5. Conclusions
Supplementary Materials
Author Contributions
Funding
Institutional Review Board Statement
Informed Consent Statement
Data Availability Statement
Acknowledgments
Conflicts of Interest
References
- Millennium Ecosystem Assessment. Ecosystems and Human Well-Being: Desertification Synthesis; World Resources Institute: Washington, DC, USA, 2005. [Google Scholar]
- Referowska-Chodak, E. Pressures and threats to nature related to human activities in European urban and suburban forests. Forests 2019, 10, 765. [Google Scholar] [CrossRef]
- Newton, A.C.; Cayuela, C.; Echeverría, C.; Armesto, J.J.; Del Castillo, R.F.; Golicher, D.; Geneletti, D.; Gonzalez-Espinosa, M.; Huth, A.; López-Barrera, F.; et al. Toward integrated analysis of human impacts on forest biodiversity: Lessons from Latin America. Ecol. Soc. 2009, 14, 2. [Google Scholar] [CrossRef][Green Version]
- Kapos, V.; Lysenko, I.; Lesslie, R. Assessing Forest Integrity and Naturalness in Relation to Biodiversity; Forest Resources Assessment Programme, Working Paper 54; Forestry Department FAO: Rome, Italy, 2002. [Google Scholar]
- Moustafa, A.A.; Abd El-Wahab, R.H.; Zaghloul, M.S. Conservation and Sustainable Use of Medicinal Plants in Arid and Semi-Arid Ecosystems of Egypt; Final Report; Egyptian Environmental Affairs Agency (EEAA), United Nations Development Programme (UNDP) and Global Environmental Facilities (GEF): Giza, Egypt, 1999. [Google Scholar]
- Nakahama, N.; Hirasawa, Y.; Minato, T.; Hasegawa, M.; Isagi, Y.; Shiga, T. Recovery of genetic diversity in threatened plants through use of germinated seeds from herbarium specimens. Plant Ecol. 2015, 216, 1635–1647. [Google Scholar] [CrossRef]
- Hussein, E.A.; Abd El-Ghani, M.M.; Hamdy, R.S.; Shalabi, L.F. Do anthropogenic activities affect floristic diversity and vegetation structure more than natural soil properties in hyper-arid desert environments? Diversity 2021, 13, 157. [Google Scholar] [CrossRef]
- Sebastian, O.; Sibyll, S.; Wolfgang, L.; Dieter, G. Three centuries of dual pressure from land use and climate change on the biosphere. Environ. Res. Lett. 2015, 10, 044011. [Google Scholar]
- Titeux, N.; Henle, K.; Mihoub, J.B.; Regos, A.; Geijzendorffer, I.R.; Cramer, W.; Verburg, P.H.; Brotons, L. Biodiversity scenarios neglect future land-use changes. Glob. Chang. Biol. 2016, 22, 2505–2515. [Google Scholar] [CrossRef] [PubMed]
- Pereira, H.M.; Navarro, L.M.; Martins, I.S. Global biodiversity change: The bad, the good, and the unknown. Annu. Rev. Environ. Resour. 2012, 37, 25–50. [Google Scholar] [CrossRef]
- Zhu, P.; Cao, W.; Huang, L.; Xiao, T.; Zhai, J. The impacts of human activities on ecosystems within China’s nature reserves. Sustainability 2019, 11, 6629. [Google Scholar] [CrossRef]
- Wu, J.W.; Miao, C.Y.; Wang, Y.M.; Duan, Q.Y.; Zhang, X.M. Contribution analysis of the long-term changes in seasonal runoff on the Loess Plateau, China, using eight Budyko-based methods. J. Hydrol. 2017, 545, 263–275. [Google Scholar] [CrossRef]
- Kong, D.; Miao, C.; Borthwick, A.G.; Lei, X.; Li, H. Spatiotemporal variations in vegetation cover on the Loess Plateau, China, between 1982 and 2013: Possible causes and potential impacts. Environ. Sci. Pollut. Res. 2018, 25, 13633–13644. [Google Scholar] [CrossRef]
- Enright, N.J.; Miller, B.P.; Akhter, R. Desert vegetation and vegetation-environment relationships in Kirthar National Park, Sindh, Pakistan. J. Arid Environ. 2005, 61, 397–418. [Google Scholar] [CrossRef]
- Abd El-Wahab, R.H. Plant assemblage and diversity variation with human disturbances in coastal habitats of the western Arabian Gulf. J. Arid Land 2016, 8, 787–798. [Google Scholar] [CrossRef]
- Kotanska, M.; Buziak-Chmielowiec, E.; Dabrowska, A.; Gladysz, M.; Jakielaszek, A.; Wójcik, T. Human impact on the plant coverof four villages in SE Poland. Steciana 2015, 19, 115–121. [Google Scholar] [CrossRef]
- TEEB. The Economics of Ecosystems and Biodiversity: Mainstreaming the Economics of Nature: A Synthesis of the Approach, Conclusions and Recommendations of TEEB; United Nations Environment Programme: Geneva, Switzerland, 2010; Volume 1, 47p. [Google Scholar]
- Koagne, M.D. Evaluation of Ecological Monitoring System of the Dynamics of Human Activities in the Benue National Park and Its Periphery; Engineer Memory of Water, Forests and Hunting, FASA, Dschang University: Dschang, Cameroon, 2009; 98p. [Google Scholar]
- Blicharska, M.; Grandin, U. Why protect biodiversity? Perspectives of conservation professionals in Poland. Int. J. Biodivers. Sci. Ecosyst. Serv. Manag. 2015, 11, 349–362. [Google Scholar] [CrossRef]
- Dimobe, K.; Wala, K.; Batawila, K.; Dourma, M.; Woegan, Y.A. Analyse spatiale des différentes formes de pressions anthropiques dans la réserve de faune de l’Oti- Mandouri (Togo). VertigO—La Revue Électronique en Sciences de l’Environnement 2012, 14, 1–22. (In French) [Google Scholar] [CrossRef]
- Cohen, J.E. Human population: The next half century. Science 2003, 302, 1172–1175. [Google Scholar] [CrossRef]
- United Nations. World Population Prospects: The Revision, Key Findings and Advance Tables; Working Paper No., ESA/P/WP/; Population Division, Ed.; Department of Economic and Social Affairs: New York, NY, USA, 2017; 248p. [Google Scholar]
- Finn, H.C.; Stephens, N.S. The invisible harm: Land clearing is an issue of animal welfare. Wildl. Res. 2017, 44, 377–391. [Google Scholar] [CrossRef]
- Baillie, J.E.; Hilton-Taylor, C.; Stuart, S.N. IUCN Red List of Threatened Species: A Global Species Assessment; IUCN: Gland, Switzerland; Cambridge, UK, 2004; 191p. [Google Scholar]
- Foreman, D. Rewilding North America; Island Press: Washington, DC, USA, 2004; 312p. [Google Scholar]
- International Union for Conservation of Nature (IUCN). Red List of Threatened Species. Gland, Switzerland: The World Conservation Union. 2006. Available online: https://www.iucnredlist.org (accessed on 1 April 2006).
- International Union for Conservation of Nature (IUCN). Red List of Threatened Species (Gland, Switzerland: International Union for Conservation of Nature, 1999). 2011. Available online: http://www.iucnredlist.org (accessed on 31 December 2011).
- Brummitt, N.A.; Bachman, S.P.; Griffiths-Lee, J.; Lutz, M.; Moat, J.F.; Farjon, A.; Aletrari, E. Green plants in the red: A baseline global assessment for the IUCN sampled Red List Index for plants. PLoS ONE 2015, 10, e0135152. [Google Scholar] [CrossRef]
- Qin, H.; Yang, Y.; Dong, S.; He, Q.; Jia, Y.; Zhao, L.; Xiang, J. Threatened species list of China’s higher plants. Biodivers. Sci. 2017, 25, 696. [Google Scholar] [CrossRef]
- McKinney, M.L.; Lockwood, J.L. Biotic homogenization: A few winners replacing many losers in the next mass extinction. Trends Ecol. Evol. 1999, 14, 450–453. [Google Scholar] [CrossRef]
- Hunter, P. The human impact on biological diversity: How species adapt to urban challenges sheds light on evolution and provides clues about conservation. EMBO Rep. 2007, 8, 316–318. [Google Scholar] [CrossRef]
- Mack, R.N.; Simberloff, D.; Lonsdale, W.M.; Evans, H.; Clout, M.; Bazzaz, F.A. Biotic invasions: Causes, epidemiology, global consequences, and control. Ecol. Appl. 2000, 10, 689–710. [Google Scholar] [CrossRef]
- Kassem, H.S.; Bello, A.R.S.; Alotaibi, B.M.; Aldosri, F.O.; Straquadine, G.S. Climate change adaptation in the delta Nile Region of Egypt: Implications for agricultural extension. Sustainability 2019, 11, 685. [Google Scholar] [CrossRef]
- Turner, B.L., II; Lambin, E.F.; Reenberg, A. From the cover land change science special feature: The emergence of land change science for global environmental change and sustainability. Proc. Natl. Acad. Sci. USA 2007, 104, 20666–20671. [Google Scholar] [CrossRef]
- Benzer, N. Using the geographical information system and remote sensing techniques for soil erosion assessment. Pol. J. Environ. Stud. 2010, 19, 881–886. [Google Scholar]
- Zhang, X.; Hu, Y.; Zhuang, D.; Qi, Y.; Ma, X. Ndvi spatial pattern and its differentiation on the Mongolian plateau. J. Geogr. Sci. 2009, 19, 403–415. [Google Scholar] [CrossRef]
- Kaspersen, P.S.; Fensholt, R.; Huber, S. A spatiotemporal analysis of climatic drivers for observed changes in Sahelian vegetation productivity (1982–2007). Int. J. Geophys. 2011, 2011, 715321. [Google Scholar] [CrossRef]
- Hope, A.S.; Boynton, W.L.; Stow, D.A.; Douglas, D.C. Interannual growth dynamics of vegetation in the kuparuk river watershed, alaska based on the normalized difference vegetation index. Int. J. Remote Sens. 2003, 24, 3413–3425. [Google Scholar] [CrossRef]
- Rhyma, P.P.; Norizah, K.; Hamdan, O.; Faridah-Hanum, I.; Zulfa, A.W. Integration of normalised different vegetation index and Soil-Adjusted Vegetation Index for mangrove vegetation delineation. Remote Sens. Appl. Soc. Environ. 2020, 17, 100280. [Google Scholar] [CrossRef]
- Ren, H.; Zhou, G.; Zhang, F. Using negative soil adjustment factor in soil-adjusted vegetation index (SAVI) for aboveground living biomass estimation in arid grasslands. Remote Sens. Environ. 2018, 209, 439–445. [Google Scholar] [CrossRef]
- Senseman, G.M.; Bagley, C.F.; Tweddale, S.A. Correlation of rangeland cover measures to satellite-imagery-derived vegetation indices. Geocarto Int. 1996, 11, 29–38. [Google Scholar] [CrossRef]
- Ahmad, F. Spectral vegetation indices performance evaluated for Cholistan Desert. J. Geogr. Reg. Plan. 2012, 5, 165–172. [Google Scholar]
- Seleem, T.A.; Aboulela, H.A. Seismicity and geologic structures indubitable in Wadi Hagul, north Eastern Desert, Egypt. Int. J. Geosci. 2011, 2, 55. [Google Scholar] [CrossRef]
- Zahran, M.A.; Willis, A.J. The Vegetation of Egypt, 2nd ed.; Springer: Dordrecht, The Netherlands, 2009; 437p. [Google Scholar]
- Abbas, N.H.; ELAraby, M.M.; Ahmad, H.F.; ELSherbeny, E.A. Molecular insight into Wadi Hagul rare diversity: Echinops spinosus and fagonia molis, plant species. Egypt. J. Genet. Cytol. 2021, 50, 83–94. [Google Scholar]
- Boulos, L. Flora of Egypt: Azollaceae-Oxalidaceae; Al-Hadara Publishing: Cairo, Egypt, 1999; Volume I, 419p. [Google Scholar]
- Boulos, L. Flora of Egypt: Geraniaceae-Boraginaceae; Al-Hadara Publishing: Cairo, Egypt, 2000; Volume II, 352p. [Google Scholar]
- Boulos, L. Flora of Egypt: Verbenaceae-Compositae); Al-Hadara Publishing: Cairo, Egypt, 2002; Volume III, 373p. [Google Scholar]
- Boulos, L. Flora of Egypt: Monocotyledons (Alismataceae-Orchidaceae); Al-Hadara Publishing: Cairo, Egypt, 2005; Volume IV, 617p. [Google Scholar]
- Boulos, L. Flora of Egypt Checklist, Revised Annotated ed.; Al-Hadara Publishing: Cairo, Egypt, 2009; 410p. [Google Scholar]
- Raunkiaer, C. The Plant Life Forms and Statistical Plant Geography; Clarendon Press: Oxford, UK, 1934; 632p. [Google Scholar]
- Tutin, T.G.; Heywood, V.H.; Burges, N.A.; Moore, M.D.; Valentine, D.H.; Walters, S.M.; Webb, D.A. Flora Europaea; Cambridge University Press: Cambridge, UK, 1964; Volumes 1–5. [Google Scholar]
- Davis, P.H. Flora of Turkey and the East Aegean Islands; Edinburgh University Press: Edinburgh, UK, 1965–1985; Volumes 1–9. [Google Scholar]
- Estefan, G.; Sommer, R.; Ryan, J. Methods of Soil, Plant, and Water Analysis: A Manual for the West Asia and North Africa Region; International Center for Agricultural Research in the Dry Areas: Beirut, Lebanon, 2013; 243p. [Google Scholar]
- Page, A.L.; Miller, R.H.; Keeney, D.R. Methods of Soil Analysis, Part 2: Chemical and Microbiological Properties; American Society of Agronomy: Madison, WI, USA, 1982; 1159p. [Google Scholar]
- Jackson, M.L. Soil Chemicals Analysis; Prentice-Hall of India Private: New Delhi, India, 1967; 498p. [Google Scholar]
- Piper, C.S. Soil and Plant Analysis; University of Adelaide: Adelaide, Australia, 1950; 368p. [Google Scholar]
- McCune, B.; Mefford, M.J. PCORD for Windows: Multivariate Analysis of Ecological Data; Version 4.14. User’s Guide; MjM Software: Gleneden Beach, OR, USA, 1999; 47p. [Google Scholar]
- ter Braak, C.J.F. CANOCO-an extension of DECORANA to analyze species-environment relationships. Plant Ecol. 1988, 75, 159–160. [Google Scholar] [CrossRef]
- Abdelaal, M. Current status of the floristic composition in Wadi Hagul, northwest Suez gulf, Egypt. Rendiconti Lincei 2016, 28, 81–92. [Google Scholar] [CrossRef]
- Marie, A. A Model for the Use of GIS in Vegetation Mapping of a Phytogeographical Region in Egypt. Ph.D. Thesis, Faculty of Science Al-Azhar University, Cairo, Egypt, 2000; 206p. [Google Scholar]
- Salama, F.M.; Sayed, S.A.; Abd Abd EL-Gelil, A.A. Plant communities and floristic composition of the vegetation of Wadi Al-Assiuty and Wadi Habib in the Eastern Desert, Egypt. Not. Sci. Biol. 2014, 6, 196–206. [Google Scholar] [CrossRef][Green Version]
- Aronson, J.A. HALOPHA: A Data Base of Salt Tolerant Plants of the World; Whitehead, E.E., Ed.; Office of Arid Land Studies, University of Arizona: Tuscon, AZ, USA, 1989; 77p. [Google Scholar]
- Täckholm, V. Students’ Flora of Egypt, 2nd ed.; Cooperative Printing Company: Cairo, Egypt, 1974. [Google Scholar]
- Mashaly, I.A. On the phytosociology of Wadi Hagul, Red Sea coast. Egypt. J. Environ. Sci. 1996, 12, 31–54. [Google Scholar]
- Martiny, N.; Camberlin, P.; Richard, Y.; Philippon, N. Compared regimes of NDVI and Rainfall in semi-arid regions of Africa. Int. J. Remote Sens. 2006, 27, 5201–5223. [Google Scholar] [CrossRef]
- Parmesan, C.; Hanley, M.E. Plants and climate change: Complexities and surprises. Ann. Bot. 2015, 116, 849–864. [Google Scholar] [CrossRef]
- Irl, S.D.H.; Obermeier, A.; Beierkuhnlein, C.; Steinbauer, M.J. Climate controls plant life-form patterns on a high-elevation oceanic island. J. Biogeogr. 2020, 47, 2261–2273. [Google Scholar] [CrossRef]
- Pausata, F.S.R.; Gaetani, M.; Messori, G.; Berg, A.; Souza, D.M.D.; Sage, R.; Demenocal, P. The greening of the Sahara: Past changes and future implications. One Earth 2020, 2, 235–250. [Google Scholar] [CrossRef]
- Nafus, M.G.; Tuberville, T.D.; Buhlmann, K.A.; Todd, B.D. Precipitation quantity and timing affect native plant production and growth of a key herbivore, the desert tortoise, in the Mojave Desert. Clim. Chang. Responses 2017, 4, 4. [Google Scholar] [CrossRef]
- Ruhm, J.; Böhnert, T.; Weigend, M.; Merklinger, F.F.; Stoll, A.; Quandt, D.; Luebert, F. Plant life at the dry limit—Spatial patterns of floristic diversity and composition around the hyperarid core of the Atacama Desert. PLoS ONE 2020, 15, e0233729. [Google Scholar] [CrossRef]
- Batanouny, K.H. Topography and plant life. In Plants in the Deserts of the Middle East; Batanouny, K.H., Ed.; Springer: Berlin/Heidelberg, Germany, 2001; pp. 25–29. [Google Scholar]
- Wang, J.; Wang, H.; Cao, Y.; Bai, Z.; Qin, Q. Effects of soil and topographic factors on vegetation restoration in opencast coal mine dumps located in a loess area. Sci. Rep. 2016, 6, 22058. [Google Scholar] [CrossRef] [PubMed]
- Baartman, J.E.M.; Temme, A.J.A.M.; Saco, P.M. The effect of landform variation on vegetation patterning and related sediment dynamics. Earth Surf. Process. Landf. 2018, 43, 2121–2135. [Google Scholar] [CrossRef]
- Abd El-Galil, A. Floristic Composition and Eco Physiological Studies on Some Xerophytic Plants in Wadi El-Assiuty, Eastern Desert, Egypt. Master’s Thesis, Faculty of Science Assiut University, Asyut, Egypt, 2014; 330p. [Google Scholar]
- El-Amier, Y.A. Vegetation structure and soil characteristics of five common geophytes in desert of Egypt. Egypt. J. Basic Appl. Sci. 2016, 3, 172–186. [Google Scholar] [CrossRef][Green Version]
- Jafari, Z.; Kianian, M.; Aslani, F.; Akbarlo, M. Floristic composition, life forms and geographical distribution (case study: Lashgardar rangelands of Malayer, Iran). J. Environ. Sci. Technol. 2016, 9, 140–148. [Google Scholar] [CrossRef][Green Version]
- Al Shaye, N.A.; Masrahi, Y.S.; Thomas, J. Ecological significance of floristic composition and life forms of Riyadh region, Central Saudi Arabia. Saudi J. Biol. Sci. 2020, 27, 35–40. [Google Scholar] [CrossRef] [PubMed]
- Galal, T.M.; Fahmy, A.G. Plant diversity and community structure of Wadi Gimal protected area, Red Sea Coast of Egypt. Afr. J. Ecol. 2012, 50, 266–276. [Google Scholar] [CrossRef]
- Abbas, M.S.; Afefe, A.A.; Hatab, E.-B.E.; Gaber, E.-S.I. Vegetation-Soil Relationships in Wadi El-Rayan Protected Area, Western Desert, Egypt. Jordan J. Biol. Sci. 2016, 9, 97–107. [Google Scholar]
- Bouallala, M.H.; Neffar, S.; Chenchouni, H. Vegetation traits are accurate indicators of how do plants beat the heat in dry lands: Diversity and functional traits of vegetation associated with water towers in the Sahara Desert. Ecol. Indic. 2020, 114, 106364. [Google Scholar] [CrossRef]
- Mohler, C.L.; Liebman, M. Weed productivity and competition in sole crops and intercrops of barley and field pea. J. Appl. Ecol. 1987, 24, 685–699. [Google Scholar] [CrossRef]
- Hurlbert, S. The non concept of species diversity: A critique and alternative parameters. Ecology 1971, 52, 577–586. [Google Scholar] [CrossRef]
- Jost, L.; Chao, A. Diversity Analysis; Taylor & Francis: Milton Keynes, UK, 2008. [Google Scholar]
- Shaltout, S. Ecological Studies on the Alien Species in the Egyptian Flora. Master’s Thesis, Faculty of Science Tanta University, Tanta, Egypt, 2014; 206p. [Google Scholar]
- Assaeed, A.M.; Al-Rowaily, S.L.; El-Bana, M.I.; Hegazy, A.K.; Dar, B.A.; Abd-ElGawad, A.M. Functional traits plasticity of the invasive herb Argemone ochroleuca sweet in different arid habitats. Plants 2020, 9, 1268. [Google Scholar] [CrossRef] [PubMed]
- Hegazy, A.K.; Soliman, M.I.; Mashaly, I.A. Perspectives on the biology of Heliotropium curassavicum in the Deltaic Mediterranean coast of Egypt. Arab Gulf J. Sci. Res. 1994, 12, 525–545. [Google Scholar]
- Gupta, S.; Narayan, R. Phenotypic plasticity of Chenopodium murale across contrasting habitat conditions in peri-urban areas in Indian dry tropics: Is it indicative of its invasiveness? Plant Ecol. 2012, 213, 493–503. [Google Scholar] [CrossRef]
- Herpigny, B.; Dassonville, N.; Ghysels, P.; Mahy, G.; Meerts, P. Variation of growth and functional traits of invasive knotweeds (Fallopia spp.) in Belgium. Plant Ecol. 2012, 213, 419–430. [Google Scholar] [CrossRef]
- Abd-ElGawad, A.M.; El Gendy, A.E.-N.G.; Assaeed, A.M.; Al-Rowaily, S.L.; Omer, E.A.; Dar, B.A.; Al-Taisan, W.A.A.; Elshamy, A.I. Essential oil enriched with oxygenated constituents from invasive plant Argemone ochroleuca exhibited potent phytotoxic effects. Plants 2020, 9, 998. [Google Scholar] [CrossRef] [PubMed]
- Abd El-Ghani, M.M.; Salama, F.; Salem, B.; El Hadidy, A.; Abdel-Aleem, M. Biogeographical relations of a hyper arid desert flora in Eastern Egypt. Afr. J. Ecol. 2014, 52, 173–191. [Google Scholar] [CrossRef]


| Stands | Latitude (N) | Longitude (E) | Altitude above Sea Level (m) | Stands | Latitude (N) | Longitude (E) | Altitude above Sea Level (m) |
|---|---|---|---|---|---|---|---|
| 1 | 30°1′2.58345″ | 32°5′29.5121″ | 277 | 11 | 29°50′45.68″ | 32°16′4.86″ | 152 |
| 2 | 29°59′33.13075″ | 32°5′56.79499″ | 295 | 12 | 29°51′39.19″ | 32°15′43.54135″ | 163 |
| 3 | 29°58′49.0674″ | 32°7′3.39269″ | 307 | 13 | 29°49′35.08406″ | 32°16′17.25956″ | 131 |
| 4 | 29°58′1.74144″ | 32°8′38.88139″ | 327 | 14 | 29°47′44.49253″ | 32°16′35.06138″ | 109 |
| 5 | 29°57′19.91″ | 32°9′58.45″ | 286 | 15 | 29°47′7.80″ | 32°15′59.88″ | 132 |
| 6 | 29°56′16.55599″ | 32°10′52.53848″ | 258 | 16 | 29°46′16.54″ | 32°15′18.87″ | 113 |
| 7 | 29°55′38.91″ | 32°11′37.12″ | 243 | 17 | 29°45′6.97″ | 32°14′49.35″ | 89 |
| 8 | 29°54′34.95031″ | 32°12′30.83965″ | 223 | 18 | 29°43′59.88″ | 32°14′39.51″ | 78 |
| 9 | 29°53′55.03″ | 32°13′17.35″ | 213 | 19 | 29°43′0.09″ | 32°15′5.75″ | 65 |
| 10 | 29°53′10.26654″ | 32°14′15.37418″ | 190 | 20 | 29°41′54.08515″ | 32°15′7.61404″ | 66 |
| Species | Family | Life Span | Life Form | Floristic Category | Record | Abbreviation |
|---|---|---|---|---|---|---|
| Blepharis attenuata Napper | Acanthaceae | Pe. | Cha. | IR and SA | B | Ble att |
| Blepharis edulis (Forssk.) Pers. | Pe. | Cha. | SA and SZ | B | Ble edu | |
| Aizoon canariensis L. | Aizoaceae | An. | The. | SA and SZ | A | Aiz can |
| Aerva javanica (Burm.f.) Juss. ex Schult. | Amaranthaceae | Pe. | Cha. | SA and SZ | B | Aer jav |
| Deverra tortuosa (Desf.) DC. | Apiaceae | Pe. | Cha. | SA | A,B | Dev tor |
| Calotropis procera (Aiton) W.T. Aiton | Asclepiadaceae | Pe. | Pha. | SA and SZ | A,B | Cal pro |
| Cynanchum acutum L. | Pe. | Hem. | Med, R, and ER | A,B | Cyn acu | |
| Leptadeniapyrotechnica (Forrsk.) Decne. | Pe. | Pha. | SA | A,B | Lep pyr | |
| Pergularia tomentosa L. | Pe. | Cha. | SA | A,B | Per tom | |
| Achilleafragrantissima (Forssk.) Sch. Bip. | Asteraceae | Pe. | Cha. | SA and IR | A,B | Ach fra |
| Artemisia judaica L. | Pe. | Cha. | SA | A | Art jud | |
| Atractylis carduus (Forssk.) C.Chr. | Pe. | Hem. | ME and SA | A | Atr car | |
| Bidens pilosa L. | An. | The. | PAN | A | Bid pil | |
| Centaurea aegyptiaca L. | Bi. | The. | SA | A,B | Cen aeg | |
| Conyza aegyptiaca (L.) Dryand. | An. | The. | Med | A,B | Con aeg | |
| Conyza bonariensis (L.) Cronquist | An. | The. | Med | A,B | Con bon | |
| Cotula cinerea Del. | An. | The. | SA | A | Cot cin | |
| Echinops spinosus L. | Pe. | Hem. | Med and SA | A,B | Ech spi | |
| Ifloga spicata (Forssk.) Sch. Bip. | An. | The. | SA | A | Ifl spi | |
| Iphiona mucronata (Forssk.)Asch. | Pe. | Cha. | SA | A,B | Iph muc | |
| Launaea capitata (Spreng)Dandy | Bi. | The. | SA and SZ | A | Lau cap | |
| Launea nudicalus (L.) Hook. f. | Pe. | Hem. | SA | A,B | Lau nud | |
| Launea spinosa (Forssk.) Sch. Bip. ex Kuntze. | Pe. | Cha. | SA | A,B | Lau spi | |
| Nauplius graveolens (Forssk.)Wilklund | Pe. | Cha. | SA | A,B | Nau gra | |
| Pluchea dioscoridis (L.) DC. | Pe. | Pha. | SA and SZ | A,B | Plu dio | |
| Pulicaria undulata (L.) C.A.Mey. | Pe. | Cha. | SA nd SZ | A,B | Pul und | |
| Reichardia tingitana (L.) Roth | An. | The. | Med and IR | B | Rei tin | |
| Senecio glaucus L. | An. | The. | Med, IR, andSA | A,B | Sen gla | |
| Sonchus oleraceus L. | An. | The. | COSM | A,B | Son ole | |
| Volutaria lippii (L.) Cass. Ex Maire. | An. | The. | SA | A,B | Vol lip | |
| Anchusa humilis (Desf.) I. M. Johnst. | Boraginaceae | An. | The. | Med and SA | B | Anc hum |
| Heliotropiumarabinense Fresen. | Pe. | Cha. | SA | B | Hel ara | |
| Heliotropium digynum (Forssk.) Christens | Pe. | Cha. | SA | A,B | Hel dig | |
| Trichodesmaafricanum (L.) R. Br. | Pe. | Cha. | SA and SZ | A,B | Tri afr | |
| Anastaticahierochuntica L. | Brassicaceae | An. | The. | SA | A,B | Ana hie |
| Brassica tournefortii Gouan. | An. | The. | Med, IR, and SA | A | Bra tou | |
| Diplotaxis acris (Forssk.) Boiss. | An. | The. | SA | A,B | Dip acr | |
| Diplotaxis harra (Forssk.) Boiss. | Pe. | Hem. | Med and SA | A,B | Dip har | |
| Eruca sativa Mill. | An. | The. | Med, IR, R, and SA | B | Eru sat | |
| Farsetia aegyptia Turra. | Pe. | Cha. | SA and SZ | A,B | Far aeg | |
| Matthiola longipetala (Vent.) DC. | An. | The. | Med and IR | A | Mat lon | |
| Zilla spinosa (L.) Prant. | Pe. | Cha. | SA | A,B | Zil spi | |
| Cleome droserifolia (Forssk.) Delile | Capparaceae | Pe. | Cha. | SA and IR | A,B | Cle dro |
| Gymnocarpos decandrus Forssk. | Caryophyllaceae | Pe. | Cha. | SA | A,B | Gym dec |
| Gypsophila capillaris (Forssk.) C. Chr. | Pe. | Hem. | SA and IR | A,B | Gyp cap | |
| Herniaria hemistemon J. Gay | Pe. | Hem. | Med and SA | A | Her hem | |
| Polycarpaea repens (Forssk.) Asch. | Pe. | Cha. | SA | A | Pol rep | |
| Silene viviani Steud. | An. | The. | Med and SA | A | Sil viv | |
| Sphaerocoma hookeri T. Anderson | Pe. | Cha. | SA | A | Sph hoo | |
| Anabasis setifera Moq. | Chenopodiaceae | Pe. | Cha. | SA | B | Ana Moq |
| Bassia indica (Wight) Scott. | An. | The. | IR and SZ | A | Bas ind | |
| Bassia muricata (L.) Asch. | An. | The. | IR and SA | A | Bas mur | |
| Chenopodium murale L. | An. | The. | COSM | A,B | Che mur | |
| Haloxylonsalicornicum (Moq.) Bunge | Pe. | Cha. | SA | A,B | Hal sal | |
| Helianthemum lippi (L.) Dum. Cours. | Cistaceae | Pe. | Cha. | SA and SZ | A | Hel lip |
| Cleome amblyocarpa Barratte and Murb. | Cleomaceae | An. | The. | IR and SA | A | Cle amb |
| Convolvulus hystrix Vahl | Convolvulaceae | Pe. | Cha. | SA and SZ | B | Con hys |
| Citrullus colocynthis (L.) Schrad. | Cucurbitaceae | Pe. | Hem. | SA | B | Cit col |
| Ephedra alata Decne. | Ephedraceae | Pe. | Cha. | SA | B | Eph ala |
| Chrozophora plicata (Vahl) A. Juss. ex Spreng. | Euphorbiaceae | An. | The. | SZ | B | Chr pli |
| Euphorbia peplus L. | An. | The. | Med, IR, and ER | A,B | Eup pep | |
| Euphorbia prostrata Aiton | An. | The. | PAN | A | Eup pro | |
| Euphorbia retusa Forssk. | Pe. | Hem. | SA | A,B | Eup ret | |
| Euphorbia exigua L. | An. | The. | Med and IR | B | Eup | |
| Acacia tortilis (Forssk.) Hayne | Fabaceae | Pe. | Pha. | SA and SZ | A,B | Aca tor |
| Astraglus spinosus (Forssk.) Muschl. | Pe. | Cha. | Med, IR, and SA | A | Ast spi | |
| Crotalaria aegyptiaca Benth. | Pe. | Cha. | SA | A,B | Cro aeg | |
| Lotus glinoides Delile | An. | The. | SZ | A | Lot gli | |
| Melilotus indicus (L.) All. | An. | The. | Med, IR, and SA | A | Mel ind | |
| Retama raetam (Forssk.) Webb and Berthel. | Pe. | Pha. | SA | A,B | Ret rae | |
| Senna alexandrina Mill. | Pe. | Cha. | SA and SZ | A | Sen ale | |
| Trigonella stellata Forssk. | An. | The. | SA and IR | A,B | Tri ste | |
| Erodium crassifolium L′Her. | Geraniaceae | Pe. | Hem. | SA | B | Ero cra |
| Erodium glaucophyllum (L.) L′Hér. | Pe. | Hem. | SA | B | Ero gla | |
| Erodium laciniatum (Cav.) Wild. subsp. Laciniatum | An. | The. | Med | A,B | Ero lac | |
| Erodium laciniatum (Cav.) Wild. subsp. Pulverulentum | An. | The. | Med | A,B | Ero lac | |
| Lavandula coronopifolia Poir. | Lamiaceae | Pe. | Cha. | SA | A,B | Lav cor |
| Salvia aegyptiaca L. | Pe. | Cha. | IR and SA | A | Sal aeg | |
| Salvia deserti Decne. | Pe. | Cha. | SA and IR | A,B | Sal des | |
| Asphodelus fistulosus L. | Liliaceae | An. | The. | Med, IR, and SA | A | Asp fis |
| Malva parvifolra L. | Malvaceae | An. | The. | Med and IR | A,B | Mal par |
| Neurada procumbens L. | Neuradaceae | An. | The. | IR and SA | A | Neu pro |
| Nitraria retusa (Forssk.) Asch. | Nitrariaceae | Pe. | Pha. | SA | B | Nit ret |
| Orobanche crenata Forssk. | Orobanchaceae | An. | Parasite | Med and IR | B | Oro cre |
| Medicago laciniata (L.) Mill. | Fabaceae | An. | The. | SA | B | Med (L. |
| Plantago ovata Forssk. | Plantaginaceae | An. | The. | Med, IR, and SA | A,B | Pla ova |
| Avena fatua L. | Poaceae | An. | The. | PAL | A | Ave fat |
| Imperata cylindrica (L.) Raeusch | Pe. | Hem. | Med, IR, and SA | A,B | Imp cyl | |
| Lasiurus scindicus Henrard. | Pe. | Hem. | SA and SZ | A | Las sci | |
| Lolium multiflorum Lam. | An. | The. | Med, IR, and ER | A | Lol mul | |
| Panicum turgidum Forssk. | Pe. | Hem. | SA | A,B | Pan tur | |
| Pennisetum divisum Forssk. Ex J. F. Gmel | Pe. | Hem. | SA | A | Pen div | |
| Phalaris minor Retz. | An. | The. | Med and IR | A | Pha min | |
| Phragmites australis (Cav.) Trin. ex Steud. | Pe. | Geophyte | COSM | A,B | Phr aus | |
| Poa annua L. | An. | The. | COSM | A | Poa ann | |
| Schismus barbatus (L.) Thell. | An. | The. | Med, IR, and SA | A | Sch bar | |
| Trisetaria linearis Forssk. | An. | The. | Med and IR | A | Tri lin | |
| Emex spinosa (L.) Campd. | Polygonaceae | An. | The. | Med and SA | A | Eme spi |
| Rumex vesicarius L. | Polygonaceae | An. | The. | Med, SA, and SZ | A,B | Rum ves |
| Caylusea hexagyna (Forssk.) M. L. Green | Resedaceae | An. | The. | SA and SZ | A | Cay hex |
| Ochradenus baccatus Delile. | Pe. | Pha. | SA | A,B | Och bac | |
| Reseda decursiva Forssk. | An. | The. | SA | A,B | Res dec | |
| Haplophyllum tuberculatum (Forssk.) A. Juss. | Rutaceae | Pe. | Hem. | SA | A,B | Hap tub |
| Kickxia aegyptiaca (L.) Nabelek | Scrophulariaceae | Pe. | Cha. | Med and SA | A,B | Kic aeg |
| Scrophularia deserti Delile | Pe. | Cha. | SA | A,B | Scr des | |
| Hyoscyamus muticus L. | Solanaceae | Pe. | Cha. | IR and SA | A | Hyo mut |
| Lycium shawii Roem. and Schult. | Pe. | Pha. | SA and SZ | A,B | Lyc sha | |
| Solanum nigrum L. | An. | The. | COSM | B | Sol nig | |
| Reaumuria hirtella Jaub. and Spach. | Tamaricaceae | Pe. | Cha. | IR and SA | A,B | Rea hir |
| Tamarix aphylla (L.) H. Karst. | Pe. | Cha. | SA, IR, and SZ | A,B | Tam aph | |
| Tamarix nilotica(Ehrenb.) Bunge | Pe. | Pha. | SA and SZ | A,B | Tam nil | |
| Forsskaolea tenacissima L. | Urticaceae | Pe. | Hem. | SA and SZ | A | For ten |
| Verbena officinalis L. | Verbenaceae | Pe. | Hem. | Med and SA | A | Ver off |
| Fagonia arabica L. | Zygophyllaceae | Pe. | Cha. | SA | A,B | Fag ara |
| Fagonia mollis Delile | Pe. | Cha. | SA | A,B | Fag mol | |
| Zygophyllumcoccineum L. | Pe. | Cha. | SA and SZ | A,B | Zyg coc | |
| Zygophyllumdecumbens Delile | Pe. | Cha. | SA | A,B | Zyg dec | |
| Zygophyllum simplex L. | An. | The. | PAL | A,B | Zyg sim |
| Soil Factor | Mean ± Standard Error | Range (Max–Min) | Standard Deviation | Median | Interquartile Range (IQR) |
|---|---|---|---|---|---|
| pH | 8 ± 0.0736 | 1.1 (8.5–7.4) | 0.329 | 8.1 | 0.55 |
| T.D.S. (ppm) | 1077.65 ± 508.726 | 9,758 (9840–82) | 2,275.094 | 360.5 | 533 |
| E.C. (dS/m) | 1.684 ± 0.795 | 15.247 (15.375–0.128) | 3.555 | 0.563 | 0.832 |
| Ca+2 (meq/L) | 6.353 ± 2.537 | 48.3 (49–0.7) | 11.346 | 2.65 | 2.952 |
| Mg+2 (meq/L) | 3.053 ± 1.366 | 27.78 (28–0.22) | 6.108 | 1.27 | 1.37 |
| Na+ (meq/L) | 6.025 ± 3.421 | 62.79 (63–0.21) | 15.301 | 1.15 | 2.205 |
| K+ (meq/L) | 1.18 ± 0.565 | 11.096 (11.2–0.104) | 2.528 | 0.165 | 1.288 |
| CO3−2 (%) | 0.225 ± 0.0231 | 0.3 (0.45–0.15) | 0.103 | 0.15 | 0.15 |
| HCO3− (%) | 0.32 ± 0.0153 | 0.305 (0.61–0.305) | 0.0682 | 0.305 | 0 |
| Cl− (meq/L) | 4.532 ± 2.278 | 42.5 (43–0.5) | 10.189 | 1.235 | 1.37 |
| SO4−2 (meq/L) | 9.57 ± 3.961 | 74.8 (76–1.2) | 17.714 | 3.9 | 4.75 |
| Organic carbon (%) | 0.888 ± 0.079 | 1.2 (1.32–0.12) | 0.353 | 0.84 | 0.66 |
| Sand (%) | 83.333 ± 0.19 | 3.05 (84.7–81.65) | 0.851 | 83.4 | 1.428 |
| Silt (%) | 13.31 ± 0.137 | 1.9 (14.3–12.4) | 0.613 | 13.4 | 1.15 |
| Clay (%) | 3.357 ± 0.165 | 2.64 (4.7–2.06) | 0.739 | 3.325 | 1.087 |
Publisher’s Note: MDPI stays neutral with regard to jurisdictional claims in published maps and institutional affiliations. |
© 2021 by the authors. Licensee MDPI, Basel, Switzerland. This article is an open access article distributed under the terms and conditions of the Creative Commons Attribution (CC BY) license (https://creativecommons.org/licenses/by/4.0/).
Share and Cite
Bedair, R.; Ibrahim, A.A.; Alyamani, A.A.; Aloufi, S.; Ramadan, S. Impacts of Anthropogenic Disturbance on Vegetation Dynamics: A Case Study of Wadi Hagul, Eastern Desert, Egypt. Plants 2021, 10, 1906. https://doi.org/10.3390/plants10091906
Bedair R, Ibrahim AA, Alyamani AA, Aloufi S, Ramadan S. Impacts of Anthropogenic Disturbance on Vegetation Dynamics: A Case Study of Wadi Hagul, Eastern Desert, Egypt. Plants. 2021; 10(9):1906. https://doi.org/10.3390/plants10091906
Chicago/Turabian StyleBedair, Ramadan, Amira A. Ibrahim, Amal A. Alyamani, Salman Aloufi, and Samah Ramadan. 2021. "Impacts of Anthropogenic Disturbance on Vegetation Dynamics: A Case Study of Wadi Hagul, Eastern Desert, Egypt" Plants 10, no. 9: 1906. https://doi.org/10.3390/plants10091906
APA StyleBedair, R., Ibrahim, A. A., Alyamani, A. A., Aloufi, S., & Ramadan, S. (2021). Impacts of Anthropogenic Disturbance on Vegetation Dynamics: A Case Study of Wadi Hagul, Eastern Desert, Egypt. Plants, 10(9), 1906. https://doi.org/10.3390/plants10091906