
Screening for Higher Grain Yield and Biomass among Sixty Bread Wheat Genotypes Grown under Elevated CO2 and High-Temperature Conditions

 , ,
, ,  and
and
Abstract
1. Introduction
2. Results
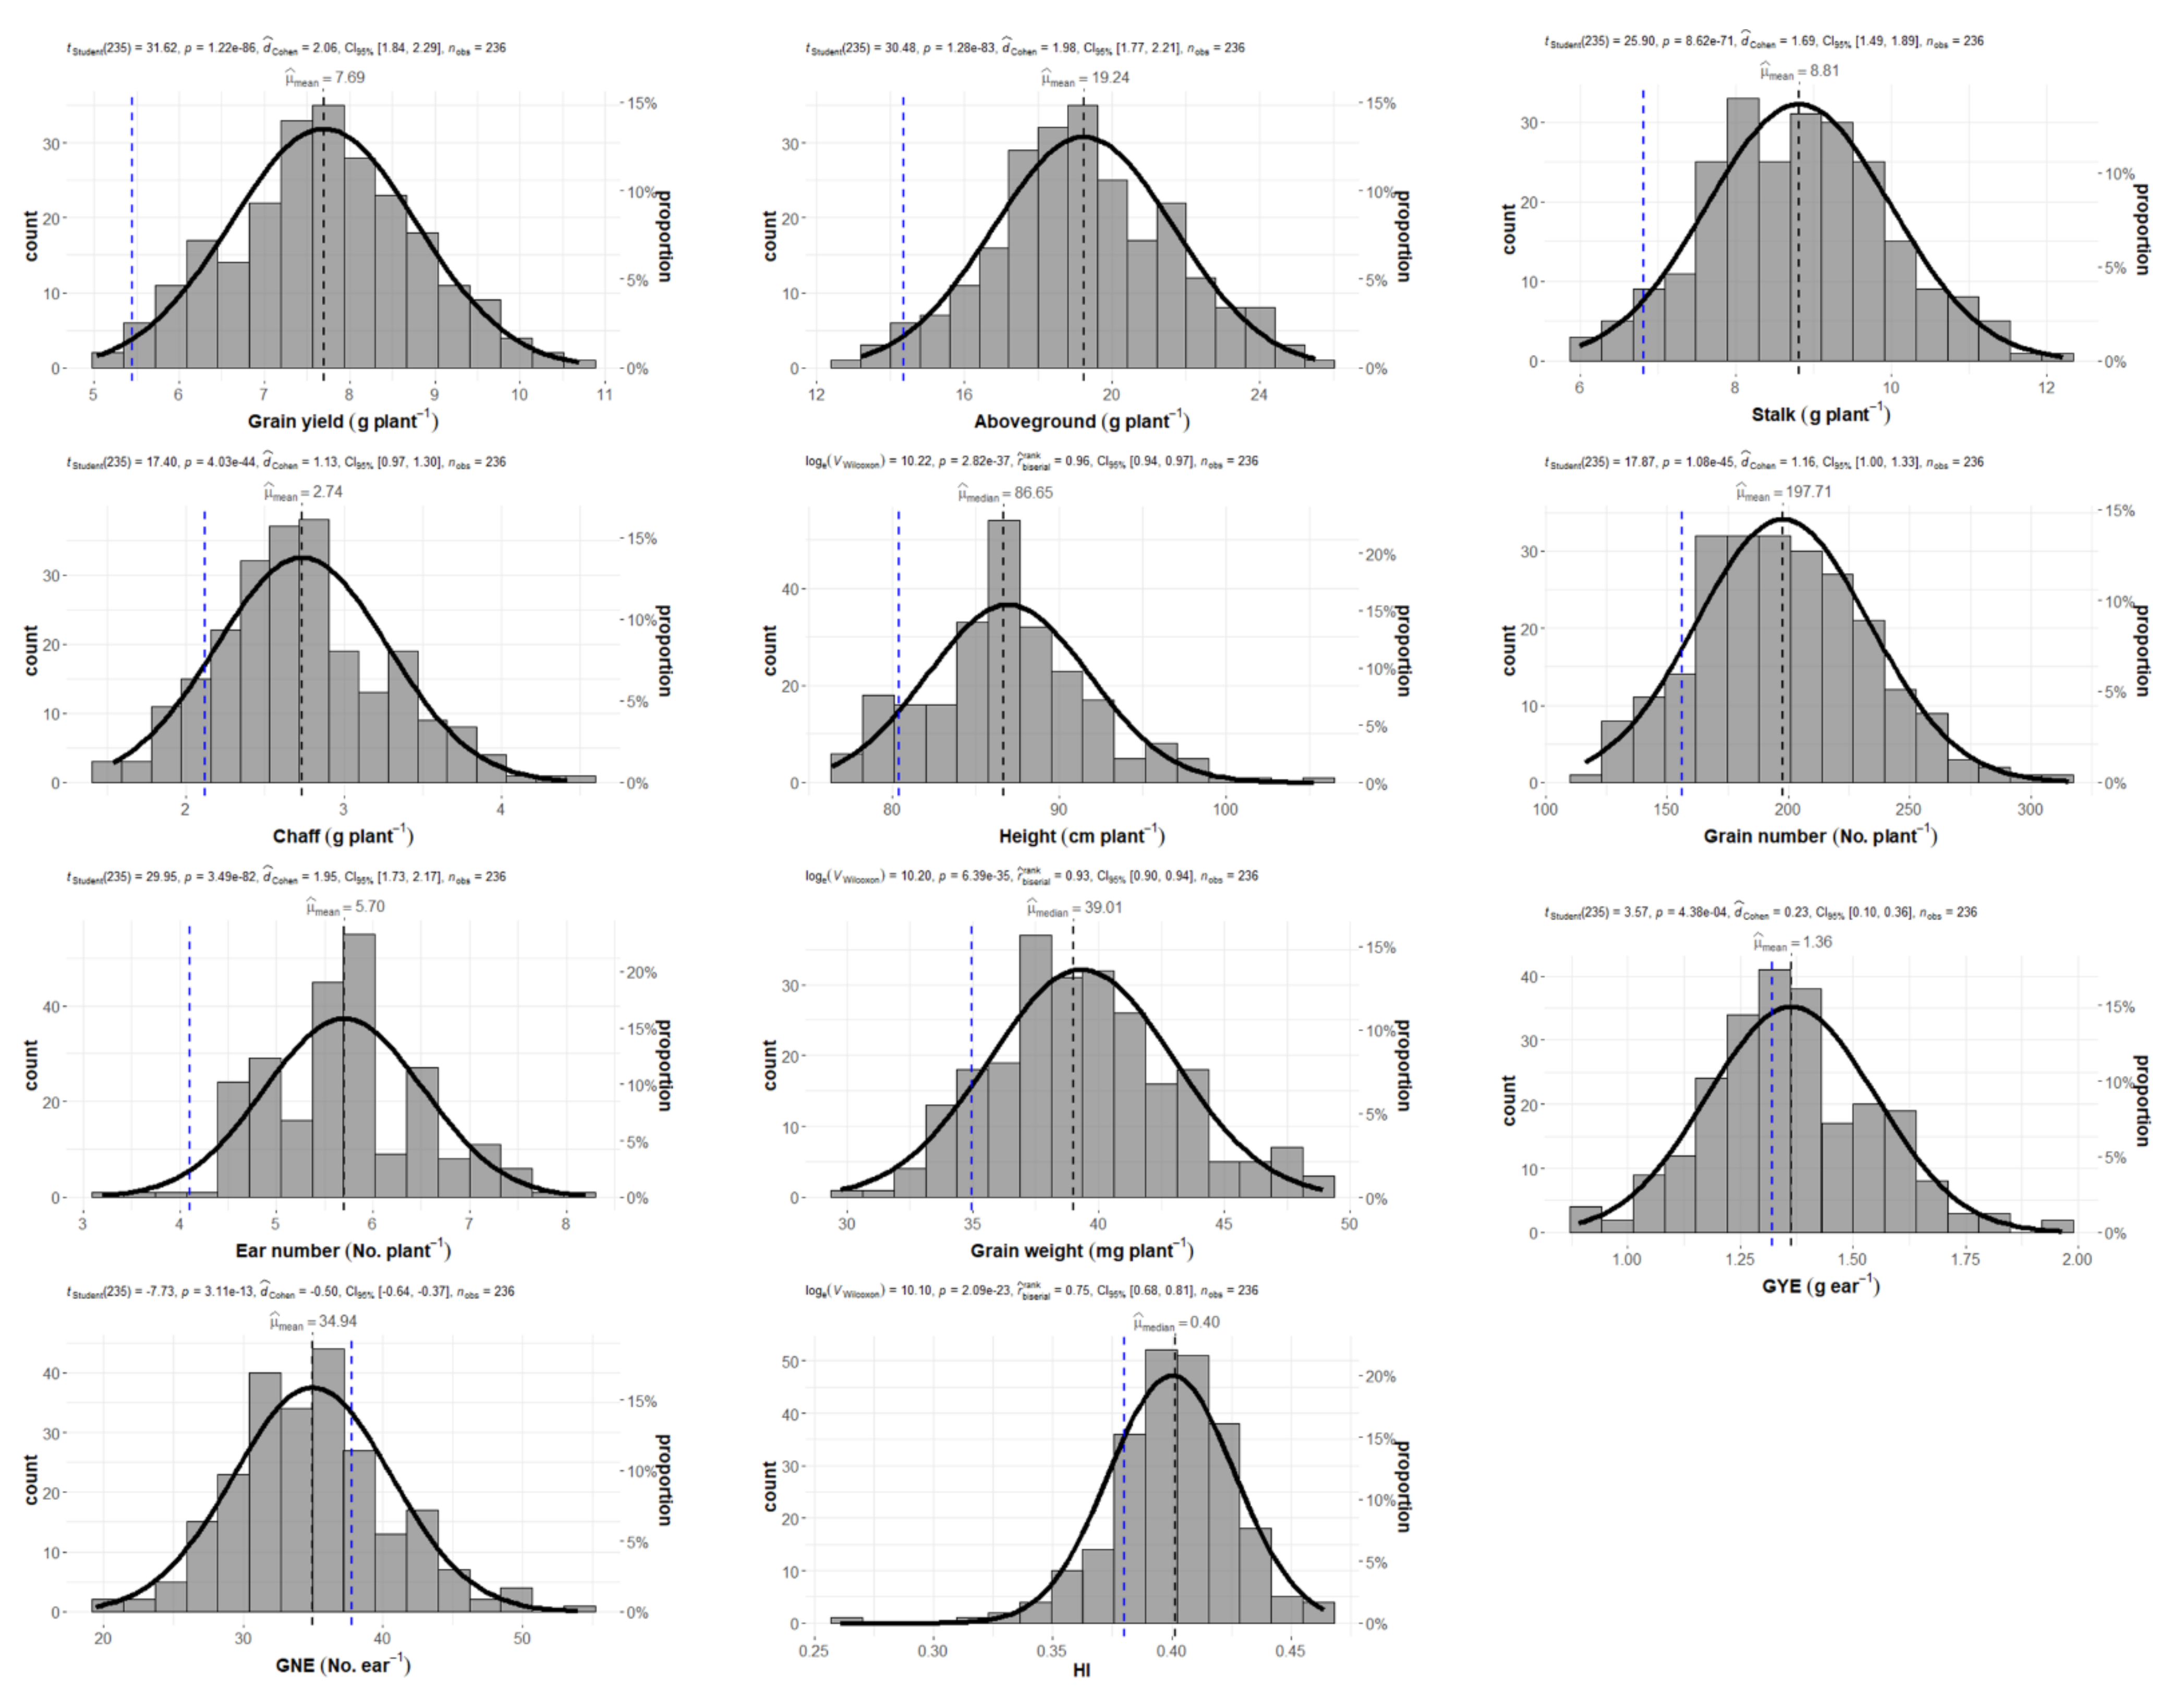
2.1. Wheat Production and Grain Yield Components
2.2. Comparison between the CIMMYT Population and Gazul
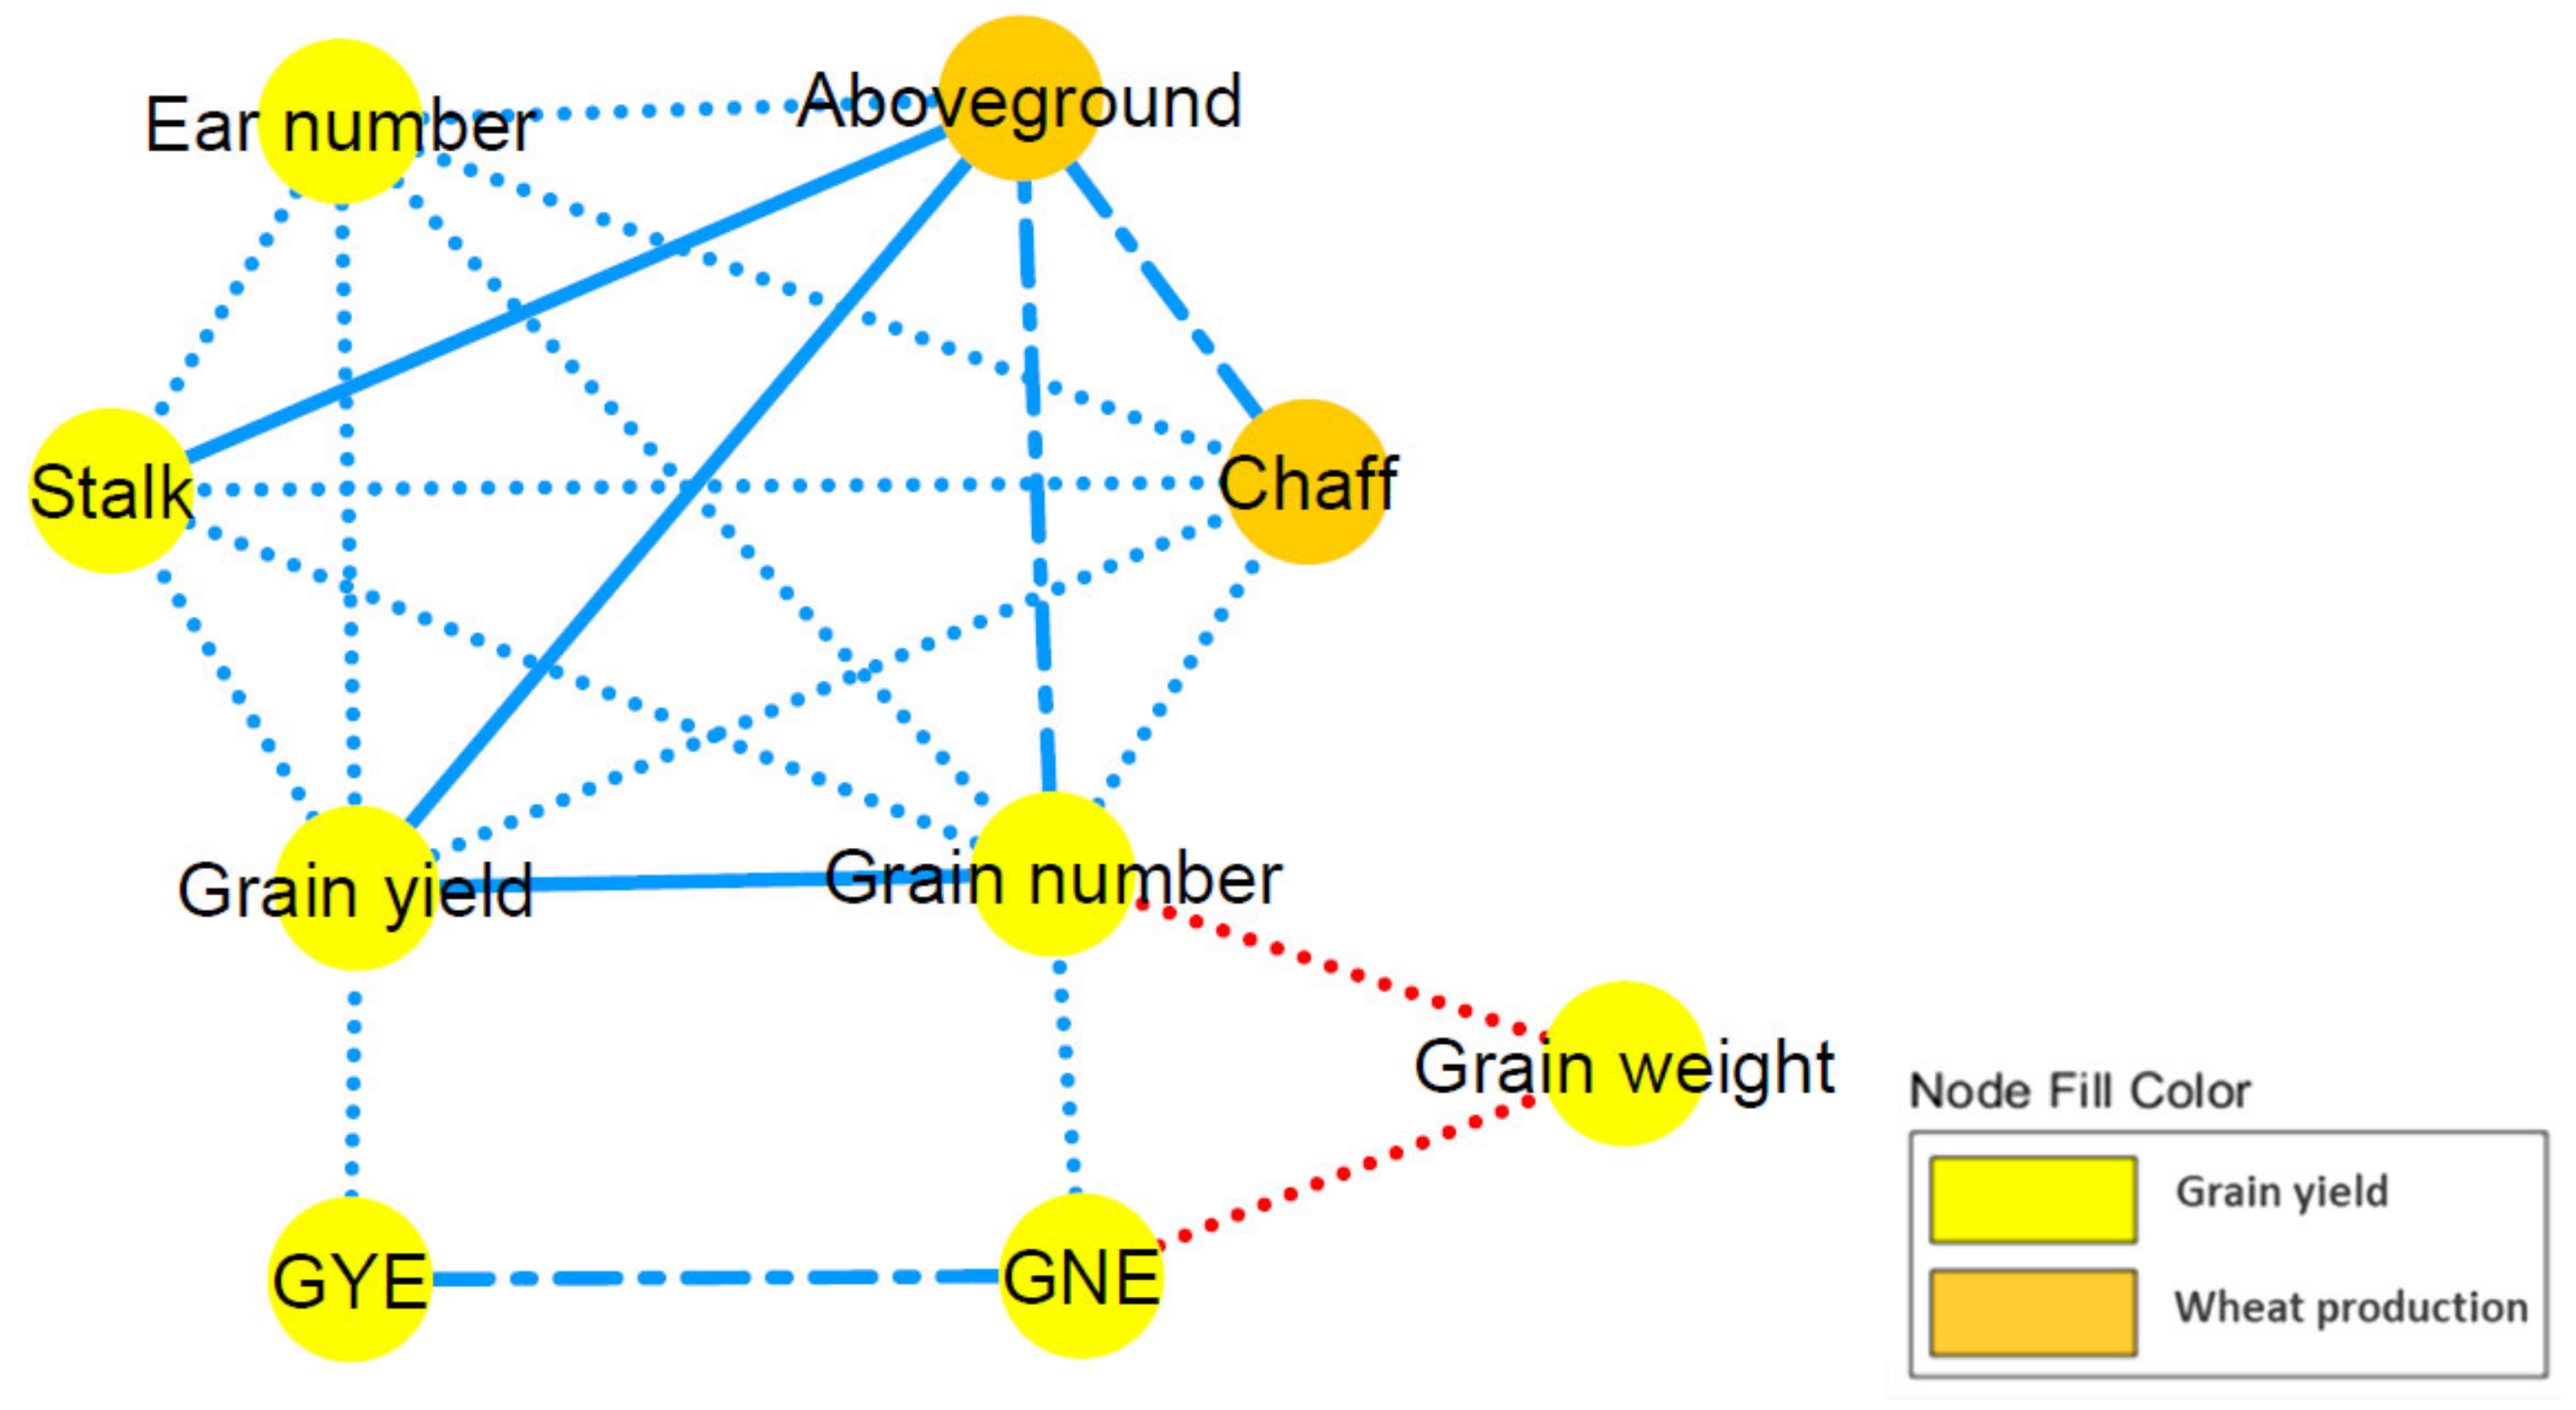
2.3. Correlation Network and Coefficient Matrix
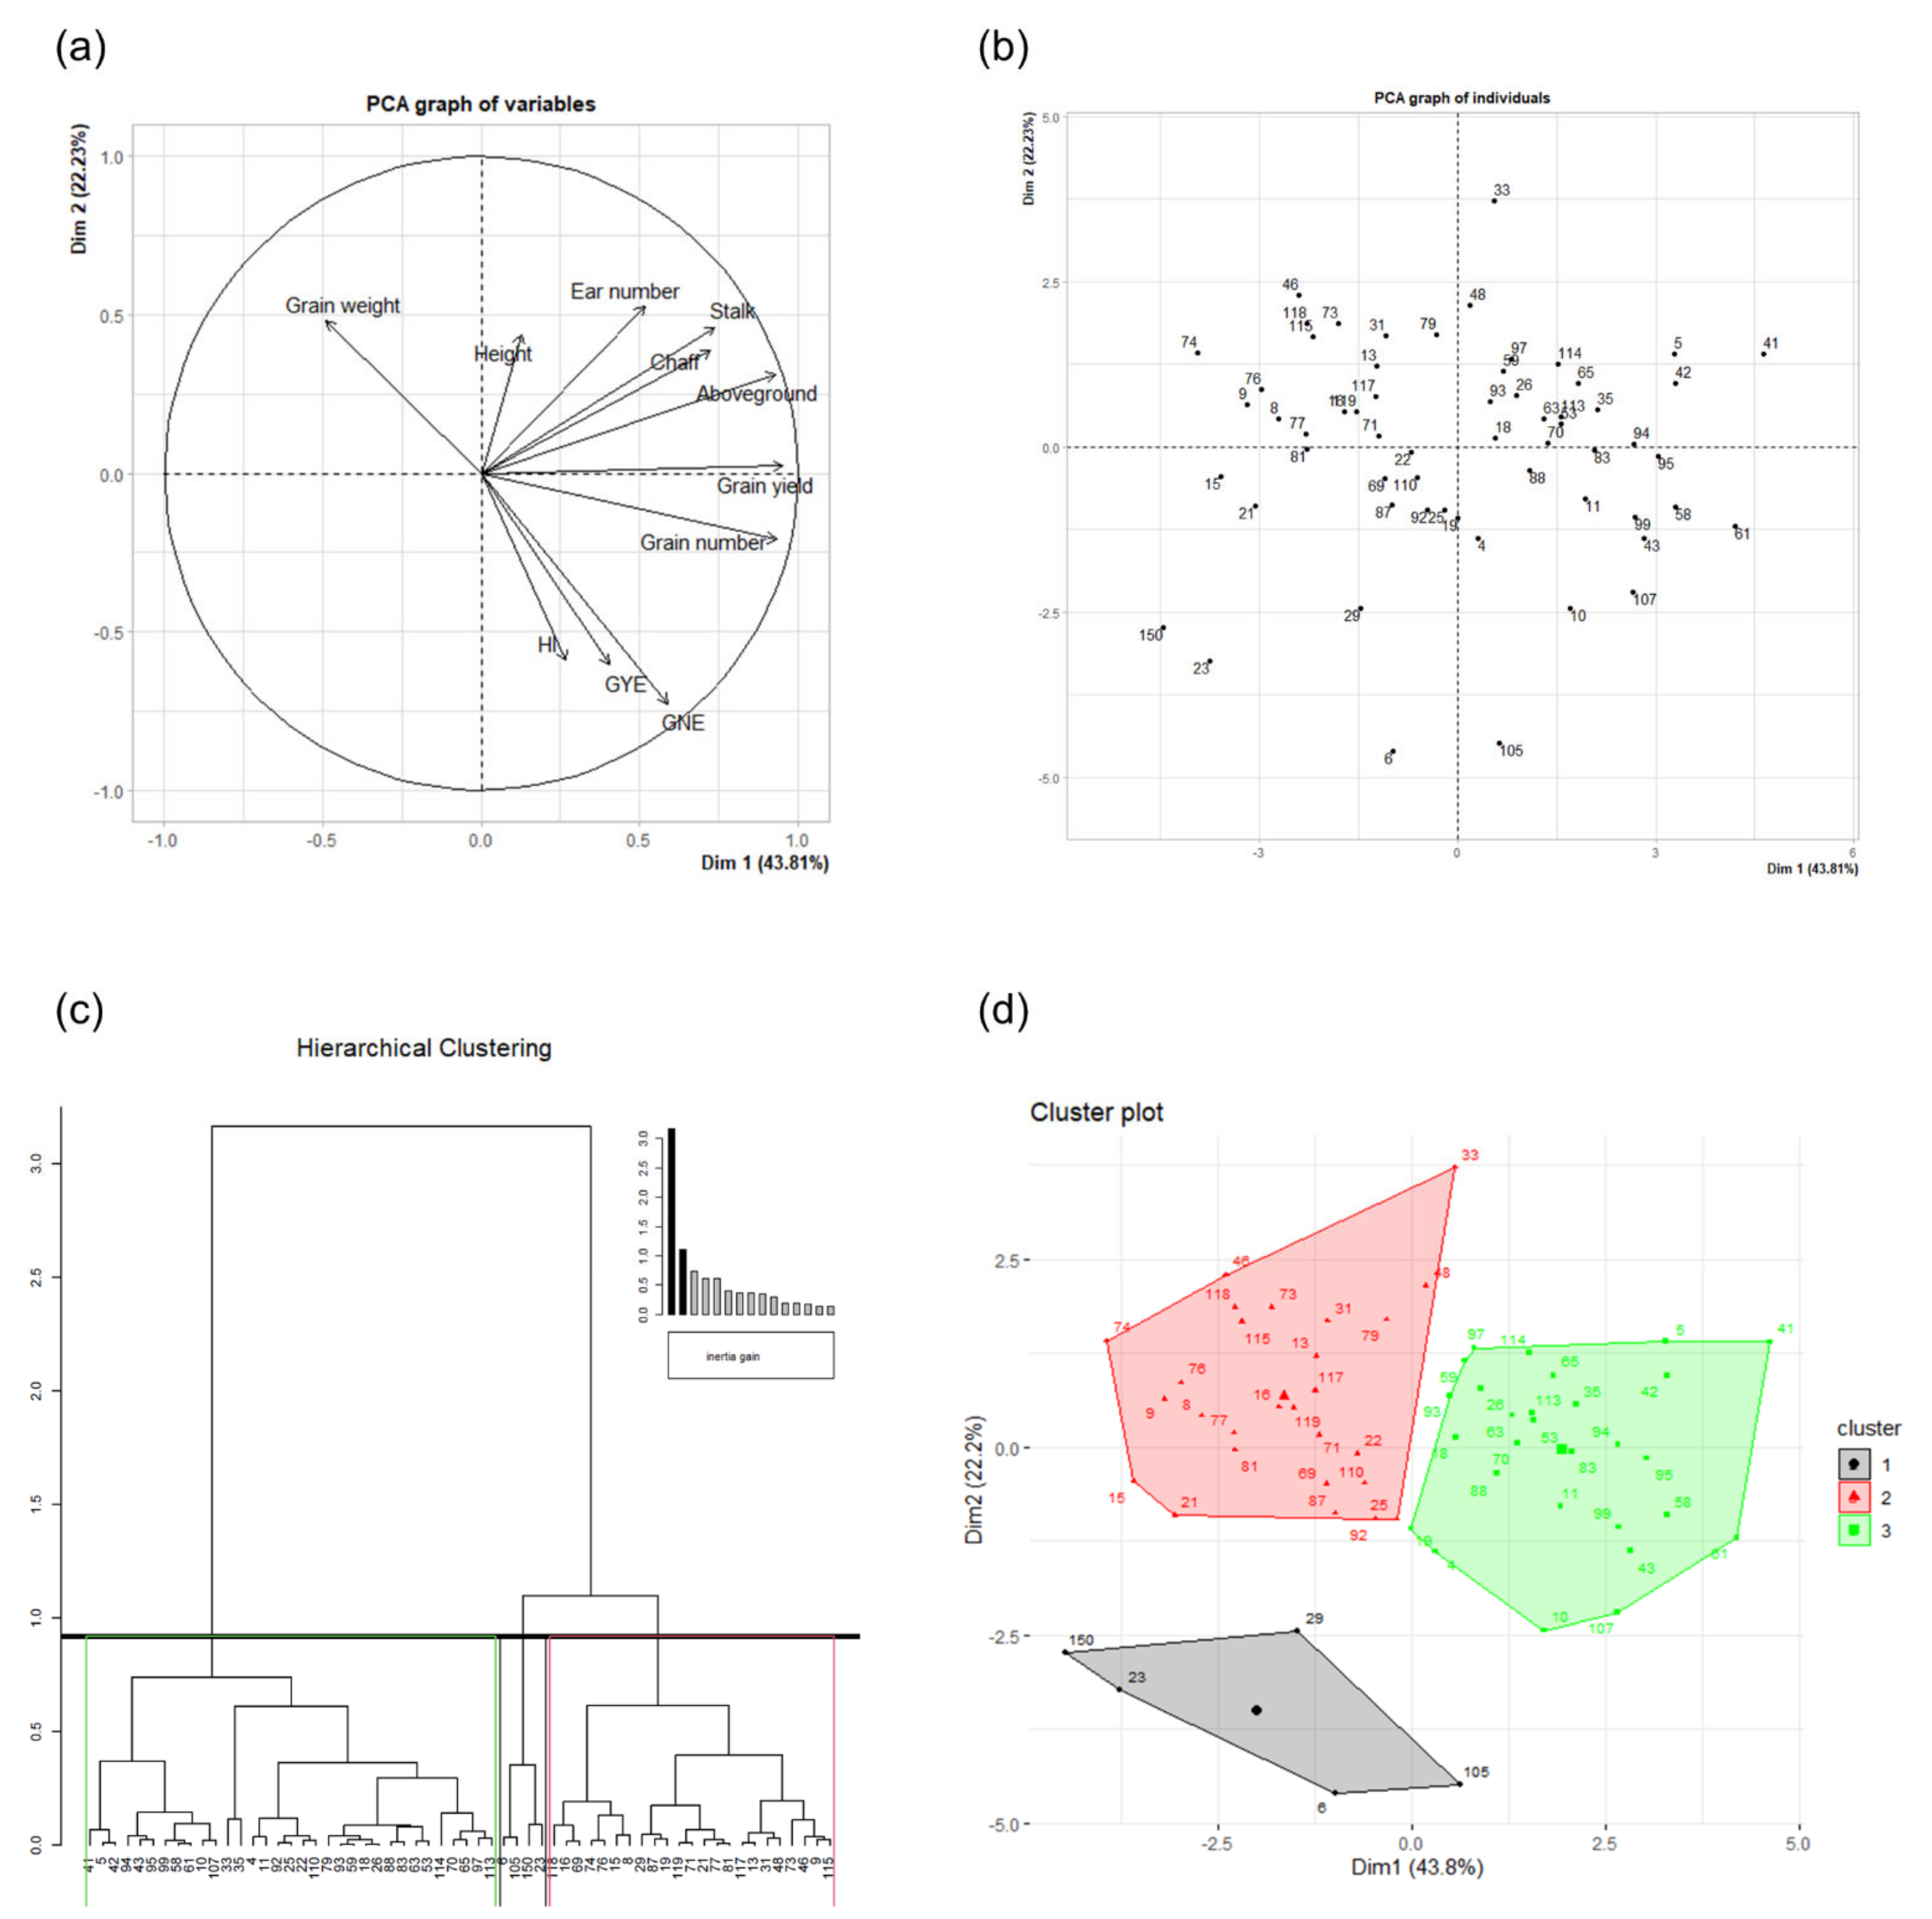
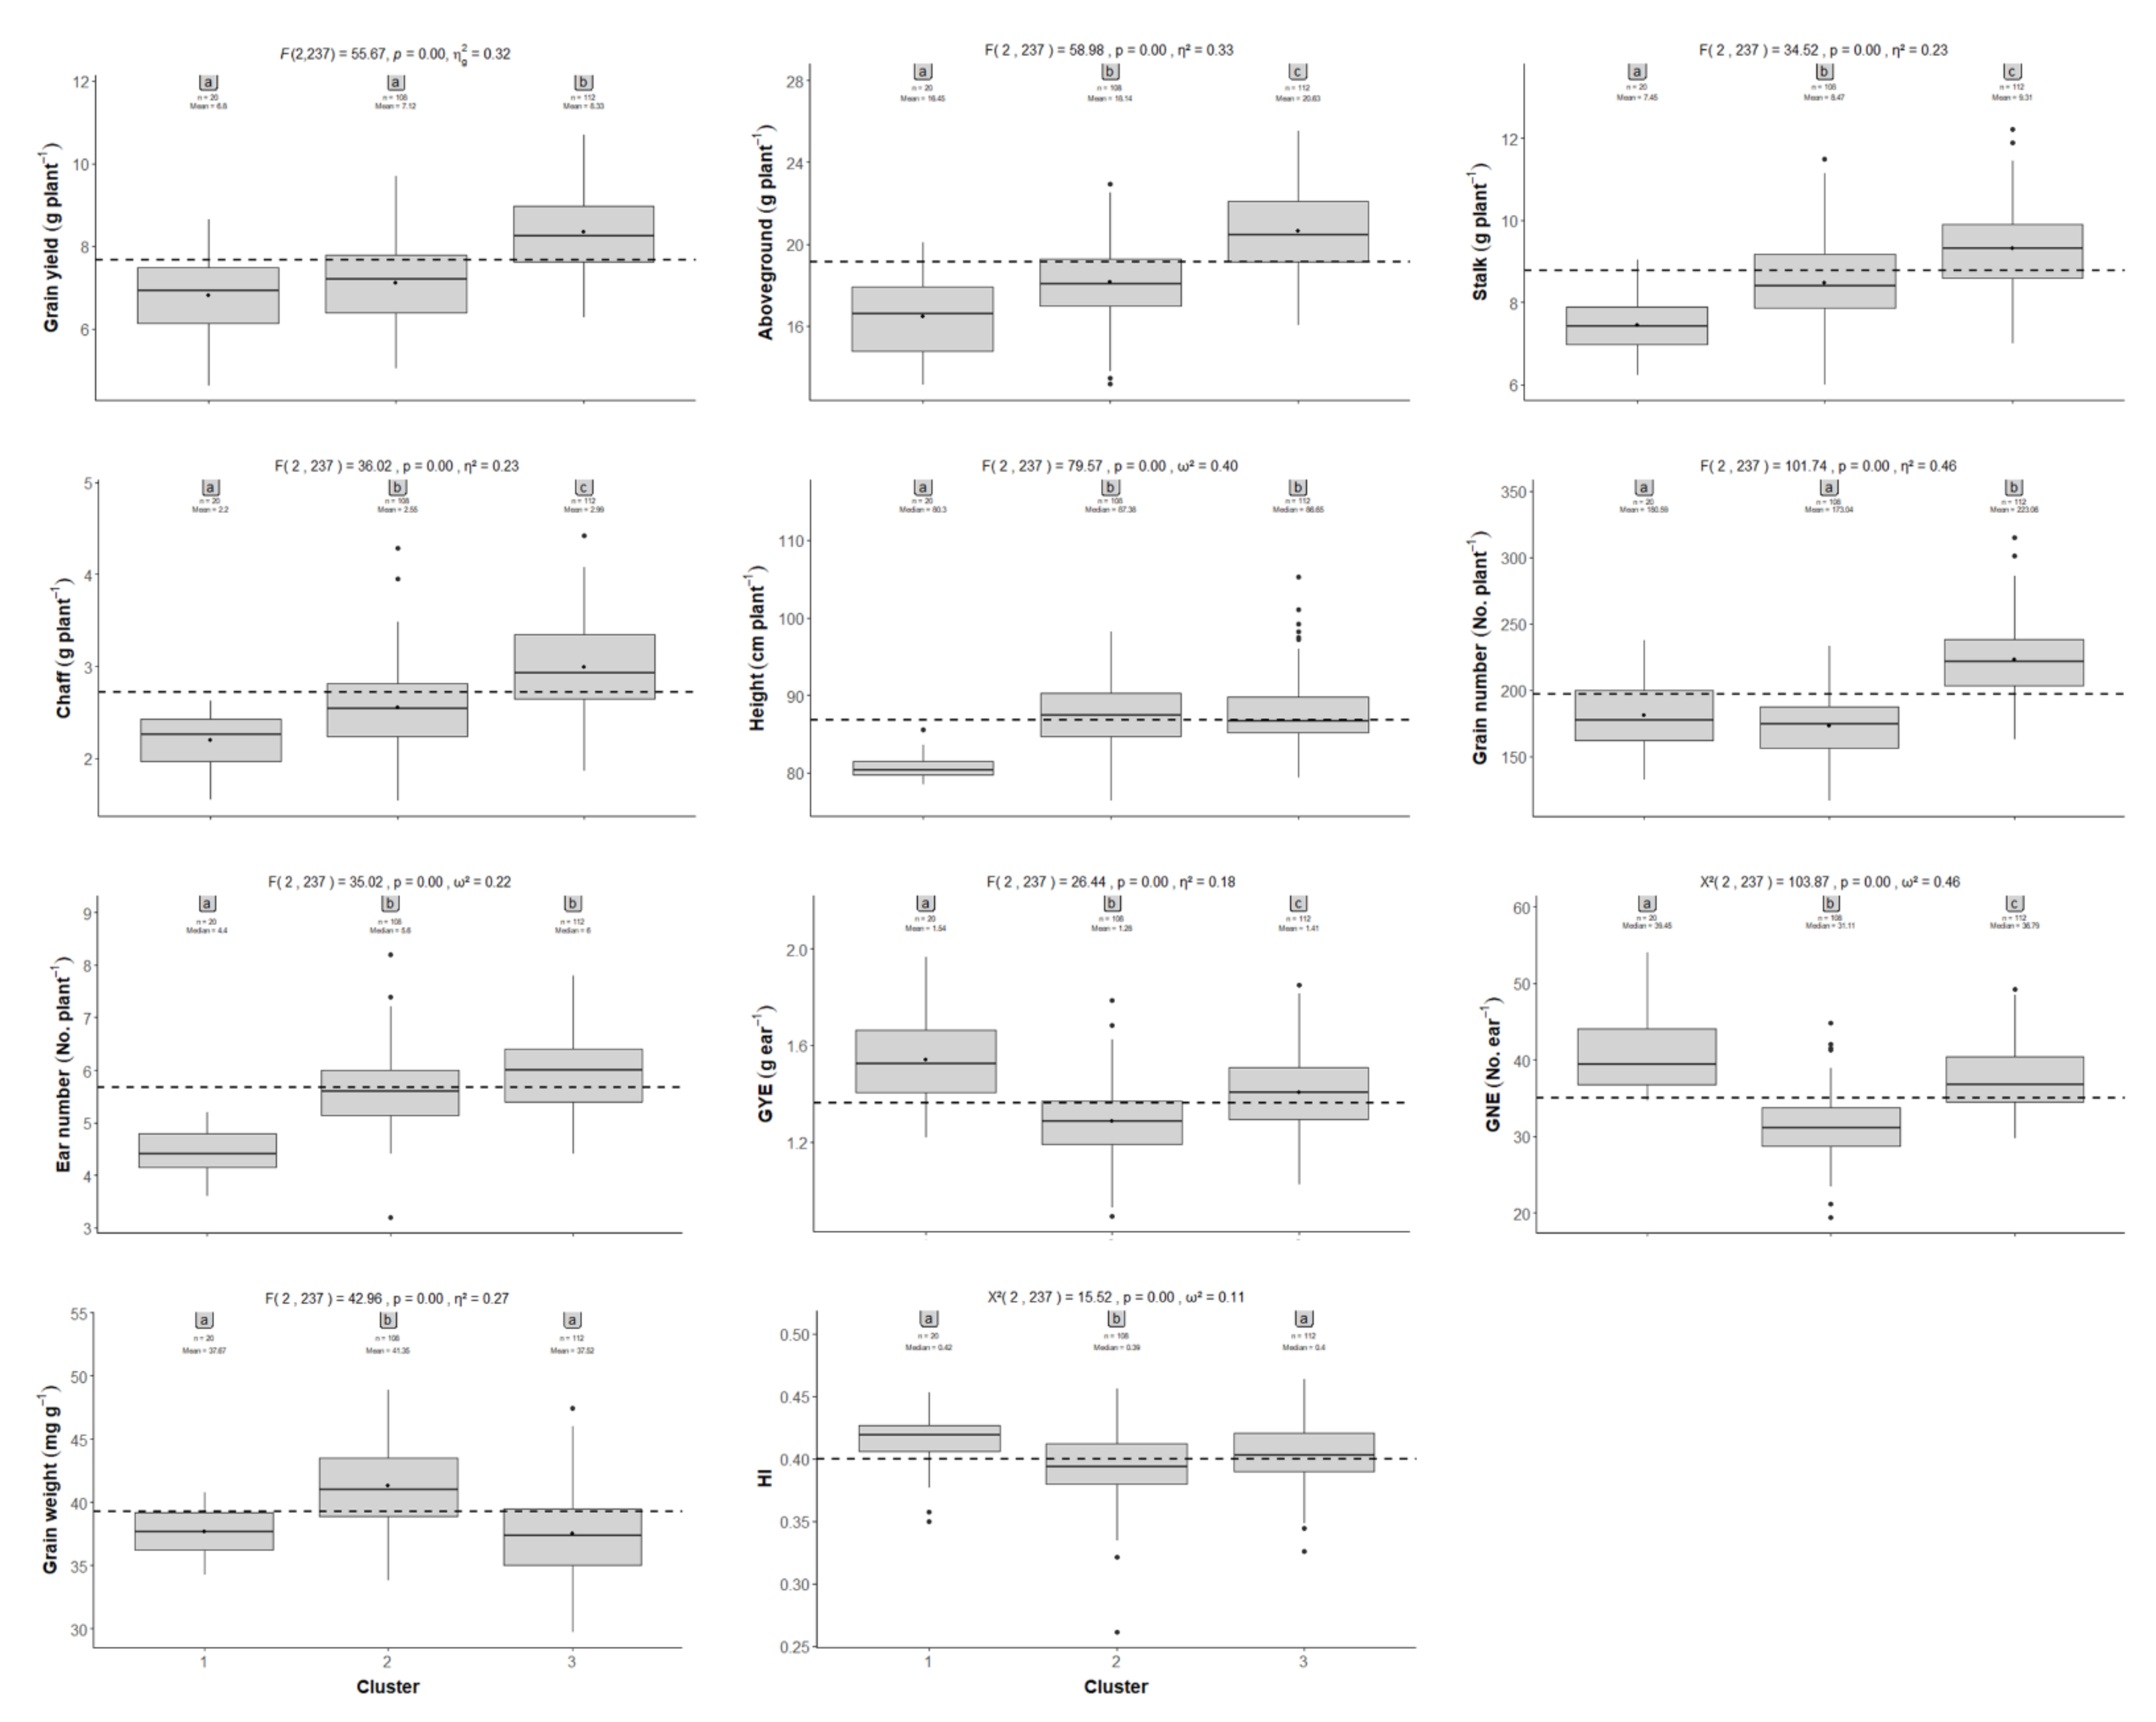
2.4. Principal Component and Hierarchical Clustering Analyses
2.5. Days from Sowing to Ear Emergence, Anthesis and Maturity
3. Discussion
4. Materials and Methods
4.1. Plant Material and Experimental Conditions
4.2. Evaluation of Phenological Traits
4.3. Harvesting and Yield Component Determination
4.4. Statistical Analysis
5. Conclusions
Supplementary Materials
Author Contributions
Funding
Institutional Review Board Statement
Informed Consent Statement
Data Availability Statement
Acknowledgments
Conflicts of Interest
References
- IPCC Climate Change 2014: Synthesis Report. Contribution of Working Groups I, II and III to the Fifth Assessment Report of the Intergovernmental Panel on Climate Change; IPCC: Geneva, Switzerland, 2014.
- NOAA-ESRL Trends in atmospheric carbon dioxide. Available online: https://www.esrl.noaa.gov/gmd/ccgg/trends/index.html (accessed on 1 July 2021).
- Lobell, D.B.; Schlenker, W.; Costa-Roberts, J. Climate trends and global crop production since 1980. Science 2011, 333, 616–620. [Google Scholar] [CrossRef]
- Cai, C.; Yin, X.; He, S.; Jiang, W.; Si, C.; Struik, P.C.; Luo, W.; Li, G.; Xie, Y.; Xiong, Y.; et al. Responses of wheat and rice to factorial combinations of ambient and elevated CO2 and temperature in FACE experiments. Glob. Chang. Biol. 2016, 22, 856–874. [Google Scholar] [CrossRef]
- Driever, S.M.; Lawson, T.; Andralojc, P.J.; Raines, C.A.; Parry, M.A.J. Natural variation in photosynthetic capacity, growth, and yield in 64 field-grown wheat genotypes. J. Exp. Bot. 2014, 65, 4959–4973. [Google Scholar] [CrossRef]
- Abdelrahman, M.; Burritt, D.J.; Gupta, A.; Tsujimoto, H.; Tran, L.-S.P. Heat stress effects on source–sink relationships and metabolome dynamics in wheat. J. Exp. Bot. 2020, 71, 543–554. [Google Scholar] [CrossRef]
- Long, S.P.; Ainsworth, E.A.; Rogers, A.; Ort, D.R. Rising atmospheric carbon dioxide: Plants FACE the future. Annu. Rev. Plant Biol. 2004, 55, 591–628. [Google Scholar] [CrossRef]
- Ainsworth, E.A.; Rogers, A. The response of photosynthesis and stomatal conductance to rising [CO2]: Mechanisms and environmental interactions. Plant Cell Environ. 2007, 30, 258–270. [Google Scholar] [CrossRef]
- Pérez, P.; Morcuende, R.; Martín del Molino, I.; Martínez-Carrasco, R. Diurnal changes of Rubisco in response to elevated CO2, temperature and nitrogen in wheat grown under temperature gradient tunnels. Environ. Exp. Bot. 2005, 53, 13–27. [Google Scholar] [CrossRef]
- Gutiérrez, D.; Gutiérrez, E.; Pérez, P.; Morcuende, R.; Verdejo, A.L.; Martinez-Carrasco, R. Acclimation to future atmospheric CO2 levels increases photochemical efficiency and mitigates photochemistry inhibition by warm temperatures in wheat under field chambers. Physiol. Plant. 2009, 137, 86–100. [Google Scholar] [CrossRef] [PubMed]
- Pérez, P.; Alonso, A.; Zita, G.; Morcuende, R.; Martínez-Carrasco, R. Down-regulation of Rubisco activity under combined increases of CO2 and temperature minimized by changes in Rubisco kcat in wheat. Plant Growth Regul. 2011, 65, 439–447. [Google Scholar] [CrossRef]
- Vicente, R.; Pérez, P.; Martínez-Carrasco, R.; Usadel, B.; Kostadinova, S.; Morcuende, R. Quantitative RT-PCR platform to measure transcript levels of C and N metabolism-related genes in durum wheat: Transcript profiles in elevated [CO2] and high temperature at different levels of n supply. Plant Cell Physiol. 2015, 56, 1556–1573. [Google Scholar] [CrossRef] [PubMed]
- Martínez-Carrasco, R.; Pérez, P.; Morcuende, R. Interactive effects of elevated CO2, temperature and nitrogen on photosynthesis of wheat grown under temperature gradient tunnels. Environ. Exp. Bot. 2005, 54, 49–59. [Google Scholar] [CrossRef]
- Aranjuelo, I.; Cabrera-Bosquet, L.; Morcuende, R.; Avice, J.C.; Nogués, S.; Araus, J.L.; Martínez-Carrasco, R.; Pérez, P. Does ear C sink strength contribute to overcoming photosynthetic acclimation of wheat plants exposed to elevated CO2? J. Exp. Bot. 2011, 62, 3957–3969. [Google Scholar] [CrossRef]
- Taub, D.R.; Wang, X. Why are nitrogen concentrations in plant tissues lower under elevated CO2? A critical examination of the hypotheses. J. Integr. Plant Biol. 2008, 50, 1365–1374. [Google Scholar] [CrossRef]
- Carlisle, E.; Myers, S.; Raboy, V.; Bloom, A. The effects of inorganic nitrogen form and CO2 concentration on wheat yield and nutrient accumulation and distribution. Front. Plant Sci. 2012, 3, 1–13. [Google Scholar] [CrossRef] [PubMed]
- Leakey, A.D.B.; Ainsworth, E.A.; Bernacchi, C.J.; Rogers, A.; Long, S.P.; Ort, D.R. Elevated CO2 effects on plant carbon, nitrogen, and water relations: Six important lessons from FACE. J. Exp. Bot. 2009, 60, 2859–2876. [Google Scholar] [CrossRef]
- Högy, P.; Wieser, H.; Köhler, P.; Schwadorf, K.; Breuer, J.; Franzaring, J.; Muntifering, R.; Fangmeier, A. Effects of elevated CO2 on grain yield and quality of wheat: Results from a 3-year free-air CO2 enrichment experiment. Plant Biol. 2009, 11, 60–69. [Google Scholar] [CrossRef] [PubMed]
- Erbs, M.; Manderscheid, R.; Jansen, G.; Seddig, S.; Pacholski, A.; Weigel, H.J. Effects of free-air CO2 enrichment and nitrogen supply on grain quality parameters and elemental composition of wheat and barley grown in a crop rotation. Agric. Ecosyst. Environ. 2010, 136, 59–68. [Google Scholar] [CrossRef]
- ARP, W.J. Effects of source-sink relations on photosynthetic acclimation to elevated CO2. Plant. Cell Environ. 1991, 14, 869–875. [Google Scholar] [CrossRef]
- Del Pozo, A.; Pérez, P.; Morcuende, R.; Alonso, A.; Martínez-Carrasco, R. Acclimatory responses of stomatal conductance and photosynthesis to elevated CO2 and temperature in wheat crops grown at varying levels of N supply in a Mediterranean environment. Plant Sci. 2005, 169, 908–916. [Google Scholar] [CrossRef]
- Del Pozo, A.; Pérez, P.; Gutiérrez, D.; Alonso, A.; Morcuende, R.; Martínez-Carrasco, R. Gas exchange acclimation to elevated CO2 in upper-sunlit and lower-shaded canopy leaves in relation to nitrogen acquisition and partitioning in wheat grown in field chambers. Environ. Exp. Bot. 2007, 59, 371–380. [Google Scholar] [CrossRef]
- Ainsworth, E.A.; Rogers, A.; Nelson, R.; Long, S.P. Testing the “source-sink” hypothesis of down-regulation of photosynthesis in elevated [CO2] in the field with single gene substitutions in Glycine max. Agric. For. Meteorol. 2004, 122, 85–94. [Google Scholar] [CrossRef]
- Tausz-Posch, S.; Norton, R.M.; Seneweera, S.; Fitzgerald, G.J.; Tausz, M. Will intra-specific differences in transpiration efficiency in wheat be maintained in a high CO2 world? A FACE study. Physiol. Plant. 2013, 148, 232–245. [Google Scholar] [CrossRef]
- Ziska, L.H.; Morris, C.F.; Goins, E.W. Quantitative and qualitative evaluation of selected wheat varieties released since 1903 to increasing atmospheric carbon dioxide: Can yield sensitivity to carbon dioxide be a factor in wheat performance? Glob. Chang. Biol. 2004, 10, 1810–1819. [Google Scholar] [CrossRef]
- Ziska, L.H. Three-year field evaluation of early and late 20th century spring wheat cultivars to projected increases in atmospheric carbon dioxide. F. Crop. Res. 2008, 108, 54–59. [Google Scholar] [CrossRef]
- Schynder, H. The role of carbohydrate storage and redistribution in the source-sink relations of wheat and barley during grain filling—A review. New Phytol. 1993, 123, 233–245. [Google Scholar] [CrossRef]
- Yang, J.; Zhang, J. Grain filling of cereals under soil drying. New Phytol. 2006, 169, 223–236. [Google Scholar] [CrossRef]
- Cossani, C.M.; Reynolds, M.P. Physiological traits for improving heat tolerance in wheat. Plant Physiol. 2012, 160, 1710–1718. [Google Scholar] [CrossRef]
- Djanaguiraman, M.; Narayanan, S.; Erdayani, E.; Prasad, P.V.V. Effects of high temperature stress during anthesis and grain filling periods on photosynthesis, lipids and grain yield in wheat. BMC Plant Biol. 2020, 20, 1–12. [Google Scholar] [CrossRef]
- Lobell, D.B.; Field, C.B. Global scale climate–crop yield relationships and the impacts of recent warming. Environ. Res. Lett. 2007, 2, 014002. [Google Scholar] [CrossRef]
- Farooq, M.; Bramley, H.; Palta, J.A.; Siddique, K.H.M. Heat stress in wheat during reproductive and grain-filling phases. CRC. Crit. Rev. Plant Sci. 2011, 30, 491–507. [Google Scholar] [CrossRef]
- Prasad, P.V.V.; Djanaguiraman, M. Response of floret fertility and individual grain weight of wheat to high temperature stress: Sensitive stages and thresholds for temperature and duration. Funct. Plant Biol. 2014, 41, 1261–1269. [Google Scholar] [CrossRef]
- Bergkamp, B.; Impa, S.M.; Asebedo, A.R.; Fritz, A.K.; Jagadish, S.V.K. Prominent winter wheat varieties response to post-flowering heat stress under controlled chambers and field based heat tents. F. Crop. Res. 2018, 222, 143–152. [Google Scholar] [CrossRef]
- Barnabás, B.; Jäger, K.; Fehér, A. The effect of drought and heat stress on reproductive processes in cereals. Plant Cell Environ. 2008, 31, 11–38. [Google Scholar] [CrossRef] [PubMed]
- Dupont, F.M.; Hurkman, W.J.; Vensel, W.H.; Tanaka, C.; Kothari, K.M.; Chung, O.K.; Altenbach, S.B. Protein accumulation and composition in wheat grains: Effects of mineral nutrients and high temperature. Eur. J. Agron. 2006, 25, 96–107. [Google Scholar] [CrossRef]
- Asseng, S.; Ewert, F.; Martre, P.; Rötter, R.P.; Lobell, D.B.; Cammarano, D.; Kimball, B.A.; Ottman, M.J.; Wall, G.W.; White, J.W.; et al. Rising temperatures reduce global wheat production. Nat. Clim. Chang. 2015, 5, 143–147. [Google Scholar] [CrossRef]
- Liu, B.; Asseng, S.; Müller, C.; Ewert, F.; Elliott, J.; Lobell, D.B.; Martre, P.; Ruane, A.C.; Wallach, D.; Jones, J.W.; et al. Similar estimates of temperature impacts on global wheat yield by three independent methods. Nat. Clim. Chang. 2016, 6, 1130–1136. [Google Scholar] [CrossRef]
- Hatfield, J.L.; Dold, C. Agroclimatology and wheat production: Coping with climate change. Front. Plant Sci. 2018, 9, 1–5. [Google Scholar] [CrossRef]
- Fitzgerald, G.J.; Tausz, M.; O’Leary, G.; Mollah, M.R.; Tausz-Posch, S.; Seneweera, S.; Mock, I.; Löw, M.; Partington, D.L.; Mcneil, D.; et al. Elevated atmospheric [CO2] can dramatically increase wheat yields in semi-arid environments and buffer against heat waves. Glob. Chang. Biol. 2016, 22, 2269–2284. [Google Scholar] [CrossRef]
- Ainsworth, E.A.; Long, S.P. 30 years of free-air carbon dioxide enrichment (FACE): What have we learned about future crop productivity and its potential for adaptation? Glob. Chang. Biol. 2021, 27, 27–49. [Google Scholar] [CrossRef] [PubMed]
- Sánchez De La Puente, L.; Pérez Pérez, P.; Martínez-Carrasco, R.; Morcuende Morcuende, R.; Martín Del Molino, I.M. Action of elevated CO2 and high temperatures on the mineral chemical composition of two varieties of wheat. Agrochimica 2000, 44, 221–230. [Google Scholar]
- Högy, P.; Kottmann, L.; Schmid, I.; Fangmeier, A. Heat, wheat and CO2: The relevance of timing and the mode of temperature stress on biomass and yield. J. Agron. Crop Sci. 2019, 205, 608–615. [Google Scholar] [CrossRef]
- Sabella, E.; Aprile, A.; Negro, C.; Nicolì, F.; Nutricati, E.; Vergine, M.; Luvisi, A.; De Bellis, L. Impact of climate change on durum wheat yield. Agronomy 2020, 10, 793. [Google Scholar] [CrossRef]
- Marcos-Barbero, E.L.; Pérez, P.; Martínez-Carrasco, R.; Arellano, J.B.; Morcuende, R. Genotypic variability on grain yield and grain nutritional quality characteristics of wheat grown under elevated CO2 and high temperature. Plants 2021, 10, 1043. [Google Scholar] [CrossRef]
- Wang, L.; Feng, Z.; Schjoerring, J.K. Effects of elevated atmospheric CO2 on physiology and yield of wheat (Triticum aestivum L.): A meta-analytic test of current hypotheses. Agric. Ecosyst. Environ 2013, 178, 57–63. [Google Scholar] [CrossRef]
- Erice, G.; Sanz-Sáez, Á.; González-Torralba, J.; Méndez-Espinoza, A.M.; Urretavizcaya, I.; Nieto, M.T.; Serret, M.D.; Araus, J.L.; Irigoyen, J.J.; Aranjuelo, I. Impact of elevated CO2 and drought on yield and quality traits of a historical (Blanqueta) and a modern (Sula) durum wheat. J. Cereal Sci. 2019, 87, 194–201. [Google Scholar] [CrossRef]
- Tausz-Posch, S.; Seneweera, S.; Norton, R.M.; Fitzgerald, G.J.; Tausz, M. Can a wheat cultivar with high transpiration efficiency maintain its yield advantage over a near-isogenic cultivar under elevated CO2? F. Crop. Res. 2012, 133, 160–166. [Google Scholar] [CrossRef]
- Högy, P.; Keck, M.; Niehaus, K.; Franzaring, J.; Fangmeier, A. Effects of atmospheric CO2 enrichment on biomass, yield and low molecular weight metabolites in wheat grain. J. Cereal Sci. 2010, 52, 215–220. [Google Scholar] [CrossRef]
- Tausz-Posch, S.; Dempsey, R.W.; Seneweera, S.; Norton, R.M.; Fitzgerald, G.; Tausz, M. Does a freely tillering wheat cultivar benefit more from elevated CO2 than a restricted tillering cultivar in a water-limited environment? Eur. J. Agron. 2015, 64, 21–28. [Google Scholar] [CrossRef]
- Bourgault, M.; Dreccer, M.F.; James, A.T.; Chapman, S.C. Genotypic variability in the response to elevated CO2 of wheat lines differing in adaptive traits. Funct. Plant Biol. 2013, 40, 172–184. [Google Scholar] [CrossRef]
- Tausz, M.; Tausz-Posch, S.; Norton, R.M.; Fitzgerald, G.J.; Nicolas, M.E.; Seneweera, S. Understanding crop physiology to select breeding targets and improve crop management under increasing atmospheric CO2 concentrations. Environ. Exp. Bot. 2013, 88, 71–80. [Google Scholar] [CrossRef]
- Makino, A.; Tadahiko, M. Photosynthesis and plant growth at elevated levels of CO2. Plant Cell Physiol. 1999, 40, 999–1006. [Google Scholar] [CrossRef]
- Högy, P.; Brunnbauer, M.; Koehler, P.; Schwadorf, K.; Breuer, J.; Franzaring, J.; Zhunusbayeva, D.; Fangmeier, A. Grain quality characteristics of spring wheat (Triticum aestivum) as affected by free-air CO2 enrichment. Environ. Exp. Bot. 2013, 88, 11–18. [Google Scholar] [CrossRef]
- Panozzo, J.F.; Walker, C.K.; Partington, D.L.; Neumann, N.C.; Tausz, M.; Seneweera, S.; Fitzgerald, G.J. Elevated carbon dioxide changes grain protein concentration and composition and compromises baking quality. A FACE study. J. Cereal Sci. 2014, 60, 461–470. [Google Scholar] [CrossRef]
- Högy, P.; Fangmeier, A. Effects of elevated atmospheric CO2 on grain quality of wheat. J. Cereal Sci. 2008, 48, 580–591. [Google Scholar] [CrossRef]
- Fernando, N.; Panozzo, J.; Tausz, M.; Norton, R.M.; Neumann, N.; Fitzgerald, G.J.; Seneweera, S. Elevated CO2 alters grain quality of two bread wheat cultivars grown under different environmental conditions. Agric. Ecosyst. Environ. 2014, 185, 24–33. [Google Scholar] [CrossRef]
- Nuttall, J.G.; O’Leary, G.J.; Panozzo, J.F.; Walker, C.K.; Barlow, K.M.; Fitzgerald, G.J. Models of grain quality in wheat—A review. F. Crop. Res. 2017, 202, 136–145. [Google Scholar] [CrossRef]
- Tashiro, T.; Wardlaw, I. The response to high temperature shock and humidity changes prior to and during the early stages of grain development in wheat. Funct. Plant Biol. 1990, 17, 551. [Google Scholar] [CrossRef]
- Wollenweber, B.; Porter, J.R.; Schellberg, J. Lack of interaction between extreme high-temperature events at vegetative and reproductive growth stages in wheat. J. Agron. Crop Sci. 2003, 189, 142–150. [Google Scholar] [CrossRef]
- Weichert, H.; Högy, P.; Mora-Ramirez, I.; Fuchs, J.; Eggert, K.; Koehler, P.; Weschke, W.; Fangmeier, A.; Weber, H. Grain yield and quality responses of wheat expressing a barley sucrose transporter to combined climate change factors. J. Exp. Bot. 2017, 68, 5511–5525. [Google Scholar] [CrossRef]
- González, F.G.; Slafer, G.A.; Miralles, D.J. Floret development and survival in wheat plants exposed to contrasting photoperiod and radiation environments during stem elongation. Funct. Plant Biol. 2005, 32, 189–197. [Google Scholar] [CrossRef]
- Foulkes, M.J.; Slafer, G.A.; Davies, W.J.; Berry, P.M.; Sylvester-Bradley, R.; Martre, P.; Calderini, D.F.; Griffiths, S.; Reynolds, M.P. Raising yield potential of wheat. III. Optimizing partitioning to grain while maintaining lodging resistance. J. Exp. Bot. 2011, 62, 469–486. [Google Scholar] [CrossRef]
- Waddington, S.R.; Ransom, J.K.; Osmanzai, M.; Saunders, D.A. Improvement in the yield potential of bread wheat adapted to northwest mexico 1. Crop Sci. 1986, 26, 698–703. [Google Scholar] [CrossRef]
- Acreche, M.M.; Slafer, G.A. Grain weight response to increases in number of grains in wheat in a Mediterranean area. F. Crop. Res. 2006, 98, 52–59. [Google Scholar] [CrossRef]
- Miralles, D.J.; Slafer, G.A. Individual grain weight responses to genetic reduction in culm length in wheat as affected by source-sink manipulations. F. Crop. Res. 1995, 43, 55–66. [Google Scholar] [CrossRef]
- Sayre, K.D.; Rajaram, S.; Fischer, R.A. Yield potential progress in short bread wheats in northwest Mexico. Crop Sci. 1997, 37, 36–42. [Google Scholar] [CrossRef]
- Shearman, V.J.; Sylvester-Bradley, R.; Scott, R.K.; Foulkes, M.J. Physiological processes associated with wheat yield progress in the UK. Crop Sci. 2005, 45, 175–185. [Google Scholar] [CrossRef]
- Xiao, Y.G.; Qian, Z.G.; Wu, K.; Liu, J.J.; Xia, X.C.; Ji, W.Q.; He, Z.H. Genetic gains in grain yield and physiological traits of winter wheat in shandong province, china, from 1969 to 2006. Crop Sci. 2012, 52, 44–56. [Google Scholar] [CrossRef]
- Sanchez-Garcia, M.; Royo, C.; Aparicio, N.; Martín-Sánchez, J.A.; Álvaro, F. Genetic improvement of bread wheat yield and associated traits in Spain during the 20th century. J. Agric. Sci. 2013, 151, 105–118. [Google Scholar] [CrossRef]
- Miralles, D.J.; Katz, S.D.; Colloca, A.; Slafer, G.A. Floret development in near isogenic wheat lines differing in plant height. F. Crop. Res. 1998, 59, 21–30. [Google Scholar] [CrossRef]
- Canevara, M.G.; Romani, M.; Corbellini, M.; Perenzin, M.; Borghi, B. Evolutionary trends in morphological, physiological, agronomical and qualitative traits of Triticum aestivum L. cultivars bred in Italy since 1900. Eur. J. Agron. 1994, 3, 175–185. [Google Scholar] [CrossRef]
- Royo, C.; Briceño-Felix, G.A. Spanish wheat pool. In The World Wheat Book: A History of Wheat Breeding; Bojean, A.P., Angus, W.J., van Ginkel, M., Eds.; Lavoisier Publishing Inc.: Paris, France, 2011; pp. 121–154. [Google Scholar]
- Araus, J.L.; Slafer, G.A.; Royo, C.; Serret, M.D. Breeding for yield potential and stress adaptation in cereals. CRC. Crit. Rev. Plant Sci. 2008, 27, 377–412. [Google Scholar] [CrossRef]
- Dreccer, M.F.; Chapman, S.C.; Rattey, A.R.; Neal, J.; Song, Y.; Christopher, J.T.; Reynolds, M. Developmental and growth controls of tillering and water-soluble carbohydrate accumulation in contrasting wheat (Triticum aestivum L.) genotypes: Can we dissect them? J. Exp. Bot. 2013, 64, 143–160. [Google Scholar] [CrossRef] [PubMed]
- Duggan, B.L.; Richards, R.A.; van Herwaarden, A.F.; Fettell, N.A. Agronomic evaluation of a tiller inhibition gene (tin) in wheat. I. Effect on yield, yield components, and grain protein. Aust. J. Agric. Res. 2005, 56, 169. [Google Scholar] [CrossRef]
- Reynolds, M.; Foulkes, M.J.; Slafer, G.A.; Berry, P.; Parry, M.A.J.; Snape, J.W.; Angus, W.J. Raising yield potential in wheat. J. Exp. Bot. 2009, 60, 1899–1918. [Google Scholar] [CrossRef]
- Lopes, M.S.; Reynolds, M.P.; Manes, Y.; Singh, R.P.; Crossa, J.; Braun, H.J. Genetic yield gains and changes in associated traits of CIMMYT spring bread wheat in a “Historic” set representing 30 years of breeding. Crop Sci. 2012, 52, 1123–1131. [Google Scholar] [CrossRef]
- Morgounov, A.; Zykin, V.; Belan, I.; Roseeva, L.; Zelenskiy, Y.; Gomez-Becerra, H.F.; Budak, H.; Bekes, F. Genetic gains for grain yield in high latitude spring wheat grown in Western Siberia in 1900–2008. F. Crop. Res. 2010, 117, 101–112. [Google Scholar] [CrossRef]
- Zheng, T.C.; Zhang, X.K.; Yin, G.H.; Wang, L.N.; Han, Y.L.; Chen, L.; Huang, F.; Tang, J.W.; Xia, X.C.; He, Z.H. Genetic gains in grain yield, net photosynthesis and stomatal conductance achieved in Henan Province of China between 1981 and 2008. F. Crop. Res. 2011, 122, 225–233. [Google Scholar] [CrossRef]
- Del Pozo, A.; Matus, I.; Serret, M.D.; Araus, J.L. Agronomic and physiological traits associated with breeding advances of wheat under high-productive Mediterranean conditions. The case of Chile. Environ. Exp. Bot. 2014, 103, 180–189. [Google Scholar] [CrossRef]
- Mondal, S.; Dutta, S.; Crespo-Herrera, L.; Huerta-Espino, J.; Braun, H.J.; Singh, R.P. Fifty years of semi-dwarf spring wheat breeding at CIMMYT: Grain yield progress in optimum, drought and heat stress environments. F. Crop. Res. 2020, 250, 107757. [Google Scholar] [CrossRef]
- Gutiérrez, E.; Gutiérrez, D.; Morcuende, R.; Verdejo, A.L.; Kostadinova, S.; Martinez-Carrasco, R.; Pérez, P. Changes in leaf morphology and composition with future increases in CO2 and temperature revisited: Wheat in field chambers. J. Plant Growth Regul. 2009, 28, 349–357. [Google Scholar] [CrossRef]
- Gutiérrez, D.; Morcuende, R.; Del Pozo, A.; Martínez-Carrasco, R.; Pérez, P. Involvement of nitrogen and cytokinins in photosynthetic acclimation to elevated CO2 of spring wheat. J. Plant Physiol. 2013, 170, 1337–1343. [Google Scholar] [CrossRef] [PubMed]
- Gourdji, S.M.; Mathews, K.L.; Reynolds, M.; Crossa, J.; Lobell, D.B. An assessment of wheat yield sensitivity and breeding gains in hot environments. Proc. R. Soc. B Biol. Sci. 2013, 280. [Google Scholar] [CrossRef] [PubMed]
- Córdoba, J.; Molina-Cano, J.L.; Pérez, P.; Morcuende, R.; Moralejo, M.; Savé, R.; Martínez-Carrasco, R. Photosynthesis-dependent/independent control of stomatal responses to CO2 in mutant barley with surplus electron transport capacity and reduced SLAH3 anion channel transcript. Plant Sci. 2015, 239, 15–25. [Google Scholar] [CrossRef] [PubMed][Green Version]
- Vicente, R.; Pérez, P.; Martínez-Carrasco, R.; Gutiérrez, E.; Morcuende, R. Nitrate supply and plant development influence nitrogen uptake and allocation under elevated CO2 in durum wheat grown hydroponically. Acta Physiol. Plant. 2015, 37, 114. [Google Scholar] [CrossRef]
- Vicente, R.; Pérez, P.; Martínez-Carrasco, R.; Feil, R.; Lunn, J.E.; Watanabe, M.; Arrivault, S.; Stitt, M.; Hoefgen, R.; Morcuende, R. Metabolic and transcriptional analysis of durum wheat responses to elevated CO2 at low and high nitrate supply. Plant Cell Physiol. 2016, 57, 2133–2146. [Google Scholar] [CrossRef] [PubMed]
- R Core Team R: A Language and Environment for Statistical Computing; R Foundation for Statistical Computing: Vienna, Austria, 2019.
- Revelle, W. Package “psych”—Procedures for Psychological, Psychometric and Personality Research. R Package Version 2.1.3. Available online: https://cran.r-project.org/package=psych (accessed on 1 April 2021).
- Husson, F.; Josse, J.; Pages, J. Principal component methods-hierarchical clustering-partitional clustering: Why would we need to choose for visualizing data. Appl. Math. Dep. 2010, 1–17. [Google Scholar]
- Signorell, A. DescTools: Tools for Descriptive Statistics. R package version 0.99.42. Available online: https://cran.r-project.org/package=DescTools (accessed on 1 August 2021).
- Wickham, H. Reshaping Data with the reshape Package. J. Stat. Softw. 2007, 21, 1–20. [Google Scholar] [CrossRef]
- Shannon, P. Cytoscape: A software environment for integrated models of biomolecular interaction networks. Genome Res. 2003, 13, 2498–2504. [Google Scholar] [CrossRef] [PubMed]


| Genotype | Grain Yield (g plant−1) | Above-Ground (g plant−1) | Stalk (g plant−1) | Chaff (g plant−1) | Height (cm plant−1) | Grain Number (No. plant−1) | Ear Number (No. plant−1) | Grain Weight (mg plant−1) | GYE (g ear−1) | GNE (No. ear−1) | HI | ||||||||||||||||||||||
|---|---|---|---|---|---|---|---|---|---|---|---|---|---|---|---|---|---|---|---|---|---|---|---|---|---|---|---|---|---|---|---|---|---|
| 150 | 5.45 | ± | 1.05 | 14.38 | ± | 1.64 | 6.82 | ± | 0.44 | 2.12 | ± | 0.35 | 80.36 | ± | 0.77 | 156.10 | ± | 32.80 | 4.10 | ± | 0.48 | 34.97 | ± | 0.81 | 1.32 | ± | 0.10 | 37.79 | ± | 3.34 | 0.38 | ± | 0.03 |
| 74 | 6.18 | ± | 0.68 | 16.29 | ± | 1.82 | 8.23 | ± | 1.26 | 1.88 | ± | 0.30 | 89.71 | ± | 1.21 | 151.79 | ± | 19.87 | 5.65 | ± | 0.30 | 40.95 | ± | 3.61 | 1.10 | ± | 0.12 | 26.98 | ± | 4.23 | 0.38 | ± | 0.04 |
| 23 | 6.42 | ± | 0.53 | 15.17 | ± | 1.31 | 6.83 | ± | 0.48 | 1.91 | ± | 0.35 | 79.86 | ± | 0.19 | 159.37 | ± | 12.57 | 4.45 | ± | 0.57 | 40.27 | ± | 0.42 | 1.45 | ± | 0.08 | 36.02 | ± | 2.24 | 0.42 | ± | 0.01 |
| 8 | 6.46 | ± | 1.22 | 17.14 | ± | 3.79 | 7.88 | ± | 1.72 | 2.80 | ± | 0.86 | 81.49 | ± | 3.04 | 161.55 | ± | 32.03 | 5.30 | ± | 1.16 | 40.04 | ± | 1.60 | 1.22 | ± | 0.06 | 30.58 | ± | 1.55 | 0.38 | ± | 0.01 |
| 76 | 6.50 | ± | 0.77 | 17.12 | ± | 1.72 | 8.46 | ± | 0.86 | 2.16 | ± | 0.26 | 87.15 | ± | 2.16 | 160.50 | ± | 24.84 | 5.40 | ± | 0.63 | 40.63 | ± | 1.60 | 1.20 | ± | 0.07 | 29.70 | ± | 2.47 | 0.38 | ± | 0.02 |
| 15 | 6.53 | ± | 0.85 | 16.11 | ± | 2.41 | 7.18 | ± | 1.27 | 2.39 | ± | 0.39 | 77.14 | ± | 1.38 | 158.58 | ± | 22.88 | 5.55 | ± | 0.53 | 41.28 | ± | 1.08 | 1.18 | ± | 0.09 | 28.51 | ± | 2.19 | 0.41 | ± | 0.02 |
| 73 | 6.59 | ± | 0.94 | 18.81 | ± | 1.49 | 9.59 | ± | 0.63 | 2.63 | ± | 0.23 | 91.38 | ± | 0.59 | 158.99 | ± | 15.40 | 4.95 | ± | 0.10 | 41.34 | ± | 2.39 | 1.33 | ± | 0.18 | 32.14 | ± | 3.25 | 0.35 | ± | 0.03 |
| 21 | 6.62 | ± | 0.59 | 16.35 | ± | 1.07 | 7.78 | ± | 0.28 | 1.94 | ± | 0.27 | 88.73 | ± | 1.92 | 163.79 | ± | 8.89 | 5.00 | ± | 0.52 | 40.44 | ± | 2.71 | 1.34 | ± | 0.19 | 32.94 | ± | 2.81 | 0.40 | ± | 0.01 |
| 9 | 6.64 | ± | 0.73 | 17.19 | ± | 1.80 | 8.18 | ± | 0.66 | 2.38 | ± | 0.44 | 88.13 | ± | 3.34 | 148.69 | ± | 18.14 | 4.95 | ± | 0.55 | 44.71 | ± | 1.92 | 1.34 | ± | 0.05 | 30.04 | ± | 1.74 | 0.39 | ± | 0.01 |
| 118 | 6.67 | ± | 0.23 | 17.19 | ± | 1.40 | 8.00 | ± | 0.95 | 2.53 | ± | 0.43 | 84.70 | ± | 4.05 | 176.82 | ± | 4.29 | 6.80 | ± | 0.49 | 37.75 | ± | 1.48 | 0.99 | ± | 0.08 | 26.07 | ± | 1.32 | 0.39 | ± | 0.03 |
| 81 | 6.75 | ± | 1.03 | 17.15 | ± | 2.14 | 8.01 | ± | 1.27 | 2.39 | ± | 0.07 | 94.69 | ± | 2.02 | 164.49 | ± | 28.73 | 5.00 | ± | 1.40 | 41.20 | ± | 2.23 | 1.40 | ± | 0.26 | 33.88 | ± | 5.17 | 0.39 | ± | 0.02 |
| 77 | 6.86 | ± | 0.96 | 17.42 | ± | 1.88 | 8.49 | ± | 0.63 | 2.07 | ± | 0.34 | 91.03 | ± | 4.86 | 168.32 | ± | 19.71 | 5.25 | ± | 0.64 | 40.66 | ± | 1.95 | 1.31 | ± | 0.19 | 32.32 | ± | 4.74 | 0.39 | ± | 0.02 |
| 115 | 6.92 | ± | 0.94 | 18.23 | ± | 1.64 | 8.64 | ± | 0.84 | 2.67 | ± | 0.25 | 87.08 | ± | 2.59 | 160.01 | ± | 25.82 | 5.55 | ± | 0.44 | 43.49 | ± | 2.81 | 1.25 | ± | 0.10 | 28.80 | ± | 3.72 | 0.38 | ± | 0.03 |
| 87 | 6.96 | ± | 1.43 | 18.14 | ± | 3.64 | 8.62 | ± | 1.82 | 2.55 | ± | 0.48 | 87.36 | ± | 1.30 | 184.34 | ± | 43.52 | 4.90 | ± | 0.48 | 38.03 | ± | 2.24 | 1.44 | ± | 0.35 | 38.03 | ± | 9.69 | 0.38 | ± | 0.01 |
| 29 | 7.04 | ± | 0.77 | 17.26 | ± | 1.00 | 7.89 | ± | 0.21 | 2.33 | ± | 0.07 | 82.15 | ± | 2.20 | 184.91 | ± | 16.88 | 4.75 | ± | 0.34 | 38.03 | ± | 1.02 | 1.48 | ± | 0.08 | 38.90 | ± | 1.70 | 0.41 | ± | 0.02 |
| 46 | 7.06 | ± | 0.32 | 18.39 | ± | 0.84 | 8.23 | ± | 0.57 | 3.11 | ± | 0.27 | 88.99 | ± | 3.74 | 147.54 | ± | 7.81 | 5.45 | ± | 0.10 | 47.84 | ± | 1.22 | 1.30 | ± | 0.07 | 27.09 | ± | 1.81 | 0.38 | ± | 0.02 |
| 119 | 7.09 | ± | 0.90 | 18.33 | ± | 1.63 | 8.84 | ± | 0.86 | 2.40 | ± | 0.23 | 92.60 | ± | 1.93 | 170.30 | ± | 5.50 | 5.10 | ± | 0.35 | 41.63 | ± | 5.21 | 1.39 | ± | 0.15 | 33.50 | ± | 2.44 | 0.39 | ± | 0.02 |
| 6 | 7.20 | ± | 0.75 | 16.94 | ± | 1.73 | 7.51 | ± | 0.75 | 2.23 | ± | 0.33 | 79.49 | ± | 1.19 | 194.79 | ± | 17.84 | 4.35 | ± | 0.34 | 36.91 | ± | 0.71 | 1.65 | ± | 0.08 | 44.78 | ± | 2.35 | 0.42 | ± | 0.01 |
| 110 | 7.25 | ± | 0.81 | 18.25 | ± | 1.07 | 8.77 | ± | 0.43 | 2.24 | ± | 0.06 | 85.64 | ± | 3.54 | 202.72 | ± | 19.43 | 5.75 | ± | 0.38 | 35.73 | ± | 1.16 | 1.26 | ± | 0.07 | 35.21 | ± | 1.56 | 0.40 | ± | 0.02 |
| 71 | 7.29 | ± | 0.65 | 18.70 | ± | 0.87 | 9.02 | ± | 0.57 | 2.39 | ± | 0.34 | 93.69 | ± | 1.18 | 169.53 | ± | 12.76 | 4.85 | ± | 0.34 | 42.97 | ± | 1.26 | 1.50 | ± | 0.10 | 35.03 | ± | 2.76 | 0.39 | ± | 0.03 |
| 16 | 7.34 | ± | 0.32 | 17.69 | ± | 0.36 | 7.94 | ± | 0.12 | 2.40 | ± | 0.20 | 83.21 | ± | 3.08 | 181.28 | ± | 9.93 | 6.35 | ± | 0.38 | 40.54 | ± | 1.26 | 1.16 | ± | 0.08 | 28.58 | ± | 1.32 | 0.42 | ± | 0.01 |
| 22 | 7.44 | ± | 0.79 | 18.10 | ± | 1.96 | 8.10 | ± | 1.11 | 2.56 | ± | 0.26 | 85.10 | ± | 0.27 | 199.14 | ± | 21.75 | 6.15 | ± | 0.60 | 37.39 | ± | 0.74 | 1.21 | ± | 0.07 | 32.38 | ± | 1.56 | 0.41 | ± | 0.02 |
| 13 | 7.49 | ± | 1.01 | 18.87 | ± | 2.29 | 8.43 | ± | 1.13 | 2.95 | ± | 0.32 | 89.96 | ± | 0.86 | 166.74 | ± | 23.43 | 5.45 | ± | 0.68 | 45.03 | ± | 3.37 | 1.38 | ± | 0.15 | 30.67 | ± | 3.44 | 0.40 | ± | 0.02 |
| 92 | 7.50 | ± | 0.68 | 18.40 | ± | 1.24 | 8.47 | ± | 0.43 | 2.43 | ± | 0.27 | 83.39 | ± | 1.90 | 199.36 | ± | 17.06 | 5.60 | ± | 0.37 | 37.61 | ± | 0.98 | 1.34 | ± | 0.11 | 35.69 | ± | 3.41 | 0.41 | ± | 0.01 |
| 117 | 7.53 | ± | 0.35 | 18.56 | ± | 1.17 | 8.42 | ± | 0.58 | 2.60 | ± | 0.34 | 89.48 | ± | 0.78 | 173.98 | ± | 5.18 | 5.65 | ± | 0.19 | 43.31 | ± | 1.77 | 1.33 | ± | 0.07 | 30.80 | ± | 0.52 | 0.41 | ± | 0.01 |
| 79 | 7.56 | ± | 0.91 | 19.75 | ± | 2.48 | 9.12 | ± | 1.34 | 3.06 | ± | 0.31 | 84.79 | ± | 2.56 | 181.24 | ± | 19.11 | 5.95 | ± | 0.41 | 41.69 | ± | 1.43 | 1.27 | ± | 0.14 | 30.47 | ± | 2.52 | 0.38 | ± | 0.02 |
| 33 | 7.60 | ± | 1.35 | 21.98 | ± | 0.67 | 10.76 | ± | 0.66 | 3.61 | ± | 0.47 | 85.28 | ± | 4.74 | 168.38 | ± | 37.34 | 5.65 | ± | 0.41 | 45.58 | ± | 3.37 | 1.36 | ± | 0.30 | 30.02 | ± | 7.23 | 0.35 | ± | 0.06 |
| 69 | 7.66 | ± | 1.50 | 17.81 | ± | 2.54 | 7.63 | ± | 0.89 | 2.51 | ± | 0.45 | 79.86 | ± | 2.44 | 193.14 | ± | 28.90 | 6.35 | ± | 0.85 | 39.48 | ± | 1.79 | 1.21 | ± | 0.20 | 30.62 | ± | 4.64 | 0.43 | ± | 0.03 |
| 31 | 7.71 | ± | 1.26 | 18.71 | ± | 2.69 | 8.27 | ± | 1.09 | 2.73 | ± | 0.36 | 87.35 | ± | 3.87 | 177.91 | ± | 29.82 | 6.50 | ± | 1.16 | 43.38 | ± | 2.12 | 1.20 | ± | 0.17 | 27.52 | ± | 3.13 | 0.41 | ± | 0.01 |
| 19 | 7.73 | ± | 0.66 | 19.04 | ± | 1.21 | 8.74 | ± | 0.58 | 2.57 | ± | 0.10 | 87.91 | ± | 3.11 | 193.25 | ± | 3.79 | 5.10 | ± | 0.38 | 40.03 | ± | 3.77 | 1.52 | ± | 0.11 | 38.04 | ± | 2.65 | 0.41 | ± | 0.01 |
| 114 | 7.75 | ± | 0.32 | 20.64 | ± | 1.03 | 10.42 | ± | 0.53 | 2.46 | ± | 0.37 | 100.68 | ± | 3.35 | 214.96 | ± | 15.27 | 5.65 | ± | 0.34 | 36.11 | ± | 1.47 | 1.37 | ± | 0.04 | 38.03 | ± | 0.75 | 0.38 | ± | 0.01 |
| 97 | 7.79 | ± | 0.35 | 19.89 | ± | 1.06 | 9.42 | ± | 0.50 | 2.68 | ± | 0.35 | 88.10 | ± | 3.37 | 213.71 | ± | 8.05 | 6.55 | ± | 0.19 | 36.49 | ± | 2.51 | 1.19 | ± | 0.06 | 32.67 | ± | 2.01 | 0.39 | ± | 0.01 |
| 113 | 7.79 | ± | 0.87 | 20.01 | ± | 2.47 | 9.91 | ± | 1.27 | 2.31 | ± | 0.39 | 90.13 | ± | 4.00 | 237.19 | ± | 44.64 | 6.40 | ± | 1.02 | 33.16 | ± | 2.30 | 1.22 | ± | 0.06 | 36.96 | ± | 1.32 | 0.39 | ± | 0.01 |
| 25 | 7.81 | ± | 0.47 | 18.72 | ± | 1.04 | 8.22 | ± | 0.64 | 2.69 | ± | 0.16 | 83.50 | ± | 4.10 | 197.07 | ± | 12.53 | 5.60 | ± | 0.28 | 39.63 | ± | 0.68 | 1.40 | ± | 0.10 | 35.23 | ± | 2.36 | 0.42 | ± | 0.02 |
| 18 | 7.83 | ± | 1.28 | 19.61 | ± | 2.49 | 8.82 | ± | 1.01 | 2.97 | ± | 0.61 | 87.00 | ± | 2.85 | 202.67 | ± | 31.10 | 5.75 | ± | 0.98 | 38.62 | ± | 2.16 | 1.37 | ± | 0.13 | 35.37 | ± | 2.38 | 0.40 | ± | 0.04 |
| 70 | 7.84 | ± | 1.17 | 19.75 | ± | 3.23 | 8.98 | ± | 1.72 | 2.93 | ± | 0.73 | 93.44 | ± | 3.93 | 220.48 | ± | 43.49 | 5.85 | ± | 1.23 | 35.89 | ± | 3.65 | 1.37 | ± | 0.24 | 37.98 | ± | 4.14 | 0.40 | ± | 0.04 |
| 63 | 7.89 | ± | 0.82 | 20.21 | ± | 1.54 | 9.23 | ± | 0.77 | 3.09 | ± | 0.31 | 85.29 | ± | 2.36 | 215.34 | ± | 14.60 | 6.00 | ± | 0.43 | 36.59 | ± | 1.61 | 1.32 | ± | 0.10 | 35.96 | ± | 2.46 | 0.39 | ± | 0.03 |
| 105 | 7.91 | ± | 0.89 | 18.50 | ± | 1.33 | 8.21 | ± | 0.60 | 2.38 | ± | 0.12 | 82.40 | ± | 2.10 | 207.79 | ± | 28.23 | 4.40 | ± | 0.00 | 38.17 | ± | 1.69 | 1.80 | ± | 0.20 | 47.22 | ± | 6.42 | 0.43 | ± | 0.02 |
| 88 | 8.00 | ± | 0.78 | 20.27 | ± | 1.31 | 9.21 | ± | 0.79 | 3.05 | ± | 0.23 | 87.35 | ± | 2.97 | 200.75 | ± | 19.37 | 5.25 | ± | 0.34 | 39.88 | ± | 1.76 | 1.53 | ± | 0.22 | 38.35 | ± | 4.41 | 0.39 | ± | 0.02 |
| 93 | 8.01 | ± | 1.51 | 20.01 | ± | 3.21 | 9.01 | ± | 1.47 | 2.99 | ± | 0.53 | 88.54 | ± | 1.84 | 192.90 | ± | 23.42 | 5.70 | ± | 0.60 | 41.28 | ± | 3.34 | 1.40 | ± | 0.17 | 33.84 | ± | 1.97 | 0.40 | ± | 0.03 |
| 35 | 8.02 | ± | 1.11 | 21.93 | ± | 2.59 | 10.30 | ± | 1.39 | 3.61 | ± | 0.59 | 87.33 | ± | 1.71 | 195.70 | ± | 8.82 | 4.90 | ± | 0.62 | 40.91 | ± | 4.55 | 1.63 | ± | 0.02 | 40.28 | ± | 3.92 | 0.37 | ± | 0.03 |
| 4 | 8.06 | ± | 0.63 | 18.18 | ± | 0.90 | 7.45 | ± | 0.38 | 2.67 | ± | 0.05 | 85.81 | ± | 1.84 | 219.29 | ± | 9.45 | 6.25 | ± | 0.19 | 36.71 | ± | 1.34 | 1.29 | ± | 0.08 | 35.09 | ± | 1.15 | 0.44 | ± | 0.02 |
| 26 | 8.12 | ± | 0.44 | 20.35 | ± | 1.49 | 9.58 | ± | 0.91 | 2.65 | ± | 0.24 | 87.34 | ± | 1.58 | 204.17 | ± | 6.84 | 6.05 | ± | 0.41 | 39.77 | ± | 0.95 | 1.34 | ± | 0.03 | 33.81 | ± | 1.15 | 0.40 | ± | 0.01 |
| 48 | 8.15 | ± | 0.43 | 20.28 | ± | 1.18 | 9.34 | ± | 0.76 | 2.79 | ± | 0.28 | 90.09 | ± | 4.08 | 185.85 | ± | 20.06 | 6.35 | ± | 0.47 | 44.08 | ± | 2.62 | 1.29 | ± | 0.10 | 29.31 | ± | 2.95 | 0.40 | ± | 0.01 |
| 99 | 8.19 | ± | 0.63 | 20.80 | ± | 1.14 | 9.62 | ± | 0.23 | 3.00 | ± | 0.52 | 88.19 | ± | 1.78 | 238.56 | ± | 11.01 | 5.50 | ± | 0.26 | 34.34 | ± | 2.81 | 1.49 | ± | 0.10 | 43.39 | ± | 1.40 | 0.39 | ± | 0.02 |
| 53 | 8.19 | ± | 0.72 | 20.25 | ± | 1.45 | 8.78 | ± | 0.76 | 3.27 | ± | 0.33 | 82.55 | ± | 1.55 | 221.46 | ± | 14.92 | 6.40 | ± | 0.33 | 36.96 | ± | 0.85 | 1.28 | ± | 0.12 | 34.65 | ± | 2.60 | 0.40 | ± | 0.02 |
| 59 | 8.24 | ± | 1.32 | 20.47 | ± | 2.57 | 9.20 | ± | 1.02 | 3.03 | ± | 0.33 | 86.99 | ± | 0.61 | 192.70 | ± | 29.26 | 5.95 | ± | 0.70 | 42.73 | ± | 1.07 | 1.38 | ± | 0.10 | 32.33 | ± | 1.78 | 0.40 | ± | 0.01 |
| 83 | 8.28 | ± | 0.56 | 21.10 | ± | 2.28 | 9.70 | ± | 1.19 | 3.12 | ± | 0.58 | 85.04 | ± | 7.27 | 216.33 | ± | 16.38 | 5.70 | ± | 0.84 | 38.31 | ± | 0.37 | 1.47 | ± | 0.23 | 38.52 | ± | 6.17 | 0.39 | ± | 0.02 |
| 10 | 8.31 | ± | 0.98 | 19.66 | ± | 2.19 | 8.43 | ± | 0.97 | 2.92 | ± | 0.33 | 82.31 | ± | 2.65 | 226.90 | ± | 26.78 | 5.40 | ± | 0.78 | 36.71 | ± | 2.78 | 1.55 | ± | 0.15 | 42.14 | ± | 1.38 | 0.42 | ± | 0.02 |
| 65 | 8.35 | ± | 0.89 | 20.65 | ± | 2.87 | 9.13 | ± | 1.67 | 3.17 | ± | 0.54 | 91.61 | ± | 5.93 | 217.74 | ± | 8.02 | 6.30 | ± | 0.62 | 38.29 | ± | 2.87 | 1.33 | ± | 0.16 | 34.81 | ± | 3.61 | 0.41 | ± | 0.03 |
| 42 | 8.51 | ± | 0.65 | 21.34 | ± | 1.32 | 9.34 | ± | 0.87 | 3.49 | ± | 0.22 | 88.88 | ± | 0.71 | 250.79 | ± | 12.25 | 6.80 | ± | 0.52 | 33.91 | ± | 1.12 | 1.25 | ± | 0.09 | 36.96 | ± | 1.86 | 0.40 | ± | 0.02 |
| 107 | 8.56 | ± | 1.37 | 20.33 | ± | 3.43 | 9.10 | ± | 1.42 | 2.68 | ± | 0.74 | 84.05 | ± | 2.79 | 249.29 | ± | 47.63 | 5.75 | ± | 0.50 | 34.48 | ± | 1.63 | 1.49 | ± | 0.16 | 43.14 | ± | 5.03 | 0.42 | ± | 0.01 |
| 11 | 8.65 | ± | 0.21 | 20.15 | ± | 0.90 | 8.78 | ± | 0.72 | 2.72 | ± | 0.21 | 86.24 | ± | 2.95 | 232.13 | ± | 13.49 | 6.30 | ± | 0.62 | 37.33 | ± | 1.50 | 1.38 | ± | 0.11 | 36.96 | ± | 1.64 | 0.43 | ± | 0.02 |
| 58 | 8.70 | ± | 0.81 | 21.47 | ± | 2.01 | 9.85 | ± | 0.82 | 2.92 | ± | 0.56 | 86.29 | ± | 1.27 | 247.08 | ± | 13.25 | 5.90 | ± | 0.50 | 35.16 | ± | 1.55 | 1.48 | ± | 0.08 | 41.99 | ± | 2.19 | 0.41 | ± | 0.02 |
| 5 | 8.76 | ± | 1.17 | 22.09 | ± | 2.40 | 9.88 | ± | 0.86 | 3.46 | ± | 0.40 | 84.75 | ± | 1.54 | 238.93 | ± | 21.61 | 6.80 | ± | 0.59 | 36.60 | ± | 3.13 | 1.28 | ± | 0.09 | 35.13 | ± | 0.78 | 0.40 | ± | 0.01 |
| 43 | 8.97 | ± | 0.99 | 20.86 | ± | 1.66 | 8.64 | ± | 0.77 | 3.26 | ± | 0.13 | 89.44 | ± | 1.97 | 232.37 | ± | 31.09 | 5.65 | ± | 0.25 | 38.77 | ± | 3.25 | 1.58 | ± | 0.12 | 41.12 | ± | 5.22 | 0.43 | ± | 0.02 |
| 94 | 8.99 | ± | 0.68 | 21.36 | ± | 1.95 | 9.59 | ± | 1.18 | 2.79 | ± | 0.28 | 94.06 | ± | 3.87 | 226.96 | ± | 24.88 | 6.00 | ± | 0.59 | 39.71 | ± | 1.44 | 1.50 | ± | 0.12 | 37.88 | ± | 3.00 | 0.42 | ± | 0.02 |
| 95 | 9.00 | ± | 0.66 | 21.73 | ± | 2.01 | 9.59 | ± | 1.04 | 3.14 | ± | 0.44 | 85.65 | ± | 3.43 | 231.89 | ± | 18.72 | 6.15 | ± | 1.00 | 38.84 | ± | 1.48 | 1.48 | ± | 0.15 | 38.15 | ± | 3.88 | 0.41 | ± | 0.01 |
| 61 | 9.03 | ± | 0.71 | 22.21 | ± | 1.52 | 10.27 | ± | 1.23 | 2.92 | ± | 0.72 | 85.68 | ± | 1.24 | 259.49 | ± | 13.43 | 5.90 | ± | 0.62 | 34.75 | ± | 1.25 | 1.53 | ± | 0.09 | 44.23 | ± | 3.49 | 0.41 | ± | 0.01 |
| 41 | 9.68 | ± | 0.85 | 23.25 | ± | 1.59 | 9.80 | ± | 0.73 | 3.78 | ± | 0.22 | 82.73 | ± | 3.39 | 252.73 | ± | 27.81 | 7.25 | ± | 0.44 | 38.38 | ± | 1.53 | 1.33 | ± | 0.05 | 34.82 | ± | 2.47 | 0.42 | ± | 0.01 |
| Mean | 7.66 | ± | 1.12 | 19.16 | ± | 2.51 | 8.78 | ± | 1.20 | 2.72 | ± | 0.55 | 86.82 | ± | 4.88 | 197.01 | ± | 36.05 | 5.67 | ± | 0.84 | 39.26 | ± | 3.68 | 1.36 | ± | 0.19 | 34.99 | ± | 5.63 | 0.40 | ± | 0.03 |
| Min | 4.63 | 13.13 | 5.99 | 1.54 | 76.35 | 116.39 | 3.20 | 29.73 | 0.89 | 19.40 | 0.26 | ||||||||||||||||||||||
| Max | 10.70 | 25.50 | 12.21 | 4.42 | 105.30 | 315.33 | 8.20 | 48.93 | 1.96 | 54.02 | 0.46 | ||||||||||||||||||||||
| Q1 | 6.96 | 17.58 | 7.95 | 2.36 | 83.80 | 171.31 | 5.00 | 36.87 | 1.24 | 31.23 | 0.39 | ||||||||||||||||||||||
| Q3 | 8.43 | 21.03 | 9.65 | 3.04 | 89.75 | 221.81 | 6.20 | 41.23 | 1.48 | 38.22 | 0.42 | ||||||||||||||||||||||
| Skewness | −0.02 | 0.02 | 0.14 | 0.37 | 0.41 | 0.27 | 0.09 | 0.36 | 0.29 | 0.32 | −0.7 | ||||||||||||||||||||||
| Kurtosis | −0.25 | −0.23 | −0.28 | −0.08 | 0.51 | −0.10 | −0.06 | −0.10 | 0.27 | 0.27 | 2.68 | ||||||||||||||||||||||
| p-value | 4.08 × 10⁻¹¹ | 8.82 × 10⁻¹² | 6.67 × 10⁻¹⁰ | 8.18 × 10⁻¹⁷ | 6.38 × 10⁻³⁰ | 2.85 × 10⁻²⁵ | 1.37 × 10⁻¹⁶ | 2.85 × 10⁻²⁸ | 4.72 × 10⁻¹⁴ | 2.32 × 10⁻²⁸ | 5.22 × 10⁻⁶ | ||||||||||||||||||||||

| Dim. 1 | Dim. 2 | ||||||
|---|---|---|---|---|---|---|---|
| Continuous Variables | Corr. | Cos2 | Contr. | Continuous Variables | Corr. | Cos2 | Contr. |
| Grain yield | 0.95 | 0.91 | 18.85 | Ear number | 0.53 | 0.28 | 11.39 |
| Grain number | 0.93 | 0.87 | 18.07 | Grain weight | 0.48 | 0.23 | 9.44 |
| Aboveground | 0.93 | 0.87 | 18.01 | Stalk | 0.46 | 0.21 | 8.69 |
| Stalk | 0.74 | 0.55 | 11.33 | Height | 0.44 | 0.19 | 7.80 |
| Chaff | 0.72 | 0.52 | 10.88 | Chaff | 0.39 | 0.15 | 6.09 |
| GNE | 0.59 | 0.35 | 7.18 | Aboveground | 0.31 | 0.10 | 4.00 |
| Ear number | 0.52 | 0.27 | 5.52 | Grain yield | 0.02 | 0.00 | 0.02 |
| GYE | 0.40 | 0.16 | 3.39 | Grain number | −0.21 | 0.04 | 1.81 |
| HI | 0.27 | 0.07 | 1.48 | HI | −0.59 | 0.35 | 14.24 |
| Height | 0.13 | 0.02 | 0.33 | GYE | −0.61 | 0.37 | 14.96 |
| Grain weight | −0.49 | 0.24 | 4.96 | GNE | −0.73 | 0.53 | 21.58 |

Publisher’s Note: MDPI stays neutral with regard to jurisdictional claims in published maps and institutional affiliations. |
© 2021 by the authors. Licensee MDPI, Basel, Switzerland. This article is an open access article distributed under the terms and conditions of the Creative Commons Attribution (CC BY) license (https://creativecommons.org/licenses/by/4.0/).
Share and Cite
Marcos-Barbero, E.L.; Pérez, P.; Martínez-Carrasco, R.; Arellano, J.B.; Morcuende, R. Screening for Higher Grain Yield and Biomass among Sixty Bread Wheat Genotypes Grown under Elevated CO2 and High-Temperature Conditions. Plants 2021, 10, 1596. https://doi.org/10.3390/plants10081596
Marcos-Barbero EL, Pérez P, Martínez-Carrasco R, Arellano JB, Morcuende R. Screening for Higher Grain Yield and Biomass among Sixty Bread Wheat Genotypes Grown under Elevated CO2 and High-Temperature Conditions. Plants. 2021; 10(8):1596. https://doi.org/10.3390/plants10081596
Chicago/Turabian StyleMarcos-Barbero, Emilio L., Pilar Pérez, Rafael Martínez-Carrasco, Juan B. Arellano, and Rosa Morcuende. 2021. "Screening for Higher Grain Yield and Biomass among Sixty Bread Wheat Genotypes Grown under Elevated CO2 and High-Temperature Conditions" Plants 10, no. 8: 1596. https://doi.org/10.3390/plants10081596
APA StyleMarcos-Barbero, E. L., Pérez, P., Martínez-Carrasco, R., Arellano, J. B., & Morcuende, R. (2021). Screening for Higher Grain Yield and Biomass among Sixty Bread Wheat Genotypes Grown under Elevated CO2 and High-Temperature Conditions. Plants, 10(8), 1596. https://doi.org/10.3390/plants10081596