Article

Comparative Transcriptome Profiling of Kappaphycus alvarezii (Rhodophyta, Solieriaceae) in Response to Light of Different Wavelengths and Carbon Dioxide Enrichment

by
Vun Yee Thien
1,2,
Kenneth Francis Rodrigues
1,
Christopher Lok Yung Voo
1,
Clemente Michael Vui Ling Wong
1 and
Wilson Thau Lym Yong
1,3,*
1
Biotechnology Research Institute, Universiti Malaysia Sabah, Jalan UMS, Kota Kinabalu 88400, Malaysia
2
Innovation Center, Xiamen University Malaysia, Jalan Sunsuria, Bandar Sunsuria, Sepang 43900, Malaysia
3
Seaweed Research Unit, Faculty of Science and Natural Resources, Universiti Malaysia Sabah, Jalan UMS, Kota Kinabalu 88400, Malaysia
*
Author to whom correspondence should be addressed.
Plants 2021, 10(6), 1236; https://doi.org/10.3390/plants10061236
Submission received: 29 April 2021 / Revised: 22 May 2021 / Accepted: 26 May 2021 / Published: 17 June 2021

Abstract

:
Rhodophyta (red algae) comprises over 6000 species, however, there have only been a few comparative transcriptomic studies due to their under-representation in genomic databases. Kappaphycus alvarezii, a Gigartinales algae, is a valuable source of carrageenan and is extensively cultivated in many countries. The majority of seaweed farming in Southeast Asia is done in intertidal zones under varying light (i.e., spectra and irradiance) and carbon dioxide (CO2) conditions, which affects the rate of photosynthesis. This study conducted transcriptome profiling to investigate the photosynthetic mechanisms in K. alvarezii exposed to different wavelengths of light (i.e., blue, green, and red light, in comparison to white light) and CO2 availability. We analyzed the responses of photosynthetic protein complexes to light and observed that light of different wavelengths regulates a similar set of photosynthetic apparatuses. Under CO2 enrichment, genes encoding C3 and C4 enzymes were found to be actively transcribed, suggesting the likely shift in the carbon metabolism pathway or the involvement of these genes in adaptive physiological processes. This study contributes to the understanding of the regulatory mechanisms of photosynthetic carbon metabolism in red algae and has implications for the culture and commercial production of these economically valuable macroalgae.

1. Introduction

Transcriptome shifts associated with the light signals perceived by photoreceptors offer insights into the gene regulation in higher plants; however, limited information is available on seaweed exposed to different wavelengths of light. The red alga, Kappaphycus alvarezii (Doty) Doty, is the most cultivated seaweed in the world, and its commercial farms are usually placed in shallow water areas in the intertidal zones [1,2]. Seaweed grown in the intertidal zone may face depletion in both quality and quantity of light with the changes in spectral distribution at different depths in the water column [3]. However, seaweeds can acclimate to the changes in light intensity and wavelength by employing efficient light-harvesting mechanisms, such as increasing the quantum of photosynthetic pigments or changing the ratio of accessory pigments to chlorophyll a [4,5]. Light-mediated physiological responses and molecular mechanisms have been studied in brown alga, Saccharina japonica, whose gene expression profiling indicated that light induces significant changes in gene expression in the species [6,7]. These light-responsive genes encode many transcription factors, particularly those involved in various functions such as photomorphogenesis, circadian clock function, photoreactivation, pigment biosynthesis, and carbon fixation.
The transcriptome of K. alvarezii was first sequenced by Wu et al. [8] together with that of 19 Phaeophyceae (brown algae) and other 20 Rhodophyceae (red algae). Their study provided a broad range of algal transcriptome data of potential genetic and biological studies linking the genes to their functions. Then, Song et al. [9] performed a de novo transcriptome sequencing of K. alvarezii, along with other species of the Solieriaceae family (e.g., Betaphycus gelatinus and Eucheuma denticulatum) to investigate the mechanisms underlying carrageenan biosynthesis. A recent transcriptome profiling of K. alvarezii elucidated further genetic information and revealed genes involved in some important metabolic pathways such as energy metabolism, carbohydrate metabolism, and amino acid metabolism that maintain the essential functions of the organism [10]. To date, very few studies have elucidated the molecular mechanism of photosynthesis in K. alvarezii [11]. The occurrence of different pathways and photosystem complexes in plants may have resulted due to the exposure to different environmental conditions, e.g., light regimes and temperature [12,13]; besides, the alterations in photosynthetic pathways under environmental changes possibly contribute to the adaptation of plants to environmental stresses [14,15]. While the C3 pathway is predominantly active in marine seaweed [16,17,18], C4 photosynthesis has also been observed in some other eukaryotic algae [19,20]. Furthermore, the coexistence of C3 and C4 photosynthetic pathways have been observed in Ulva prolifera and other aquatic plants, including Chara contraria, suggesting that these species may alter their carbon metabolism pathways in response to environmental changes, or may carry out both C3 and C4 cycles under normal conditions, with a possibly more significant role of C4 photosynthesis under stress conditions [21,22].
Seaweeds have developed mechanisms to regulate their photosynthetic activity and adapt to the changing environments, including the light regime, temperatures, CO2, and nutrient levels [23,24,25]. Photosynthetic regulation by light quality involves chloroplast structure, pigment composition, antioxidant defenses, and photosynthetic carbon assimilation [26,27,28]. Unlike land plants, seaweeds can synthesize pigments complementary to the spectral quality of the incident light [29]. The process of harvesting light in red algae is carried out primarily by a group of pigmented proteins, called phycobiliproteins, that are constituents of a macromolecular complex called the phycobilisome [11,30]. On the other hand, photosynthesis in many seaweeds is nearly saturated with the ambient dissolved inorganic carbon because of their capacity to utilize a high concentration of seawater bicarbonate (HCO3) as the principal inorganic carbon source [31]. Although the seaweeds exhibit wide-ranging capacities to extract HCO3 from the seawater, they often show heterogeneous and species-specific responses to elevated CO2 [32,33].
In this study, we used Illumina sequencing technology for transcriptome profiling of K. alvarezii to determine a possible differential gene expression in response to light of different wavelengths and CO2 enrichment. The detailed analysis was performed by comparing the transcriptomes of K. alvarezii exposed to white light (WL) and the three other wavelengths, i.e., blue (BL), green (GL), and red light (RL), and between with and without CO2 enrichment. The transcriptome dataset was also compared with those of red algae deposited earlier in the GenBank [8], and a significant similarity was observed between the current and the earlier transcriptomes. This information adds to our understanding of molecular mechanisms underlying light-induced responses, adaptation, and inorganic carbon fixation in red algae, and it provides novel insights into the impact of changing light conditions on K. alvarezii growth and propagation.

2. Results

2.1. Transcriptome Sequencing and De Novo Assembly

The sequencing run generated a total of 31.89 Gb raw paired-end reads from all the RNA samples across all treatments. After the identification and removal of adapters and low-quality reads, over 25 Gb filtered reads (≈79%) were retained for assembly and further analysis. Using Trinity, a total of 76,871 assembled transcripts were generated with lengths in the range of 300 to 17,257 bp with a mean length of 979 bp and an N50 contig length of 1707 bp. There were no ambiguous bases within the assembled sequences. In the quality assessment of the assembly, most of the reads (93.51%) aligned back to the assembled transcripts with an average read depth of 256.47. The reads that did not map back to the assembled transcripts corresponded either to shorter than 300 bp or with incomplete/unmatched sequences with the transcripts.

2.2. Functional Anotation of the K. alvarezii Transcriptome

A total of 42,915 transcripts could be assigned with putative functions, accounting for 55.83% of the total assembled sequences. UniProt annotation revealed that 23,701 (55.23%) transcripts had high-confidence hits of E-value smaller than 10−45 (Figure 1a), and 21.42% of the transcripts had over 95% similarity (Figure 1b). In terms of species distribution, the top hit result showed that only 13.45% of the transcripts matched with those of the red alga Chondrus crispus, which was followed by 3.61% of matches with those of the diatom Phaeodactylum tricornutum (Figure 1c).
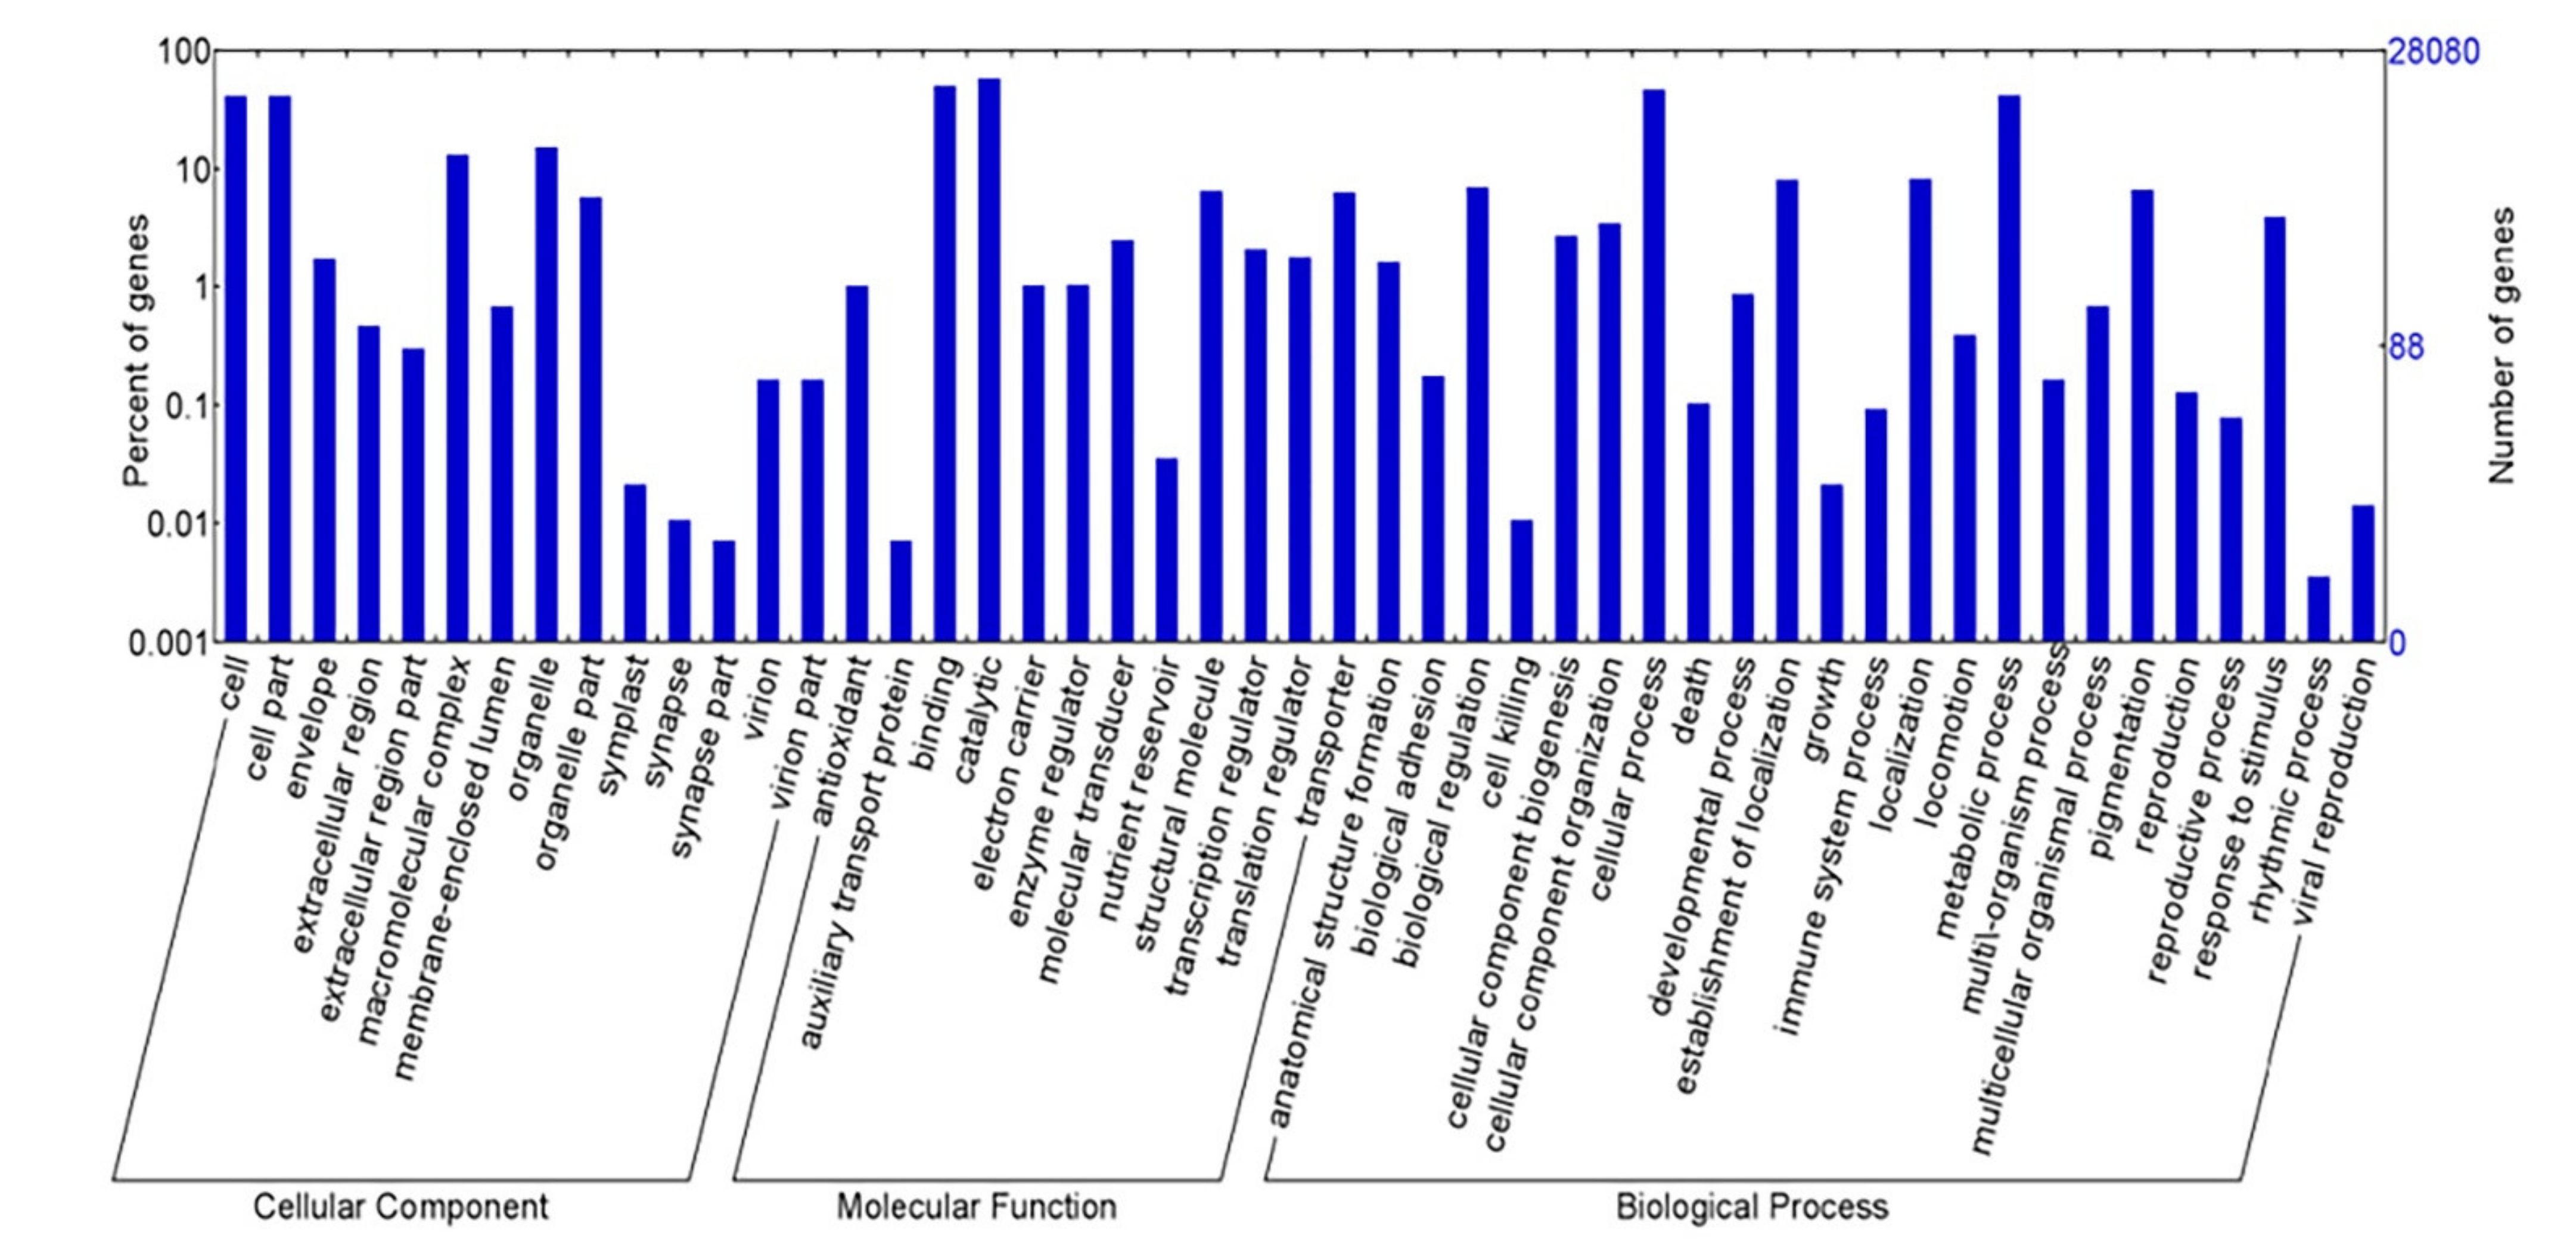
About 28,079 annotated transcripts were grouped into three main GO domains, i.e., 20,847 sequences (27.13%) into “biological process”, 14,291 (18.60%) into “cellular component”, and 41,698 (54.27%) into “molecular function” (Figure 2). Functional and pathway analysis assigned a total of 10,460 transcripts to 278 KEGG pathways and the largest numbers of transcripts were assigned to “metabolic pathways”, followed by the “biosynthesis of secondary metabolites”, “biosynthesis of amino acids”, and “carbon metabolism” (Table 1).

2.3. Identification of Candidate Transcripts Associated with light and CO2 Responses

Based on sequence similarity, several transcripts associated with the response to light were identified, among which 72 candidates were of photosynthetic protein complexes, i.e., chlorophyll, carotenoids (beta- and zeta-carotene), phycobilisome, phycocyanin, and phycoerythrin, and 38 candidates were of photosystem proteins, including (i) photosystem I (PSI) subunits (PsaA, PsaB, and PsaC), PSI chlorophyll A apoprotein, Ycf3 and Ycf4 protein domains; (ii) photosystem II (PSII) subunits (D1, D2, CP43, and CP47), PSII extrinsic protein PsbP, and PSII reaction center protein M. Out of the 38 photosystem proteins, 15 were PSI and 23 were PSII proteins. Three types of photoreceptor candidates, including one cryptochrome, two blue-light receptors (PHR2), and four phytochrome proteins were also identified. One phytochrome protein was found to be similar to the phytochrome-like protein 2, which is a photoreceptor that exists in two forms that are reversibly interconvertible by light [34]. We found 307 candidates of the protein kinase (PK) family, including serine/threonine PK, calcium-dependent PK, and receptor-like PK in the light-associated transcripts; a total of 59.93% PKs in K. alvarezii were homologous to those in C. crispus. Furthermore, candidate genes associated with both C3 and C4 photosynthetic pathways were found in K. alvarezii, and a total of 129 carbon fixation-related transcripts in response to CO2 levels were identified. The transcripts of key enzymes, such as phosphoribulokinase, phosphoglycerate kinase, aspartate aminotransferase, phosphoenolpyruvate carboxylase, phosphoenolpyruvate carboxykinase, malate dehydrogenase, and pyruvate orthophosphate dikinase were also identified (Table 2) and provided unequivocal molecular evidence that both the C3 and C4 pathway genes are actively transcribed in K. alvarezii.

2.4. Identification of Differentially Expressed Genes (DEGs)

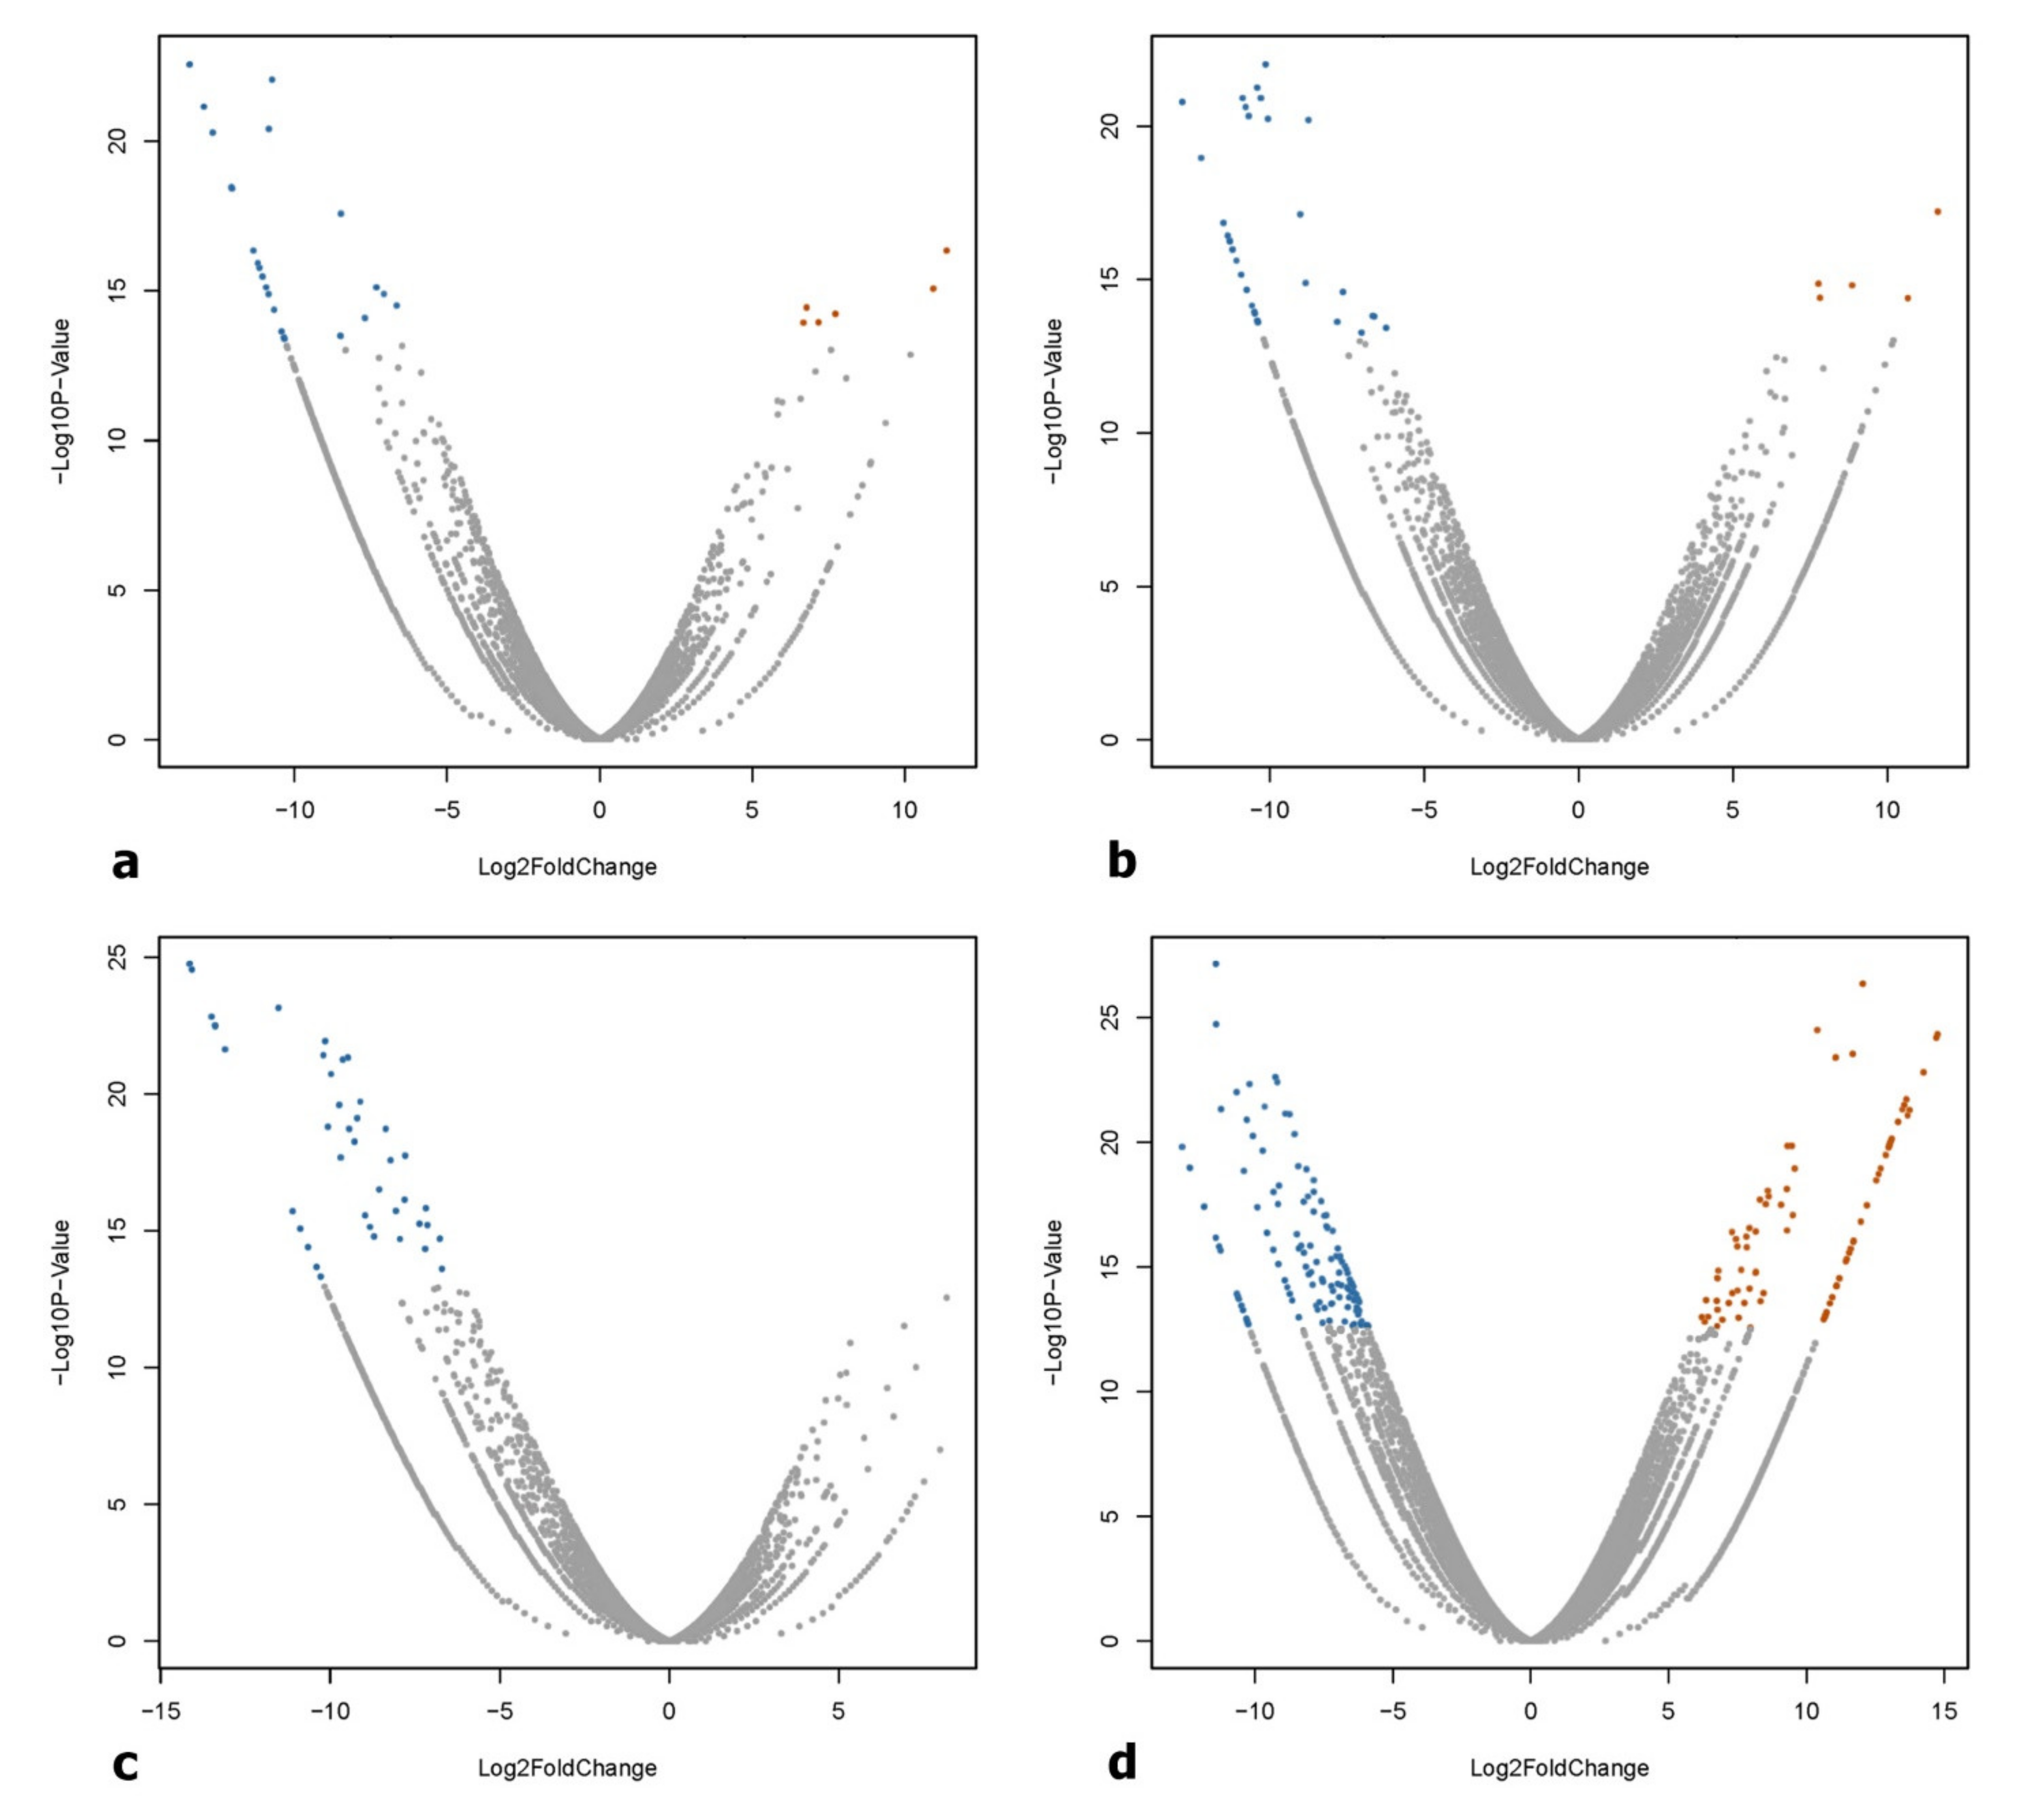
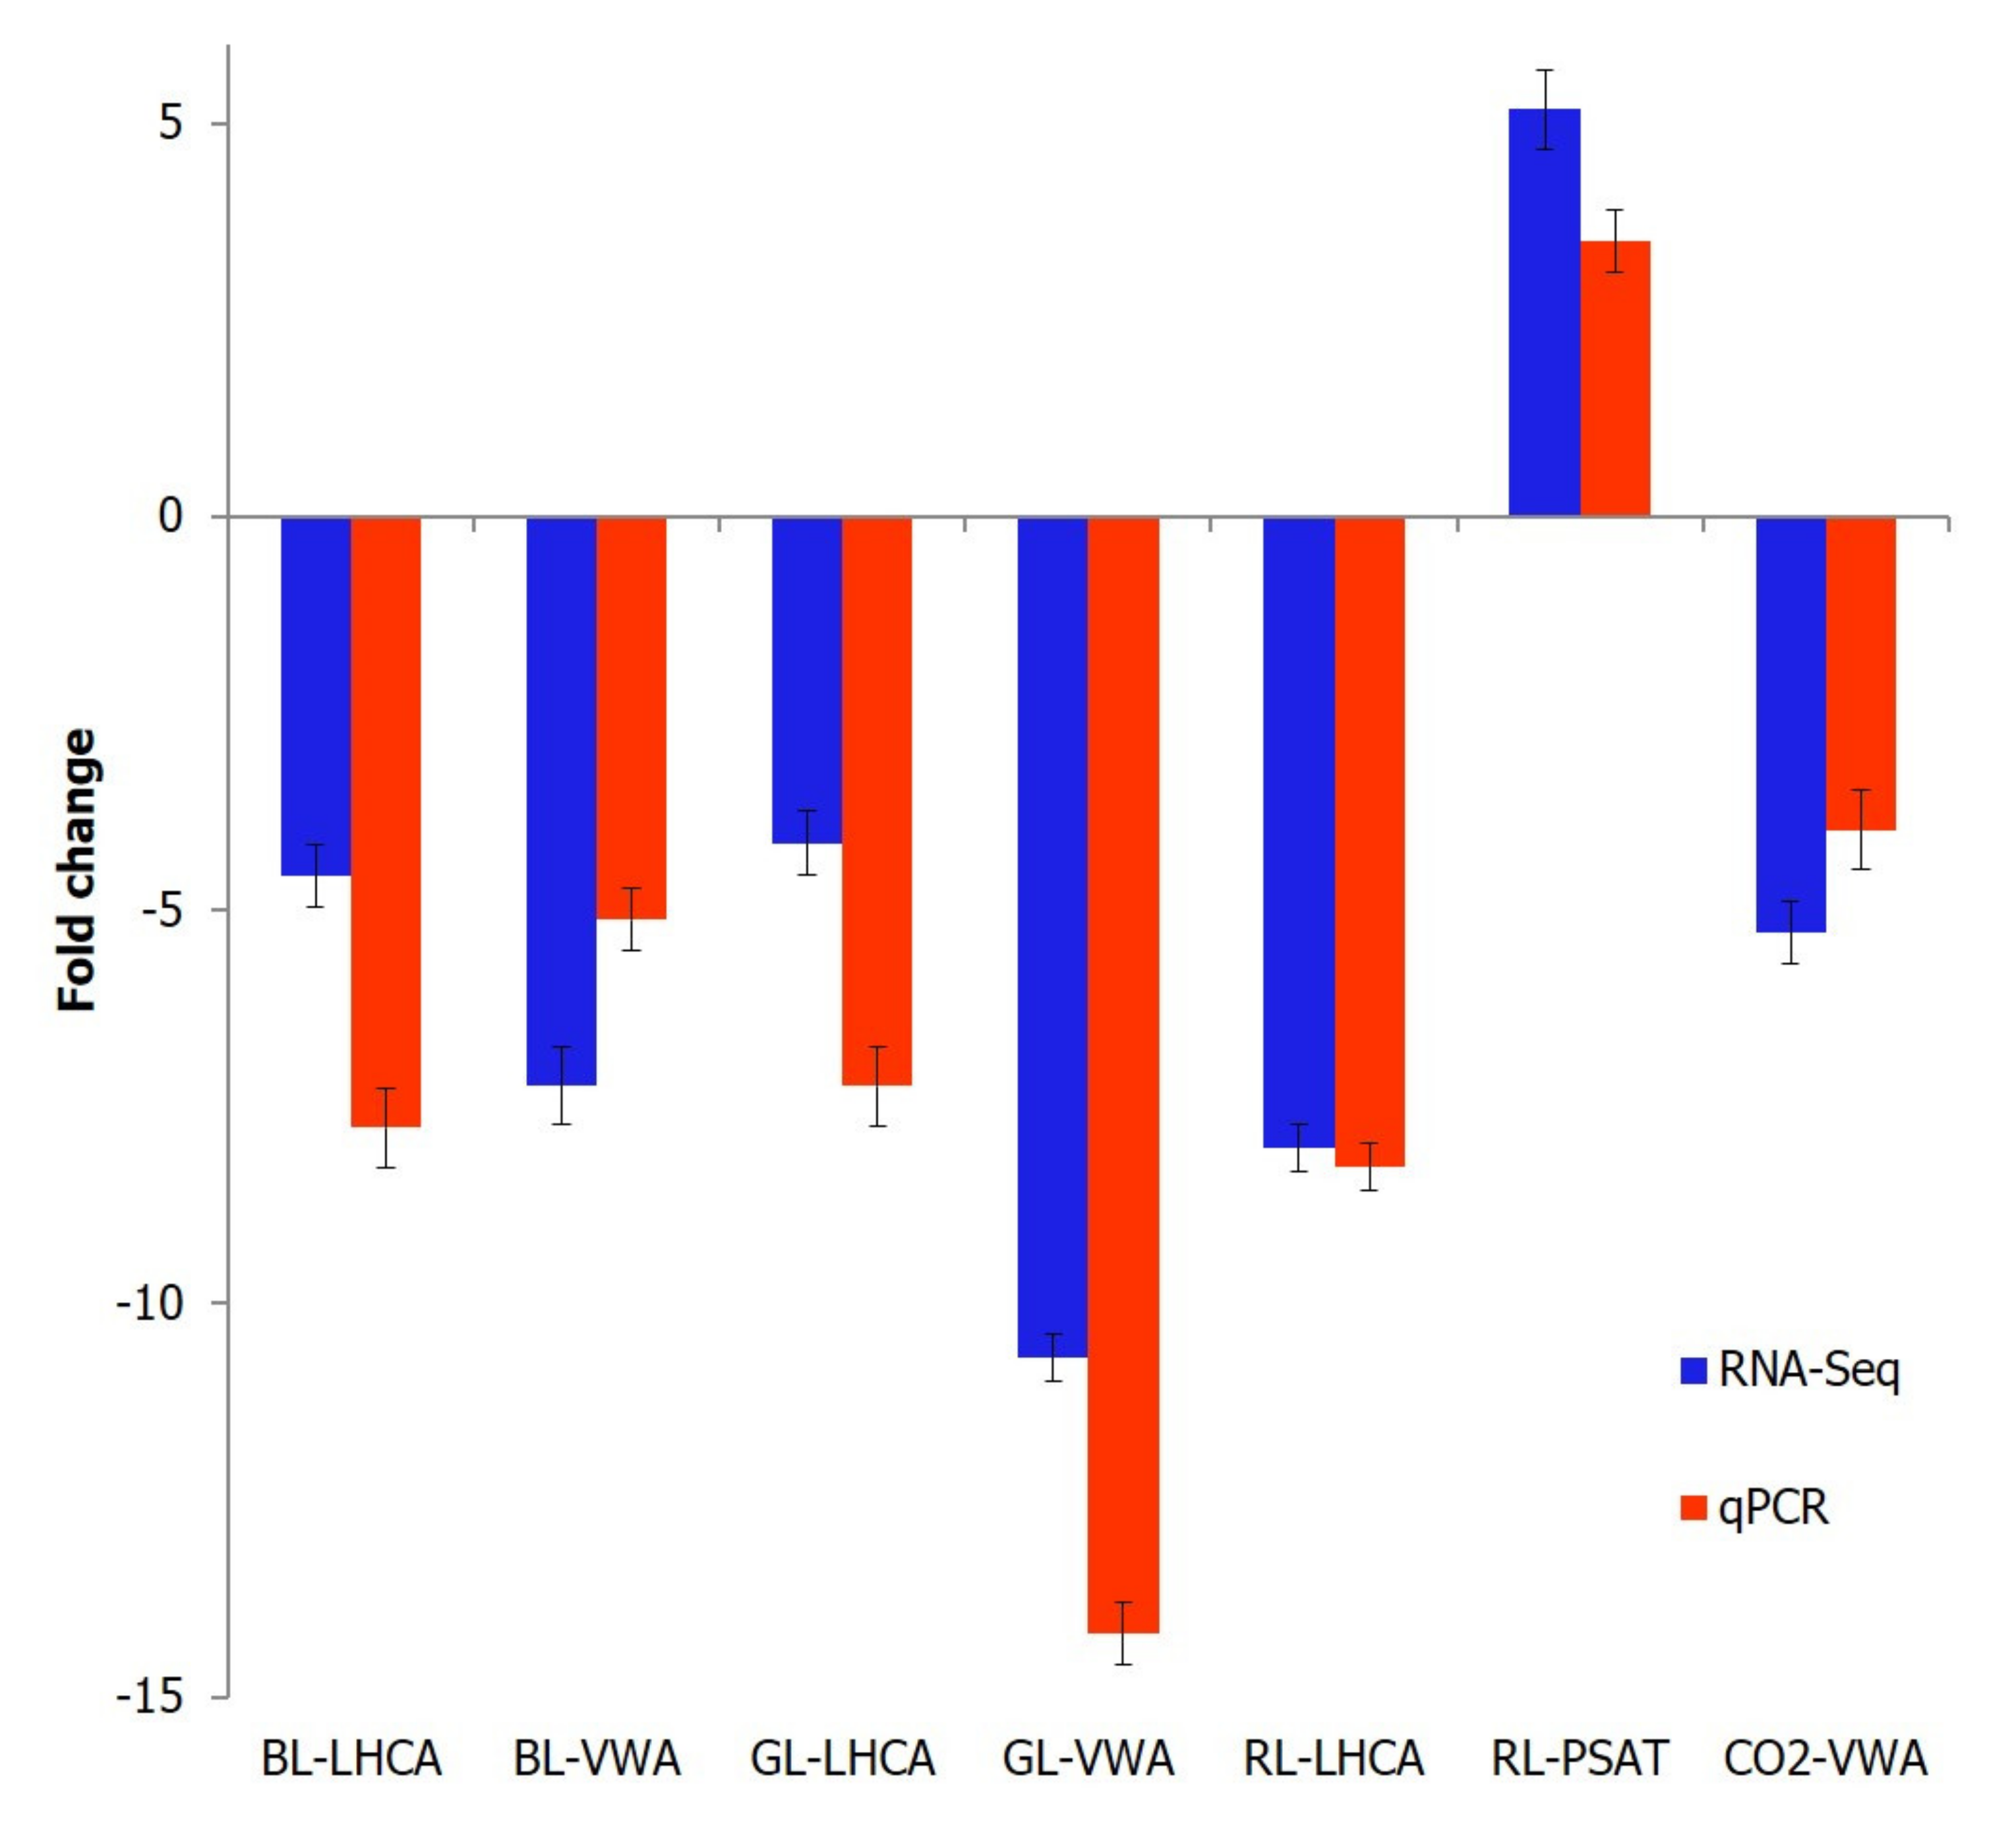
The high-quality reads (84 to 86%) from individual samples were mapped to the transcriptome database and deposited in the National Center for Biotechnology Information (NCBI) Sequence Read Archive (SRA) with the following accession numbers: SRR2757332 (GL), SRR2757333 (BL), SRR2757334 (CO2-treated), SRR2757335 (WL), and SRR2757337 (RL). The lower mapping rate of the reads to existing libraries reflects the low transcriptome sequencing depth and a high level of heterozygosity in K. alvarezii. Gene expression levels in K. alvarezii exposed to different light wavelengths and CO2 enrichment were compared in pairs and groups of treatments. A total of 1487 DEGs were detected using stringent filtering criteria, such as an adjusted p-value < 1 × 10⁻¹⁰ and a log2 fold change of two as the cutoff (Figure 3). The results were validated by qPCR of the selected genes (Table 3), including two genes in each of BL (LHCA and VWA), GL (LHCA and VWA), and RL (LHCA and PSAT), and one gene in the CO2-induced condition (VWA), confirming the accuracy of RNA-Seq in mRNA quantification (Figure 4). Of the 1311 classified DEGs, 931 (69.64%) were then annotated successfully through sequence similarity searches against the UniProt database with a significance of E-value ≤ 10−5. However, about 49.29% of the annotated DEGs could not be assigned to available protein databases and are likely to represent uncharacterized proteins due to the limited availability of sequence data in the databases.
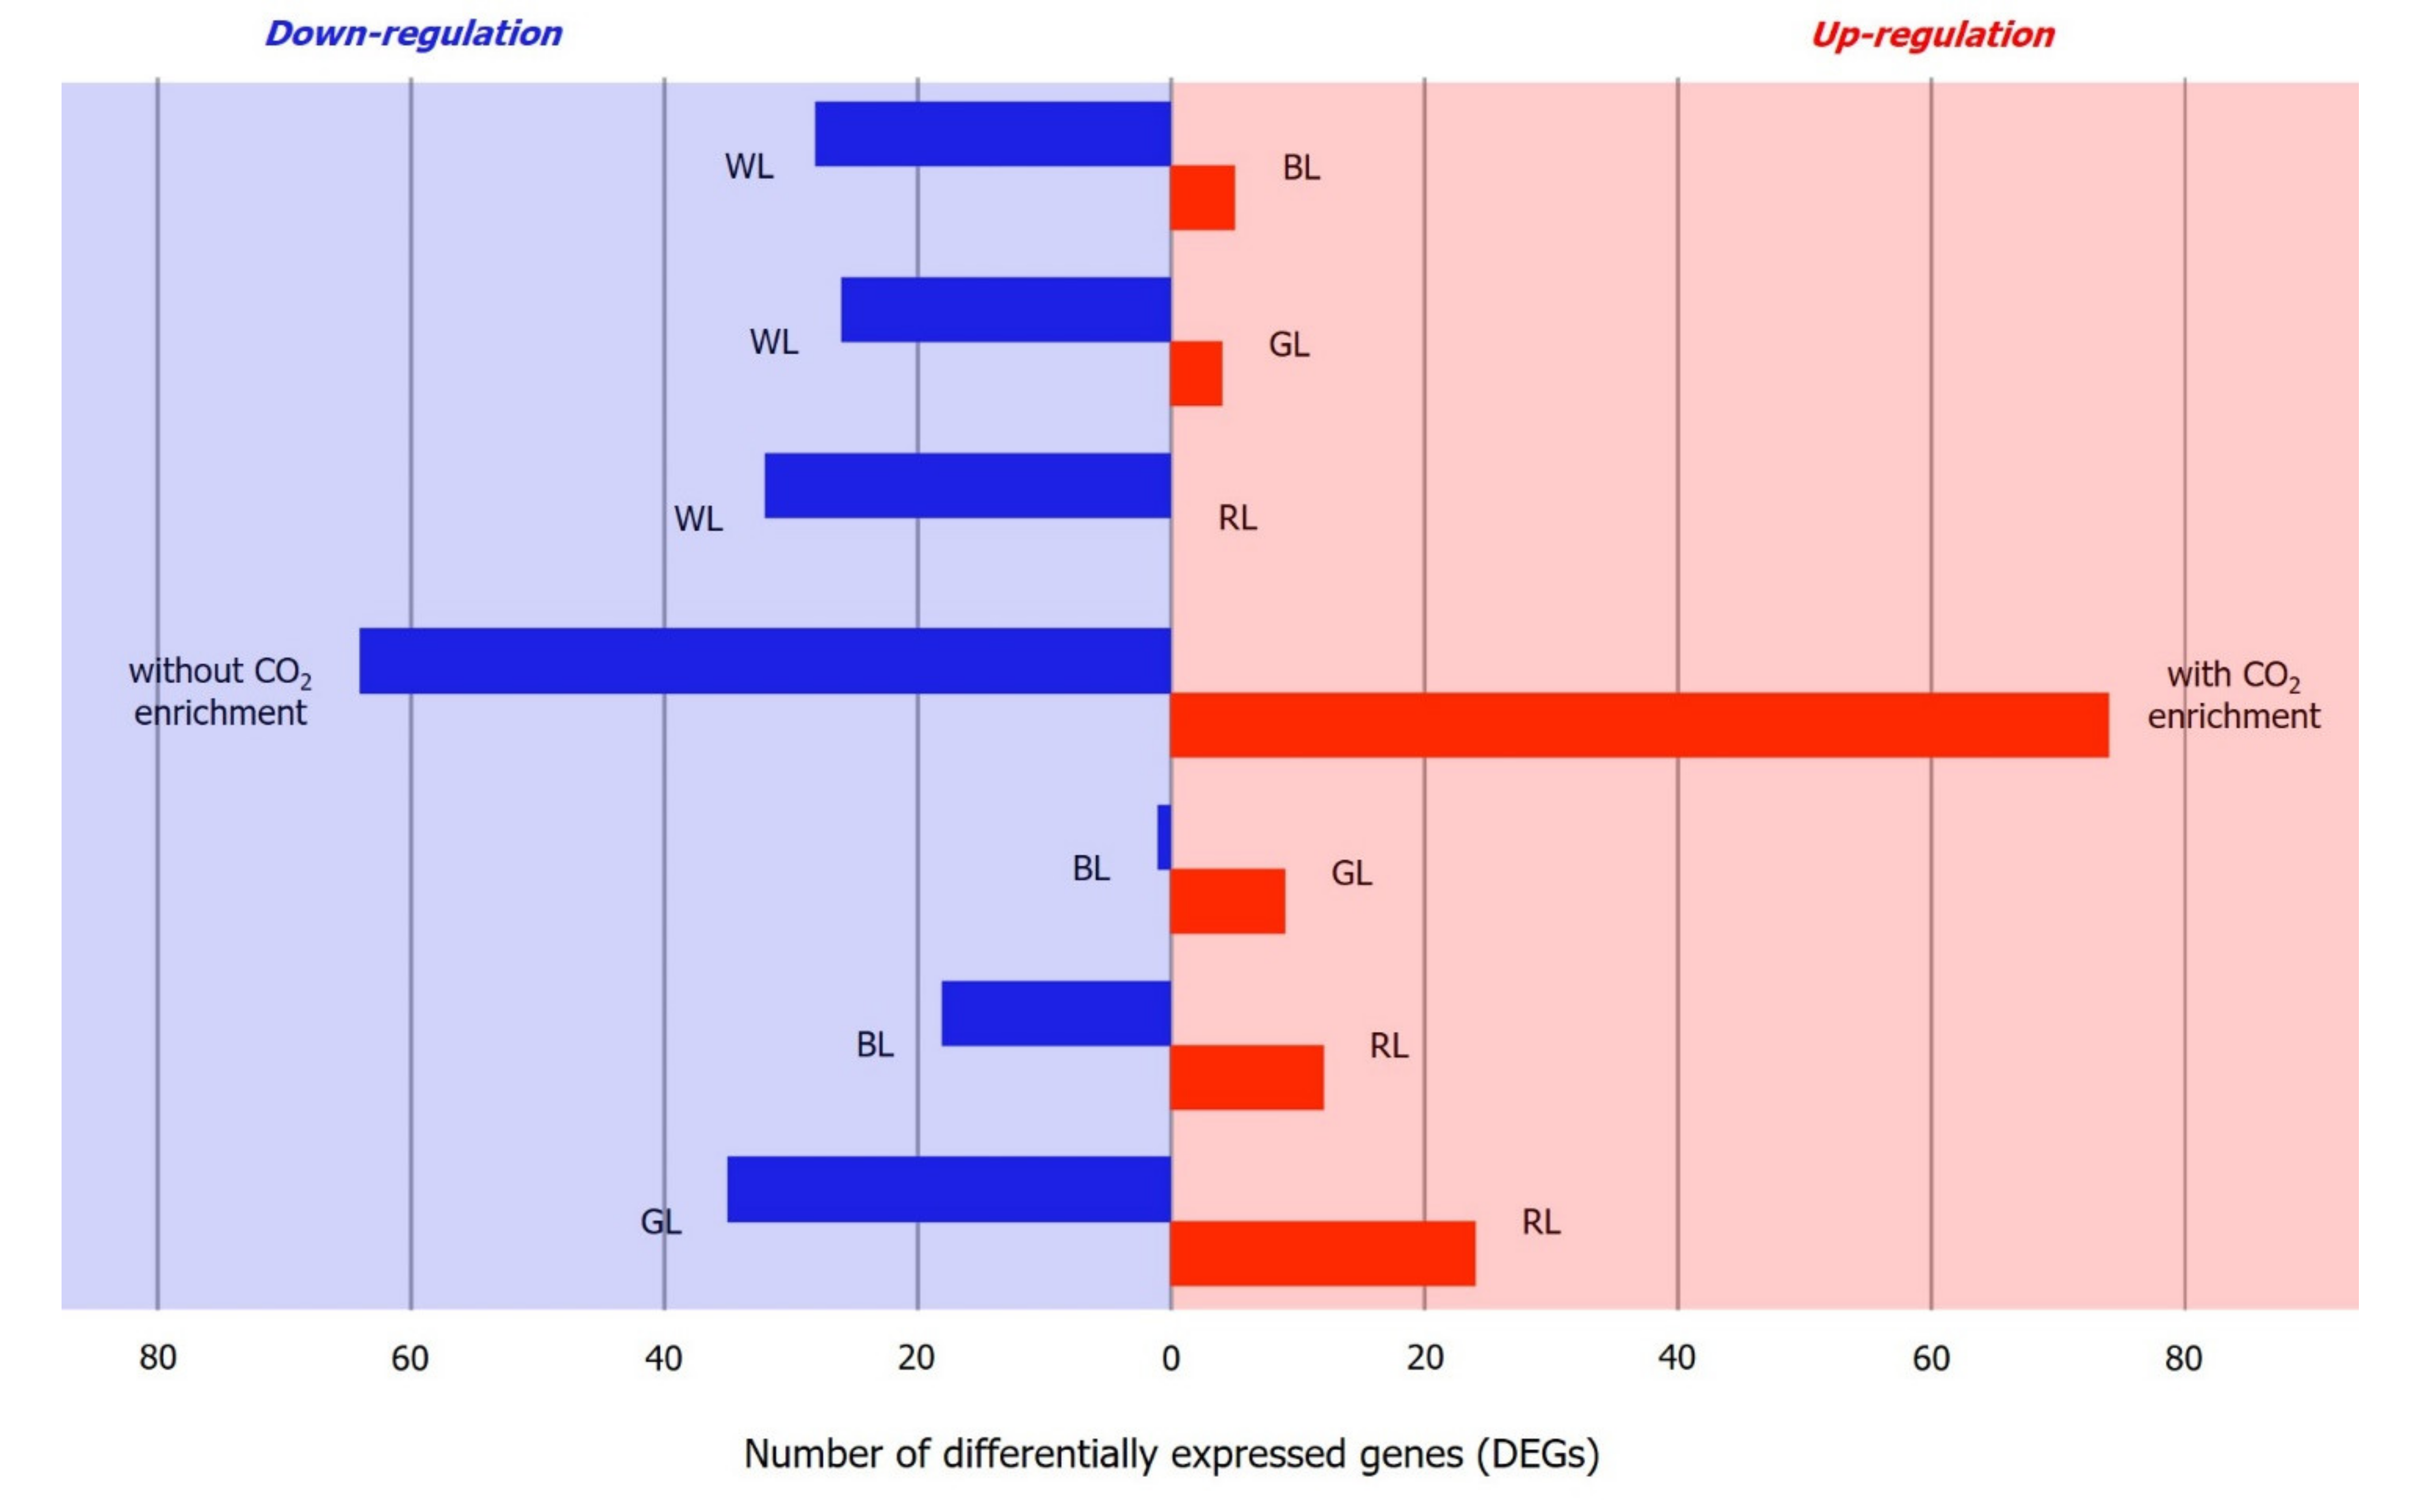
A comparison of different light wavelengths against WL revealed the largest number of DEGs in BL-treated samples, with five upregulated and 28 downregulated DEGs (Figure 5). In the CO2 enrichment experiment, a total of 138 transcripts were found differentially expressed, with 74 upregulated and 64 downregulated transcripts (Table 4). Overall, the highest number of DEGs were detected between WL and the composite of BL+GL+RL and the highest number of significantly up/downregulated genes encoded ribosomal proteins, indicating a high turnover rate of protein synthesis. Furthermore, a majority (578/582) of the transcripts were found downregulated, implying that these may be associated with differential intensities of the composite and individual wavelengths. Pathway enrichment analysis revealed that the annotated DEGs under different light and CO2 treatments were mainly involved in “metabolic pathways”, “biosynthesis of secondary metabolites”, “oxidative phosphorylation”, “carbon metabolism”, and “porphyrin and chlorophyll metabolism”.

3. Discussion

Seaweeds grown in the intertidal zones are exposed to fluctuating environmental conditions and have thus developed specific mechanisms enabling them to overcome unfavorable disturbances and environmental stresses [35,36,37]. These adaptations and acclimation responses contribute significantly to their survival and fitness, providing them with the plasticity necessary for a stationary life. The present study enhances our understanding of the gene expressions and responses of red alga K. alvarezii toward different wavelengths of light (BL, GL, RL, and WL) and increasing CO2 levels.
The reason for the presence of a large number of unknown coding sequences (CDS) in this study can be attributed to the dearth of information about the red seaweed genome [38,39,40]. Alternatively, the number of CDS is likely to be the result of eukaryotic symbionts associated with the seaweed samples [41,42]. However, in this study, we only reported the genes that could be mapped back to the UniProt protein database for red algae and validated their expression using qPCR. For accurate and reliable gene expression results, normalization of real-time PCR data against an internal control gene is required; an ideal control gene should have consistent expression regardless of the experimental treatments and developmental stages of the studied organism [43,44,45,46]. As applied earlier in studies on other red algae and plant species [47,48,49], rDNA genes were used in this expression study for copy number validation because the copy number of the conventional markers such as glyceraldehyde-3-phosphate dehydrogenase and beta-tubulin were not constant across samples as per the results obtained by quantitative reverse transcription PCR.
Our analysis revealed that cDNA synthesized by reverse transcription using oligo(dT) priming includes not only sequences from nuclear mRNA but also transcripts derived from genes encoded on the plastid genome. This result is consistent with the previous findings on polyadenylation of chloroplast mRNAs in the green alga Chlamydomonas reinhardtii [50,51,52], flagellate Euglena gracilis [53], and higher plants [54,55]. The phenomenon of post-transcriptional modification of mRNA via polyadenylation of the 3′ end has been reported across the plant kingdom [56]. Therefore, we can only concur that plastid-encoded genes are polyadenylated based on the selection of our protocols. However, the future investigator may consider the use of oligo(dT) primer along with a pair of gene-specific primers to validate this phenomenon.
Photosynthesis begins with the process of light harvesting, which is mediated by pigment-binding proteins that form light-harvesting antenna systems. Light-harvesting complexes (LHCs) in red algae constitute a large family of proteins, including chlorophyll a, zeaxanthin, and β-carotene [57,58]. Chlorophyll a-binding LHCs in red algae are functionally associated with PSI and have similarities with higher-plant chlorophyll a/b-binding proteins and fucoxanthin chlorophyll a/c-binding antenna complexes, as observed in their amino acid sequences and conserved regions [59,60]. Chlorophyll a/b-binding and fucoxanthin chlorophyll a/c-binding proteins were frequently reported to be transcriptionally repressed in response to light stress in terrestrial plants and microalgae [61,62,63]. In this study, several genes encoding light-harvesting complex A (LHCA) proteins were significantly downregulated after treatment with light of different wavelengths (BL, GL, and RL) in comparison to WL. Previous transcriptomic studies of stress responses also revealed the upregulation of fucoxanthin chlorophyll a/c-binding proteins in response to heat-, salt-, and oxidative stress, apart from light in brown algae [64,65], indicating possible additional functions of these proteins. Recently discovered “red lineage chlorophyll a/b-binding-like proteins” (RedCAPs) were found to be restricted to the red algal lineage and participate in the light (intensity- and quality-) dependent structural remodeling of light-harvesting antennae [66]. However, the existence and expression of RedCAPs in response to different light qualities and CO2 levels in K. alvarezii remains to be explored.
Chlorophyll and carotenoids in red algae do not function as primary light absorbers, as the role is taken over by the phycobilisomes, which direct the energy to the reaction center of PSII for conversion into chemical forms [57]. The phycobilisome protein complex consists of two or three types of pigment proteins known as biliproteins, i.e., phycoerythrin, phycocyanin, and allophycocyanin. They differ in protein identity, chromophore type, attachment, and their relative location in the phycobilisome complex [67]. The phycobilisome absorbs light in the 590–650 nm region of the solar spectrum, which cannot be absorbed either by chlorophyll or carotenoids. Thus, organisms with phycobilisomes have greater accessibility to usable light within the visible spectrum and hence possess greater adaptability and light-capturing capacity [67]. Although RL had a significant impact (p < 0.05) on the growth of K. alvarezii (8.1 ± 1.4% day−1) compared to those treated with BL (3.5 ± 1.2% day−1) and GL (5.2 ± 1.1% day−1), as demonstrated in a related study conducted in our laboratory [68], different light spectra seemed to induce the same effect on phycobilisome content in this species, and the genes encoding phycobilisomes showed no significant difference in expressions when treated with the four wavelengths of light. Conversely, previous studies reported the influence of both irradiance and spectral composition on the synthesis of phycoerythrin and phycocyanin in the red algae [69,70,71,72]. Such differences may be because the differential expression analysis with transcriptome data considers the factors that could vary between samples, including overall depth of sequencing, read and fragment length, gene density in the genome, transcriptome splicing complexity, and transcript abundance [73]. This study was conducted over a duration of 14 days, which may not be sufficient to study long-term changes in gene expression related to phycobilisome biosynthesis. Furthermore, the experimental design did not account for relative protein concentrations, so we can only make inferences based on the number of transcripts, all of which may not be translated into functional proteins. On the other hand, expressions of genes associated with phycobilisome, phycoerythrin, and photosystem proteins were found upregulated in K. alvarezii under CO2 enrichment, suggesting that the photosynthetic efficiency of this species may be enhanced by increasing CO2 levels.
Photosystems are functional and structural units of protein complexes involved in photosynthesis, but there was no significant difference in the expressions of these protein complexes under four different wavelengths of light in K. alvarezii. Light intensity and quality are essential factors for photosynthetic competence, and generally higher pigment content is found in algae grown at lower light intensity [74,75,76,77]. While acclimation to high light intensity is shown by reducing phycoerythrin content in phycobilisomes, red algae do not undergo complementary chromatic adaptation and exhibit significant changes in the phycoerythrin/phycocyanin ratio when grown under different wavelengths of light [57]. However, in this study, out of the 38 identified candidate transcripts of photosystem proteins, nine genes were upregulated by increasing CO2 levels, including four PSI proteins (ycf4, subunit III, reaction center subunit XI, and chlorophyll A apoprotein) and five PSII proteins (D1, D2, CP43, CP47, and PsbP). These findings suggest the importance of CO2 in enhancing the quantum efficiency of photosystems I and II [78], albeit the photosynthetic responses of seaweeds to increase in CO2 levels are still mostly unknown.
Light-regulated gene expression mediated by photoreceptors was studied previously in brown alga S. japonica in which the expression of photoreceptor genes was found triggered by different wavelengths of light, i.e., BL, RL, and WL [7]. However, in the present study, the phytochrome (one of the photoreceptors) gene was observed to be transcribed only under WL but not under other light of other wavelengths, suggesting that other characteristics of light may regulate the expression of phytochrome genes in K. alvarezii. On the other hand, the gene for cryptochrome (another photoreceptor) was positively expressed under all wavelengths of light and an increased concentration of CO2 except under RL treatment. Danon et al. [79] and Lopez et al. [80] reported that in plants, cryptochrome is involved in the light-dependent gene expression, mainly affecting the expression of genes involved in the responses to biotic/abiotic stresses and regulation of photosynthesis. Compared to BL, a higher expression of the cryptochrome gene under GL may be due to the discrete effects of this wavelength on plant biochemistry, i.e., physiological and developmental processes via cryptochrome-dependent and cryptochrome-independent means [81].
The identification of key enzymes involved in both the reductive pentose phosphate cycle (C3) and phosphoenolpyruvate carboxykinase (PCK)-type C4-dicarboxylic acid cycle indicates the possibility of the existence of both photosynthetic pathways (C3 and C4) in K. alvarezii. The levels of most of the enzymes involved in the C3-cycle, such as glyceraldehyde 3-phosphate dehydrogenase, fructose-bisphosphate aldolase, and phosphoglycerate kinase, are upregulated under elevated CO2, suggesting that CO2 enrichment may alter carbon metabolism from C4 to C3 in K. alvarezii, which is similar to that reported in other marine algae [22,82,83]. Alternatively, an increase in CO2 levels induces stomatal closure in terrestrial C4 plants, which reduces the loss of water and improves water use efficiency. C4 plants demonstrate drastically reduced rates of photorespiration because CO2 is concentrated at the active site of ribulose-1,5-bisphosphate carboxylase and outcompetes molecular oxygen, leading to higher photosynthetic efficiency [84]. However, the underlying photosynthetic mechanisms of K. alvarezii in elevated CO2 concentrations are largely unknown; besides, the process of gaseous diffusion is not regulated due to the absence of stomata [85,86]. Furthermore, the involvement of genes in the photosynthetic pathway in alternative physiological processes such as CO2 regulation remains to be elucidated, as in the case of carbonic anhydrase [87] and phosphoenolpyruvate carboxykinase [88]. Therefore, this response of red algae to increasing CO2 warrants further research.

4. Materials and Methods

4.1. Seaweed Materials

Seedlings of K. alvarezii (var. tambalang ‘giant’) were obtained from the Biotechnology Research Institute, Universiti Malaysia Sabah. The seaweed materials were collected from Pulau Sebangkat (4°33′31″ N, 118°39′49″ E), Semporna, Sabah and cultured under laboratory conditions following earlier published protocol [89]. The cultures were maintained in a growth chamber at 25.0 ± 1.0 °C and 18/6 h (light/dark) photoperiod with a light intensity of 75 μmol photons m−2 s−1. The experimental samples were selected from healthy, disease-free explants and cut to a total length of 2–3 cm from the algal tips. Three replicates, each consisting of five algal tips from different plants were used for each experimental condition. The algal tips were cultured in a Fernbach culture flask with 800 mL artificial seawater (Fluval marine salt, 36 g L−1, salinity 31.4 ppt) enriched with 50% Provasoli’s enriched seawater.

4.2. Culture Conditions

For light treatment, the cultures were placed under 75 μmol photons m−2 s−1 WL, BL (wavelength = 450–490 nm), GL (wavelength = 520–560 nm), and RL (wavelength = 635–700 nm) separately. The source of light were light-emitting diodes, and the detected irradiances were measured with a digital light meter (Model 5202, Kyoritsu, Japan). For CO2 treatment, compressed CO2 (500 mL/min flow rate; filtered with 0.2 µm sterile Acrovent filter) was added daily to WL-illuminated cultures for 30 min during the light cycle [90,91,92]. The measured concentrations of CO2 using a multiparameter meter (Orion, Thermo Scientific) were 994.9 ± 13.5 ppm in CO2-treated and 398.7 ± 11.1 ppm in untreated seawater media. CO2 was only supplemented during the light cycle to avoid acidification of the culture media, and pH was recorded using an electrochemistry portable meter (Orion, Thermo Scientific); it was determined to be 7.42 and 8.16 of the CO2-treated and untreated seawater, respectively. All the cultures (three biological replicates for each treatment and five seedlings per replicate) were grown at 25.0 ± 1.0 °C with an 18/6 h (light/dark) photoperiod. After culturing for 14 days, K. alvarezii seedlings were collected and pooled according to the respective treatments for RNA extraction.

4.3. RNA Isolation

Total RNA was extracted using the QIAGEN RNeasy Plant Mini Kit (QIAGEN, Germany) following the manufacturer’s protocol. Before extraction, the samples were washed with diethylpyrocarbonate-treated water and then rapidly frozen with liquid nitrogen and ground to a fine powder using an RNase-free, chilled mortar and pestle. RNA samples with A260/280 ratio between 1.8 and 2.0, A260/230 ratio between 1.8 and 2.1, and RNA integrity number (RIN) of 8 and above were used for library construction.

4.4. Preparation of cDNA Library

Five cDNA libraries were generated for each RNA sample of different culture treatments, i.e., BL, GL, RL, WL, and CO2, using the NEBNext Ultra RNA Library Prep Kit for Illumina (New England Biolabs, UK) following the manufacturer’s protocol. Then, the mRNA was purified from total RNA using poly-T oligo-attached magnetic beads and sheared into short fragments of about 200 bp length. The first-strand cDNAs were synthesized from the cleaved short RNA fragments using random hexamer-primers (NEB, UK) and reverse transcriptase (NEB, UK). The second strand cDNAs were synthesized using DNA polymerase I (NEB, UK) and RNase-H (NEB, UK). The purified double-stranded cDNA was subjected to end repair and NEBNext adaptor ligation. Then, the resulting libraries were loaded onto a single lane of the flow cell and sequenced for 209 cycles on the Illumina HiSeq 2000 platform (Illumina, San Diego, CA, USA) at the Malaysian Genomics Resource Centre. The high-quality reads were deposited in the NCBI SRA.

4.5. Quality Control and De Novo Transcriptome Assembly

Sequencing reads from the Illumina sequencer were exported in FASTQ format with the corresponding Phred quality scores. The quality of the sequencing raw reads was first evaluated with FastQC v0.11.2 (www.bioinformatics.babraham.ac.uk/projects/fastqc, accessed on 28 April 2021) and then filtered with Trimmomatic [93] before assembly by (i) removing the sequencing adaptor sequences, (ii) filtering the reads containing ambiguous nucleotides, and (iii) removing the reads having more than 10% bases below Q20 sequencing quality. The obtained filtered reads were subjected to transcriptome de novo assembly using Trinity software version 2.2.0 [94]. Briefly, the reads were assembled using Inchworm Program by searching for paths in a 25 bp k-mer graph and resulted in a collection of linear contigs. Next, the reads were clustered using the Chrysalis Program with a certain length of overlap, and then, a de Bruijn graph was constructed for each cluster. Finally, the Butterfly Program was used to reconstruct plausible full-length, linear transcripts by reconciling the individual de Bruijn graphs generated by Chrysalis. After generating the final assembly, the redundant sequences were removed using the TIGR Gene Indices clustering tools software [95].

4.6. Transcriptome Analysis

The assembled sequences were evaluated for similarity by using the Basic Local Alignment Search Tool (BLAST) translated nucleotide query to protein database (blastx) against the UniProt protein database [96] and Kyoto Encyclopaedia of Genes and Genomes (KEGG) database [97,98], respectively, and the cutoff was set at 10−5 E-value. Then, the sequences were functionally annotated using the Blast2GO [99] software to obtain Gene Ontology (GO) annotation before further classifying using the WEGO (Web Gene Ontology Annotation Plot) software [100].

4.7. Identification of DEGs

The RNA-Seq by Expectation-Maximization (RSEM) software version 1.2.11 was used to estimate transcripts abundance [101], and the empirical analysis of digital gene expression in R (edgeR) software version 3.8.6 in the Bioconductor package was used to determine differential gene expression between the two groups [102]. The reads were normalized using the TMM (trimmed mean of M)-values method [103]. To analyze differential expression, the transcripts with an adjusted p-value < 1 × 10⁻³ and log2 fold change ≥ 2 were extracted and clustered according to their patterns of differential expression across the sample. All the DEGs were mapped to the terms in the KEGG database and searched for significantly enriched KEGG pathways in comparison to the whole transcriptome background.

4.8. Quantitative Real-Time PCR Analysis

The cDNA was synthesized with the QuantiTect Reverse Transcription kit (QIAGEN, Germany). The 18S rDNA gene (GenBank accession number U25437) was chosen as an internal control for the normalization of real-time PCR data. Primers for amplification of targeted genes, i.e., light-harvesting complex A (LHCA), Von Willebrand factor type A (VWA), phosphoserine aminotransferase (PSAT) genes, and the 18S rDNA gene (Table 3) were designed using Primer3 software [104] aiming for amplicon lengths of 80–200 bp, a GC content of 40–60%, a primer length of 18–30 bp, and a primer melting temperature of 60–65 °C. Primers were assessed for melting temperature, and the formation of hairpins and primer dimers using the web-based tool Beacon Designer (http://free.premierbiosoft.com, accessed on 28 April 2021). Real-time quantitative PCR was performed in a 20 µL reaction volume containing QuantiNova SYBR green master mix (QIAGEN, Germany) on the Eco Real-Time PCR System (Illumina), and the cycling conditions were 95 °C for 2 min, 40 cycles at 95 °C for 5 s, and 60 °C for 10 s. The PCR reactions, together with negative control, were carried out in triplicates, and data were analyzed using the 2−ΔΔCT method [105].

Author Contributions

Conceptualization, K.F.R. and W.T.L.Y.; Methodology, V.Y.T., K.F.R. and C.M.V.L.W.; Software, V.Y.T. and C.L.Y.V.; Validation, V.Y.T., K.F.R. and W.T.L.Y.; Formal Analysis, V.Y.T., K.F.R. and C.M.V.L.W.; Investigation, V.Y.T., K.F.R. and C.L.Y.V.; Resources, K.F.R. and W.T.L.Y.; Data Curation, V.Y.T., K.F.R. and C.L.Y.V.; Writing—Original Draft Preparation, V.Y.T. and K.F.R.; Writing—Review and Editing, C.M.V.L.W. and W.T.L.Y.; Visualization, V.Y.T., K.F.R. and C.L.Y.V.; Supervision, K.F.R. and C.M.V.L.W.; Project Administration, K.F.R. and W.T.L.Y.; Funding Acquisition, K.F.R. and W.T.L.Y. All authors have read and agreed to the published version of the manuscript.

Funding

This research was funded by the Malaysian Ministry of Higher Education under a Fundamental Research Grant Scheme FRG0361-SG-2/2013 “Transcriptomic and carrageenan analyses of micropropagated Kappaphycus and Eucheuma seaweeds under different light regimes and carbon dioxide concentrations”.

Institutional Review Board Statement

Not Applicable.

Informed Consent Statement

Not Applicable.

Data Availability Statement

The high-quality reads were deposited in the National Center for biotechnology Information (NCBI) Sequence Read Archive (SRA). The raw sequenced read was deposited at the NCBI SRA database with the accession number of SRR2757332 (GL), SRR2757333 (BL), SRR2757334 (CO2-treated), SRR2757335 (WL) and SRR2757337 (RL). The deposited data can be accessed at [https://www.ncbi.nlm.nih.gov/sra/SRX1360503[accn], accessed on 28 April 2021.

Acknowledgments

We thank the Malaysian Ministry of Higher Education for funding, and the Universiti Malaysia Sabah for providing administrative and technical support.

Conflicts of Interest

The authors declare no conflict of interest.

References

  1. Bindu, M.S.; Levine, I.A. The commercial red seaweed Kappaphycus alvarezii—An overview on farming and environment. J. Appl. Phycol. 2011, 23, 789–796. [Google Scholar] [CrossRef]
  2. Eggertsen, M.; Halling, C. Knowledge gaps and management recommendations for future paths of sustainable seaweed farming in the Western Indian Ocean. Ambio 2020, in press. [Google Scholar] [CrossRef] [Green Version]
  3. Dring, M.J. Chromatic adaptation of photosynthesis in benthic marine algae: An examination of its ecological significance using a theoretical model. Limnol. Oceanogr. 1981, 26, 271–284. [Google Scholar] [CrossRef]
  4. Lobban, C.S.; Harrison, P.J. Seaweed Ecology and Physiology; Cambridge University Press: Cambridge, UK, 1994. [Google Scholar]
  5. Sagert, S.; Forster, R.M.; Feuerpfeil, P.; Schubert, H. Daily course of photosynthesis and photoinhibition in Chondrus crispus (Rhodophyta) from different shore levels. Eur. J. Phycol. 1997, 32, 363–371. [Google Scholar] [CrossRef] [Green Version]
  6. Deng, Y.; Yao, J.; Wang, X.; Guo, H.; Duan, D. Transcriptome sequencing and comparative analysis of Saccharina japonica (Laminariales, Phaeophyceae) under blue light induction. PLoS ONE 2017, 7, e39704. [Google Scholar] [CrossRef]
  7. Wang, W.J.; Wang, F.J.; Sun, X.T.; Liu, F.L.; Liang, Z.R. Comparison of transcriptome under red and blue light culture of Saccharina japonica (Phaeophyceae). Planta 2013, 237, 1123–1133. [Google Scholar] [CrossRef]
  8. Wu, S.; Sun, J.; Chi, S.; Wang, L.; Wang, X.; Liu, C.; Li, X.; Yin, J.; Liu, T.; Yu, J. Transcriptome sequencing of essential marine brown and red algal species in China and its significance in algal biology and phylogeny. Acta Oceanol. Sin. 2014, 33, 1–12. [Google Scholar] [CrossRef]
  9. Song, L.; Wu, S.; Sun, J.; Wang, L.; Liu, T.; Chi, S.; Liu, C.; Li, X.; Yin, J.; Wang, X.; et al. De novo sequencing and comparative analysis of three red algal species of Family Solieriaceae to discover putative genes associated with carrageenan biosynthesis. Acta Oceanol. Sin. 2014, 33, 45–53. [Google Scholar] [CrossRef]
  10. Zhang, Z.; Pang, T.; Li, Q.; Zhang, L.; Li, L.; Liu, J. Transcriptome sequencing and characterization for Kappaphycus alvarezii. Eur. J. Phycol. 2015, 50, 400–407. [Google Scholar] [CrossRef] [Green Version]
  11. Li, Q.; Zhang, L.; Pang, T.; Liu, J. Comparative transcriptome profiling of Kappaphycus alvarezii (Rhodophyta, Gigartinales) in response to two extreme temperature treatments: An RNA-seq-based resource for photosynthesis research. Eur. J. Phycol. 2019, 54, 162–174. [Google Scholar] [CrossRef]
  12. Gowik, U.; Westhoff, P. The path from C3 to C4 photosynthesis. Plant Physiol. 2011, 155, 56–63. [Google Scholar] [CrossRef] [Green Version]
  13. Robinson, S.J.; Parkin, I.A.P. Differential SAGE analysis in Arabidopsis uncovers increased transcriptome complexity in response to low temperature. BMC Genom. 2008, 9, 434. [Google Scholar] [CrossRef] [Green Version]
  14. Ehleringer, J.R.; Cerling, T.E.; Helliker, B.R. C4 photosynthesis, atmospheric CO2, and climate. Oecologia 1997, 112, 285–299. [Google Scholar] [CrossRef] [PubMed]
  15. Yamori, W.; Hikosaka, K.; Way, D.A. Temperature response of photosynthesis in C3, C4, and CAM plants: Temperature acclimation and temperature adaptation. Photosynth. Res. 2014, 119, 101–117. [Google Scholar] [CrossRef]
  16. Beer, S.; Israel, A. Photosynthesis of Ulva sp. III. O2 effects, carboxylase activities, and the CO2 incorporation pattern . Plant Physiol. 1986, 81, 937–938. [Google Scholar] [CrossRef] [Green Version]
  17. Bidwell, R.G.S.; McLachlan, J. Carbon nutrition of seaweeds: Photosynthesis, photorespiration and respiration. J. Exp. Mar. Biol. Ecol. 1985, 86, 15–46. [Google Scholar] [CrossRef]
  18. Levchenko, E.V. Carbon metabolism transitions during the development of marine macroalga Gracilaria verrucose. Russ. J. Plant Physiol. 2003, 50, 68–72. [Google Scholar] [CrossRef]
  19. Derelle, E.; Ferraz, C.; Rombauts, S.; Rouzé, P.; Worden, A.Z.; Robbens, S.; Partensky, F.; Degroeve, S.; Echeynié, S.; Cooke, R.; et al. Genome analysis of the smallest free-living eukaryote Ostreococcus tauri   unveils many unique features . Proc. Natl. Acad. Sci. USA 2006, 103, 11647–11652. [Google Scholar] [CrossRef] [PubMed] [Green Version]
  20. Leliaert, F.; Smith, D.R.; Moreau, H.; Herron, M.D.; Verbruggen, H.; Delwiche, C.F.; De Clerck, O. Phylogeny and molecular evolution of the green algae. Crit. Rev. Plant Sci. 2012, 31, 1–46. [Google Scholar] [CrossRef] [Green Version]
  21. Keeley, J.E. Photosynthetic pathway diversity in a seasonal pool community. Funct. Ecol. 1999, 13, 106–118. [Google Scholar] [CrossRef]
  22. Xu, J.; Fan, X.; Zhang, X.; Xu, D.; Mou, S.; Cao, S.; Zheng, Z.; Miao, J.; Ye, N. Evidence of coexistence of C3 and C4 photosynthetic pathways in green-tide-forming alga, Ulva prolifera. PLoS ONE 2012, 7, e37438. [Google Scholar] [CrossRef]
  23. Figueroa, F.L.; Israel, A.; Neori, A.; Martínez, B.; Malta, E.J.; Put, A.; Inken, S.; Marquardt, R.; Abdala, R.; Korbee, N. Effect of nutrient supply on photosynthesis and pigmentation to short-term stress (UV radiation) in Gracilaria conferta (Rhodophyta). Mar. Pollut. Bull. 2010, 60, 1768–1778. [Google Scholar] [CrossRef] [PubMed]
  24. Mercado, J.M.; Javier, F.; Gordillo, L.; Niell, F.X.; Figueroa, F.L. Effects of different levels of CO2 on photosynthesis and cell components of the red alga Porphyra leucosticta. J. Appl. Phycol. 1999, 11, 455–461. [Google Scholar] [CrossRef]
  25. Nejrup, L.B.; Staehr, P.A.; Thomsen, M.S. Temperature- and light-dependent growth and metabolism of the invasive red algae Gracilaria vermiculophylla–a comparison with two native macroalgae. Eur. J. Phycol. 2013, 48, 295–308. [Google Scholar] [CrossRef] [Green Version]
  26. Aguilera, J.; Gordillo, F.J.L.; Karsten, U.; Figueroa, F.L.; Niell, F.X. Light quality effect on photosynthesis and efficiency of carbon assimilation in the red alga Porphyra leucosticta. J. Plant Physiol. 2000, 157, 86–92. [Google Scholar] [CrossRef]
  27. Su, H.N.; Xie, B.B.; Zhang, X.Y.; Zhou, B.C.; Zhang, Y.Z. The supramolecular architecture, function, and regulation of thylakoid membranes in red algae: An overview. Photosynth. Res. 2010, 106, 73–87. [Google Scholar] [CrossRef]
  28. Zubia, M.; Freile-Pelegrín, Y.; Robledo, D. Photosynthesis, pigment composition and antioxidant defences in the red alga Gracilariopsis tenuifrons (Gracilariales, Rhodophyta) under environmental stress. J. Appl. Phycol. 2014, 26, 2001–2010. [Google Scholar] [CrossRef]
  29. Tandeau de Marsac, N. Phycobiliproteins and phycobilisomes: The early observations. Photosynth. Res. 2003, 76, 193–205. [Google Scholar] [CrossRef]
  30. Grossman, A.R.; Schaefer, M.R.; Chiang, G.G.; Collier, J.L. The phycobilisome, a light-harvesting complex responsive to environmental conditions. Microbiol. Rev. 1993, 57, 725–749. [Google Scholar] [CrossRef]
  31. Roleda, M.Y.; Hurd, C.L. Seaweed nutrient physiology: Application of concepts to aquaculture and bioremediation. Phycologia 2019, 58, 552–562. [Google Scholar] [CrossRef] [Green Version]
  32. Van der Loos, L.M.; Schmid, M.; Leal, P.P.; McGraw, C.M.; Britton, D.; Revill, A.T.; Virtue, P.; Nichols, P.D.; Hurd, C.L. Responses of macroalgae to CO2 enrichment cannot be inferred solely from their inorganic carbon uptake strategy. Ecol. Evol. 2019, 9, 125–140. [Google Scholar] [CrossRef] [Green Version]
  33. Zou, D.; Gao, K. Effects of elevated CO2 on the red seaweed Gracilaria lemaneiformis (Gigartinales, Rhodophyta) grown at different irradiance levels. Phycologia 2009, 48, 510–517. [Google Scholar] [CrossRef] [Green Version]
  34. Kaneko, T.; Tanaka, A.; Sato, S.; Kotani, H.; Sazuka, T.; Miyajima, N.; Sugiura, M.; Tabata, S. Sequence analysis of the genome of the unicellular cyanobacterium Synechocystis sp. strain PCC6803. I. Sequence features in the 1 Mb region from map positions 64% to 92% of the genome. DNA Res. 1995, 2, 153–166. [Google Scholar] [CrossRef] [Green Version]
  35. Stress tolerance in intertidal seaweeds. J. Phycol. 1996, 32, 197–211. [CrossRef]
  36. Jong, L.W.; Thien, V.Y.; Yong, Y.S.; Rodrigues, K.F.; Yong, W.T.L. Micropropagation and protein profile analysis by SDS-PAGE of Gracilaria changii (Rhodophyta, Solieriaceae). Aquacult. Rep. 2015, 1, 10–14. [Google Scholar] [CrossRef]
  37. Tee, M.Z.; Yong, Y.S.; Rodrigues, K.F.; Yong, W.T.L. Growth rate analysis and protein identification of Kappaphycus alvarezii (Rhodophyta, Gigartinales) under pH induced stress culture. Aquacult. Rep. 2015, 2, 112–116. [Google Scholar] [CrossRef] [Green Version]
  38. Collén, J.; Porcel, B.; Carré, W.; Ball, S.G.; Chaparro, C.; Tonon, T.; Barbeyron, T.; Michel, G.; Noel, B.; Valentin, K.; et al. Genome structure and metabolic features in the red seaweed Chondrus crispus shed light on evolution of the Archaeplastida. Proc. Natl. Acad. Sci. USA 2013, 110, 5247–5252. [Google Scholar] [CrossRef] [PubMed] [Green Version]
  39. Garcia-Jimenez, P.; Llorens, C.; Roig, F.J.; Robaina, R.R. Analysis of the transcriptome of the red seaweed Grateloupia imbricata with emphasis on reproductive potential. Mar. Drugs 2018, 16, 490. [Google Scholar] [CrossRef] [Green Version]
  40. Ho, C.L.; Lee, W.K.; Lim, E.L. Unraveling the nuclear and chloroplast genomes of an agar producing red macroalga, Gracilaria changii (Rhodophyta, Gracilariales). Genomics 2018, 110, 124–133. [Google Scholar] [CrossRef]
  41. Carney, L.T.; Lane, T.W. Parasites in algae mass culture. Front. Microbiol. 2014, 5, 278. [Google Scholar] [CrossRef] [Green Version]
  42. Solis, M.J.L.; Draeger, S.; dela Cruz, T.E.E. Marine-derived fungi from Kappaphycus alvarezii and K. striatum as potential causative agents of ice-ice disease in farmed seaweeds. Bot. Mar. 2010, 53, 587–594. [Google Scholar] [CrossRef]
  43. Gao, D.; Kong, F.; Sun, P.; Bi, G.; Mao, Y. Transcriptome-wide identification of optimal reference genes for expression analysis of Pyropia yezoensis responses to abiotic stress. BMC Genom. 2018, 19, 251. [Google Scholar] [CrossRef] [Green Version]
  44. Martins, P.K.; Mafra, V.; de Souza, W.R.; Ribeiro, A.P.; Vinecky, F.; Basso, M.F.; da Cunha, B.A.D.B.; Kobayashi, A.K.; Molinari, H.B.C. Selection of reliable reference genes for RT-qPCR analysis during developmental stages and abiotic stress in Setaria viridis. Sci. Rep. 2016, 6, 28348. [Google Scholar] [CrossRef] [Green Version]
  45. Wan, Q.; Chen, S.; Shan, Z.; Yang, Z.; Chen, L.; Zhang, C.; Yuan, S.; Hao, Q.; Zhang, X.; Qiu, D.; et al. Stability evaluation of reference genes for gene expression analysis by RT-qPCR in soybean under different conditions. PLoS ONE 2017, 12, e0189405. [Google Scholar] [CrossRef] [PubMed] [Green Version]
  46. Wu, X.; Huang, A.; Xu, M.; Wang, C.; Jia, Z.; Wang, G.; Niu, J. Variation of expression levels of seven housekeeping genes at different life-history stages in Porphyra yezoensis. PLoS ONE 2013, 8, e60740. [Google Scholar] [CrossRef] [PubMed] [Green Version]
  47. Li, B.; Chen, C.; Xu, Y.; Ji, D.; Xie, C. Validation of housekeeping genes as internal controls for studying the gene expression in Pyropia haitanensis (Bangiales, Rhodophyta) by quantitative real-time PCR. Acta Oceanol. Sin. 2014, 33, 152–159. [Google Scholar] [CrossRef]
  48. Jain, M.; Nijhawan, A.; Tyagi, A.K.; Khurana, J.P. Validation of housekeeping genes as internal control for studying gene expression in rice by quantitative real-time PCR. Biochem. Biophys. Res. Commun. 2006, 345, 646–651. [Google Scholar] [CrossRef] [PubMed]
  49. Shim, J.; Shim, E.; Kim, G.H.; Han, J.W.; Zuccarello, G.C. Keeping house: Evaluation of housekeeping genes for real-time PCR in the red alga, Bostrychia moritziana (Florideophyceae). Algae 2016, 31, 167–174. [Google Scholar] [CrossRef]
  50. Komine, Y.; Kwong, L.; Anguera, M.C.; Schuster, G.; Stern, D.B. Polyadenylation of three classes of chloroplast RNA in Chlamydomonas reinhardtii. RNA 2000, 6, 598–607. [Google Scholar] [CrossRef]
  51. Nishimura, Y.; Kikis, E.A.; Zimmer, S.L.; Komine, Y.; Stern, D.B. Antisense transcript and RNA processing alterations suppress instability of polyadenylated mRNA in Chlamydomonas chloroplasts. Plant Cell 2004, 16, 2849–2869. [Google Scholar] [CrossRef] [Green Version]
  52. Simpson, C.L.; Stern, D.B. The treasure trove of algal chloroplast genome. Surprises in architecture and gene content, and their functional implications. Plant Physiol. 2002, 129, 957–966. [Google Scholar] [CrossRef] [Green Version]
  53. Záhonová, K.; Hadariová, L.; Vacula, R.; Yurchenko, V.; Eliáš, M.; Krajčovič, J.; Vesteg, M. A small portion of plastid transcripts is polyadenylated in the flagellate Euglena gracilis. FEBS Lett. 2014, 588, 783–788. [Google Scholar] [CrossRef] [Green Version]
  54. Lisitsky, I.; Klaff, P.; Schuster, G. Addition of poly(A)-rich sequences to endonuclease cleavage sites during the degradation of chloroplast mRNA. Proc. Natl. Acad. Sci. USA 1996, 93, 13398–13403. [Google Scholar] [CrossRef] [PubMed] [Green Version]
  55. Schuster, G.; Lisitsky, I.; Klaff, P. Polyadenylation and degradation of mRNA in the chloroplast. Plant Physiol. 1999, 120, 937–944. [Google Scholar] [CrossRef] [Green Version]
  56. Shi, C.; Wang, S.; Xia, E.H.; Jiang, J.J.; Zeng, F.C.; Gao, L.Z. Full transcription of the chloroplast genome in photosynthetic eukaryotes. Sci. Rep. 2016, 6, 30135. [Google Scholar] [CrossRef]
  57. Gantt, E.; Grabowski, B.; Cunningham, F.X. Antenna systems of red algae: Phycobilisomes with photosystem II and chlorophyll complexes with photosystem. In Light-Harvesting Antennas in Photosynthesis, Advances in Photosynthesis and Respiration; Green, B.R., Parson, W.W., Eds.; Springer: Dordrecht, The Netherlands, 2003; Volume 13, pp. 307–322. [Google Scholar]
  58. Green, B.R.; Kühlbrandt, W. Sequence conservation of light-harvesting and stress-response proteins in relation to the three-dimensional molecular structure of LHCII. Photosynth. Res. 1995, 44, 139–148. [Google Scholar] [CrossRef]
  59. Tan, S.; Ducret, A.; Aebersold, R.; Gantt, E. Red algal LHC I genes have similarities with both Chl a/b- and a/c-binding proteins: A 21 kDa polypeptide encoded by LhcaR2 is one of the six LHC I polypeptides. Photosynth. Res. 1997, 53, 129–140. [Google Scholar] [CrossRef]
  60. Wolfe, G.R.; Cunningham, F.X.; Cunningham, F.X.; Durnford, D.; Green, B.R.; Gantt, E. Evidence for a common origin of chloroplasts with light-harvesting complexes of different pigmentation. Nature 1994, 367, 566–568. [Google Scholar] [CrossRef]
  61. Maxwell, D.P.; Laudenbach, D.E.; Huner, N.P.A. Redox regulation of light-harvesting complex II and cab mRNA abundance in Dunaliella salina. Plant Physiol. 1995, 109, 787–795. [Google Scholar] [CrossRef] [Green Version]
  62. Teramoto, H.; Nakamori, A.; Minagawa, J.; Ono, T. Light-intensity-dependent expression of Lhc gene family encoding light-harvesting chlorophyll-a/b proteins of photosystem II in Chlamydomonas reinhardtii. Plant Physiol. 2002, 130, 325–333. [Google Scholar] [CrossRef] [PubMed] [Green Version]
  63. Tonkyn, J.C.; Deng, X.W.; Gruissem, W. Regulation of plastid gene expression during photooxidative stress. Plant Physiol. 1992, 99, 1406–1415. [Google Scholar] [CrossRef]
  64. Dittami, S.M.; Scornet, D.; Petit, J.L.; Ségurens, B.; Da Silva, C.; Corre, E.; Dondrup, M.; Glatting, K.H.; König, R.; Sterck, L.; et al. Global expression analysis of the brown alga Ectocarpus siliculosus (Phaeophyceae) reveals large-scale reprogramming of the transcriptome in response to abiotic stress . Genome Biol. 2009, 10, R66. [Google Scholar] [CrossRef] [Green Version]
  65. Pearson, G.A.; Hoarau, G.; Lago-Leston, A.; Coyer, J.A.; Kube, M.; Reinhardt, R.; Henckel, K.; Serrão, E.T.A.; Corre, E.; Olsen, J.L. An expressed sequence tag analysis of the intertidal brown seaweeds Fucus serratus (L.) and F. vesiculosus (L.) (Heterokontophyta, Phaeophyceae) in response to abiotic stressors. Mar. Biotechnol. 2010, 12, 195–213. [Google Scholar] [CrossRef] [PubMed]
  66. Sturm, S.; Engelken, J.; Gruber, A.; Vugrinec, S.; Kroth, P.G.; Adamska, I.; Lavaud, J. A novel type of light-harvesting antenna protein of red algal origin in algae with secondary plastids. BMC Evol. Biol. 2013, 13, 159. [Google Scholar] [CrossRef] [Green Version]
  67. Blankenship, R.E. Molecular Mechanisms of Photosynthesis, 2nd ed.; Wiley-Blackwell: Hoboken, NJ, USA, 2014. [Google Scholar]
  68. Thien, V.Y.; Rodrigues, K.F.; Wong, C.M.V.L.; Yong, W.T.L. Investigation of growth rate and phycocolloid content from Kappaphycus alvarezii (Rhodophyta, Solieriaceae) under different light conditions using vibrational spectroscopy. J. Appl. Biotechnol. 2016, 4, 2. [Google Scholar] [CrossRef]
  69. Franklin, L.A.; Kräbs, G.; Kuhlenkamp, R. Blue light and UV-A radiation control the synthesis of mycosporine-like amino acids in Chondrus crispus (Florideophyceae). J. Phycol. 2002, 37, 257–270. [Google Scholar] [CrossRef] [Green Version]
  70. Godínez-Ortega, J.L.; Snoeijs, P.; Robledo, D.; Freile-Pelegrín, Y.; Pedersén, M. Growth and pigment composition in the red alga Halymenia floresii cultured under different light qualities. J. Appl. Phycol. 2008, 20, 253–260. [Google Scholar] [CrossRef]
  71. López-Figueroa, F.; Niell, F.X. Effects of light quality of chlorophyll and biliprotein accumulation in seaweeds. Mar. Biol. 1990, 104, 321–327. [Google Scholar] [CrossRef]
  72. Talarico, L.; Cortese, A. Response of Audouinella saviana   (Meneghini) Woelkerling (Nemaliales, Rhodophyta) cultures to monochromatic light . Hydrobiologia 1993, 260, 477–484. [Google Scholar] [CrossRef]
  73. Trapnell, C.; Roberts, A.; Goff, L.; Pertea, G.; Kim, D.; Kelley, D.R.; Pimentel, H.; Salzberg, S.L.; Rinn, J.L.; Pachter, L. Differential gene and transcript expression analysis of RNA-seq experiments with TopHat and Cufflinks. Nat. Protoc. 2012, 7, 562–578. [Google Scholar] [CrossRef] [Green Version]
  74. Cunningham, F.X., Jr.; Dennenberg, R.J.; Mustardy, L.; Jursinic, P.A.; Gantt, E. Stoichiometry of photosystem I, photosystem II, and phycobilisomes in the red alga Porphyridium cruentum as a function of growth irradiance. Plant Physiol. 1989, 91, 1179–1187. [Google Scholar] [CrossRef] [PubMed] [Green Version]
  75. Gantt, E. Pigmentation and photoacclimation. In Biology of the Red Algae; Cole, K.M., Sheath, R.G., Eds.; Cambridge University Press: Cambridge, UK, 1990; pp. 203–219. [Google Scholar]
  76. Ritz, M.; Thomas, J.C.; Spilar, A.; Etienne, A.L. Kinetics of photoacclimation in response to a shift to high light of the red alga Rhodella violacea adapted to low irradiance. Plant Physiol. 2000, 123, 1415–1426. [Google Scholar] [CrossRef] [PubMed] [Green Version]
  77. Zucchi, M.R.; Necchi, O., Jr. Effects of temperature, irradiance and photoperiod on growth and pigment content in some freshwater red algae in culture. Phycol. Res. 2001, 49, 103–114. [Google Scholar] [CrossRef]
  78. Frost-Christensen, H.; Sand-Jensen, K. The quantum efficiency of photosynthesis in macroalgae and submerged angiosperms. Ecologic 1992, 91, 377–384. [Google Scholar] [CrossRef] [PubMed]
  79. Danon, A.; Coll, N.S.; Apel, K. Cryptochrome-1-dependent execution of programmed cell death induced by singlet oxygen in Arabidopsis thaliana . Proc. Natl. Acad. Sci. USA 2006, 103, 17036–17041. [Google Scholar] [CrossRef] [Green Version]
  80. Lopez, L.; Carbone, F.; Bianco, L.; Giuliano, G.; Facella, P.; Perrotta, G. Tomato plants overexpressing cryptochrome 2 reveals altered expression of energy and stress-related gene products in response to diurnal cues. Plant Cell Environ. 2012, 35, 994–1012. [Google Scholar] [CrossRef] [PubMed]
  81. Folta, K.M.; Maruhnich, S.A. Green light: A signal to slow down or stop. J. Exp. Bot. 2007, 58, 3099–3111. [Google Scholar] [CrossRef] [PubMed]
  82. Karekar, M.D.; Joshi, G.V. Photosynthetic carbon metabolism in marine algae. Bot. Mar. 1973, 16, 216–220. [Google Scholar] [CrossRef]
  83. Xu, J.; Zhang, X.; Ye, N.; Zheng, Z.; Mou, S.; Dong, M.; Xu, D.; Miao, J. Activities of principal photosynthetic enzymes in green macroalga Ulva linza: Functional implication of C4 pathway in CO2 assimilation. Sci. China Life Sci. 2013, 56, 571–580. [Google Scholar] [CrossRef] [Green Version]
  84. Weber, A.P.M.; von Caemmerer, S. Plastid transport and metabolism of C3 and C4 plants–comparative analysis and possible biotechnological exploitation. Curr. Opin. Plant Biol. 2010, 13, 257–265. [Google Scholar] [CrossRef]
  85. Bowman, J.L. Stomata: Active portals for flourishing on land. Curr. Biol. 2011, 21, R540–R541. [Google Scholar] [CrossRef] [Green Version]
  86. Raven, J.A. Selection pressures on stomatal evolution. New Phytol. 2002, 153, 371–386. [Google Scholar] [CrossRef] [Green Version]
  87. Moroney, J.V.; Bartlett, S.G.; Samuelsson, G. Carbonic anhydrases in plants and algae. Plant Cell Environ. 2001, 24, 141–153. [Google Scholar] [CrossRef]
  88. He, L.; Zhang, X.; Wang, G. Expression analysis of phosphoenolpyruvate carboxykinase in Porphyra haitanensis (Rhodophyta) sporophytes and gametophytes. Physiol. Res. 2013, 61, 172–179. [Google Scholar] [CrossRef]
  89. Yong, W.T.L.; Ting, S.H.; Yong, Y.S.; Thien, V.Y.; Wong, S.H.; Chin, W.L.; Rodrigues, K.F.; Anton, A. Optimization of culture conditions for the direct regeneration of Kappaphycus alvarezii (Rhodophyta, Solieriaceae). J. Appl. Phycol. 2014, 26, 1597–1606. [Google Scholar] [CrossRef]
  90. Kang, E.J.; Kim, K.Y. Effects of future climate conditions on photosynthesis and biochemical component of Ulva pertusa (Chlorophyta). Algae 2016, 31, 49–59. [Google Scholar] [CrossRef]
  91. Kawaroe, M.; Bengen, D.G.; Barat, W.O.B. Utilization of carbon dioxide (CO2) for the optimization of the growth of seaweed kappaphycus alvarezii. Omni-Akuatika 2012, 6, 78–90. [Google Scholar]
  92. Kawaroe, M.; Sunuddin, A.; Augustine, D.; Lestari, D. The effect of CO2 injection on macroalgae Gelidium latifolium biomass growth rate and carbohydrate content. Ilmu Kelaut. 2016, 21, 85–92. [Google Scholar] [CrossRef] [Green Version]
  93. Bolger, A.M.; Lohse, M.; Usadel, B. Trimmomatic: A flexible trimmer for Illumina sequence data. Bioinformatics 2014, 30, 2114–2120. [Google Scholar] [CrossRef] [PubMed] [Green Version]
  94. Grabherr, M.G.; Haas, B.J.; Yassour, M.; Levin, J.Z.; Thompson, D.A.; Amit, I.; Adiconis, X.; Fan, L.; Raychowdhury, R.; Zeng, Q.; et al. Full-length transcriptome assembly from RNA-Seq data without a reference genome. Nat. Biotechnol. 2011, 29, 644–652. [Google Scholar] [CrossRef] [PubMed] [Green Version]
  95. Pertea, G.; Huang, X.; Liang, F.; Antonescu, V.; Sultana, R.; Karamycheva, S.; Lee, Y.; White, J.; Cheung, F.; Parvizi, B.; et al. TIGR Gene indices clustering tools (TGICL): A software system for fast clustering of large EST datasets. Bioinformatics 2003, 19, 651–652. [Google Scholar] [CrossRef] [Green Version]
  96. The UniProt Consortium. UniProt: A hub for protein information. Nucleic Acids Res. 2015, 43, D204–D212. [Google Scholar] [CrossRef]
  97. Kanehisa, M.; Goto, S. KEGG: Kyoto encyclopedia of genes and genomes. Nucleic Acids Res. 2000, 28, 27–30. [Google Scholar] [CrossRef]
  98. Kanehisa, M.; Araki, M.; Goto, S.; Hattori, M.; Hirakawa, M.; Itoh, M.; Katayama, T.; Kawashima, S.; Okuda, S.; Tokimatsu, T.; et al. KEGG for linking genomes to life and the environment. Nucleic Acids Res. 2008, 36, D480–D484. [Google Scholar] [CrossRef]
  99. Conesa, A.; Götz, S.; García-Gómez, J.M.; Terol, J.; Talón, M.; Robles, M. Blast2GO: A universal tool for annotation, visualisation and analysis in functional genomics research. Bioinformatics 2005, 21, 3674–3676. [Google Scholar] [CrossRef] [PubMed] [Green Version]
  100. Ye, J.; Fang, L.; Zheng, H.; Zhang, Y.; Chen, J.; Zhang, Z.; Wang, J.; Li, S.; Li, R.; Bolund, L.; et al. WEGO: A web tool for plotting GO annotations. Nucleic Acids Res. 2006, 34, W293–W297. [Google Scholar] [CrossRef] [PubMed]
  101. Li, B.; Dewey, C.N. RSEM: Accurate transcript quantification from RNA-Seq data with or without a reference genome. BMC Bioinformatics 2011, 12, 323. [Google Scholar] [CrossRef] [PubMed] [Green Version]
  102. Robinson, M.D.; McCarthy, D.J.; Smyth, G.K. edgeR: A Bioconductor package for differential expression analysis of digital gene expression data. Bioinformatics 2010, 26, 139–140. [Google Scholar] [CrossRef] [PubMed] [Green Version]
  103. Robinson, M.D.; Oshlack, A. A scaling normalisation method for differential expression analysis of RNA-seq data. Genome Biol. 2010, 11, R25. [Google Scholar] [CrossRef] [PubMed] [Green Version]
  104. Primer3. Available online: http://frodo.wi.mit.edu/primer3/ (accessed on 15 January 2019).
  105. Livak, K.J.; Schmittgen, T.D. Analysis of relative gene expression data using real-time quantitative PCR and the 2−ΔΔCT method. Methods 2001, 25, 402–408. [Google Scholar] [CrossRef]
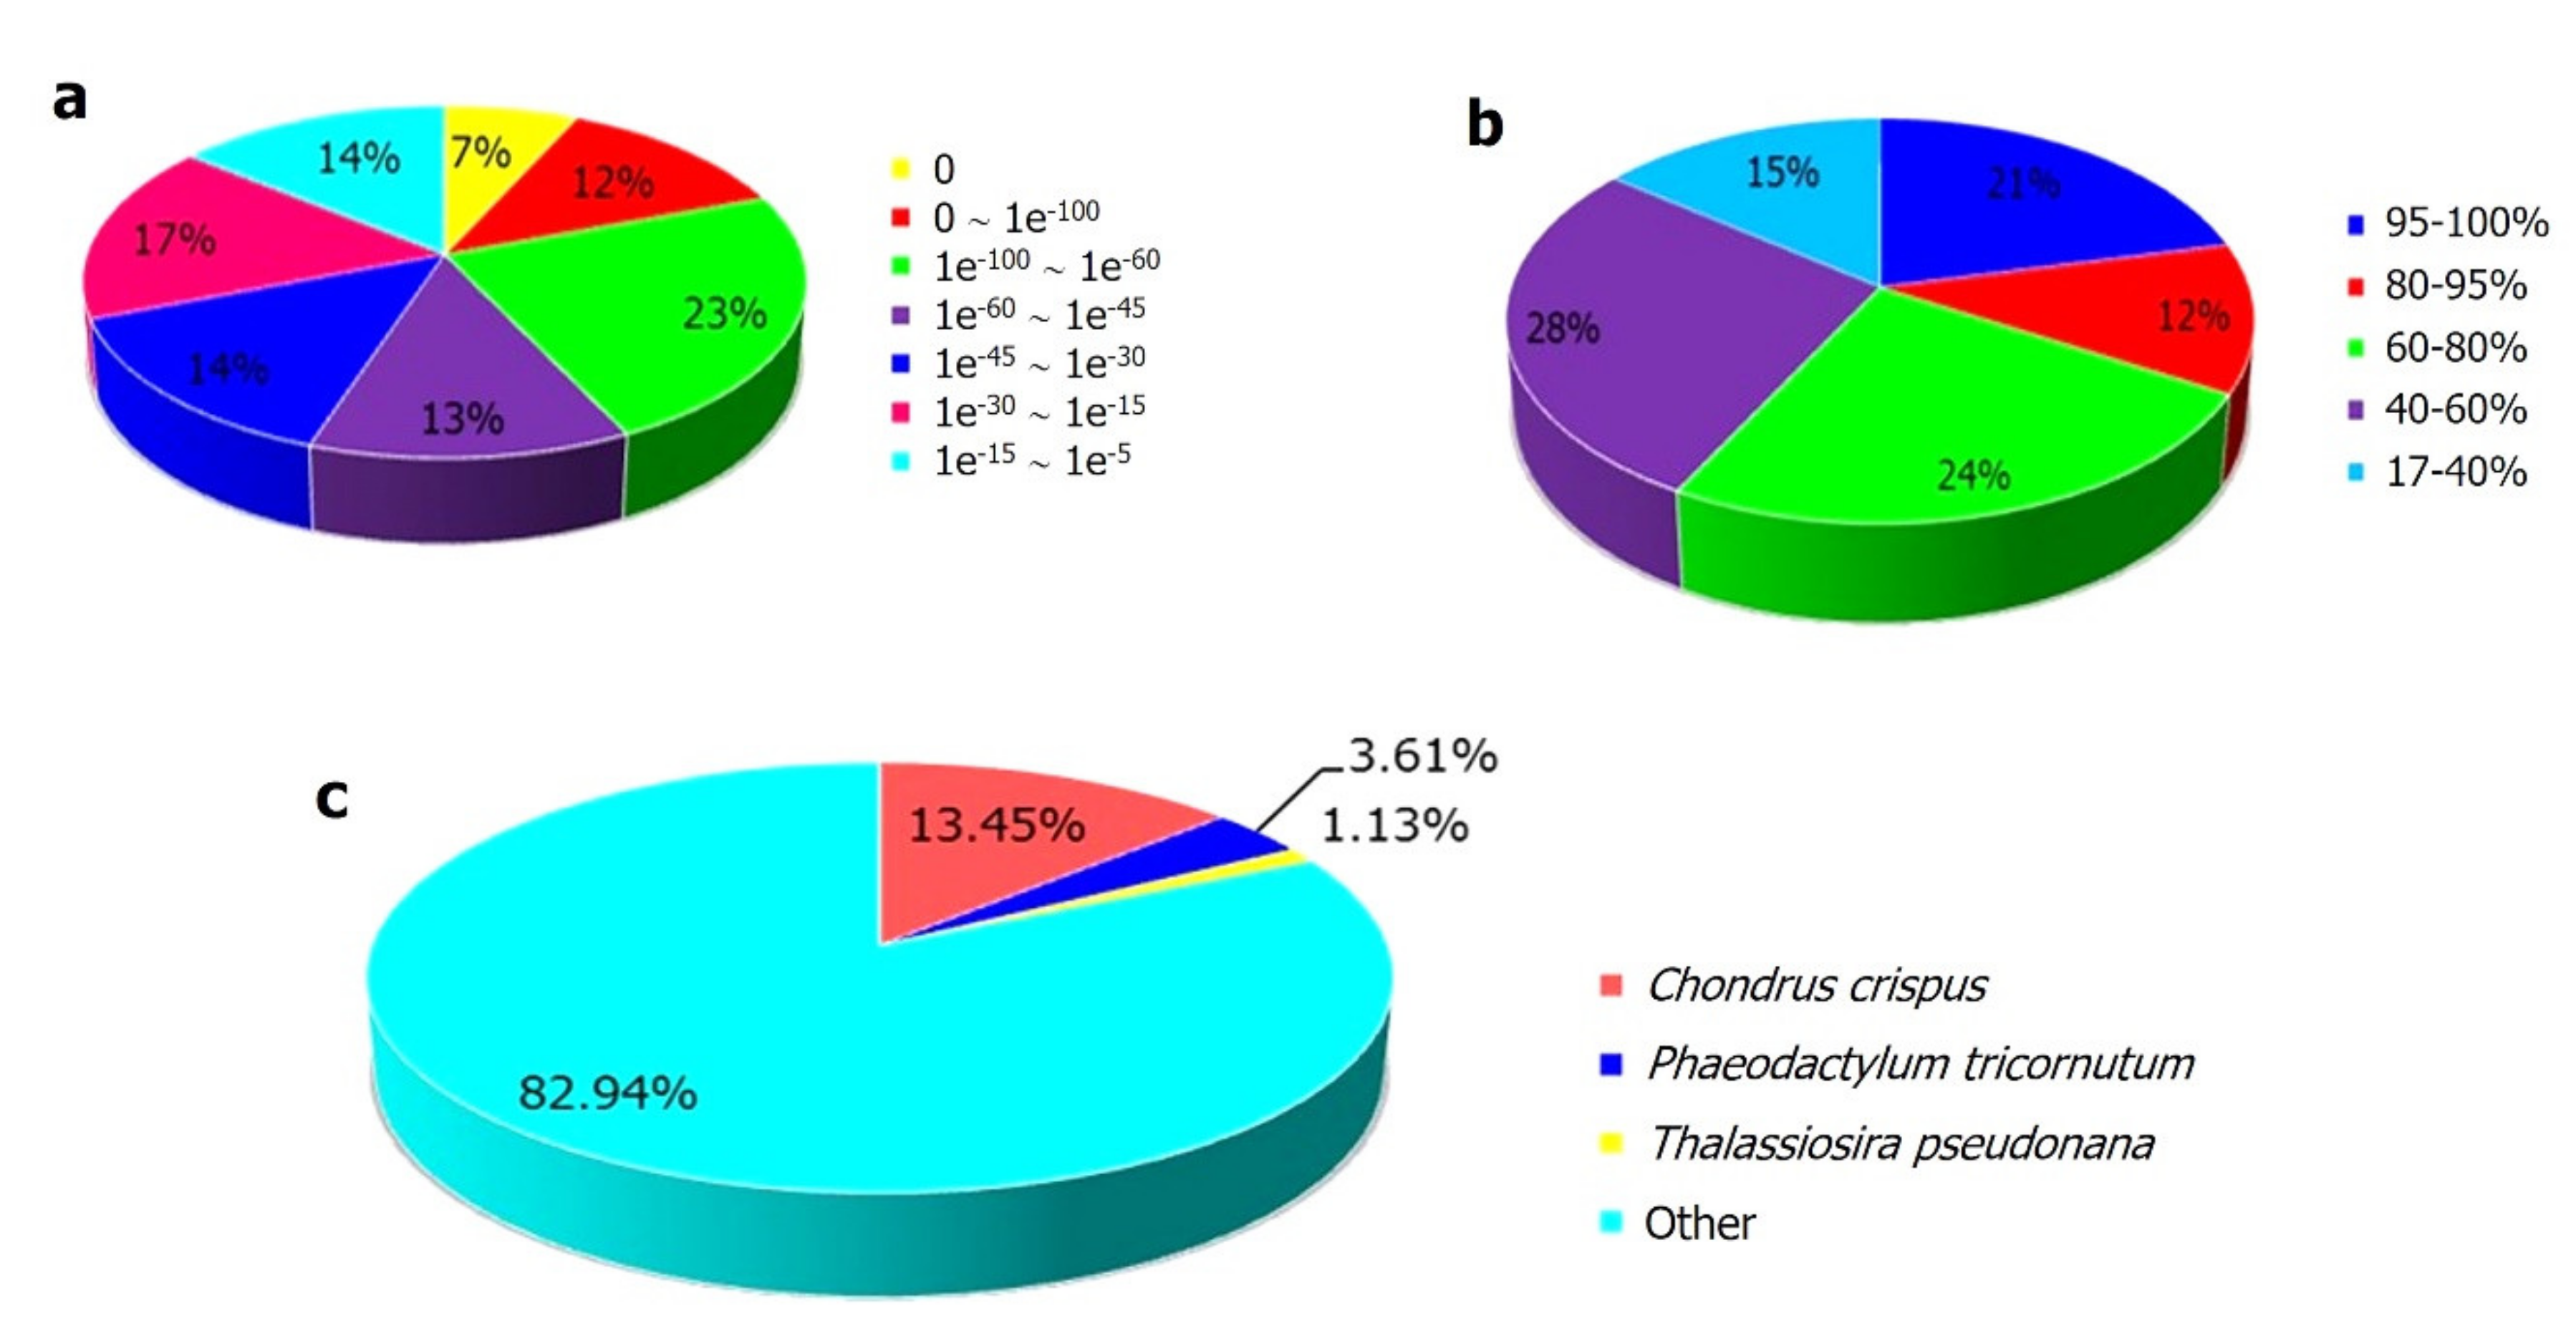
Figure 1. Functional annotation of the Kappaphycus alvarezii transcriptome. Characteristics of the similarity search of the assembled sequences against the Uniprot databases. (a) E-value distribution of BLAST hits for each unique sequence with E-value ≤ 10−5. (b) Similarity distribution of the top BLAST hits for each sequence. (c) Species distribution of total homologous sequences with E-value ≤ 10−5. The first hit of each sequence was used for statistical analysis.
Plants 10 01236 g001
Figure 2. Gene Ontology (GO) annotation of non-redundant transcripts of Kappaphycus alvarezii. All the transcripts were grouped into three major functional categories, as indicated.
Plants 10 01236 g002
Figure 3. Volcano plots of differentially expressed transcripts (red indicates upregulation and blue indicates downregulation) between (a) WL and BL, (b) WL and GL, (c) WL and RL, and (d) without and with CO2 enrichment, at an adjusted p-value < 1 × 10⁻¹⁰ and a log2 fold change ≥ 2. WL, white light; BL, blue light; GL, green light; RL, red light.
Plants 10 01236 g003
Figure 4. A comparison of differential gene expressions in Kappaphycus alvarezii by RNA-Seq and real-time PCR. LHCA, light-harvesting complexes; VWA, Von Willebrand factor type A; PSAT, phosphoserine aminotransferase; BL, blue light; GL, green light; RL, red light.
Plants 10 01236 g004
Figure 5. Total numbers of upregulated (red) and downregulated (blue) genes in Kappaphycus alvarezii between two treatments (with and without CO2 treatment and between different light treatments) with an adjusted p-value < 1 × 10⁻¹⁰ and a log2 fold change ≥ 2. BL, blue light; GL, green light; RL, red light.
Plants 10 01236 g005
Table 1. The top ten pathways identified in the Kappaphycus alvarezii transcriptome.
PathwayNumber of TranscriptsPathway ID
Metabolic pathways814Ko01100
Biosynthesis of secondary metabolites337Ko01110
Biosynthesis of amino acids131Ko01230
Carbon metabolism117Ko01200
Ribosome111Ko03010
Purine metabolism95Ko00230
Oxidative phosphorylation94Ko00190
Pyrimidine metabolism73Ko00240
RNA transport70Ko03013
Spliceosome65Ko03040
Table 2. Transcripts involved in inorganic carbon fixation that were identified in Kappaphycus alvarezii.
PathwayEnzymeNumber of Transcripts
C4-CCMCarbonic anhydrase (CA)23
Alpha-carbonic anhydrase (α-CA)2
Beta-carbonic anhydrase (β-CA)1
Gamma-carbonic anhydrase (γ-CA)3
Malate dehydrogenase (MDH)3
Malate dehydrogenase (MDH2)1
Malate dehydrogenase (oxaloacetate-decarboxylating) (NADP+)7
Aspartate aminotransferase, cytoplasmic (GOT1)3
Aspartate aminotransferase, mitochondrial (GOT2)3
Pyruvate orthophosphate dikinase (PPDK)5
Phosphoenolpyruvate carboxylase (PEPC)6
Phosphoenolpyruvate carboxykinase (PEPCK)1
C3Glyceraldehyde 3-phosphate dehydrogenase (GAPDH)10
Transketolase10
Phosphoribulokinase (PRK)1
Phosphoglycerate kinase (PGK)6
Sedoheptulose-bisphosphatase (SBPase)2
Ribulose-bisphosphate carboxylase large chain (rbcL)3
Fructose-bisphosphate aldolase, class I (ALDO)13
Fructose-bisphosphate aldolase, class II (FBA)6
Ribulose-phosphate 3-epimerase (rpe)6
Triosephosphate isomerase (TIM)6
Ribose 5-phosphate isomerase A (rpiA)2
Fructose-1,6-bisphosphatase I (FBP)6
Table 3. Selected genes and list of primers used for real-time PCR analysis.
Gene Name 1Forward Primer (5′-3′)Reverse Primer (3′-5′)Amplicon Length (bp)Annealing Temperature (°C)
LHCAGTGCAAACACGCGCACCAGAGATGGCAGCTCCCTTTCAACGCACAACAGCG13860
VWAAGACTGCGTTCCTATCACCGCCAGCCCGGCAGCAACATTGGGTCATCAGC14160
PSATATTCGGTCGAGAGTGCGTGCAAGGGACAGAGGCGCAGAAGAGAGGGTTGC19560
18SCTGCCTTCCTAGACGGACTGCGAGCGGATTTAGAGATTGG15960
1 LHCA, light-harvesting complexes; VWA, Von Willebrand factor type A; PSAT, phosphoserine aminotransferase; 18S, 18S rRNA gene for normalization.
Table 4. Analysis of differential expression at transcript level.
Condition 1 1Condition 2 1All transcripts (No Filters)Significant DEG (p-adj < 1 × 10⁻¹⁰ & log2 Fold Change of 2)
TotalUpregulation 2Downregulation 3TotalUpregulation 2Downregulation 3
WLBL40,47211,62128,85133528
WLGL49,18921,29327,89630426
WLRL40,34011,57028,77032032
WLCO241,83112,21129,6201387464
BLGL31,04220,00011,0421091
BLRL21,57110,33111,240301218
GLRL31,67311,42720,246592435
BLWL + GL + RL52,34240,45911,88314113
GLWL + BL + RL52,34230,86121,48133225307
RLWL + BL + GL52,34240,32312,019493118
WLBL + GL + RL52,34221,73030,6125824578
BL + GLRL + WL52,34229,64322,699220
BL + RLGL + WL52,34238,99913,343000
GL + RLBL + WL52,34231,09720,435000
1 WL, white light; BL, blue light; GL, green light; RL, red light. 2 Upregulation of condition 2 over condition 1. 3 Downregulation of condition 2 over condition 1.
Publisher’s Note: MDPI stays neutral with regard to jurisdictional claims in published maps and institutional affiliations.