Article

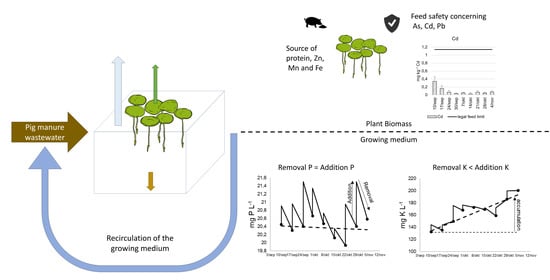
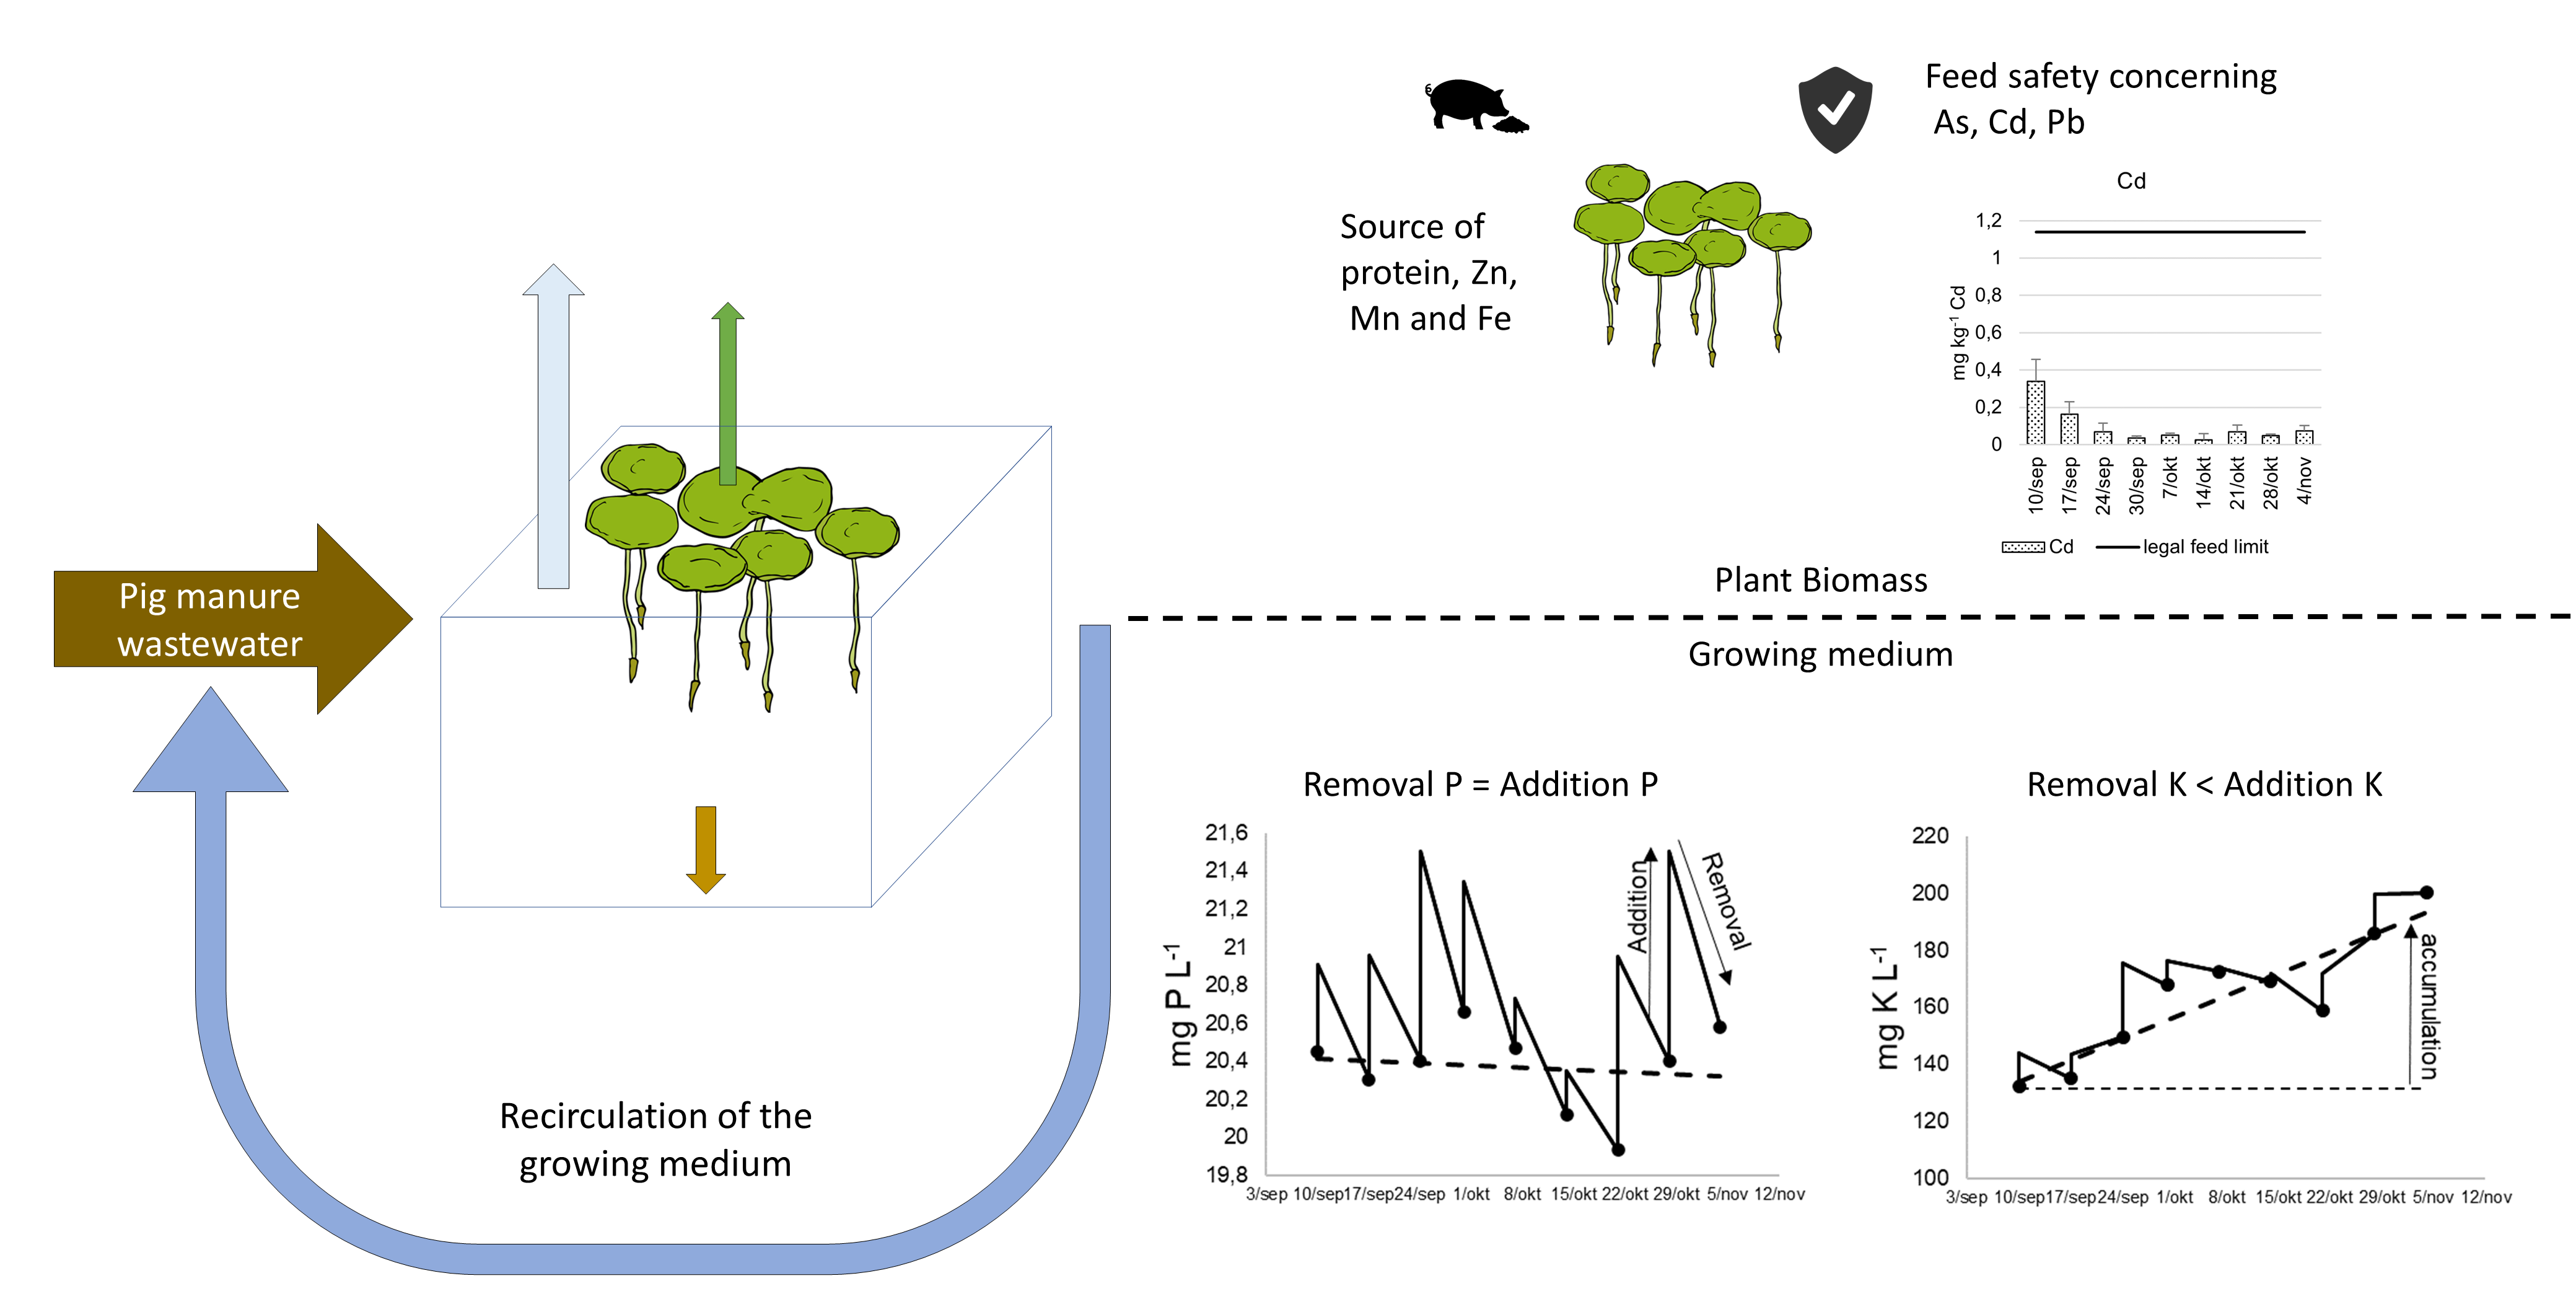
Lemna minor Cultivation for Treating Swine Manure and Providing Micronutrients for Animal Feed

1
Provincial Research and Advice Centre for Agriculture and Horticulture (Inagro vzw), Ieperseweg 87, 8800 Roeselare, Belgium
2
Department of Green Chemistry and Technology, Ghent University, Coupure Links 653, 9000 Ghent, Belgium
3
Department of Food Technology, Safety and Health, Ghent University, Valentin Vaerwyckweg 1, 9000 Ghent, Belgium
*
Author to whom correspondence should be addressed.
Plants 2021, 10(6), 1124; https://doi.org/10.3390/plants10061124
Submission received: 20 April 2021 / Revised: 18 May 2021 / Accepted: 27 May 2021 / Published: 1 June 2021
(This article belongs to the Special Issue Duckweed: Research Meets Applications)

Abstract

:
The potential of Lemna minor to valorise agricultural wastewater into a protein-rich feed component to meet the growing demand for animal feed protein and reduce the excess of nutrients in certain European regions was investigated. Three pilot-scale systems were monitored for nine weeks under outdoor conditions in Flanders. The systems were fed with a mixture of the liquid fraction and the biological effluent of a swine manure treatment system diluted with rainwater in order that the weekly N and P addition was equal to the N and P removal by the system. The design tested the accumulation of elements in a continuous recirculation system. Potassium, Cl, S, Ca, and Mg were abundantly available in the swine manure wastewaters and tended to accumulate, being a possible cause of concern for long-operating recirculation systems. The harvested duckweed was characterised for its mineral composition and protein content. In animal husbandry, trace elements are specifically added to animal feed as micronutrients and, thus, feedstuffs biofortified with essential trace elements can provide added value. Duckweed grown on the tested mixture of swine manure waste streams could be considered as a source of Mn, Zn, and Fe for swine feed, while it is not a source of Cu for swine feed. Moreover, it was observed that As, Cd, and Pb content were below the limits of the feed Directive 2002/32/EC in the duckweed grown on the tested medium. Overall, these results demonstrate that duckweed can effectively remove nutrients from agriculture wastewaters in a recirculated system while producing a feed source with a protein content of 35% DM.

Graphical Abstract

1. Introduction

The rising world population and the improving living standards have been driving the increase of animal-based food consumption [1]. Global livestock production has been estimated to expand by 21% between 2010 and 2025 [2]. In this context, proteins play a pivotal role in animal feed as a source of nitrogen and essential amino acids [3]. Crop production, land-use change, processing, and transport contribute to the overall greenhouse gas emission of livestock production [4]. Therefore, there is an urgent need to develop resource-efficient and innovative practices to locally produce protein-rich feed alternatives with high areal productivity.
On top of that, European pig production is characterised by its intensiveness, which results in a manure abundance in certain regions [5,6]. Hence, the treatment and nutrient recovery of these waste streams have an essential role in improving the sustainability of conventional agriculture.
Duckweed has been shown to grow on wastewaters and subsequently produce a protein-rich feed ingredient suitable for pig production, offering a possible solution for addressing both the protein scarcity and local nutrient abundancy [7,8,9,10]. These small floating macrophytes occur all over the world and are the most rapidly growing Angiosperms, following a quasi-exponential growth rate [11]. Doubling times of 1.34 to 4.54 days are reported in optimal conditions [12]; however, its productivity depends on the climatic variation, the length of the growing season, and the management of the system. The estimated production rate in Europe is between 7 and 22 tonnes dry weight (DW) ha−1 yr−1 [13]. Besides productivity, duckweed’s key advantage is its high crude protein content of around 35% [14], and up to 45% DW [13]. In contrast to several major cultivated protein or starch crops, the entire plant is edible because of the lack of support tissues [15].
Although many studies have been conducted on the use of duckweed for the treatment of pig manure wastewaters, there are still several knowledge gaps. Most research has been carried out with either one large-scale pilot or replicates on a laboratory scale [10]. Phytoremediation aspects tend to focus on N, P, and biological oxygen demand (BOD); nevertheless, other elements are also present in wastewaters, which might gradually increase or decrease over time in a recirculated system. A gradual increase over time is considered as an accumulation, while a gradual decrease is considered as a depletion. Accumulation over time off, for example, Cl might eventually reach harmful levels and, hence, decrease the duckweed growth and environmental performance [16].
Besides duckweed cultivation, the produced biomass should also be suitable for animal consumption, and in this assessment, the mineral composition is generally overlooked. For example, Cu and Zn are frequently added to swine feed for improving feed efficiency [17,18], but these elements are only 10–20% absorbed by the animals. As a result, swine excrements have high concentrations of Cu and Zn [17]. Also, heavy metals like As, Cd, and Pb could have diverse toxicological health effects, including carcinogenesis, decreased reproductive ability, and damages to the nervous, skeletal, circulatory, endocrine, and immune systems of animals and humans [19]. Hence, these metals are regulated by European law for food and feedstuffs (respectively EC No 1881/2006 and Directive 2002/32/EC) [20].
To address these open questions, a pilot recirculation system was set up in triplicate at outdoor conditions and fed with a mixture of swine manure effluents. The elemental characterisation of the recirculated water and the produced duckweed was monitored over nine weeks to uncover trends in a continuous growing system and gather adequate data to compare with the mineral composition standards of animal feed. The aim was to identify if the elements K, Cl, S, Ca, Mg, Mn, Fe, Cu, Zn, As, Pb, and Cd would accumulate within a recirculated duckweed system using biological effluent and the liquid fraction of the swine manure treatment as nutrient sources. A second objective was to evaluate several mineral components (Mn, Cu, Fe, Zn, As, Cd, and Pb) in the duckweed biomass for potential nutritional and harmful effects in potential feed application.

2. Materials and Methods

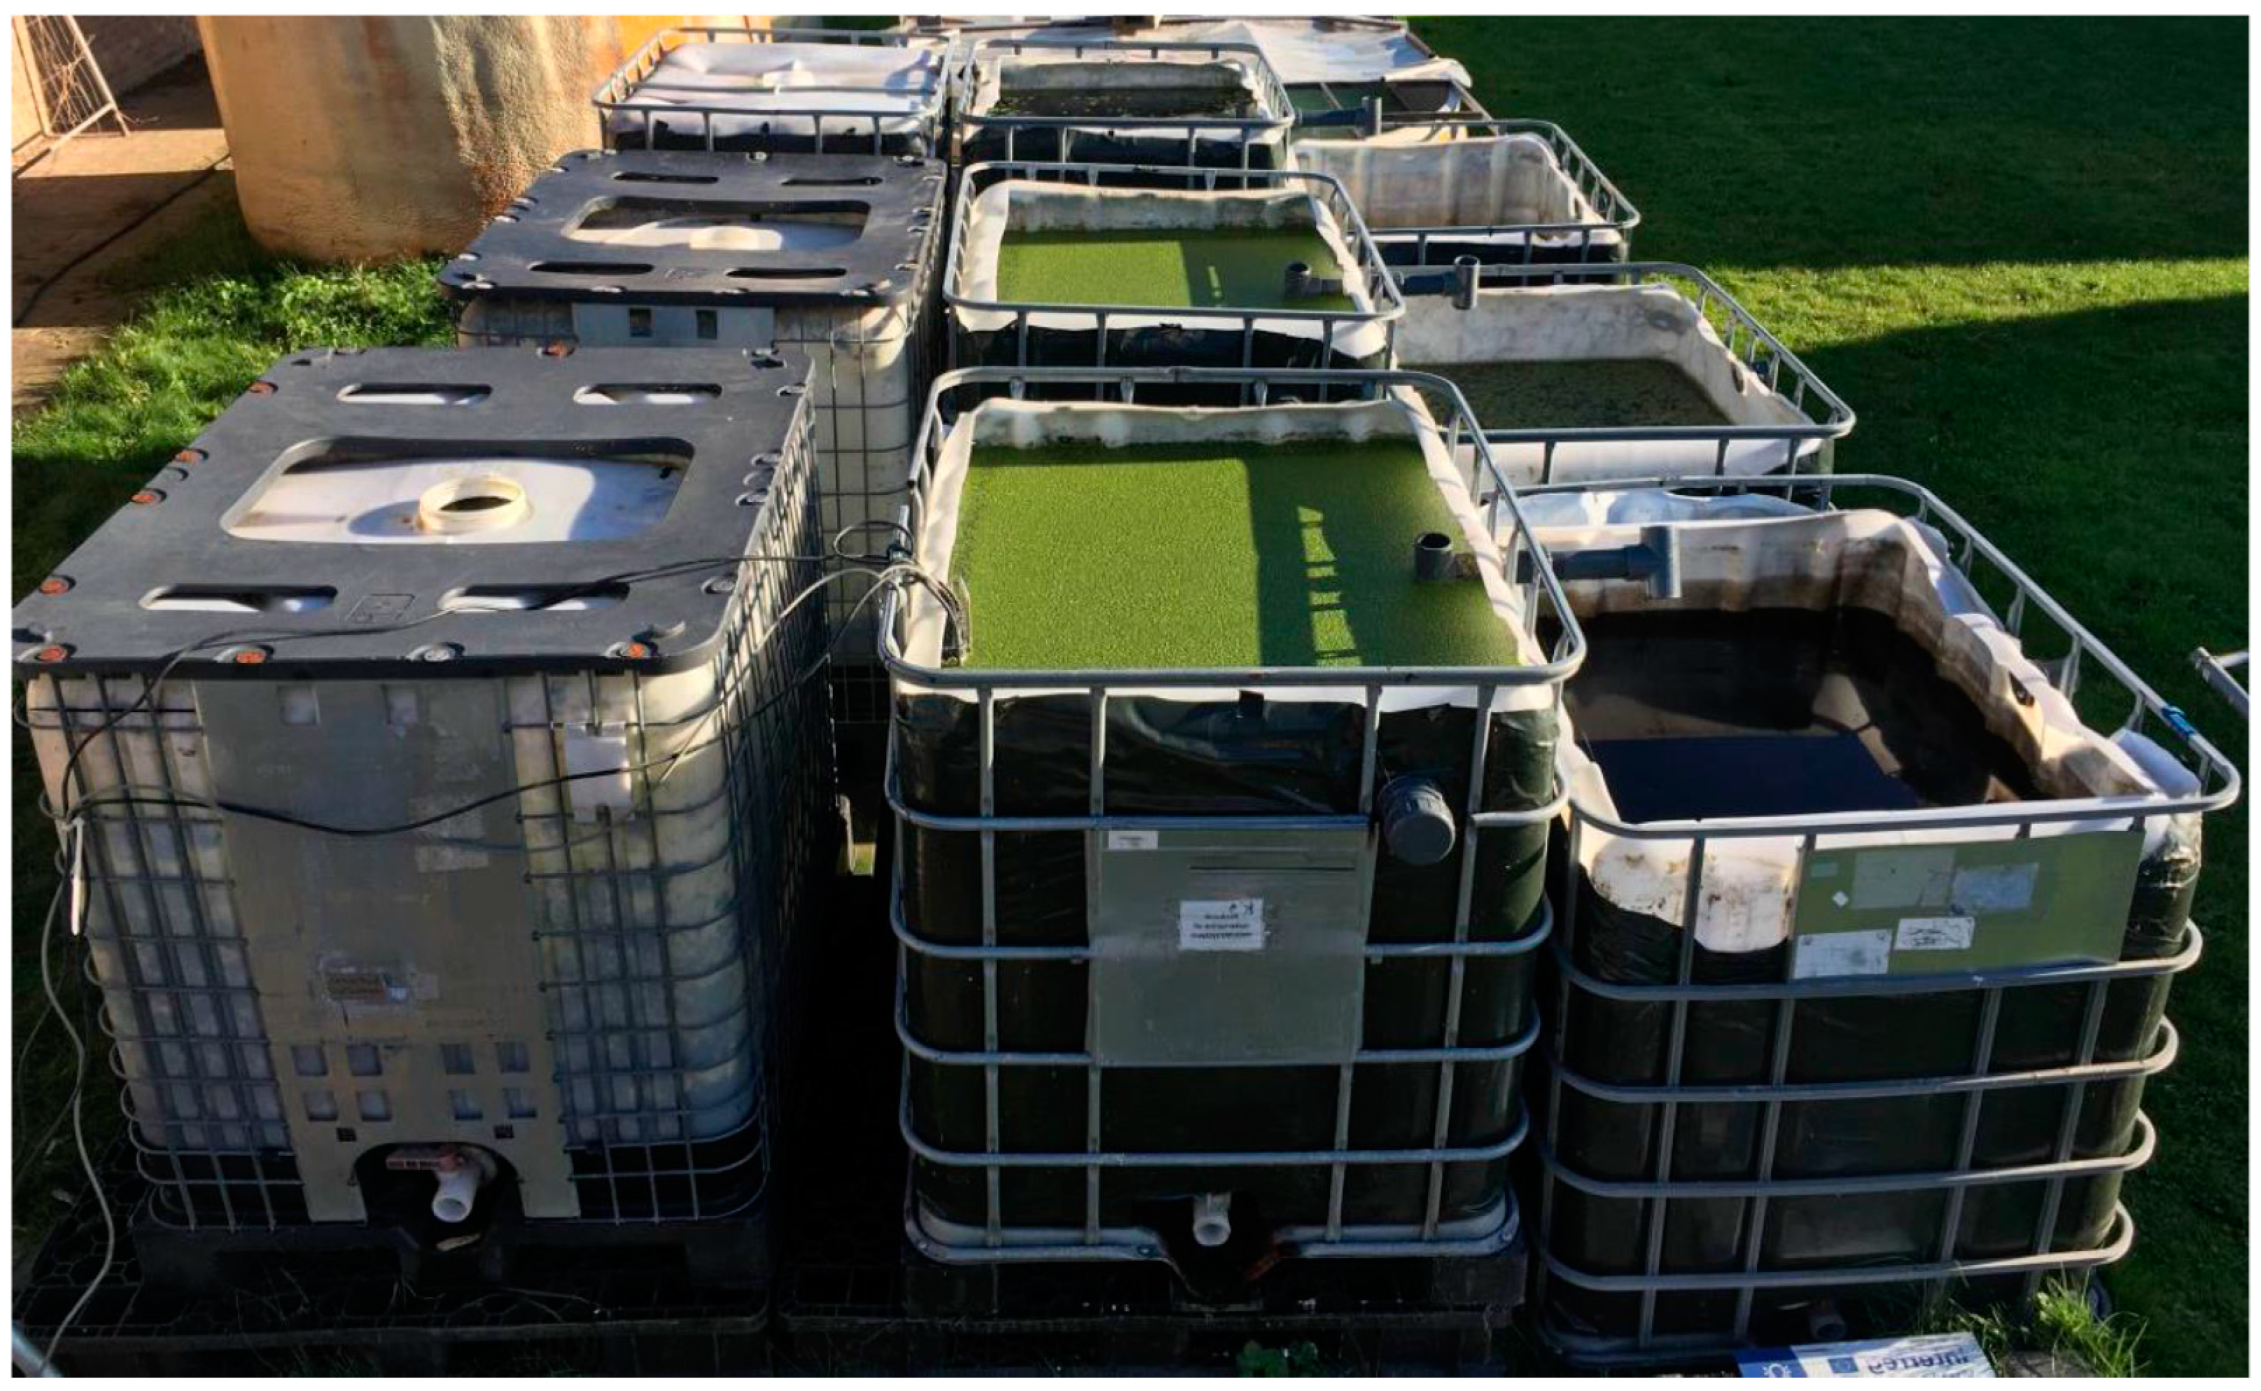
2.1. Experimental Set-Up

2.1.1. Pilot

The growth was performed in 1000 L cubicontainers (BE COMPOSITE IBC, Mauser, Brühl, Germany), of which an area of 0.9 × 1.1 m was cut from the top. The sidewalls were covered with a black plastic foil to exclude light interference, which could trigger algae activity in the containers. A mesh (vidalXL, The Netherlands) with a pore size of 1.17 × 1.57 mm was placed over the cubicontainer to prevent that the insect Cataclysta lemnata would interfere with the experiment. On 22 August 2019, a pilot-scale growing experiment was inoculated with 500 g FW of Lemna minor. The identification of the duckweed species was performed using molecular barcoding based on plastidic markers prior to the experiment [21].
The experiment was conducted outdoors, and daily meteorological data, i.e., air temperature (°C), solar irradiance (W m−2), daylength (h), precipitation (mm m−2), and relative humidity (%), were received from the Belgian Royal Meteorological Institute for the complete growing season (Table A1). The solar irradiance was converted to light intensity, which is expressed in µmol m−2 s−1, using a conversion factor of 4.6 [22].

2.1.2. Growing Medium

The starting medium was a mixture of rainwater, biological effluent (BE), and liquid fraction of pig manure (LF). These waste streams were sampled at the manure treatment facility of IVACO, Eernegem, Belgium. LF was obtained by separating the solid fraction from raw pig manure by centrifugation. This process reduces the P content in the LF [23]. Subsequently, the ammonia of the LF was nitrified and denitrified in separate tanks during the biological treatment, resulting in the BE stream with a reduced N content [23]. At Ivaco, the BE is partly further applied to arable land as a K-rich fertiliser, and partly treated to dischargeable water by a constructed wetland using reedbeds.
BE and LF were sampled on 22 August 2019. 600 L of BE was stored in a closed cubicontainer (BE COMPOSITE IBC, Mauser, Brühl, Germany), while 50 L of LF was stored in a closed 50-litre feed barrel (PV-50L-HA) during the experiment.
To determine the medium composition, a non-linear solver technique was performed using Microsoft Excel, and the results are given in Table 1. The aim was to maximise the LF composition within the following imposed constrictions:
  • the total mass of LF, BE, and RW equals 1000 kg, as this is the approximate limit of the cubicontainers,
  • all fractions of LF, BE, and RW are greater than zero,
  • the total N and total P content of the final mixture are below the limits proposed for Lemna minor [13],
  • the N/P ratio of the medium equals 3.0, as this is the ratio between the N removal and P removal determined in a duckweed system grown on diluted BE in outdoor systems [7].
Considering the concentrations of the three streams, data was gathered prior to the experiment as follows. First, it was assumed that rainwater (RW) would have a negligible N and P concentration. Furthermore, LF’s composition was extracted from a report on the valorisation of pig manure wastewaters in Flanders [24]. Finally, the concentration of the BE was extracted from an internal dataset containing T-N and T-P concentrations from the manure treatment facility that provided the LF and BE of this experiment. However, also samples were taken and frozen on the day of preparation and analysed afterwards to verify the theoretical composition.
First, the influent and cultivation cubicontainers were filled with the starting solution described in Table 1. During the growing period, the influent was transferred to the cultivation containers using a dosing pump (Etatron BT-MA/AD 50/3.0, Etatron, Italy) set at a debit of 800 L per week. Hence, via an overflow, the effluent container was filled (see Figure 1).
The aim was to achieve a weekly loading rate of N and P that equalled the removal rate from the system. This was found to be 1.1 g N m−2 d−1 and 0.37 g P m−2 d−1 in duckweed cultivation systems on pig manure waste streams in Flanders [7]. Based on the concentrations mentioned in Table 1, BE and LF were added to the system in a ratio that allowed the added N and P to equal the removed. This resulted in the addition of 1 kg and 10 kg of respectively LF and BE. Furthermore, the influent cubicontainer was filled with the system effluent, achieving a recirculating system.
During the process, the volume of each cubicontainer was determined by measuring the height of the water table. In this way, the mass flows throughout the system could be determined without neglecting the effect of evaporation and precipitation on the medium concentrations.

2.1.3. Sampling

Each week, duckweed was harvested and drip-dried for 5 min before weighing. Subsequently, 500 g of the harvested biomass was inoculated back in the cultivation cubicontainers, while the rest was oven-dried for three days at 60 °C to determine a representative DW percentage (DW%). This fully dried duckweed was used for dry weight, protein, and heavy metal determination. Furthermore, a water sample of 1 L was taken from each container and directly stored and −18 °C. For the influent, this was performed after filling the cubicontainer with the affluent, BE and LF. For the affluent, this was done prior to the addition of BE and LF.

2.2. Plant Analysis

For the determination of the mineral composition (P, S, Ca, Mg, Na, K, Cu, Fe, Zn, As, Cd and Pb), an inductively coupled plasma optical emission spectrometry (ICP-OES, VISTA-MPX, Agilent Technologies, Santa Clara, CA, USA) was performed on the destructed plant samples. The dried plant samples were first homogenised using a Retch ZM-200 plant mill (Düsseldorf, Germany) with a 0.5 mm sieve. Subsequently, 0.25 g was weighted to digestion tubes containing Aqua regia (7.5 mL HCl with 2.5 mL HNO3) and 50 µL of a pure gold (Au) solution of 1000 mg L−1. Closed-vessel microwave destruction (MARS6, CEM, Matthews, NC, USA) was performed on these samples. Afterwards, the samples were diluted to 50 mL using Milli Q® (Merck, Belgium).
Kjeldahl nitrogen (Kj-N) was measured according to Van Ranst et al., (1999) [25], without the addition of a reduction agent, using a distiller (Büchi auto Kjeldahl Unit K-370, Büchi, Switzerland), destructor (Büchi digest automat K438, Büchi, Switzerland), sampler (Büchi Kjeldahl sampler type K-371, Büchi, Switzerland) and scrubber (Büchi scrubber B414, Büchi, Switzerland). This method measures organic and ammonium nitrogen. Additionally, Kj-N content was used to calculate the protein content by multiplying it with the factor 6.25 [26].
The total N content (T-N) was determined according to the procedure of Dumas using a CNS analyser (Primacs SNC-100, Skalar, The Netherlands), as described in the guideline NEN- EN16168:2012 presented by the Royal Dutch Normalisation Institute (NEN). In this method, 200 mg of dried plant material is combusted, and the produced N2 is measured with a thermal conductivity sensor. As all nitrogen forms are combusted, this analysis gives the sum of organic, nitrate, nitrite, and ammonium nitrogen. With the T-N content, the N removal of the plant was calculated.

2.3. Medium Analysis

For water analysis, an open vessel microwave destruction using a MARS6 (CEM, Matthews, NC, USA) was performed. A centrifuge tube was filled with 5 mL of the sample, 3 mL of 65% HNO3 (Chem-Lab, Belgium), and 3 mL of 30% H2O2 (Chem-lab, Belgium). For an optimal release, 50 µL of a 1000 mg L−1 Au solution was added. The mixture was subsequently destructed by a stepwise gradual increase of temperature to 100 °C. This temperature was held for 30 min before cooling to room temperature. Afterwards, the digested sample was diluted to 25 mL using Milli Q® (Merck, Belgium). Subsequently, inductively coupled plasma optical emission spectrometry (ICP-OES, VISTA-MPX, Agilent Technologies, Santa Clara, CA, USA) was performed on the destructed samples for analysing P, S, Ca, Mg, Na, K, Cu, Fe, Zn, As, Cd, and Pb.
Chloride, NO3, PO42−, and SO42− were determined by liquid ion chromatography (850 Professional IC anion, Metrohm, Antwerpen, Belgium) in a 150 mm column (Metrosep A SUPP 5-150/4.0, Metrohm, Antwerpen, Belgium), following the ISO 10304-1:2007 method.
Total N content (T-N) was determined according to the procedure of Dumas using a CNS analyser (Primacs SNC-100, Skalar, Breda, The Netherlands).
Finally, pH and electric conductivity (EC) was measured with a pH-meter (ProfiLine pH 3110, WTW, Weilheim, Germany) and a conductivity tester, respectively (ProfiLine Cond 3110, WTW, Weilheim, Germany).

2.4. Calculations

First, biomass productivity or the linear growth rate (LGR) was calculated as follows [27]:
LGR   = ( DW % end FW end DW % start FW start ) time surface   [ g   m 2   d 1 ]
Moreover, the N and P uptake by the plant and protein productivity were calculated by replacing the dry weight percentage (DW%) by, respectively, the T-N, T-P, and protein content and by replacing the fresh weight (FW) with the dry weight (DW) in Equation (1).
The removal of an element by a duckweed system is weekly determined with Equation (2). Here, ‘t’ represents the conditions at the end of the week (before the addition of nutrients), and ‘t−1′ represents the conditions at the beginning of the week (after the addition of nutrients). Furthermore, the volume and concentration of the influent (VI &VI), cultivation cubicontainer (VC &VC), and effluent (VE &VE) are used for each specific parameter. This is subsequently divided by the surface area of the system (0.99 m2) and duration between two measurements (7 days).
Removal t = ( V I C I + V c C c + V E C E ) t ( V I C I + V c C c + V E C E ) t 1 surface duration week   [ mg   m 2   d 1 ]
From the removed nutrients, only a part is taken up by the duckweed. The others remain in the growing medium or are removed by processes like sedimentation of particles containing nutrients or by conversion into gaseous forms like in volatilisation or denitrification. The contribution of duckweed in the nutrient removal is indicated with the relative uptake (%) and is calculated by dividing the nutrient uptake by the removal of the nutrient [28].
Although elements are removed in a duckweed system, each week nutrients are added by adding 10 kg BE and 1 kg LF. Therefore, the net balance between addition and removal can still be positive or negative, leading to a gradual increase or decrease over time. This phenomenon is respectively defined as an accumulation or depletion. The average daily increase or decrease of an element will be determined by linear regression using R. The slope of the regression is equal to the daily concentration increase. This is also defined as the accumulation rate in this manuscript. The significance of the increase or decrease over time was tested with a Pearson correlation function between the parameter and the duration of the experiment. The significance was evaluated on a 5% significance level (p < 0.05). Furthermore, the accumulation rate depends on both the plant performance as the system input. Therefore, this parameter only shows the gradual build-up or depletion of a respective element in the tested system. Finally, a negative result should be interpreted as depletion of a particular element in the system.

3. Results and Discussion

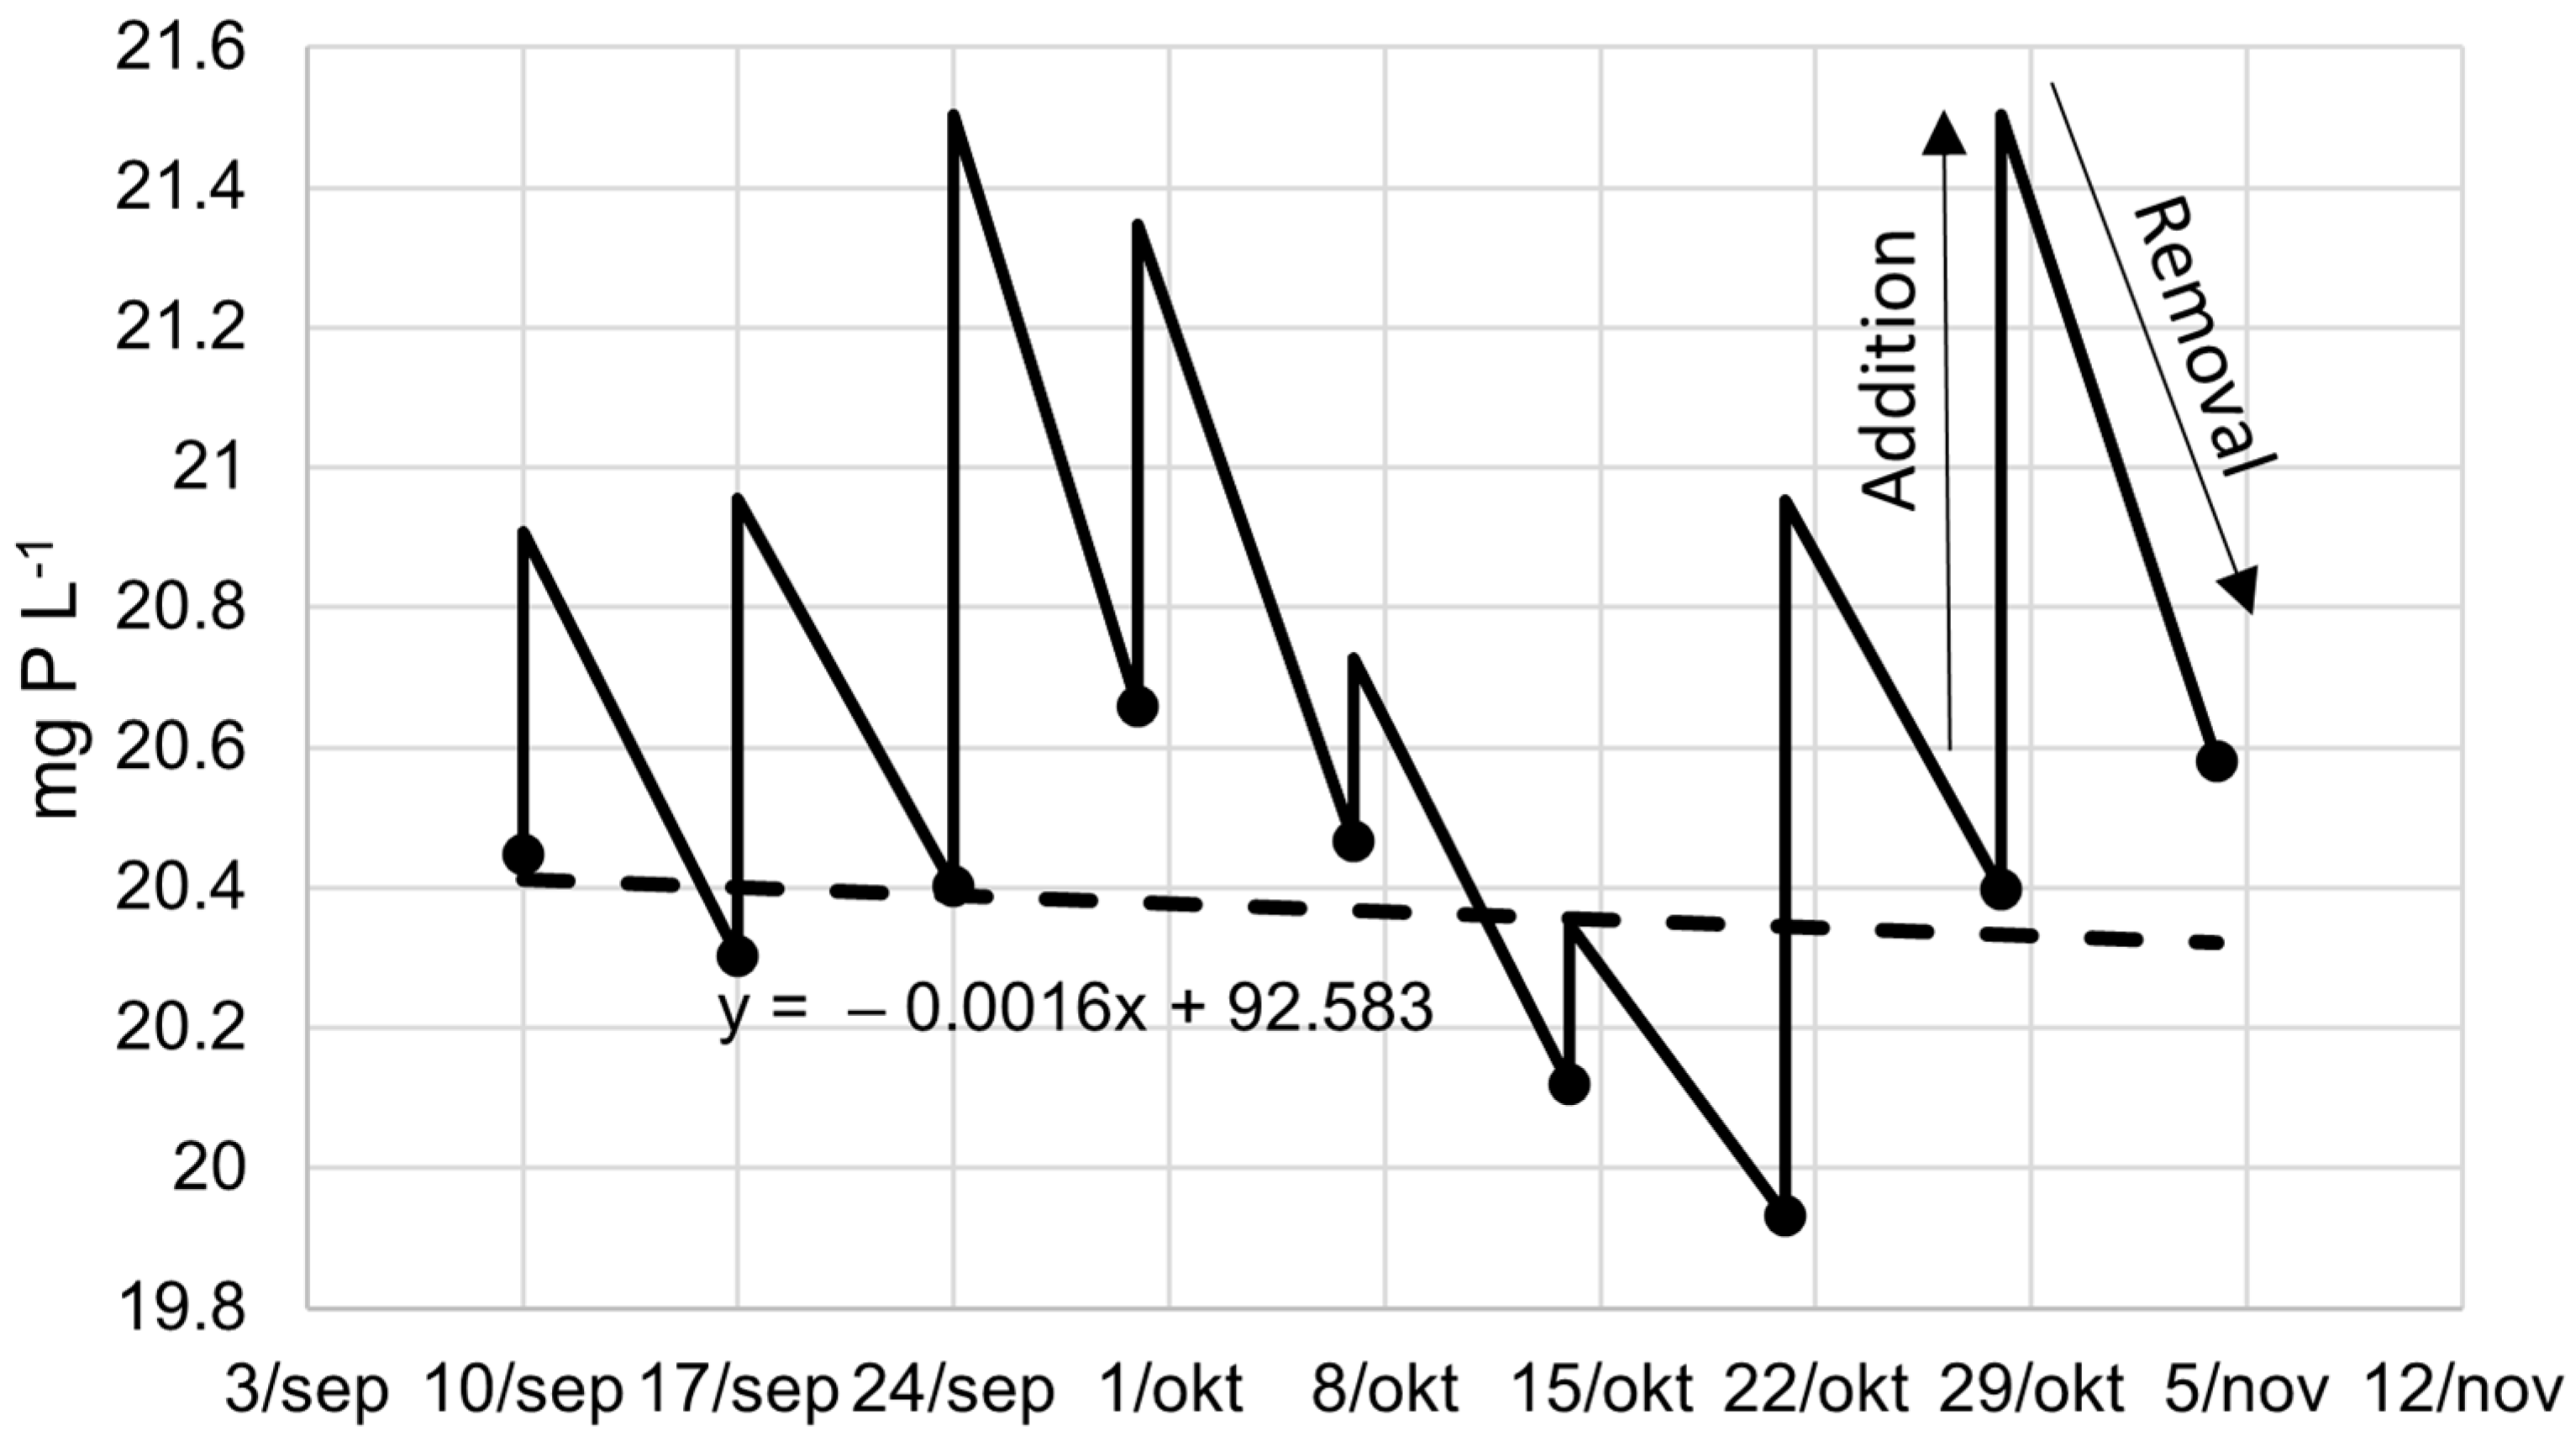
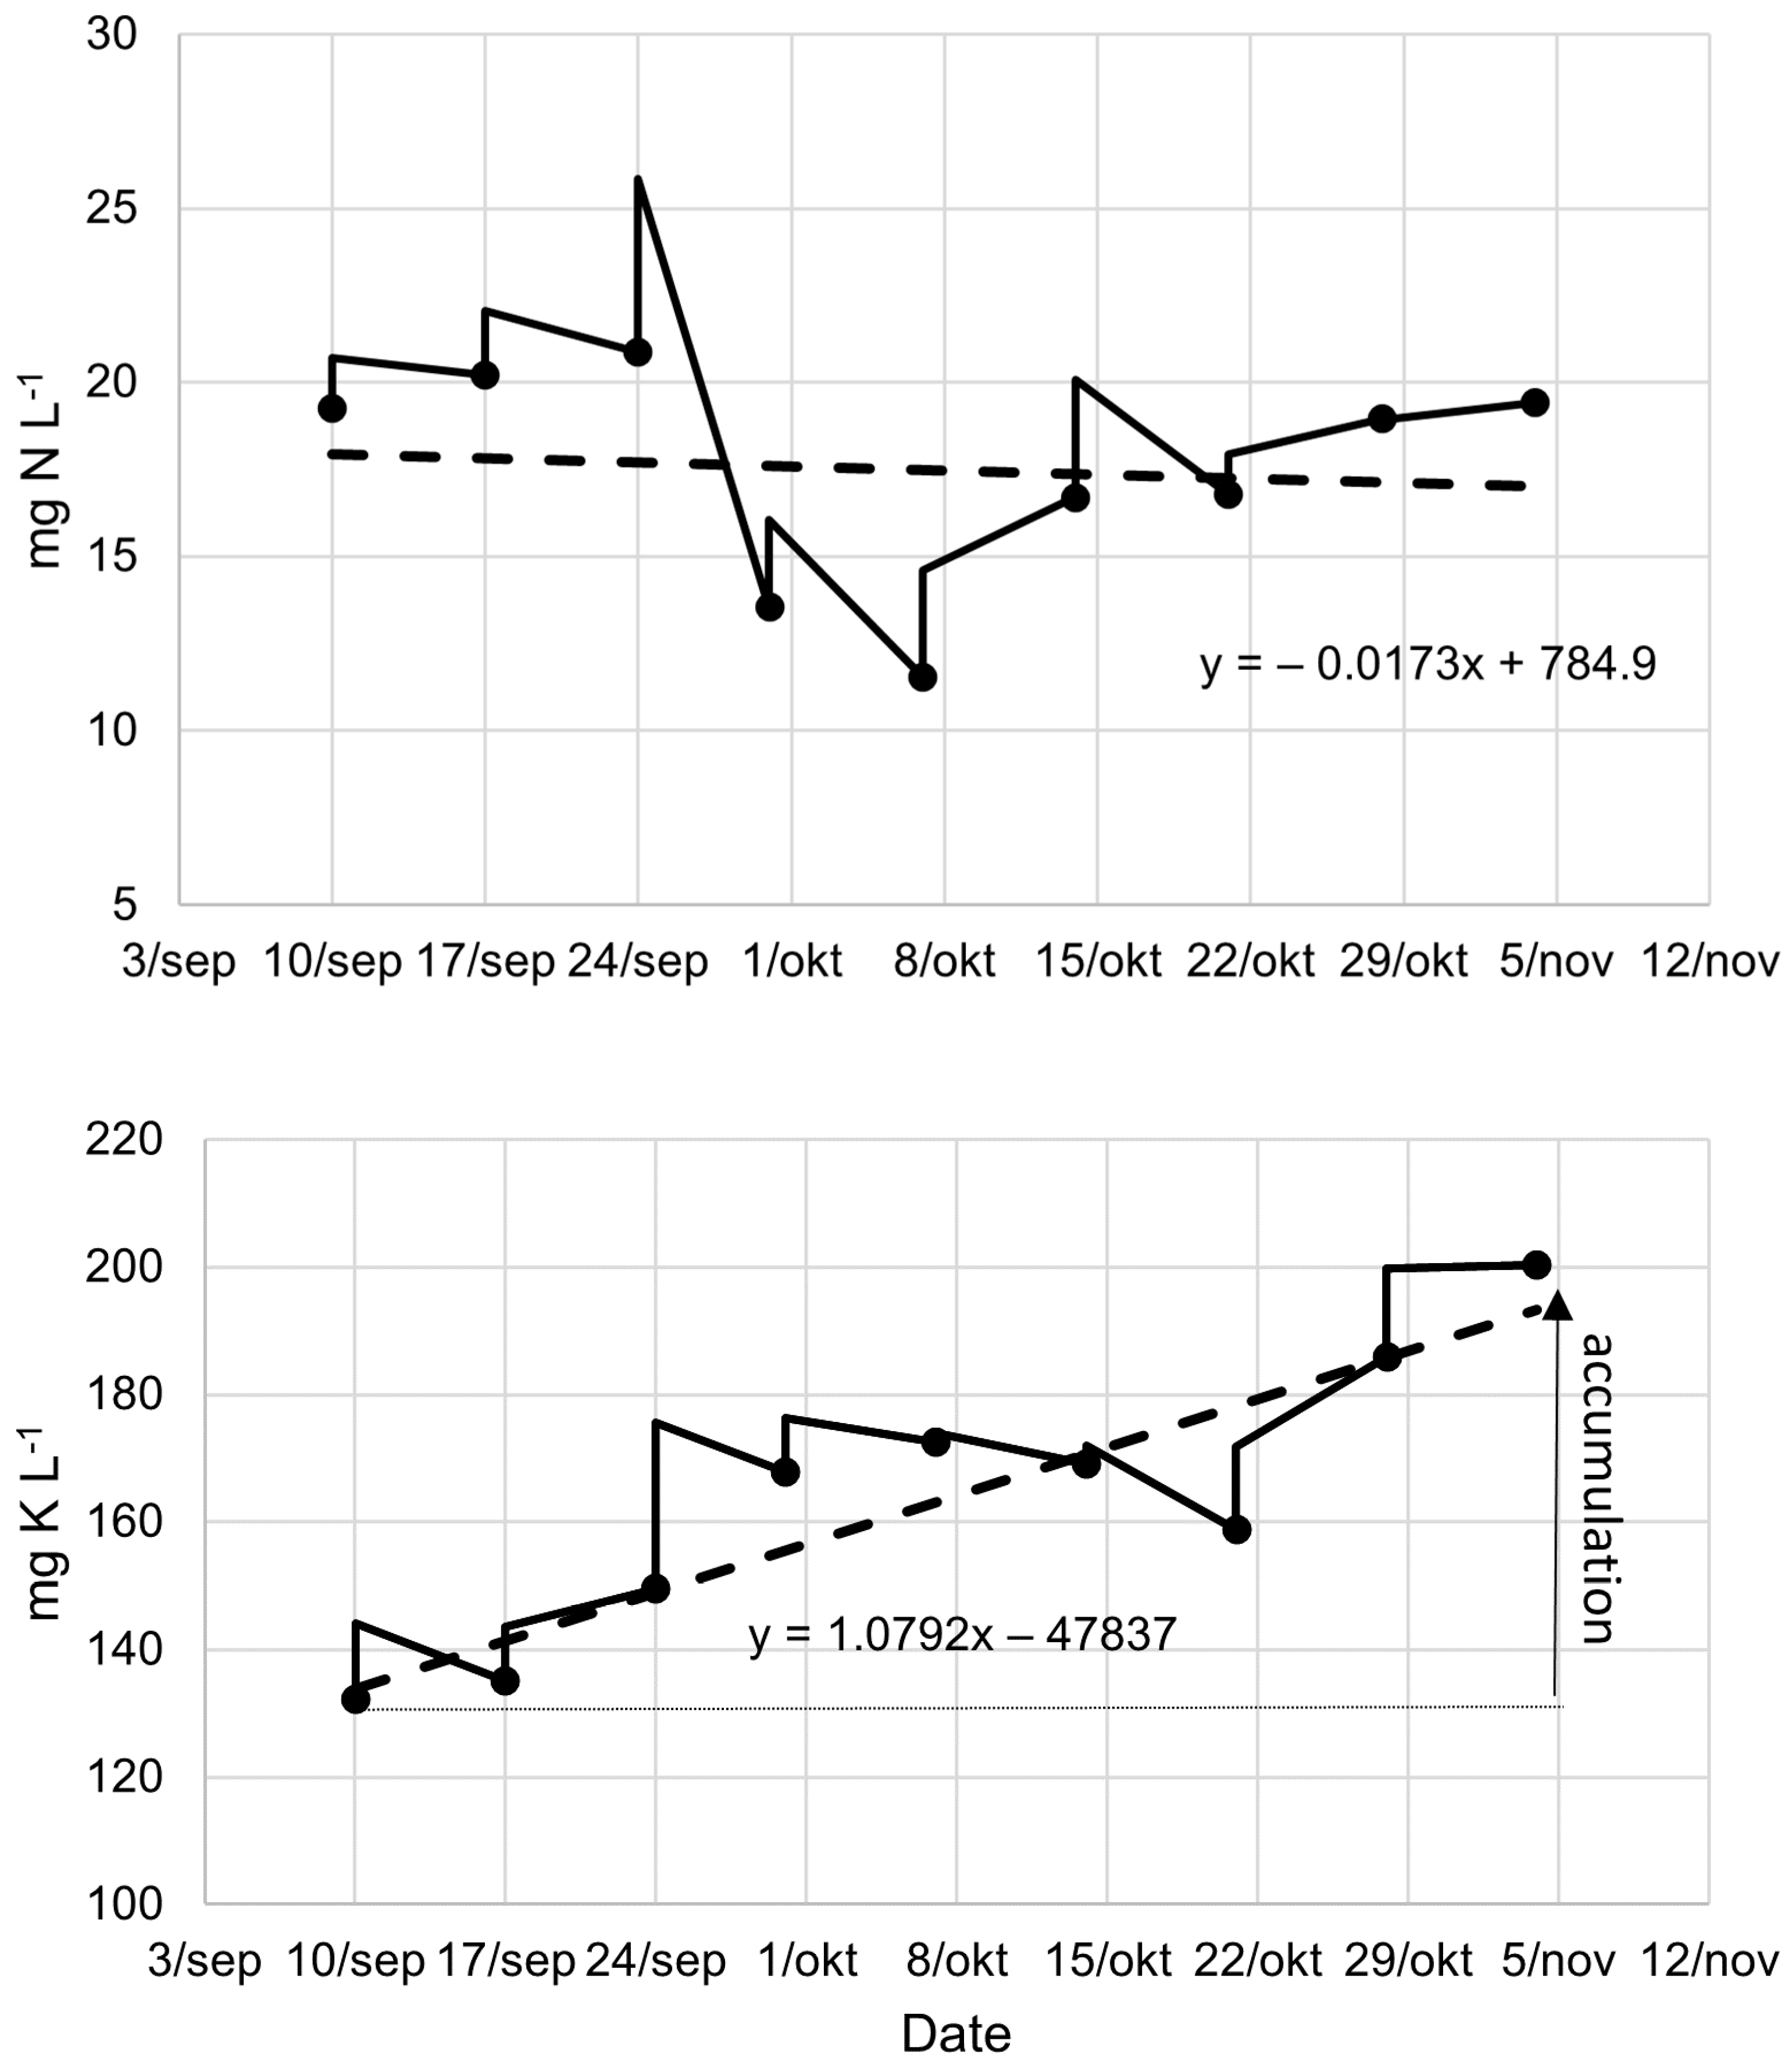
3.1. Medium Composition and Accumulation of Elements

During the experiment, the composition of the growing medium and the accumulation of elements was monitored. These conditions are summarised in Table 2, along with the optimal and maximal growing ranges for duckweed found in the literature [13,29]. When a certain component is within the optimal range, the growth will be optimal; when it is outside the maximal growing range, duckweed growth is theoretically impossible. In all other cases, duckweed growth is suboptimal.
Comparing the optimal and maximal growing ranges with the composition of the growing medium shows that the medium is suboptimal. EC, pH, T-N, K, Cl, Mg, and Fe are in optimal ranges, but a reduction of T-P and an increase of S and Ca theoretically improve the productivity.
It should be noted that the design of the experiment led to an optimal N and P content in the growing medium. These concentrations exceeded the discharge levels in Flanders for a manure treatment facility of 15 mg N L−1 and 2 mg P L−1 [30]. This effluent could be land applied or further treated to meet the discharge criteria. Treatment can be performed by the principle of a constructed wetland where several lagunes are placed in series. There is a various set of plants which can grow in the lagunes and remove the nutrients from the water. The processes in the system result in nutrient depletion, making the wastewater dischargeable without risk for eutrophication. However, it should be taken into account that the lower the nutrient content, also the lower the phytoremediation potential, and the protein composition of duckweed will be [7,28,31].
The average productivity of the period from 28/08 until 4/11 was 4.5 ± 1.7 g m−2 d−1, and productivity peaked at the harvest of 24/09 with 6.6 ± 0.3 g m−2 d−1. In that week, there was an average temperature of 15 °C, an average light intensity of 99 ± 15 µmol m−2 s−1, and an average photoperiod of 8.34 h. The average productivity was lower than the one found in a previous study of duckweed grown on a diluted biological effluent from the same pig manure treatment facility, which resulted in an average productivity of 6.1 g m−2 d−1 and 10.7 t ha−1 yr−1 [7]. The latter was, however, reached in a full growing season including summer, which is a generally more productive season. The maximum duckweed growth rate in that study was 9.7 g m−2 d−1 at a weekly average temperature of 21 °C and light intensity of 115 µmol m−2 s−1 for 13.2 h [7]. A comparison of both studies at the same time period shows that current results are respective for its growing period (Figure A1). These results indicate that production levels would be higher if produced for a full growing season. An optimal temperature for duckweed growth depends on the species and ranges between 20 and 31 °C [32]. An optimal photoperiod at a light intensity of 371 µmol m−2 s−1, amounts 12–13 h [32]. Therefore, it is concluded that, besides some suboptimal concentrations in the growing medium, temperature, light intensity, and photoperiod were suboptimal.
In Figure 2, the compositions show a sawtooth pattern because of the weekly addition of LF and BE, which contain nutrients that are removed afterwards by the combination of duckweed uptake and other removal mechanisms like sedimentation or denitrification. In the figure of total P and total N, the removal of nutrients is approximately equal to the addition however, variation occurs. This variation can be addressed to sampling, laboratory handling, and precipitation and evaporation in the system. In the figure of potassium, the removal by the system is smaller than the weekly addition (Figure 2). Hence, the K concentration in the growing medium increases gradually. Within this manuscript, this is defined as accumulation. If the concentration gradually decreases, this will be defined as depletion. In the case of T-N and T-P, it could be argued that there is a small depletion however, there was no significant correlation with the duration over time, meaning that the concentration was constant. In contrast, the correlation of K with the duration of the experiment was significant, meaning that the accumulation of K was significant (p < 0.05).
The accumulation rate of K can be estimated by the slope of the regression line, which is 1.0792 mg K L−1 d−1. And indeed, after the experiment of 55 days, the K concentration should increase 55 times 1.0792 mg L−1 or 59.36 mg L−1. The starting concentration was 132 ± 9, and the end concentration was 200 ± 13 (Table 2). The difference between start and end is, however, not exact 59.36 mg K L−1 but the figure also shows that the final concentration is slightly above the regression line (Figure 2). The correlation factor is a good way to estimate the average accumulation rate. This discussion can be done for each element and is summarised in Table 3.
As the correlation of the T-N and T-P was not significant (Table 3), the goal of adding as much N and P to the system as it could remove was achieved, indicating that the non-linear solver technique predicted effectively the weekly required amount of LF and BE. Furthermore, analyses showed that BE and LF had an N content of respectively 301 ± 42 and 4665 ± 756 mg N L−1 and a P content of respectively 60 ± 3 and 206 ± 61 mg P L−1. The observed compositions are in line with the average values found for LF and BE in Flanders [24]. Nevertheless, the starting conditions were not correctly predicted with the solver technique. The T-P content was twice as high as the result from the solver technique (20 instead of 10 mg L−1), while the actual T-N of the starting condition was lower (20 instead of 33) (Table 1 and Table 2). When preparing the growing medium, the BE is taken from a valve positioned at the bottom of the cubicontainer. Presumably, there is a sedimentation layer in the cubicontainer vessel of BE. The fraction of sediment was higher when preparing the growing medium. The solid fraction of pig manure contains generally a higher P and lower N content than the liquid fraction [33], which can explain the observed deviations.
Contrary to N and P, other elements tended to increase in the continuous cultivation (Table 2 and Table 3). With the accumulation rates, a first extrapolation can be performed, although the removal rates might variate over different growing periods, and a determination over a full growing season and different years would give a more precise determination of the yearly accumulation rate. Electric conductivity, nitrate, K, Cl, T-S, Ca, and Mg rose steadily and would not have any impact on the growth performance of duckweed after one growing season of 175 days, which can be considered a feasible length of the growing season in Flanders [7]. For example, in the studied conditions, Cl content significantly increased, which might eventually induce salt stress. With the monitored accumulation rate of 0.18 mg L−1 d−1, a discharge limit of 1000 mg L−1 would only be reached after 5466 days or 31 growing seasons of 175 days. This limit was imposed on pig manure treatment facilities in Flanders with a capacity of more than 60,000 tons of manure per year [30]. Even then, N and P removal by duckweed might not be affected, as this is only significantly reduced at a Cl concentration of 1772.5 ppm [34]. This should be a point of attention, as the chemical oxygen demand (COD) tends to increase at high salt concentrations [34]. Another important element to monitor is K, which had the highest accumulation rate in the system and would exceed the maximal growing range (2000 mg K L−1) in 1713 days or 9.8 equivalent growing seasons.
In contrast, the differences in the concentration of Fe, Zn, and Cu were small to be statistically significant, while Mn showed a depletion over time. It was not possible, however, to draw a conclusion for potentially harmful elements like As, Cd, and Pb because all values found were below the limit of detection (LOD). These results indicate that more focus should be given to the accumulation effects on continuous recirculation cultivation at a large scale to determine at which point the water should be discharged, and the system should be restarted without losing productivity or treatment capacity.

3.2. Mineral Removal and Recovery Potential
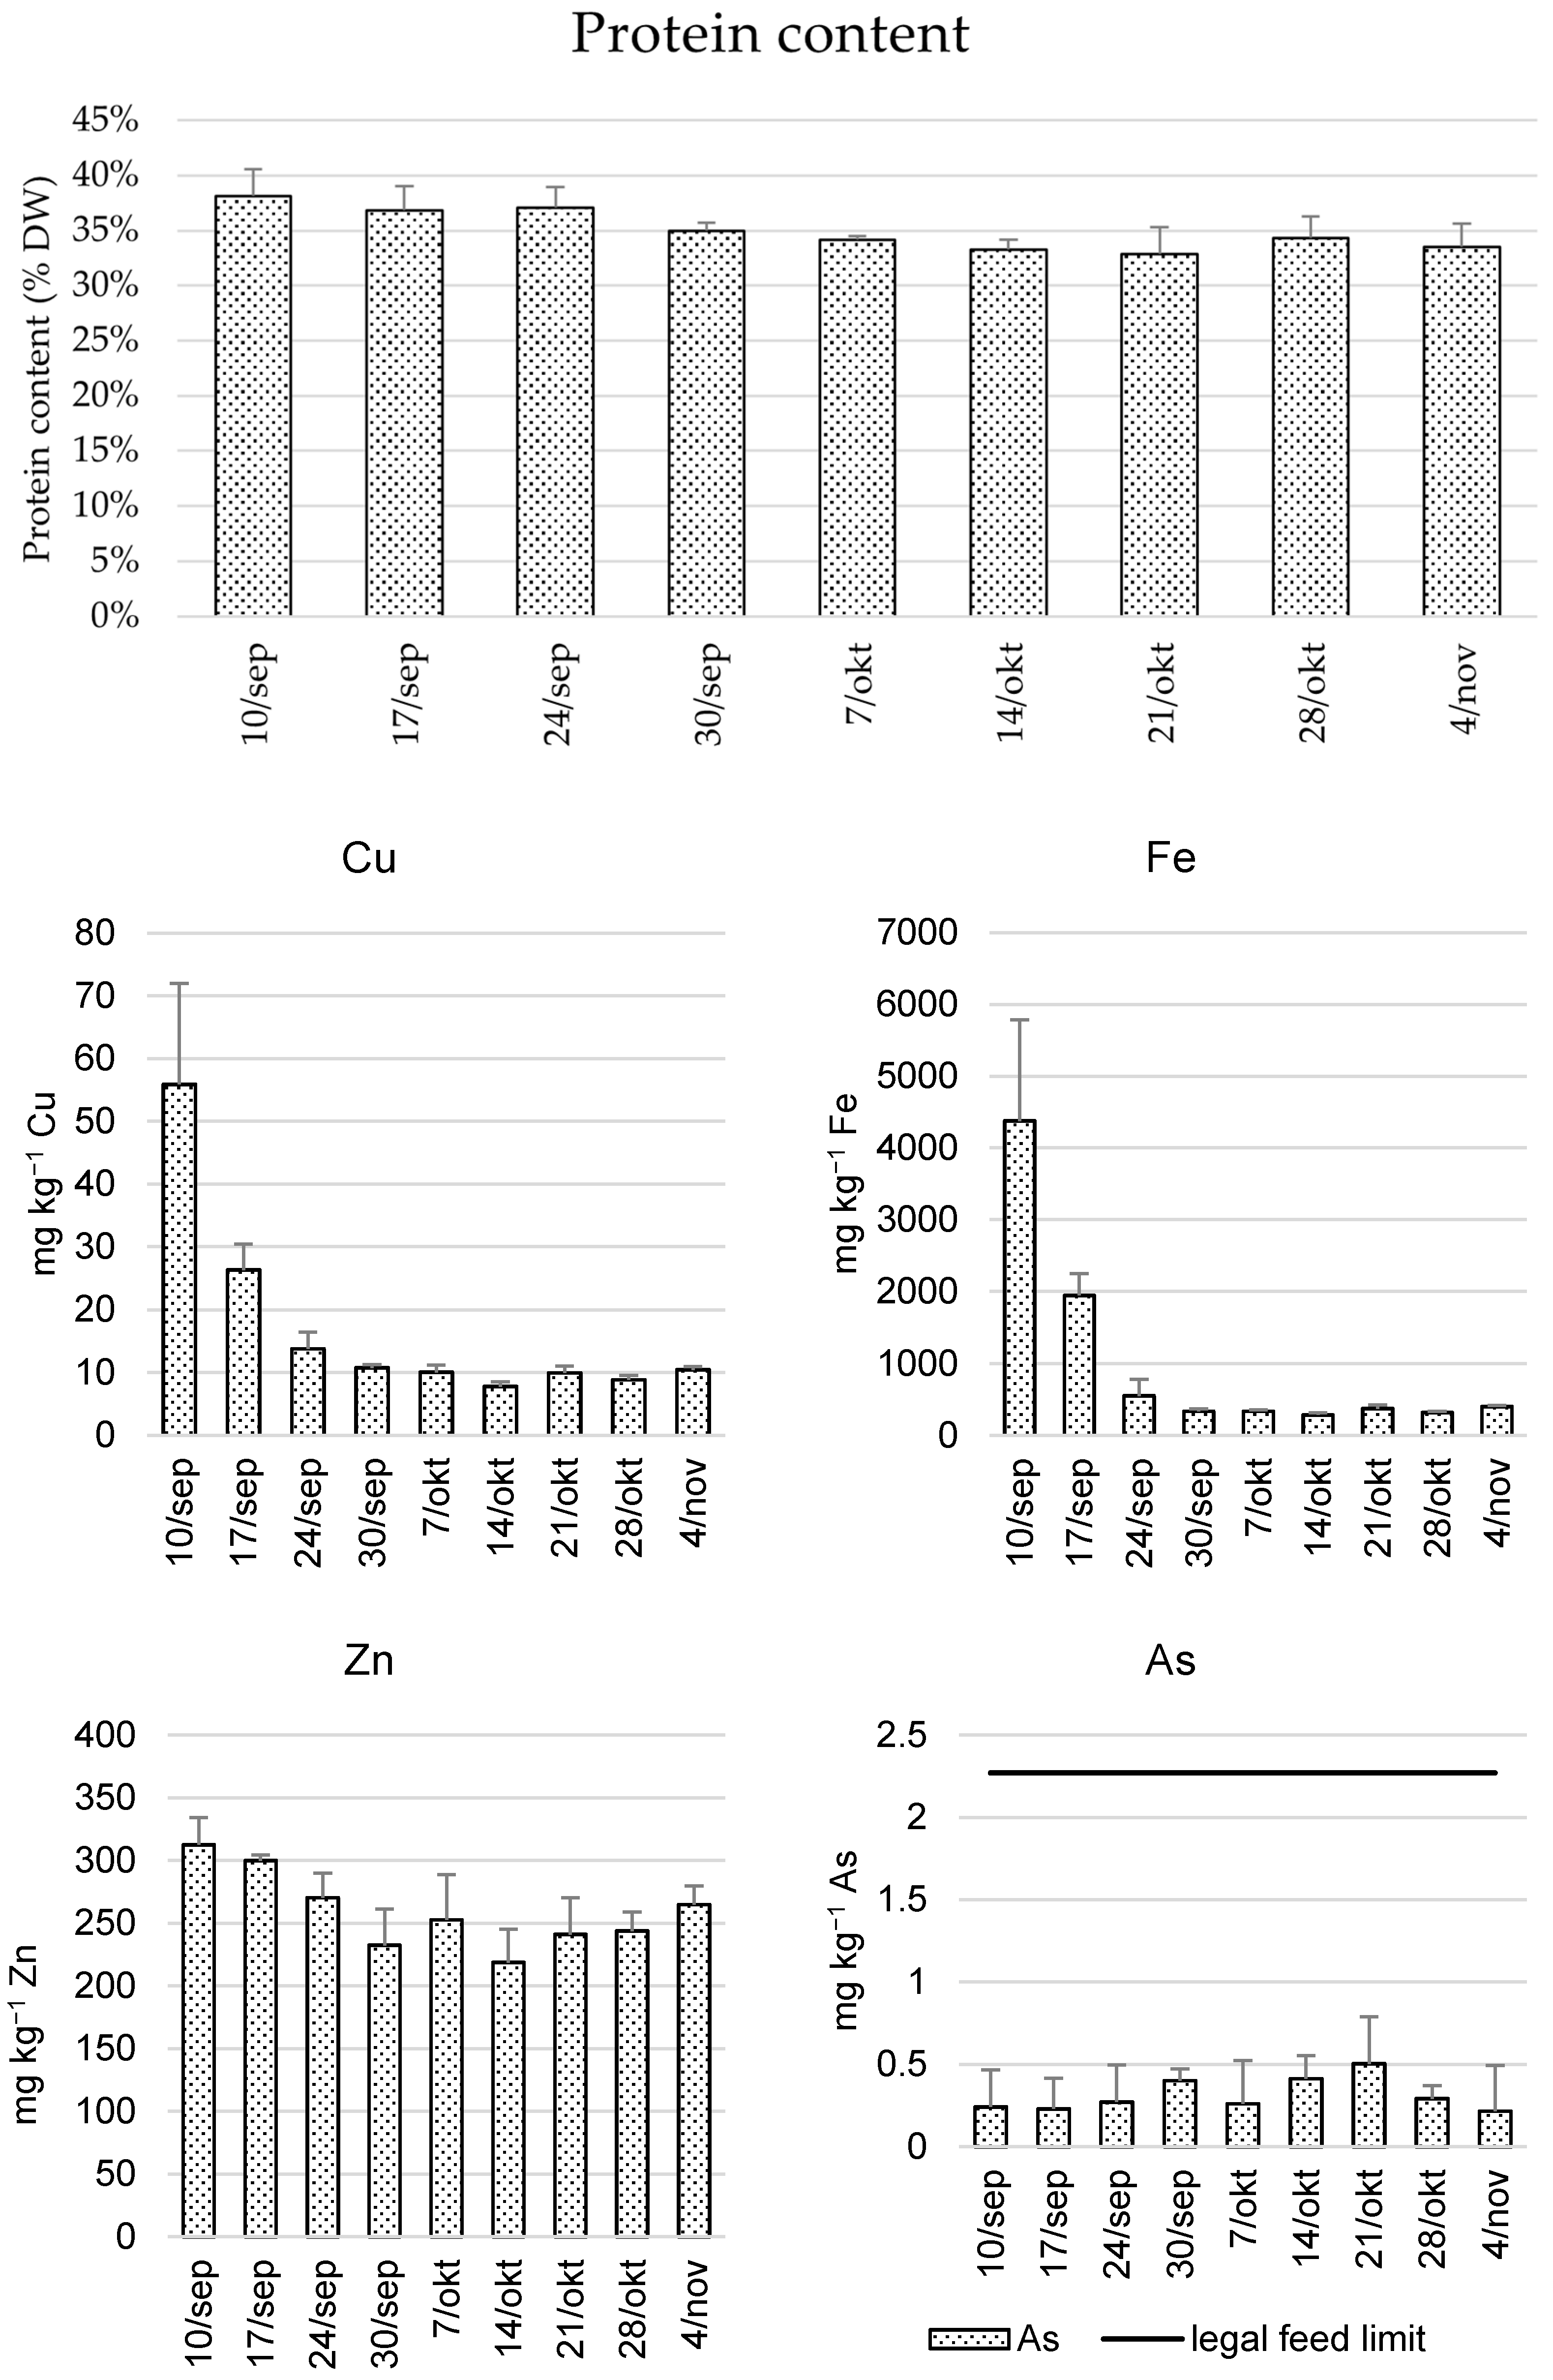
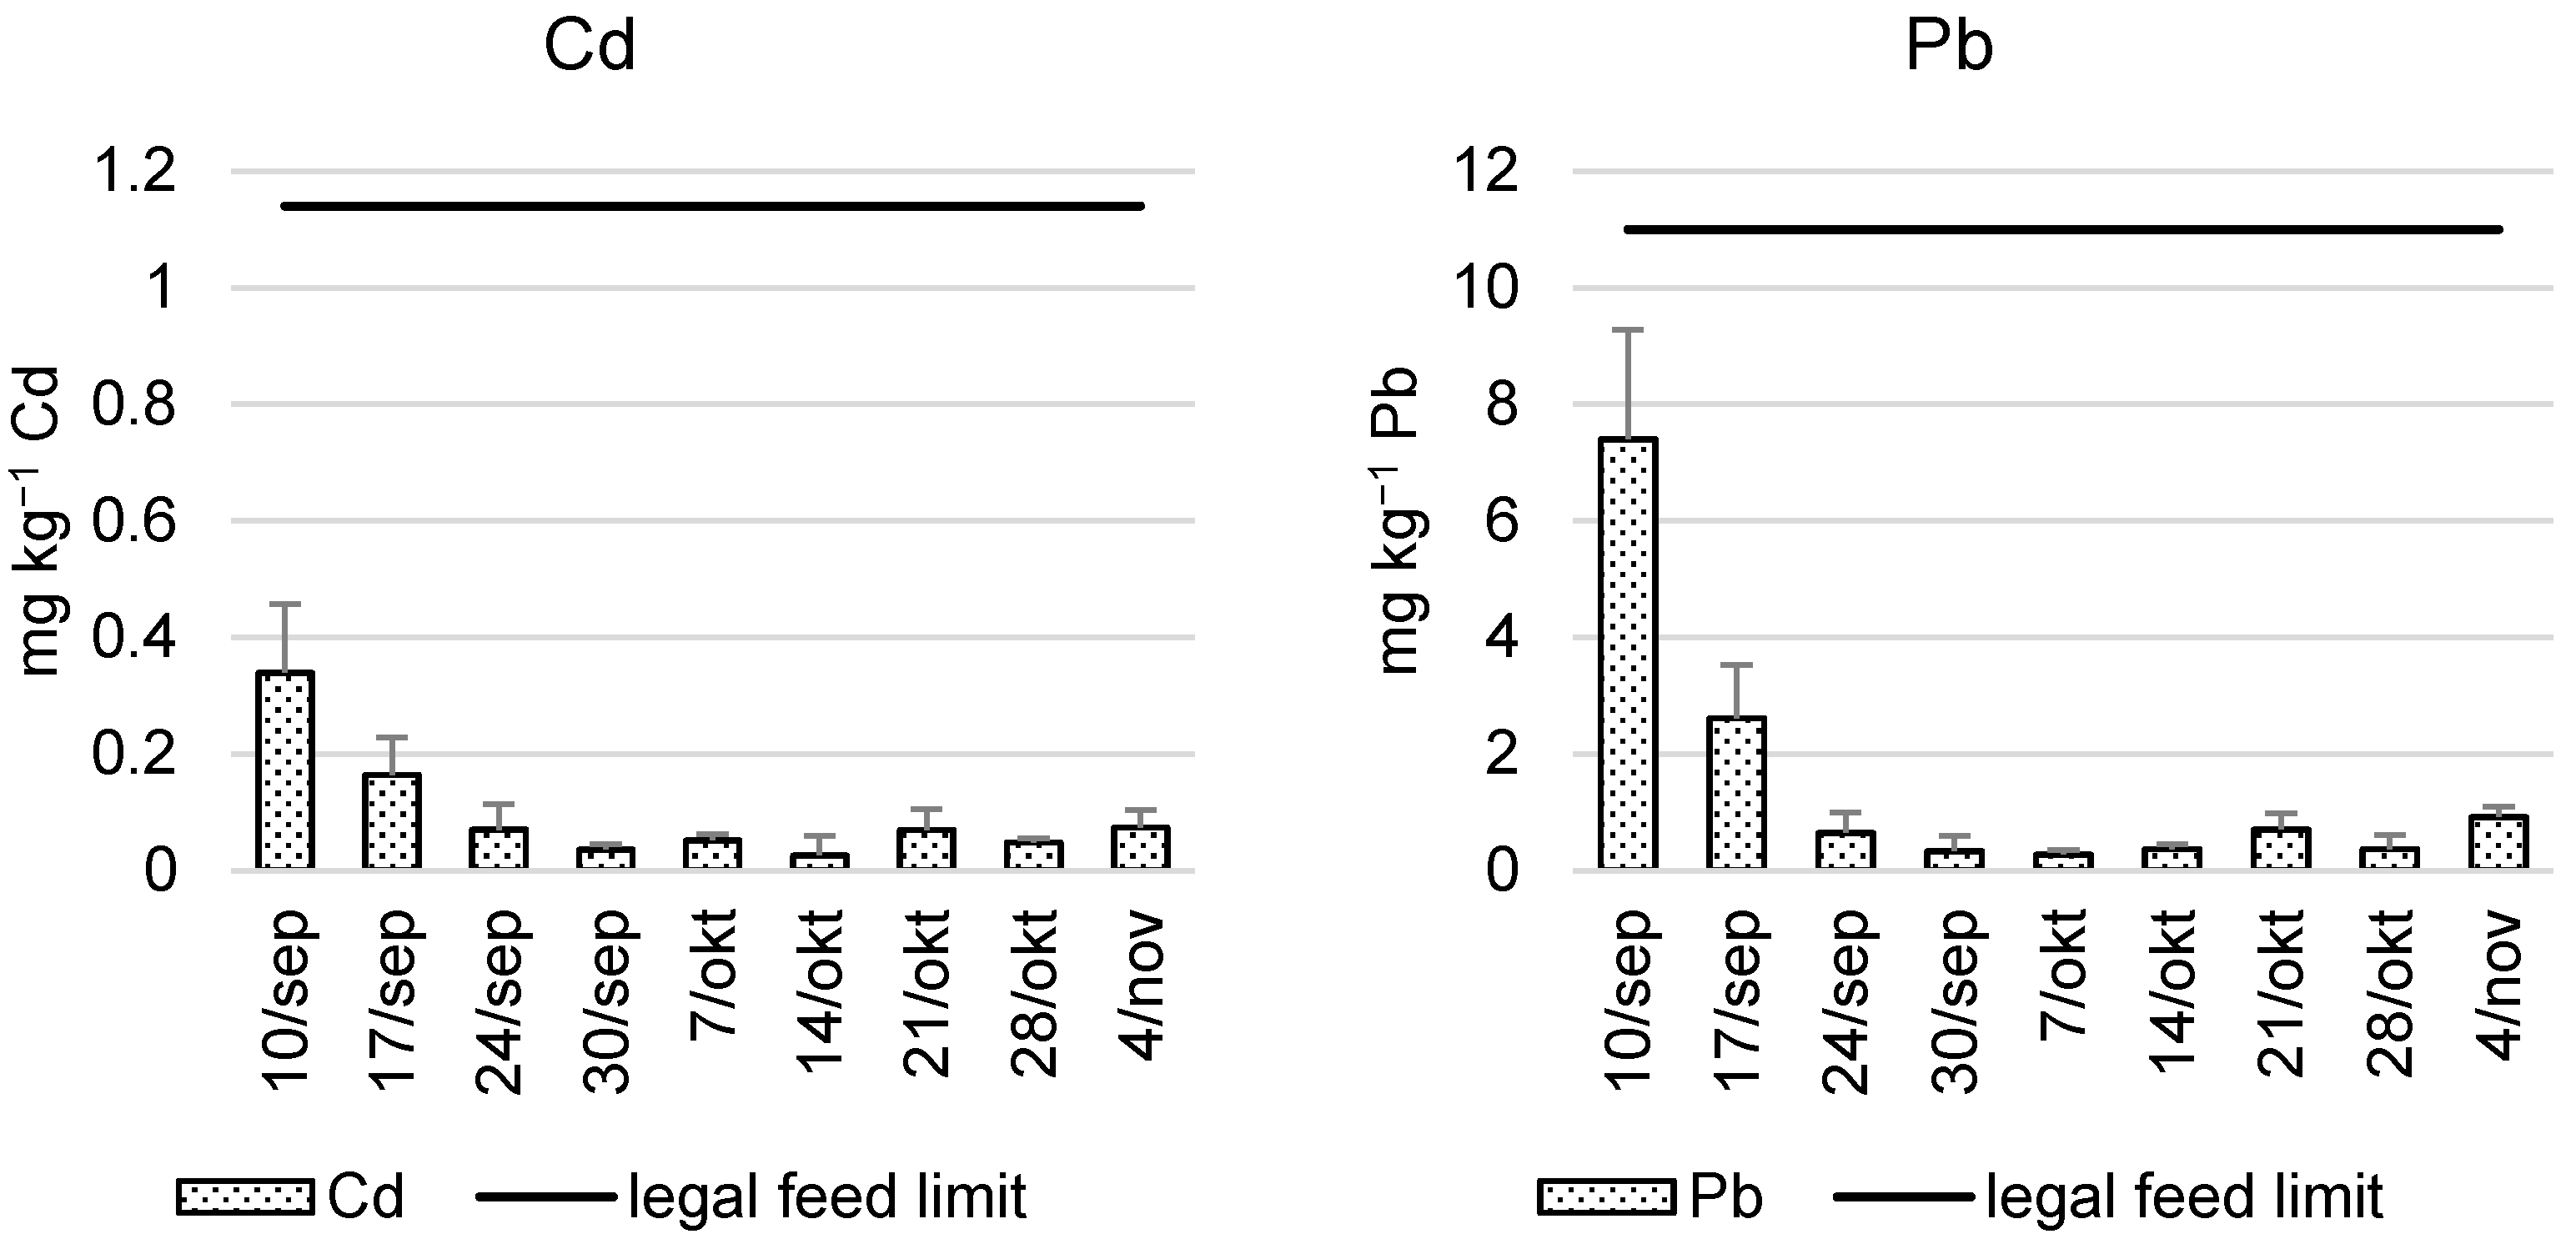
Removal in a duckweed system is a combination of nutrient uptake by the plant and sedimentation. Except for carbon and nitrogen, which can also be removed in gaseous form by biodegradation [17]. The removal by the duckweed system and the contribution of the plant uptake are summarised in Table 4. For most of the monitored elements, duckweed’s uptake was much lower than the system’s removal, indicating that phytoremediation was only partly responsible for the wastewater treatment obtained.
The relative N uptake in this study was 24%, which is similar to the relative N uptake of 28% found in a duckweed pond fed with swine manure wastewater with a high nutrient load [28].
Remarkably, all K that was removed was taken up by the plant, which indicates that none was sedimented. Potassium is a more exchangeable element in wetland soils, making it highly mobile and explaining the observed result [35]. All removed K would re-enter the livestock system in the hypothesis that duckweed is used as a feed source.
The N and P removal are comparable to other duckweed treatment systems. Zimmo et al. found an N and P removal range of respectively 1.09–1.36 g N m−2 d−1 and 0.104–0.154 g P m−2 d−1 [36]. The N removal rate is comparable to a study on a reed-based constructed wetland which was monitored on a large scale in a temperate maritime climate, observing an N removal in summer of 1.22 g m−2 d−1 and 0.75 g m−2 d−1 in autumn [37].
With the removal rates found in the present study and considering a growing season of 175 days [7], it was extrapolated that 255 m3 LF and 2550 m3 BE per growing season would have been added and treated in a 1-ha duckweed pond with similar conditions to the experiment. The calculated treatment capacity was linked to the size of the farm and its pig places. A pig place is the average count of pigs present at the farm, taking into account that there are several production cycles in a year and that there are periods where no pigs are housed between two cycles. The average manure production was approximately 1.2 ton per year per pig place present at a farm in the period between 1998 and 2007 [38]. Furthermore, 0.83 m3 of BE and 0.87 m3 of LF are produced from 1 m3 of raw manure with a density of 0.99-ton m−3 [23]. It should be noted that the extrapolation towards a hectare scale is a big step from the tested conditions. Therefore, an up-scaling validation is required to determine a more precise value. The manure generated by a farm with a housing capacity of 2805 pigs can be treated in the proposed duckweed system of 1 ha if the raw manure is pre-treated with a separation step followed by a biological treatment with an average performance. Hence, a considerable share could be treated of the manure produced in the manure facility which provided the wastewater, as this facility had a housing capacity of approximately 3000 pigs.
In this study, the swine wastewater was added to the pond after centrifugation and biological treatment (BE and LF) because this is a widespread treatment in Flanders [5]. Un-treated or anaerobically digested wastewater can also be treated using duckweed [9,10]. The N/K ratio will be different in these waste streams. As a result, the accumulation rate of K in a continuous recirculated system will be smaller. The same process holds for other accumulated elements. The downside is, however, that the areal need for processing the wastewater will be larger as these pretreatment techniques have a smaller reduction effect on the N and P concentration of the wastewater.
Finally, the removal rates might help to identify the potential accumulating elements for any given wastewater. Although, caution and validation over a full growing season at a large scale are advised, as the environmental performance depends on the growing medium and climate.

3.3. Feeding Value

After harvesting, duckweed could be used as a feed ingredient. This can be done fresh after harvest, or when it is dried, or when proteins are extracted. An ingredient is considered protein-rich by the EU protein balance sheet when the protein content is between 30–50 g per 100 g product [39]. When fully dried, duckweed contained 35 ± 2% DW and peaked at 10/09 with a protein content of 38 ± 2% DW (Figure A2). This is in line with the study of Zhao et al. [14]. This protein content allows classifying the produced duckweed as protein-rich biomass.
However, this holds for a fully dried product. The more moisture a product has, the more the contained elements are diluted. Duckweed should be almost fully dried before being considered a protein-rich product. The moisture content influences the mineral composition of a product. Therefore, all units are converted to a fully dried product in this manuscript to enable comparison with legal or suggested limits.
Copper, Fe, Zn, and Mn are known to have an essential role in metal-containing enzymes and lead to an improved immunity of livestock [40]. Conventional feeds are deficient in microelements, and for this reason, there is a need to supplement these constituents to livestock natural feeds [41]. This is also visible in the data presented in Table 5. Commodities like corn, oat, wheat, and steamed potatoes have Mn, Zn, and Fe levels below the feeding standard of both laying hens and swine (Table 5). No conventional feed ingredient can provide Zn levels that are close to 150 mg kg−1 DM. Duckweed grown in this study, however, has a much higher Zn, Mn, and Fe concentration than other commodities, while it has similar Cu values. It can be considered as a source of Mn, Zn, and Fe, and adding duckweed in the feed could act as a replacer for these elements in livestock feed. Nevertheless, duckweed cannot be unlimitedly mixed in feed, as its Zn content surpasses the proposed maximum of 150 mg Zn kg−1 DM in complete feed for piglets and sows [42].
Additionally, the elements As, Cd, and Pb in feedstuffs are regulated by Directive 2002/32/EC of the European Parliament [20] and may not exceed the respective limits of 2, 1, and 10 mg kg−1 feedstuff. It should be noted that these limits do not hold for a completely dried product but a feedstuff with a water content of 12%. Converting the limits to the unit mg kg−1 dry weight results in the respective thresholds of 2.3, 1.1, and 11 mg kg−1 dry weight. These limits were not exceeded in the cultivation period between 10/09 and 4/11. Hence, duckweed can safely be used as a feed source when cultivated accordingly to this study, concerning As, Cd, and Pb (see Table 4 and Figure S2). It should be noted that there are several more aspects that should be monitored to guarantee feed safety, such as pathogens, viruses, and xenobiotics [19].
For all micronutrients analysed (Fe, Zn, Cu, As, Cd, and Pb), the contents do not seem to accumulate in the plant over time (see Figure S2). In contrast, the compositions sharply drop for Fe, Cu, Cd, and Pb, within the first three weeks, stabilizing afterwards. The comparison of the Fe and Zn concentrations with the suggested levels is complex. Therefore, it was chosen to compare the only concentrations from the stable period, being 30/09 to 4/11. This was not preferred for Cd and Pb, as safety should always be guaranteed.
The decreasing trend might suggest a reaction of the duckweed to the depletion of these nutrients within the growing medium. However, the Fe content in the medium does not sharply drop over time (Table 3). Arsenic, Cd, and Pb were all under the detection limit, suggesting nor a high content at the start nor the end of the experiment. Therefore, it is suggested that the high heavy metal concentrations of duckweed at the beginning of the experiment are caused by a historical accumulation at the sourcing location, which is subsequently thinned out by the continuous cultivation and harvest.
The observed high initial content is however, disadvantageous as the starting concentration of Pb is very high and close to the legal feed limit. Caution is advised at the start of the cultivation, and inoculating duckweed with As, Cd, and Pd concentrations that match the legal limits would minimise the risk in the first weeks.

4. Conclusions

With the help of a non-linear solver technique, a combination of liquid fraction and biological effluent from a swine manure treatment facility was treated with duckweed. The systems were fed with a mixture of the liquid fraction and the biological effluent of a swine manure treatment system diluted with rainwater in order that the weekly N and P addition was equal to the N and P removal by the system. The N and P concentrations in the system were high in order to have optimal duckweed growth. Potassium, Cl, S, Ca, and Mg showed an accumulation tendency within the wastewater. In a continuous recirculation growing system, these elements can eventually cause stress for duckweed cultivation. Nevertheless, N and P were removed from the growing medium, and protein-rich biomass was produced, with a content of 35 ± 2% dry weight. The mineral composition was rich in Mn, Zn, and Fe and can be seen as a source of these elements. The potential harmful heavy metals (As, Cd, and Pb) were monitored and were below the feed limits proposed by Directive 2002/32/EC. Hence, duckweed has the potential to be used to treat swine manure wastewater while producing a mineral- and protein-rich feed ingredient.

Supplementary Materials

The following are available online at https://www.mdpi.com/article/10.3390/plants10061124/s1, Figure S1: Comparing productivity, Figure S2: Protein.

Author Contributions

R.D.; formal analysis, R.D.; investigation, R.D., resources, J.L., M.E., E.M.; writing—original draft preparation, R.D.; writing—review and editing, M.F.d.S., L.J., M.E., E.M.; visualization, R.D.; supervision, J.L., L.J., M.E., E.M.; project administration, J.L., M.E., E.M.; funding acquisition, J.L., M.E., E.M. All authors have read and agreed to the published version of the manuscript.

Funding

This research was conducted within the framework of the H2020 project Nutri2Cycle, grant number: 773682. (https://www.nutri2cycle.eu/ accessed on 30 May 2021).

Institutional Review Board Statement

Not applicable.

Informed Consent Statement

Not applicable.

Data Availability Statement

Data is contained within the article and supplementary material.

Acknowledgments

Special thanks to the two master thesis students Emma Verhagen and Mathias Geerardyn who conducted several analyses and helped monitor the experimental set-up.

Conflicts of Interest

The authors declare no conflict of interest. The funders had no role in the design of the study; in the collection, analyses, or interpretation of data; in the writing of the manuscript, or in the decision to publish the results.

Appendix A

Table A1. Weather data.
DateAverage Temperature (°C)Average Relative humidity (%)Average Light Intensity
(µmol m−2 s−1)
Average
Photoperiod
(h)
Total
Precipitation (mm)
10/Sep13 ± 282 ± 5112 ± 146.4 ± 1.9 18.9
17/Sep16 ± 283 ± 8101 ± 169.5 ± 2.7 0.7
24/Sep15 ± 072 ± 399 ± 158.4 ± 2.5 5.7
30/Sep15 ± 291 ± 6106 ± 205.9 ± 1.4 44
7/Oct13 ± 286 ± 4155 ± 643.9 ± 1.9 49.7
14/Oct14 ± 289 ± 6114 ± 364.6 ± 3.0 17.5
21/Oct13 ± 290 ± 5135 ± 693.7 ± 2.4 21.1
28/Oct13 ± 390 ± 692 ± 304.0 ± 2.6 9.4
4/Nov9 ± 390 ± 474 ± 96.1 ± 1.4 23.3
Average14 ± 483 ± 9109 ± 367.0 ± 3.5Total190.3
Figure A1. Duckweed productivity and the average daily photoperiod during the experiment compared with the productivity reached in a similar experiment using 22% of biological effluent from a pig manure treatment facility in 2018 [7].
Plants 10 01124 g0a1
Figure A2. Protein, Fe, Zn, Cu, As, Cd, and Pb concentration with standard deviations (error flag) of the three duckweed Scheme 2019. 7, 221–243, doi:10.1146/annurev-animal-030117-014838.
Plants 10 01124 g0a2aPlants 10 01124 g0a2b

References

  1. Kim, S.W.; Less, J.F.; Wang, L.; Yan, T.; Kiron, V.; Kaushik, S.J.; Lei, X.G. Meeting global feed protein demand: Challenge, Opportunity, and Strategy. Annu. Rev. Anim. Biosci. 2019, 7, 221–243. [Google Scholar] [CrossRef]
  2. Mottet, A.; de Haan, C.; Falcucci, A.; Tempio, G.; Opio, C.; Gerber, P. Livestock: On our plates or eating at our table? A new analysis of the feed/food debate. Glob. Food Sec. 2017, 14, 1–8. [Google Scholar] [CrossRef]
  3. Ritala, A.; Häkkinen, S.T.; Toivari, M.; Wiebe, M.G. Single cell protein-state-of-the-art, industrial landscape and patents 2001–2016. Front. Microbiol. 2017, 8, 2009. [Google Scholar] [CrossRef]
  4. Meul, M.; Ginneberge, C.; Van Middelaar, C.E.; de Boer, I.J.M.; Fremaut, D.; Haesaert, G. Carbon footprint of five pig diets using three land use change accounting methods. Livest. Sci. 2012, 149, 215–223. [Google Scholar] [CrossRef]
  5. Snauwaert, E.; Vannecke, T. VCM-Enquëte Operationele Stand van Zaken Mestverwerking in Vlaanderen; VCM: Brugge, Belgium, 2017. [Google Scholar]
  6. OECD. Nutrient Balance (Indicator). Available online: https://www.oecd-ilibrary.org/agriculture-and-food/oecd-compendium-of-agri-environmental-indicators_9789264186217-en (accessed on 14 May 2019).
  7. Devlamynck, R.; de Souza, M.F.; Michels, E.; Sigurnjak, I.; Donoso, N.; Coudron, C.; Leenknegt, J.; Vermeir, P.; Eeckhout, M.; Meers, E. Agronomic and environmental performance of Lemna minor cultivated on agricultural wastewater Streams—A Practical Approach. Sustainability 2021, 13, 1570. [Google Scholar] [CrossRef]
  8. Gwaze, F.; Mwale, M. The prospect of duckweed in pig nutrition: A Review. J. Agric. Sci. 2015, 7, 189. [Google Scholar] [CrossRef]
  9. Zhang, M.; Luo, P.; Liu, F.; Li, H.; Zhang, S.; Xiao, R.; Yin, L.; Zhou, J.; Wu, J. Nitrogen removal and distribution of ammonia-oxidizing and denitrifying genes in an integrated constructed wetland for swine wastewater treatment. Ecol. Eng. 2017, 104, 30–38. [Google Scholar] [CrossRef]
  10. Li, X.; Wu, S.; Yang, C.; Zeng, G. Microalgal and duckweed based constructed wetlands for swine wastewater treatment: A review. Bioresour. Technol. 2020, 318, 123858. [Google Scholar] [CrossRef] [PubMed]
  11. Kutschera, U.; Niklas, K.J. Darwin-Wallace Demons: Survival of the fastest in populations of duckweeds and the evolutionary history of an enigmatic group of angiosperms. Plant Biol. 2015, 17, 24–32. [Google Scholar] [CrossRef] [PubMed]
  12. Ziegler, P.; Adelmann, K.; Zimmer, S.; Schmidt, C.; Appenroth, K.-J. Relative in vitro growth rates of duckweeds (Lemnaceae)—The most rapidly growing higher plants. Plant Biol. 2015, 17, 33–41. [Google Scholar] [CrossRef]
  13. Landolt, E.; Kandeler, R. Biosystematic Investigations in the Family of Duckweeds (Lemnaceae), Vol. 4: The Family of LEMNACEAE-a Monographic Study, Vol. 2 Phytochemistry, Physiology; Geobotanische Institut ETH: Zürich, Switzerland, 1987. [Google Scholar]
  14. Zhao, Y.; Fang, Y.; Jin, Y.; Huang, J.; Bao, S.; Fu, T.; He, Z.; Wang, F.; Wang, M.; Zhao, H. Pilot-scale comparison of four duckweed strains from different genera for potential application in nutrient recovery from wastewater and valuable biomass production. Plant Biol. 2015, 17, 82–90. [Google Scholar] [CrossRef]
  15. Skillicorn, P.; Spira, W.; Journey, W. Duckweed Aquaculture—A New Aquatic Farming Fystem for Developing Countries; The World Bank: Washington, DC, USA, 1993; ISBN 0-8213-2067-x. [Google Scholar]
  16. Sikorski, Ł.; Piotrowicz-Cieślak, A.I.; Adomas, B. Phytotoxicity of sodium chloride towards common duckweed (Lemna minor L.) and yellow lupin (Lupinus Luteus L.). Arch. Environ. Prot. 2013, 39, 117–128. [Google Scholar] [CrossRef] [Green Version]
  17. Suzuki, K.; Waki, M.; Yasuda, T.; Fukumoto, Y.; Kuroda, K.; Sakai, T.; Suzuki, N.; Suzuki, R.; Matsuba, K. Distribution of phosphorus, copper and zinc in activated sludge treatment process of swine wastewater. Bioresour. Technol. 2010, 101, 9399–9404. [Google Scholar] [CrossRef]
  18. Nicholson, F.A.; Chambers, B.J.; Williams, J.R.; Unwin, R.J. Heavy metal contents of livestock feeds and animal manures in England and Wales. Bioresour. Technol. 1999, 70, 23–31. [Google Scholar] [CrossRef]
  19. Markou, G.; Wang, L.; Ye, J.; Unc, A. Using agro-industrial wastes for the cultivation of microalgae and duckweeds: Contamination risks and biomass safety concerns. Biotechnol. Adv. 2018, 36, 1238–1254. [Google Scholar] [CrossRef]
  20. European Commission. Directive 2002/32/EC of the European Parliament and of the Council of 7 May 2002 on undesirable substances in animal feed. Off. J. Eur. Commun. 2002, 140, 10–23. [Google Scholar]
  21. Devlamynck, R.; Fernandes de Souza, M.; Bog, M.; Leenknegt, J.; Eeckhout, M.; Meers, E. Effect of the growth medium composition on nitrate accumulation in the novel protein crop Lemna minor. Ecotoxicol. Environ. Saf. 2020, 206, 111380. [Google Scholar] [CrossRef] [PubMed]
  22. Sager, J.C.; Mc Farlane, J.C. 1. Radiation. In Plant Growth Chamber Handbook; Langhans, R.W., Tibbitts, T.W., Eds.; Iowa State University of Science and Technology: Ames, IA, USA, 1997; pp. 1–30. [Google Scholar]
  23. Corbala-Robles, L.; Sastafiana, W.N.D.; van Linden, V.; Volcke, E.I.P.; Schaubroeck, T. Life cycle assessment of biological pig manure treatment versus direct land application—A trade-off story. Resour. Conserv. Recycl. 2018, 131, 86–98. [Google Scholar] [CrossRef]
  24. Bodemkundige Dienst van België. Eindrapport: Valorisatie van Resteffluenten Afkomstig van de Mestverwerking (Samenvatting); BDB: Leuven, Belgium, 2004. [Google Scholar]
  25. Van Ranst, E.; Verloo, M.; Demeyer, A.; Pauwesl, J.M. Manual for the Soil Chemistry and Fertility Laboratory: Analytical Methods for Soils and Plants Equipment and Management of Consumables; NUGI 835; University of Ghent: Ghent, Belgium, 1999; ISBN 90-76603-01-4. [Google Scholar]
  26. Casal, J.A.; Vermaat, J.E.; Wiegman, F. A test of two methods for plant protein determination using duckweed. Aquat. Bot. 2000, 67, 61–67. [Google Scholar] [CrossRef]
  27. Xu, Y.-L.; Tan, L.; Guo, L.; Yang, G.-L.; Li, Q.; Lai, F.; He, K.-Z.; Jin, Y.; Du, A.; Fang, Y.; et al. Increasing starch productivity of Spirodela polyrhiza by precisely control the spectral composition and nutrients status. Ind. Crops Prod. 2019, 134, 284–291. [Google Scholar] [CrossRef]
  28. Mohedano, R.A.; Costa, R.H.R.; Tavares, F.A.; Belli Filho, P. High nutrient removal rate from swine wastes and protein biomass production by full-scale duckweed ponds. Bioresour. Technol. 2012, 112, 98–104. [Google Scholar] [CrossRef] [Green Version]
  29. Frick, H. Micronutrient tolerance and accumulation in the duckweed, Lemna. J. Plant Nutr. 1985, 8, 1131–1145. [Google Scholar] [CrossRef]
  30. VLAREM II EMIS Navigator. Available online: https://navigator.emis.vito.be/mijn-navigator?woId=10112 (accessed on 19 February 2018).
  31. Xu, J.; Cheng, J.J.; Stomp, A.-M. Growing Spirodela polyrrhiza in Swine Wastewater for the Production of Animal Feed and Fuel Ethanol: A Pilot Study. CLEAN Soil Air Water 2012, 40, 760–765. [Google Scholar] [CrossRef]
  32. Lasfar, S.; Monette, F.; Millette, L.; Azzouz, A. Intrinsic growth rate: A new approach to evaluate the effects of temperature, photoperiod and phosphorus–nitrogen concentrations on duckweed growth under. Water Res. 2007, 41, 2333–2340. [Google Scholar] [CrossRef]
  33. Hjorth, M.; Christensen, K.V.; Christensen, M.L.; Sommer, S.G. Solid-liquid separation of animal slurry in theory and practice. In Sustainable Agriculture; Springer Netherlands: Dordrecht, The Netherlands, 2009; Volume 2, pp. 953–986. ISBN 9789048126651. [Google Scholar]
  34. Liu, C.; Dai, Z.; Sun, H. Potential of duckweed (Lemna minor) for removal of nitrogen and phosphorus from water under salt stress. J. Environ. Manage. 2017, 187, 497–503. [Google Scholar] [CrossRef] [Green Version]
  35. Kadlec, R.H.; Wallace, S.D. Treatment Wetlands, 2nd ed.Lewis Publishers: New York, NY, USA, 1996; ISBN 0-87371-930-1. [Google Scholar]
  36. Zimmo, O.R.O.; Steen, N.; van der Gijzen, H.J.H.; van der Steen, N.P.; Gijzen, H.J.H. Nitrogen mass balance across pilot-scale algae and duckweed-based wastewater stabilisation ponds. Water Res. 2004, 38, 913–920. [Google Scholar] [CrossRef]
  37. Meers, E.; Tack, F.M.G.; Tolpe, I.; Michels, E. Application of a Full-scale Constructed Wetland for Tertiary Treatment of Piggery Manure: Monitoring Results. Water. Air. Soil Pollut. 2008, 193, 15–24. [Google Scholar] [CrossRef]
  38. CBS. Standardised Calculation Methods for Animal Manure and Nutrients; Statistics: Den Haag, The Netherlands, 2012. [Google Scholar]
  39. European Commission. EU Feed Protein Balance Sheet; EC: Brussels, Belgium, 2020. [Google Scholar]
  40. Papadopoulos, G.A.; Maes, D.G.D.; Janssens, G.P.J. Mineral accretion in nursing piglets in relation to sow performance and mineral source. Vet. Med. 2009, 54, 41–46. [Google Scholar] [CrossRef] [Green Version]
  41. Chojnacka, K. Using biosorption to enrich the biomass of seaweeds from the Baltic Sea with microelements to produce mineral feed supplement for livestock. Biochem. Eng. J. 2008, 39, 246–257. [Google Scholar] [CrossRef]
  42. EFSA Scientific Opinion on the potential reduction of the currently authorised maximum zinc content in complete feed. EFSA J. 2014, 12. [CrossRef] [Green Version]
  43. Heuzé, V.; Tran, G.; Kaushik, S. Soybean Meal; Feedipedia, a programme by INRAE, CIRAD, AFZ and FAO. Available online: https://www.feedipedia.org/node/674 (accessed on 14 May 2021).
Figure 1. The three pilot-scale set-ups in which the influent is mixed and stored (left) before being pumped in the middle cubicontainer where duckweed is grown. With an overflow mechanism, the lower cubicontainer (right) is filled with effluent from the growing system.
Plants 10 01124 g001
Figure 2. Average (top) total phosphorus, (middle) total nitrogen, and (below) potassium content in the growing media of the three cultivation systems (full line) with the linear regression of the concentration over time (dashed line).
Plants 10 01124 g002aPlants 10 01124 g002b
Table 1. The total N, total P and the N to P ratio of LF, BE, and RW (with LF = liquid fraction raw swine manure, BE = Biological effluent of a pig manure treatment facility, and RW = rainwater), together with the calculated composition of the mixture after a non-linear solver technique maximising the LF composition within presented restrictions. The restrictions were found in literature [7,13].
Total NTotal PRatioMass
[mg kg−1][mg/mg] [kg]
LF4800225 4
BE331247 41
RW00 955
Mixture33113.01000
Restrictions350113.0
Table 2. Average composition ± standard deviations of the cultivation cubicontainers at the start and end of the experiment; these compositions are compared with optimal and maximal growing ranges (where LOD means Limit of Detection).
Start (10 September 2019)End (28 October 2019)Optimal Growing RangesMaximal Growing RangesUnit
pH7.0 ± 0.16.8 ± 0.16.5–7.5 α5.0–9.0 α
EC1.0 ± 0.11.1 ± 0.10.6–1.4 α<10.9 αmS/cm
T-N19 ± 219 ± 12.8–350 α<2100 αmg L−1
NO3-0.2 ± 0.25.6 ± 0.32.8–350 α<2100 αmg L−1
PO43-0.8 ± 0.00.5 ± 00.4–11 α<55 αmg L−1
T-P20 ± 021 ± 00.4–11 α<55 αmg L−1
K132 ± 9200 ± 1339–780 α<2000 αmg L−1
Cl16 ± 329 ± 30.4–36 α<3500 αmg L−1
T-S17 ± 123 ± 248–1900 α<4800 αmg L−1
Ca15 ± 017 ± 020–400 α<2000 αmg L−1
Mg5.9 ± 0.38.8 ± 0.75.0–97 α<1200 αmg L−1
Fe0.53 ± 0.070.51 ± 0.06<27.9 β<100 βmg L−1
Mn16 ± 149 ± 7<54,900 β<274,500 βµg L−1
Cu8.3 ± 6.33.4 ± 2.6<3200 β<6300 βµg L−1
Zn28 ± 2311 ± 8<6500 β<65,300 βµg L−1
As<LOD<LOD
Cd<LOD<LOD
Pd<LOD<LOD
Source: α [13], β [29].
Table 3. Summary of the daily accumulation rate of several parameters with their according significance value and interpretation.
ParameterAccumulation RateUnitp-ValueInterpretation
pH 0.432Constant
EC3.88mS cm−1 d−10.042Accumulation
T-N 0.541Constant
NO30.12mg L−1 d−10.000Accumulation
PO43−−0.004mg L−1 d−10.000Depletion
T-P 0.685Constant
K1.09mg L−1 d−10.000Accumulation
Cl0.18mg L−1 d−10.000Accumulation
T-S0.11mg L−1 d−10.000Accumulation
Ca0.037mg L−1 d−10.0004Accumulation
Mg0.045mg L−1 d−10.000Accumulation
Fe 0.363Constant
Mn−0.15µg L−1 d−10.022Depletion
Cu 0.402Constant
Zn 0.662Constant
As<LOD <LOD
Cd<LOD <LOD
Pd<LOD <LOD
Table 4. Average composition, uptake rate, removal rate and relative uptake rate of the removal by duckweed ± standard deviations (LOD stands for limit of detection).
ContentUptakeRemovalRelative Uptake
[mg g−1 DW][mg m−2 d−1][mg m−2 d−1]
N60 ± 4264 ± 1231107 ± 71524%
P13 ± 158 ± 31149 ± 15039%
K52 ± 10233 ± 8572 ± 3002102%
S6.1 ± 0.827 ± 1547 ± 31859%
Mg2.8 ± 0.212 ± 532 ± 10338%
Ca11 ± 144 ± 18242 ± 38318%
Fe1 ± 14.7 ± 14.544 ± 6311%
Zn0.25 ± 0.041.2 ± 0.72.4 ± 2.849%
[µg g−1 DW][µg m−2 d−1][µg m−2 d−1]
Cu16 ± 1582 ± 179910 ± 11009%
As0.32 ± 0.191.2 ± 2.0<LOD
Cd0.1 ± 0.10.43 ± 1.05<LOD
Pb3.0 ± 5.20.41 ± 11.36<LOD
Table 5. Recommended levels of micronutrients in livestock feed and the content of these elements in conventional feeds per kg dry matter (DM), adapted from Chojnacka (2008) [41], and duckweed (results from the present study ± standard deviations). The data of soybean meal was retrieved from Feedipedia [43].
Feeding Standard/MaterialMnZnCuFe
[mg kg−1 DM][mg kg−1 DM][mg kg−1 DM][mg kg−1 DM]
Feeding standard for laying hens60–7050–605–660–70
Feeding standard for swine30–4020–16570–15090–100
Maximum limit piglets & sows <150
Corn (grain)5153.326
Oat (grain)38183.352
Wheat (grain)26232.743
Rye (grain)58263.360
Potatoes (steamed)351.116
Fodder yeasts14912.690
Soybean meal445717201
Duckweed410 ± 60250 ± 4010 ± 2372 ± 87
Publisher’s Note: MDPI stays neutral with regard to jurisdictional claims in published maps and institutional affiliations.

