
Modeling of Cowpea (Vigna unguiculata) Yield and Control Insecticide Exposure in a Semi-Arid Region


Abstract
1. Introduction
2. Results
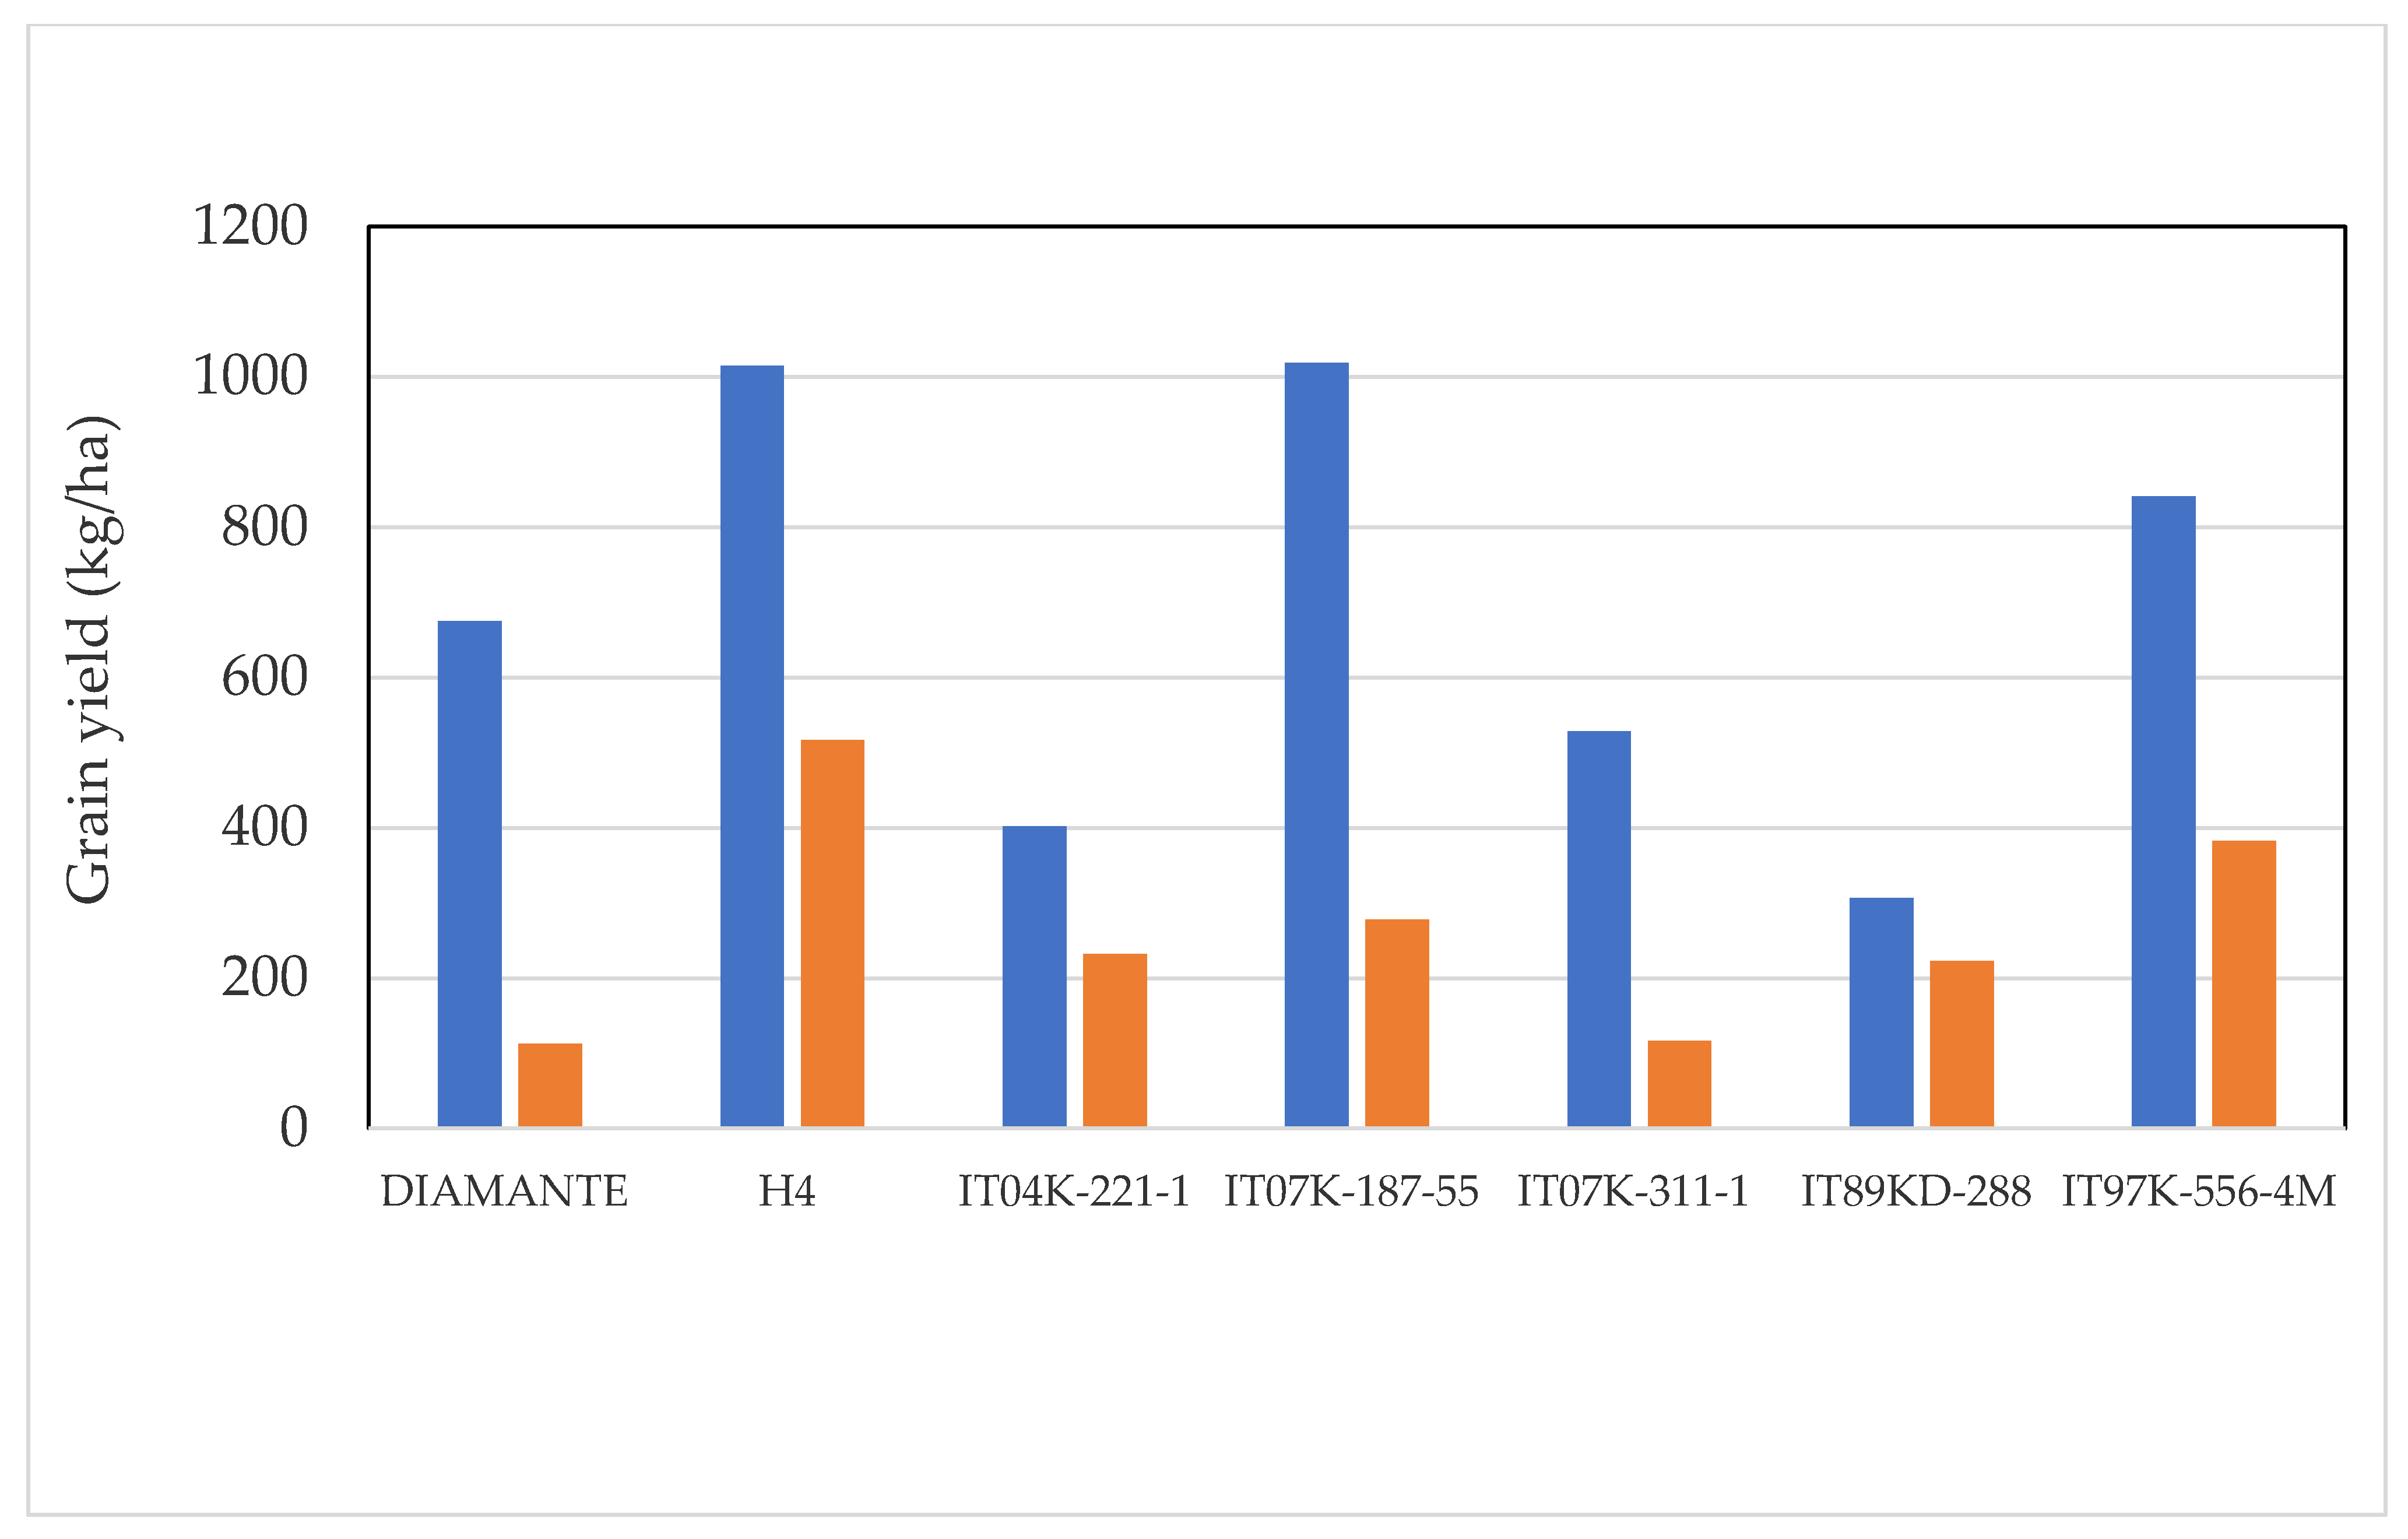
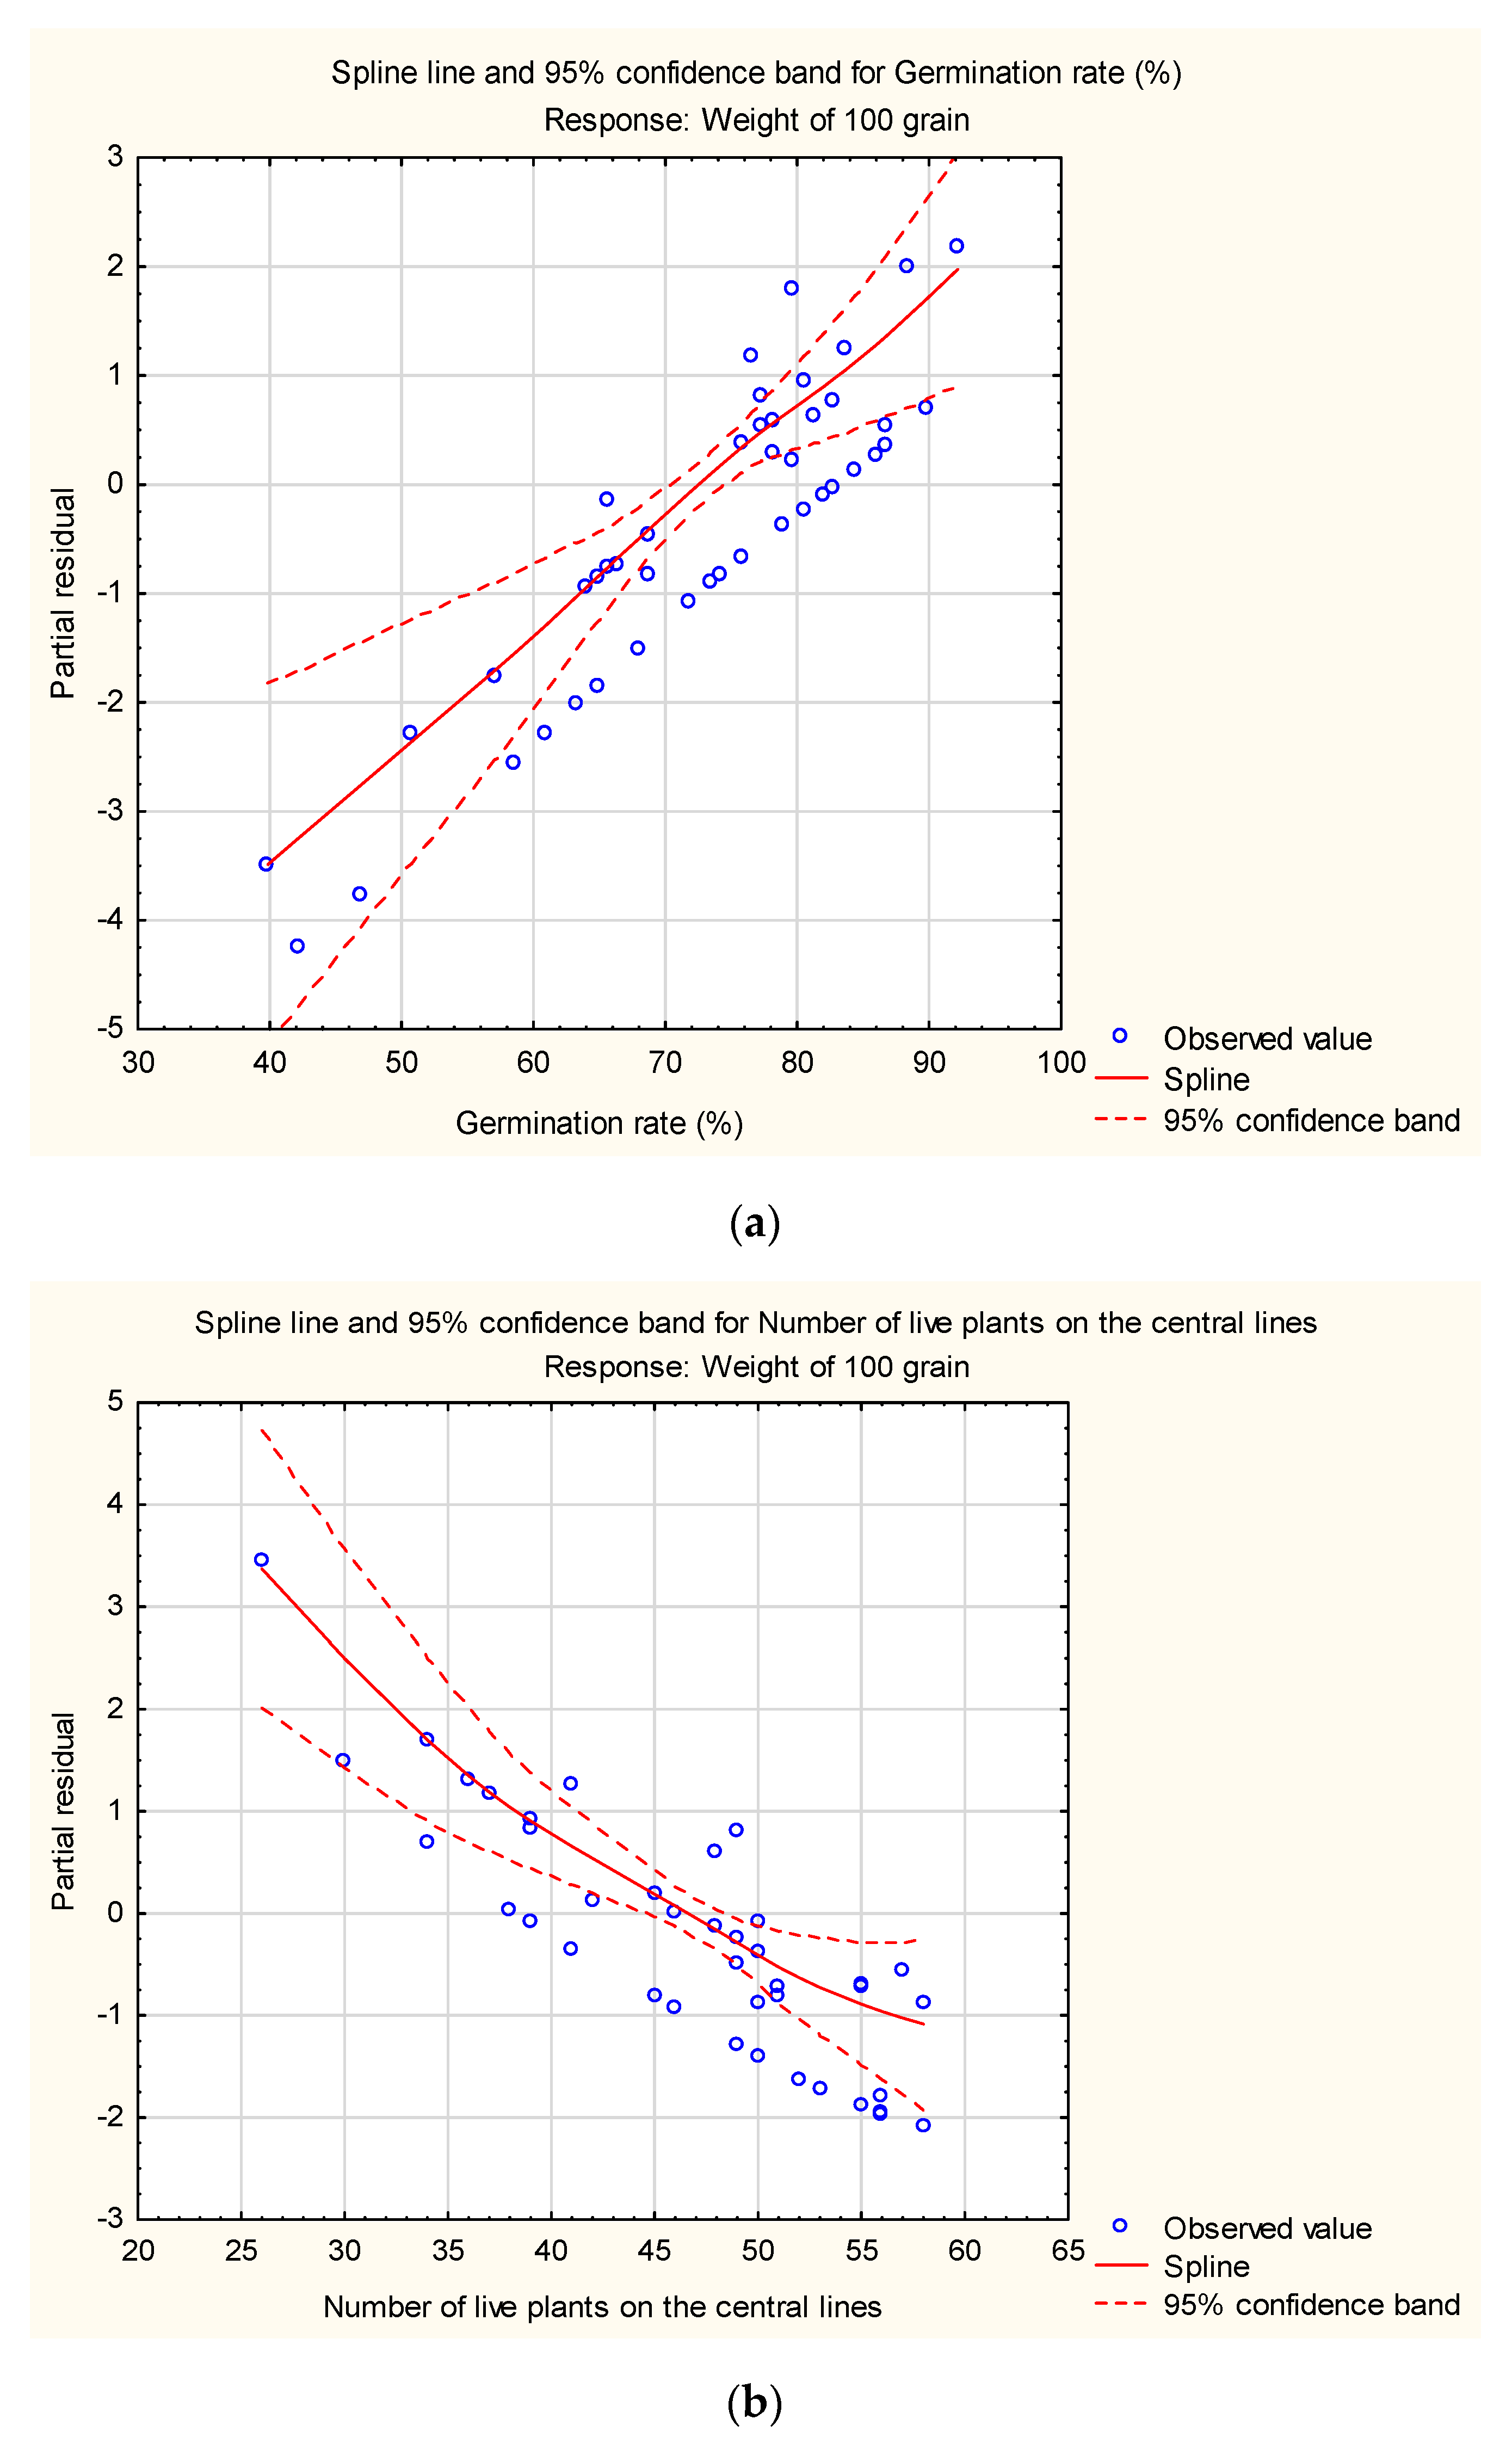
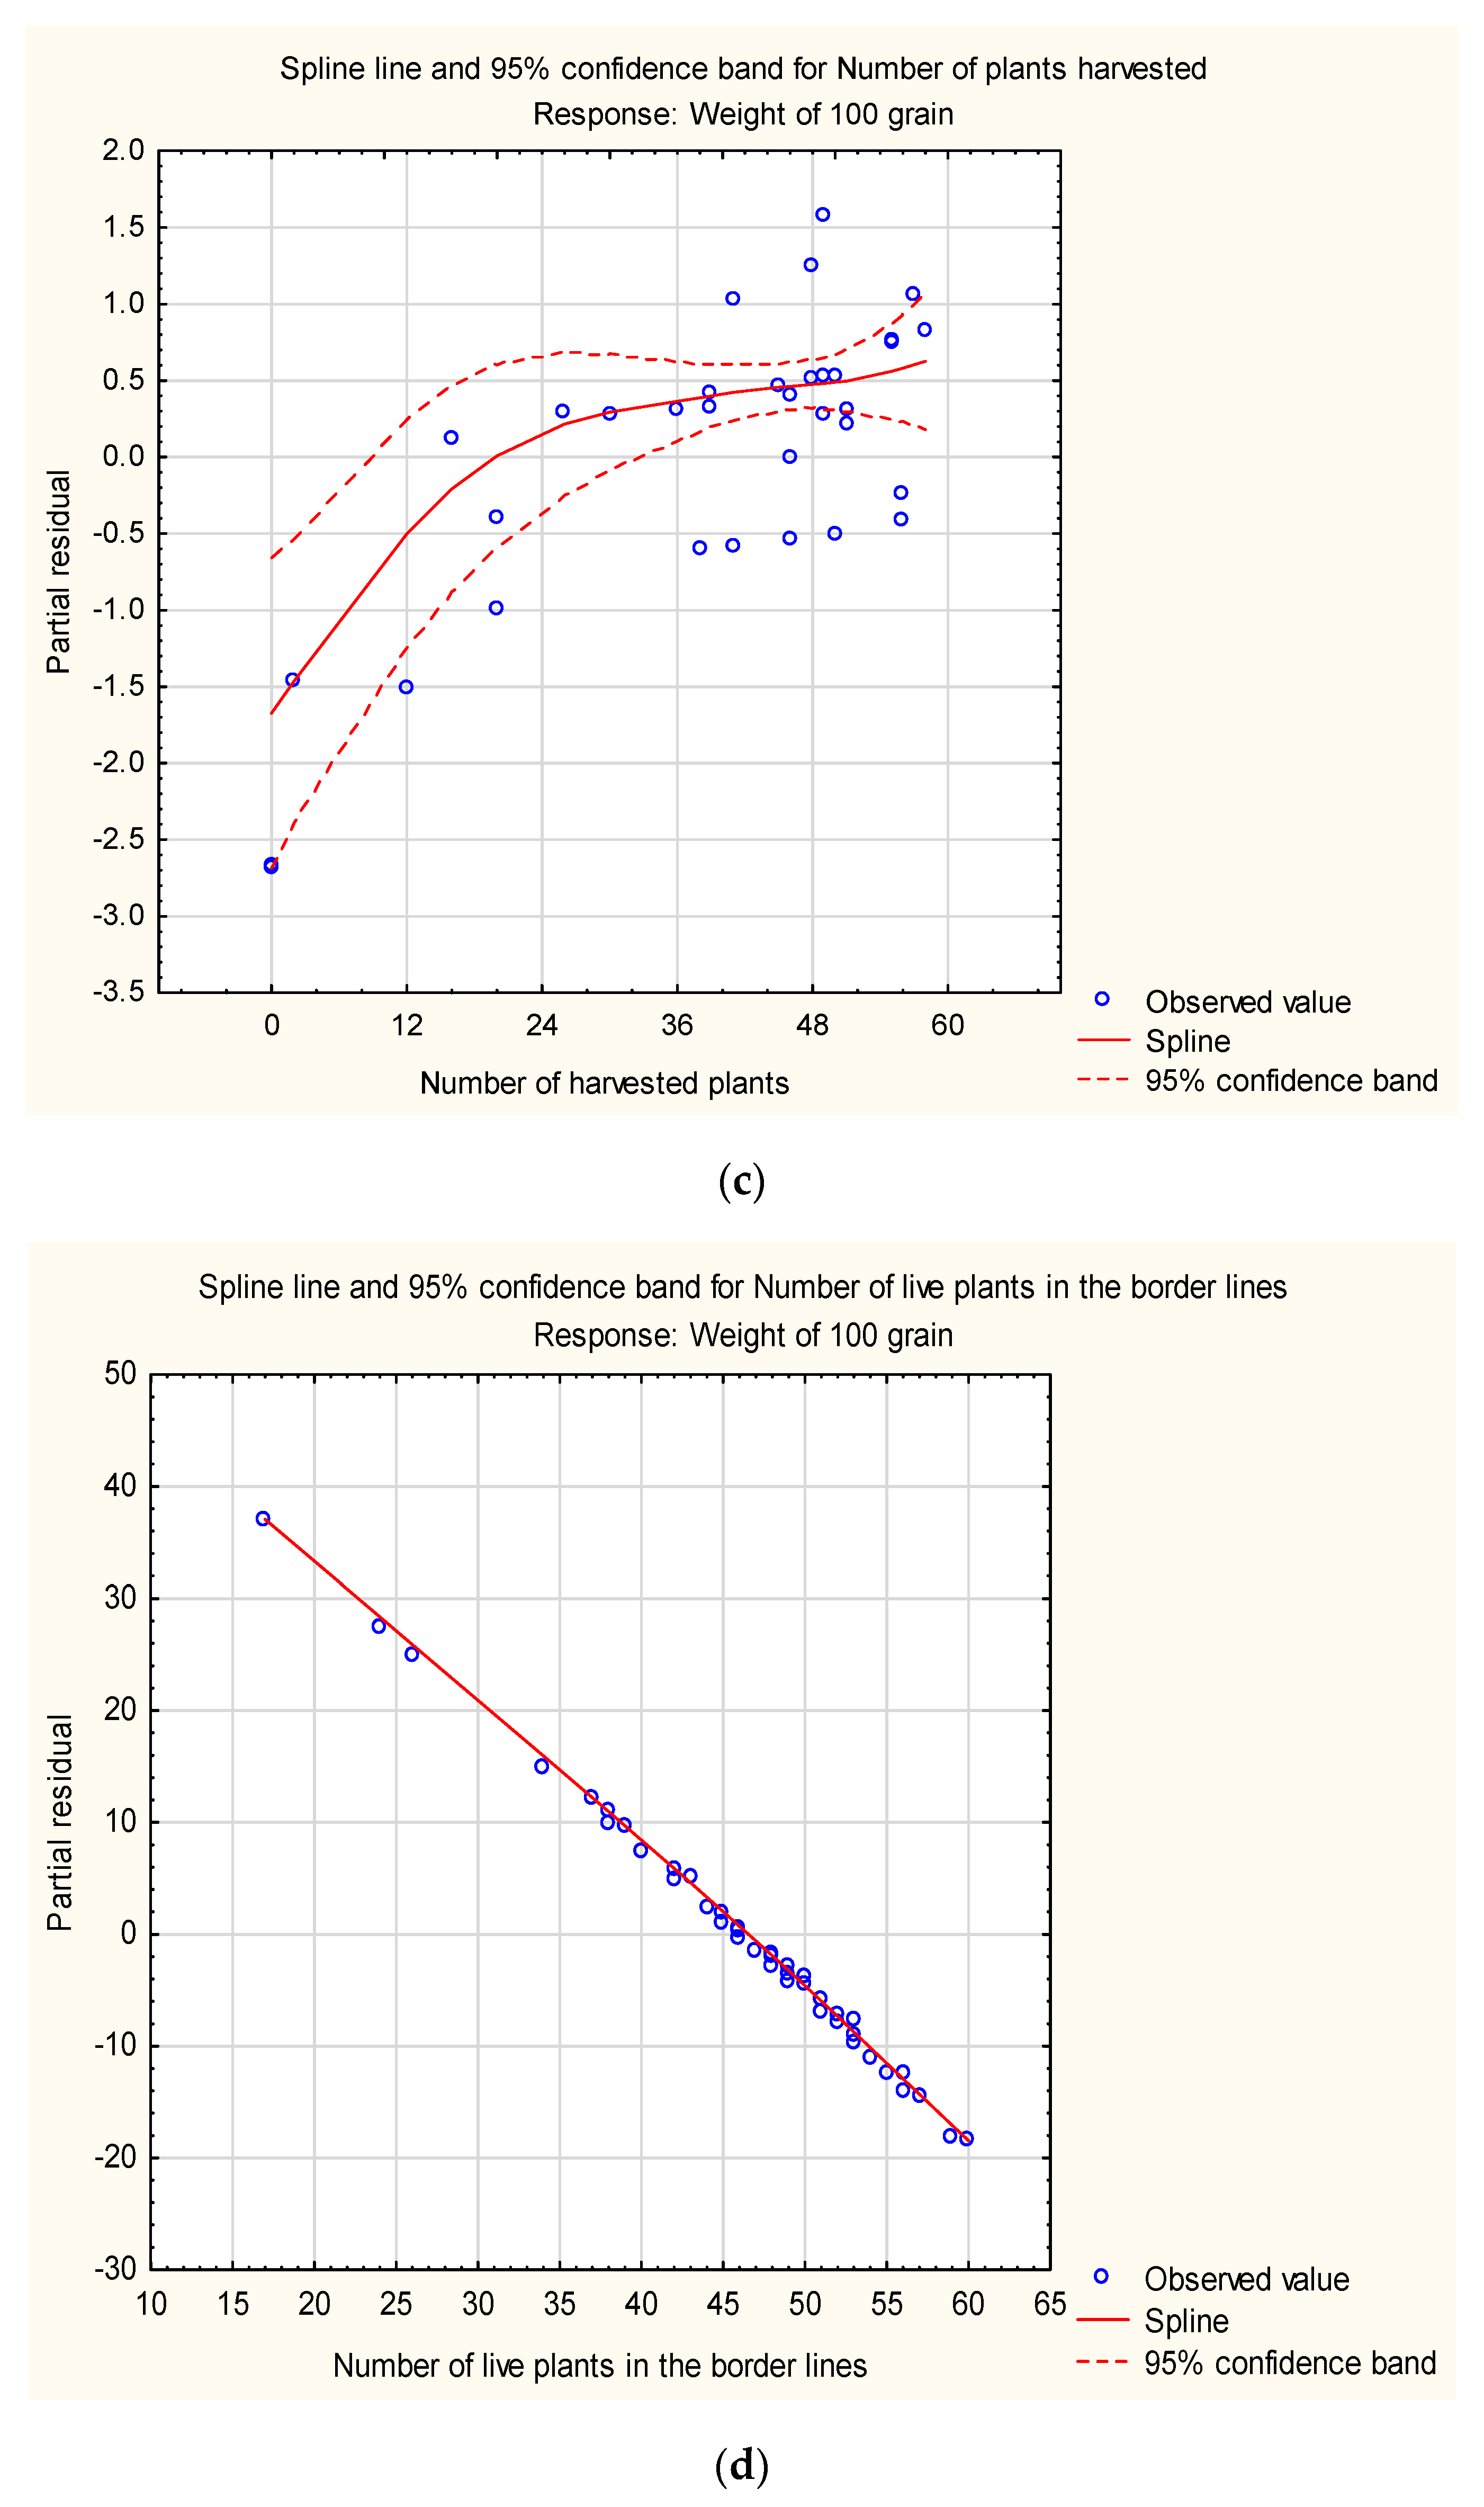
2.1. Grain Production
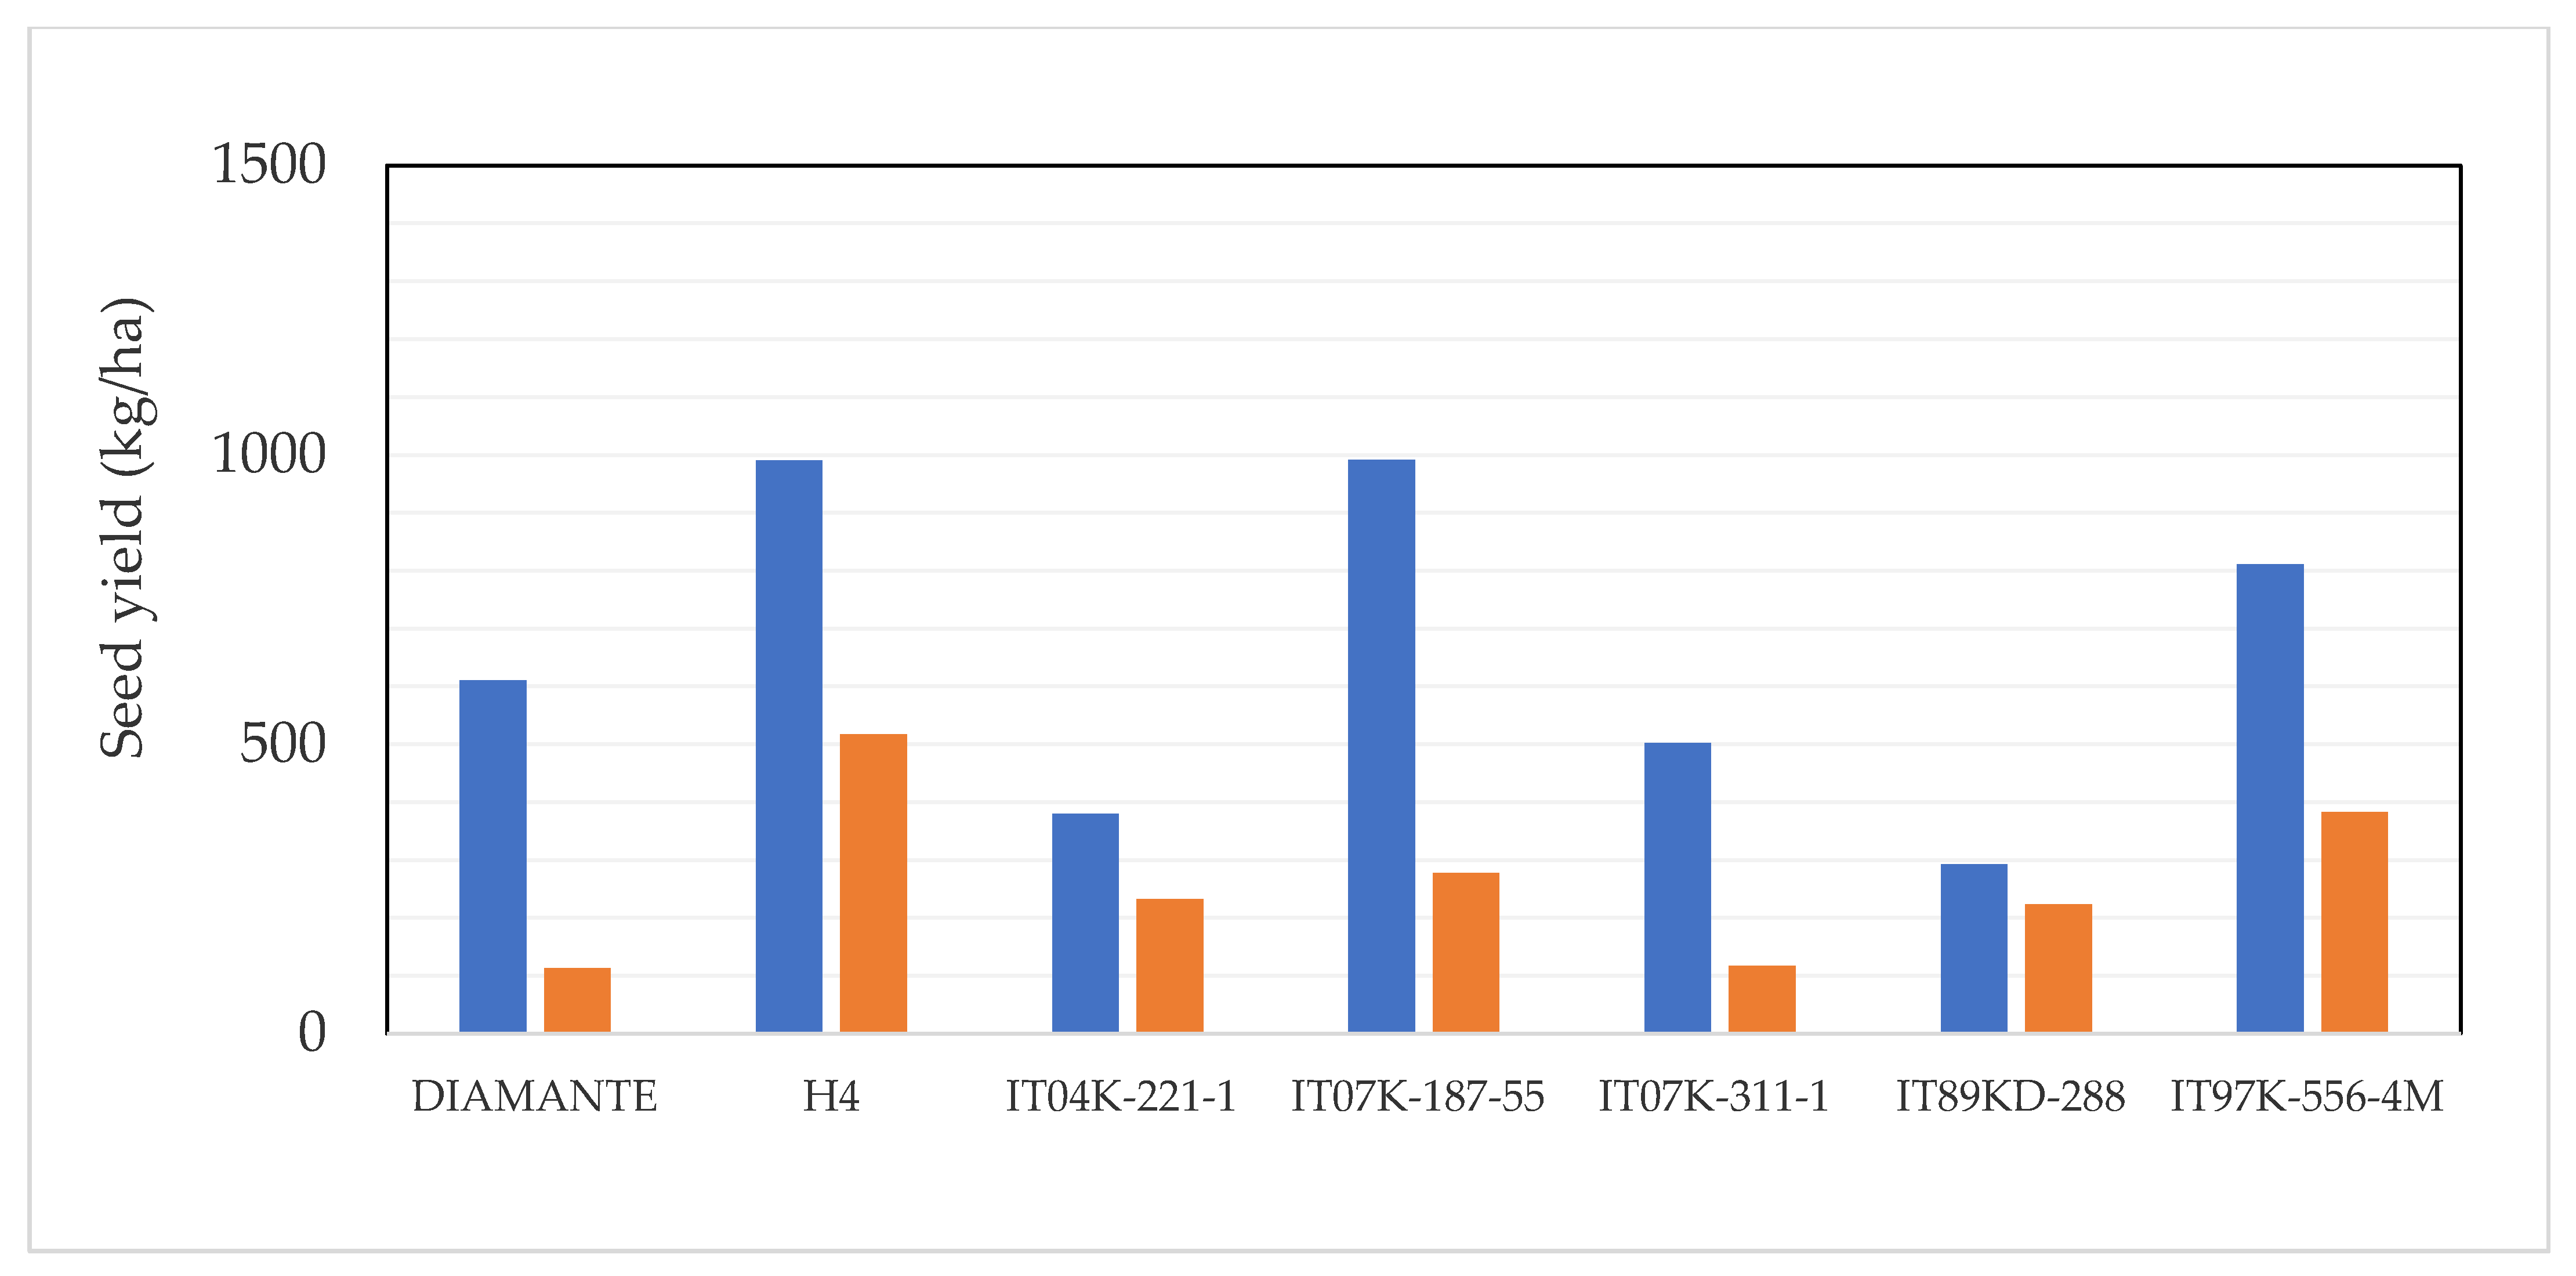
2.2. Seed Production
3. Discussion
3.1. Influence of Pesticides on Germination and Anthesis
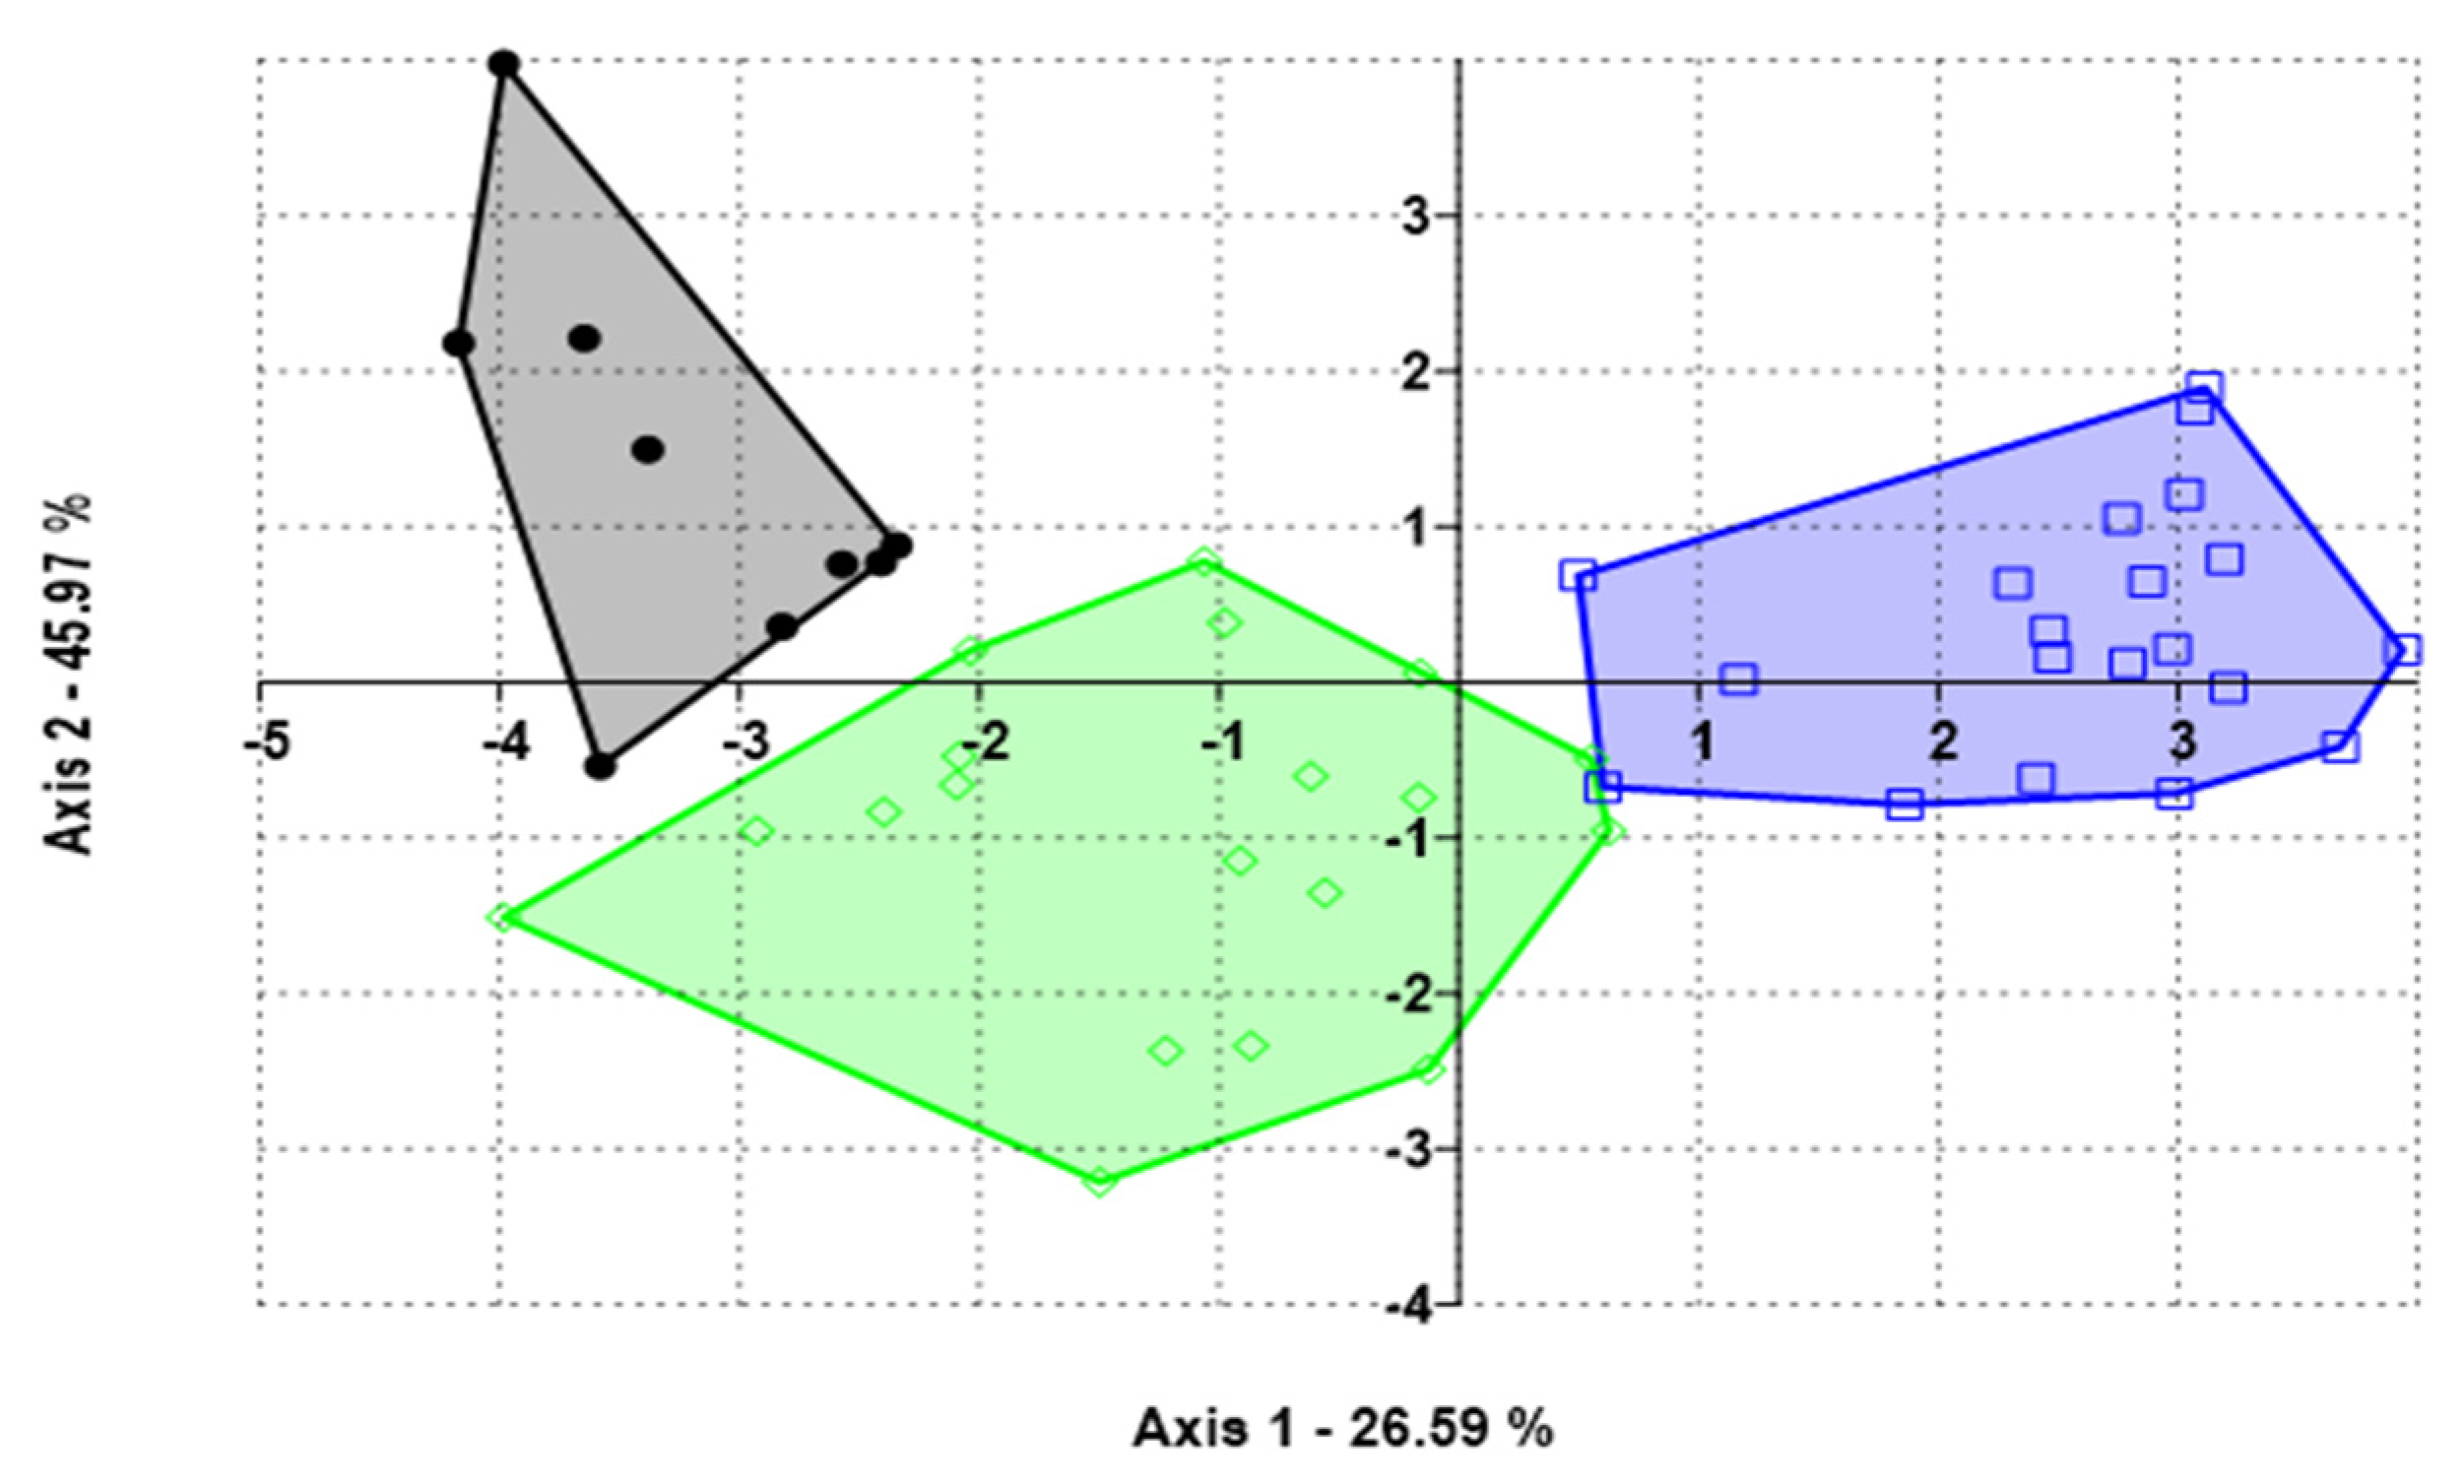
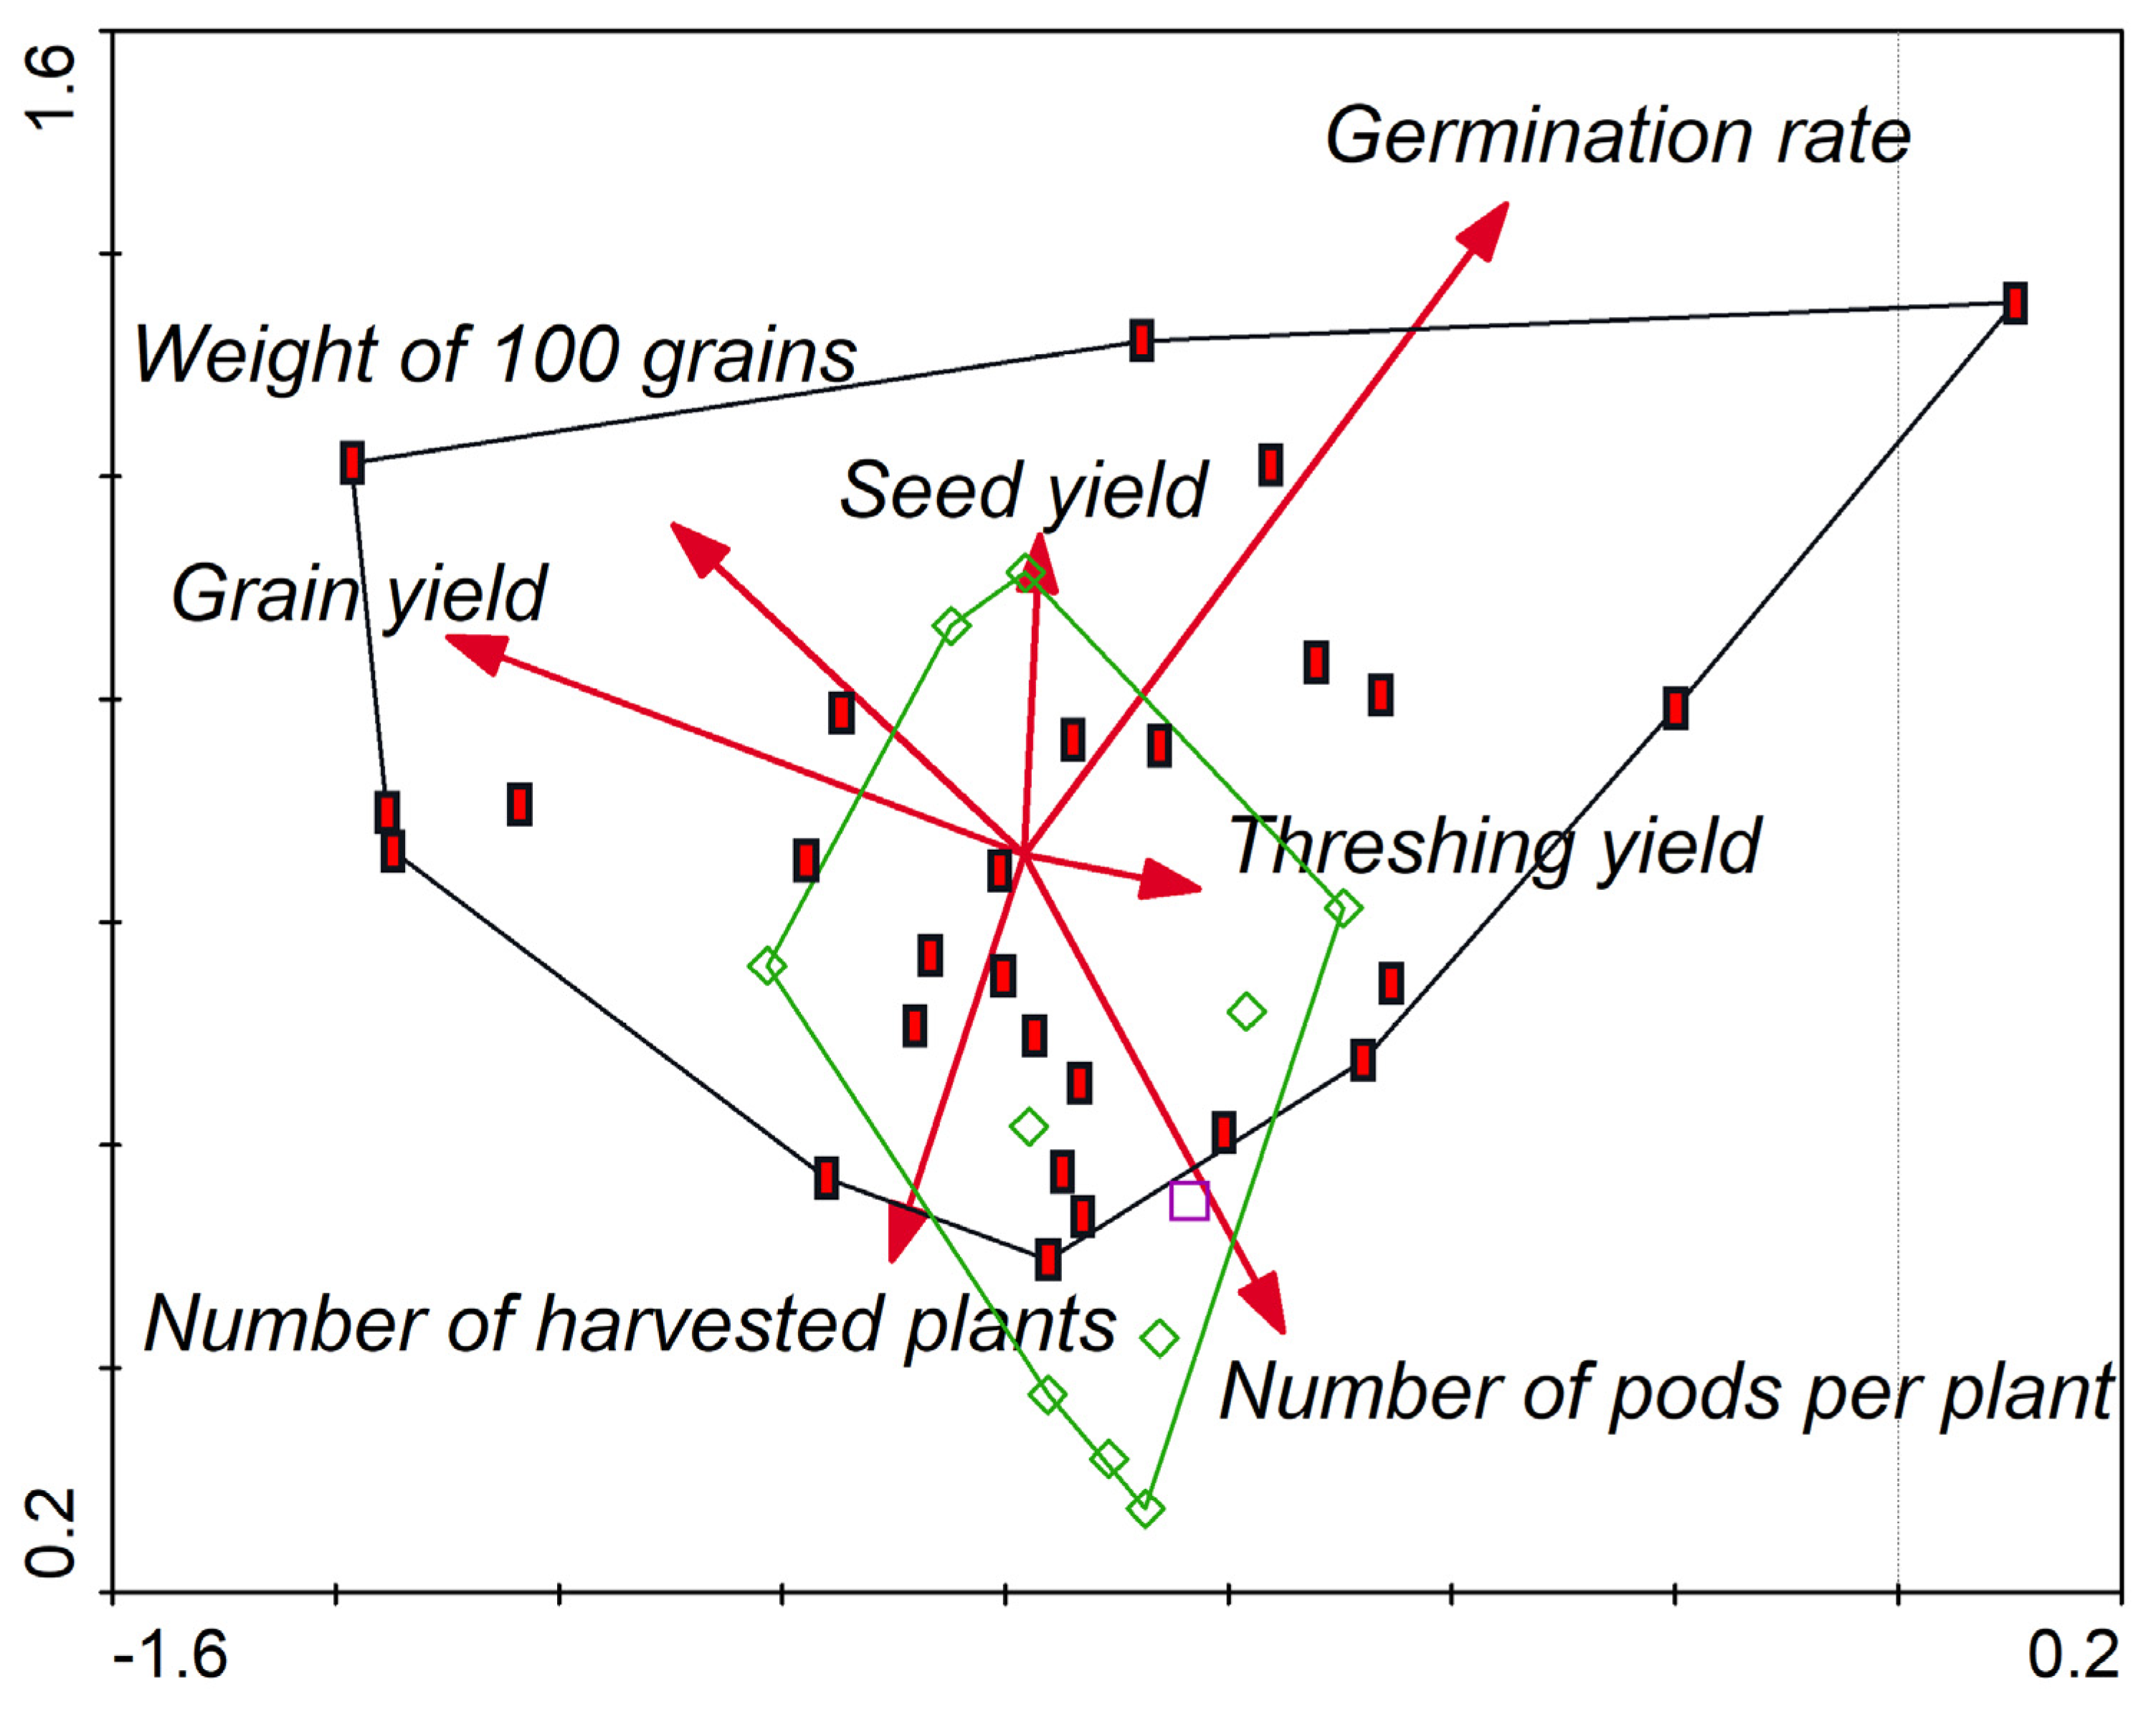
3.2. Selection of the Best Genotypes for the Field
3.3. Control Management of Insecticide in Semi-Arid Region
4. Materials and Methods
4.1. Study Area
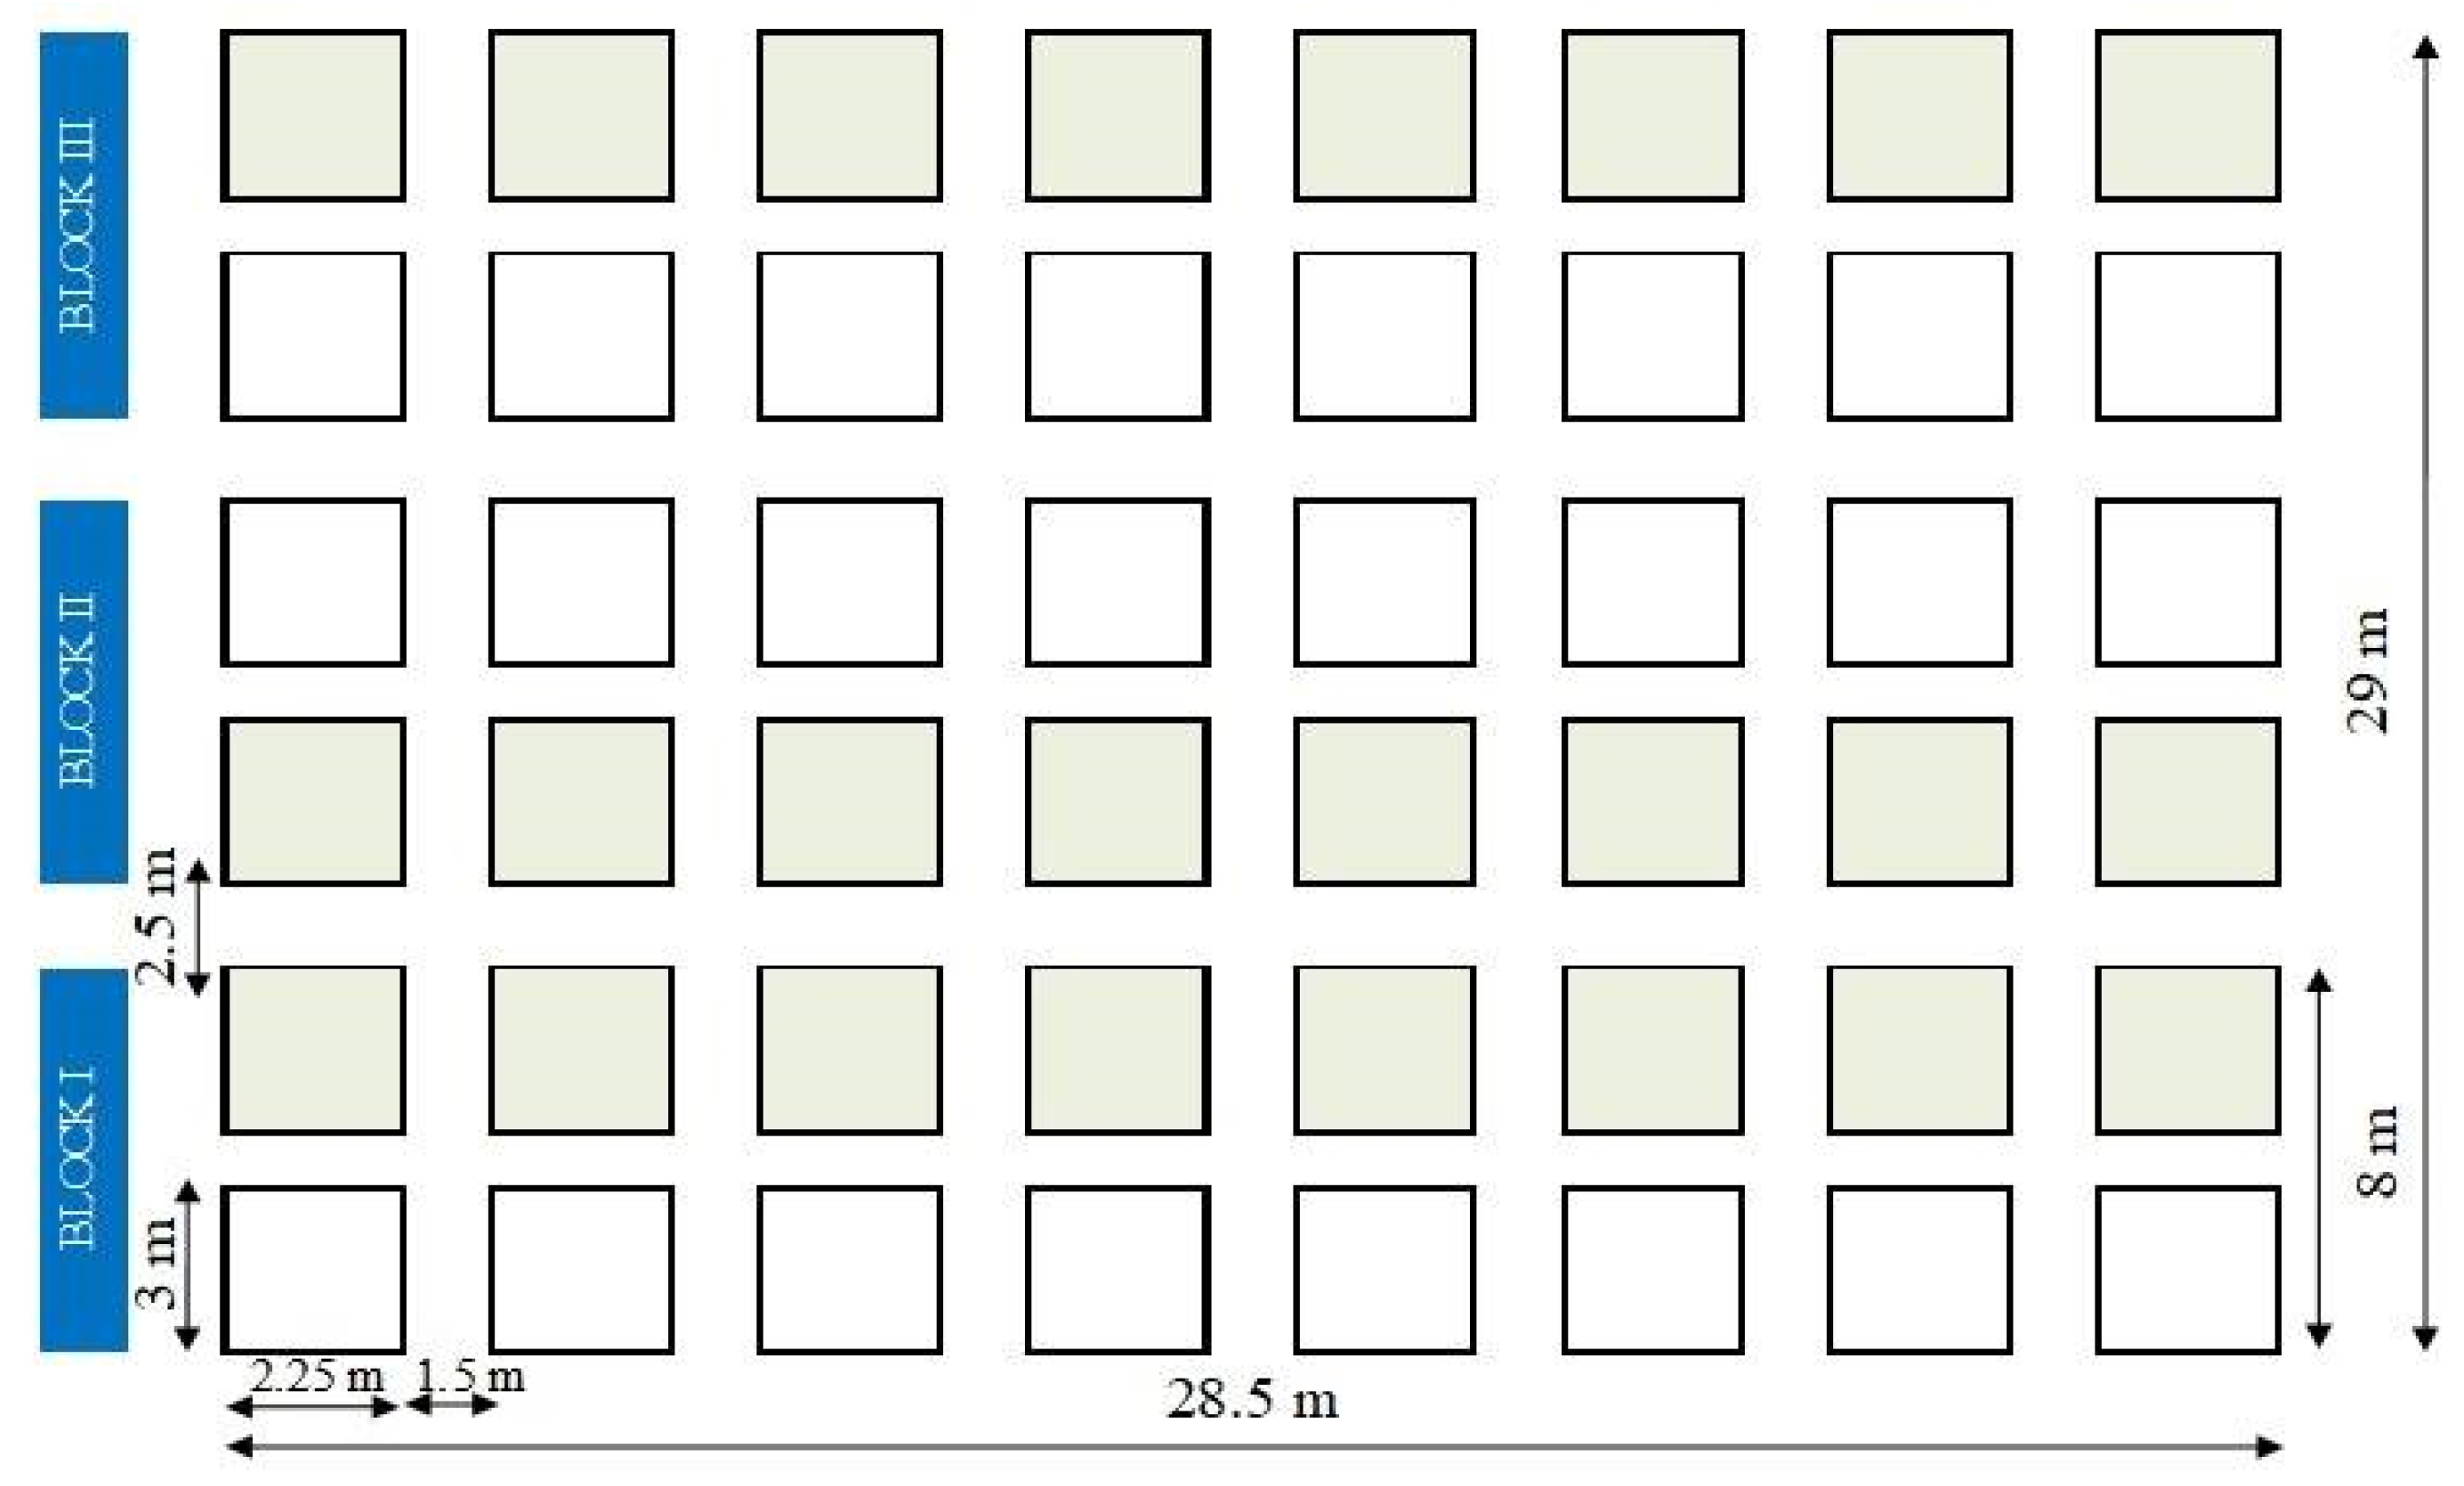
4.2. Sampling Method Experimental Layout and Design
4.3. Statistical Data Handling
- g—link function (the identical function),
- y—response variable (depends linearly on unknown smooth functions),
- x1… xn—independent variables (predictor variables),
- f1, …, fp—smooth functions (splines),
- i = 1, …, N,
- β—an intercept,
- Ɛ—random error (a constant error variance is assumed).
- f—smooth functions,
- q—basis dimension,
- b—the sum of basis functions,
- β—corresponding regression coefficients.
5. Conclusions
Author Contributions
Funding
Institutional Review Board Statement
Informed Consent Statement
Data Availability Statement
Acknowledgments
Conflicts of Interest
References
- Parmar, V.; Singh, S.N.; Tiwari, G.P.; Singh, P. Relative efficacy of Bio pesticides in managment of Dry root rot and collar rot in soyabean and chickpea. Int. J. Chem. Stud. 2018, 62, 83–86. [Google Scholar]
- Boone, C. Legal empowerment of the poor through property rights reform: Tensions and trade-offs of land registration and titling in sub-Saharan Africa. J. Dev. Stud. 2019, 553, 384–400. [Google Scholar] [CrossRef]
- Falayi, M.; Shackleton, S.E.; Cundill Kemp, G.; Shackleton, C.M. Changes in household use and sale of locally collected environmental resources over a 15-year period in a rural village South Africa. For. Trees Livelihoods 2019, 28, 1–18. [Google Scholar] [CrossRef]
- Foyer, C.H.; Siddique, K.H.; Tai, A.P.; Anders, S.; Fodor, N.; Wong, F.L.; Zabel, F. Modelling predicts that soybean is poised to dominate crop production across Africa. Plant Cell Environ. 2019, 421, 373–385. [Google Scholar] [CrossRef] [PubMed]
- Glover, S.; Jones, S. Can commercial farming promote rural dynamism in sub-Saharan Africa? Evidence from Mozambique. World Dev. 2019, 114, 110–121. [Google Scholar] [CrossRef]
- Swemmer, A.M.; Mashele, M.; Ndhlovu, P.D. Evidence for ecological sustainability of fuelwood harvesting at a rural village in South Africa. Reg. Environ. Chang. 2019, 192, 403–413. [Google Scholar] [CrossRef]
- Rusere, F.; Mkuhlani, S.; Crespo, O.; Dicks, L.V. Developing pathways to improve small holder agricultural productivity through ecological intensification technologies in semi-arid Limpopo South Africa. Afr. J. Sci. Technol. Innov. Dev. 2019, 11, 1–11. [Google Scholar]
- Sahle, M.; Saito, O.; Fürst, C.; Demissew, S.; Yeshitela, K. Future land use management effects on ecosystem services under different scenarios in the Wabe River catchment of Gurage Mountain chain landscape Ethiopia. Sustain. Sci. 2019, 141, 175–190. [Google Scholar] [CrossRef]
- Samuels, M.I.; Allsopp, N.; Hoffman, M.T. traditional mobile pastoralism in a contemporary semiarid rangeland in Namaqualand South Africa. Rangeland Ecol. Manag. 2019, 721, 195–203. [Google Scholar] [CrossRef]
- Scoones, I.; Murimbarimba, F.; Mahenehene, J. Irrigating Zimbabwe after land reform: The potential of farmer-led systems. Water Altern. 2019, 121, 88–106. [Google Scholar]
- Du Preez, C.C.; Van Huyssteen, C.W.; Mnkeni, P.N. Land use and soil organic matter in South Africa 2: A review on the influence of arable crop production. S. Afr. J. Sci. 2011, 1075, 35–42. [Google Scholar] [CrossRef]
- Enahoro, D.; Mason-D’Croz, D.; Mul, M.; Rich, K.M.; Robinson, T.P.; Thornton, P.; Staal, S.S. Supporting sustainable expansion of livestock production in South Asia and Sub-Saharan Africa: Scenario analysis of investment options. Glob. Food Secur. 2019, 20, 114–121. [Google Scholar] [CrossRef]
- Ochieng, J.; Schreinemachers, P.; Ogada, M.; Dinssa, F.F.; Barnos, W.; Mndiga, H. Adoption of improved amaranth and good agricultural practices in East Africa. Land Use Policy 2019, 83, 187–194. [Google Scholar] [CrossRef]
- Ba, M.N.; Huesing, J.E.; Tamò, M.; Higgins, T.J.; Pittendrigh, B.R.; Murdock, L.L. An assessment of the risk of Bt-cowpea to non-target organisms in West Africa. J. Pest Sci. 2018, 91, 1165–1179. [Google Scholar] [CrossRef]
- Lin, L.; Zhi, H. Influence of silkworm excrement soil amendments on acidic soil and growth of Vigna unguiculata. J. Agric. Sci. Technol. Beijing 2018, 204, 108–114. [Google Scholar]
- Lo, S.; Muñoz-Amatriaín, M.; Boukar, O.; Herniter, I.; Cisse, N.; Guo, Y.N.; Roberts, P.A.; Xu, S.; Fatokun, C.; Close, T.J. Identification of QTL controlling domestication-related traits in cowpea Vigna unguiculata L. walp. Sci. Rep. 2018, 81, 6261. [Google Scholar] [CrossRef]
- Shackleton, C.M.; Mograbi, P.J.; Drimie, S.; Fay, D.; Hebinck, P.; Hoffman, M.T.; Twine, W. Deactivation of field cultivation in communal areas of South Africa: Patterns drivers and socio-economic and ecological consequences. Land Use Policy 2019, 82, 686–699. [Google Scholar] [CrossRef]
- Mkuhlani, S.; Crespo, O.; Rusere, F.; Zhou, L.; Francis, J. Classification of small-scale farmers for improved rainfall variability management in South Africa. Agroecol. Sustain. Food Syst. 2019, 44, 1–23. [Google Scholar] [CrossRef]
- Abboud, S.C. Introdução a Agronomia. Rio de Janeiro; Interciência, Rua Verna deMagalhães, 66-Engenho Novo: Rio de Janeiro, Brazil, 2013; pp. 359–394. ISBN 978-8571933040. [Google Scholar]
- Busse, M.; Erdogan, C.; Mühlen, H. Structural transformation and its relevance for economic growth in Sub Saharan Africa. Rev. Dev. Econ. 2019, 231, 33–53. [Google Scholar] [CrossRef]
- Horn, L.; Shimelis, H.; Sarsu, F.; Mwadzingeni, L.; Laing, M.D. Genotype-by-environment interaction for grain yield among novel cowpea Vigna unguiculata L selections derived by gamma irradiation. Crop J. 2018, 63, 306–313. [Google Scholar] [CrossRef]
- Musokwa, M.; Mafongoya, P.; Lorentz, S. Evaluation of agroforestry systems for maize Zea mays productivity in South Africa. S. Afr. J. Plant Soil. 2019, 361, 65–67. [Google Scholar] [CrossRef]
- Mustafa, M.A.; Mayes, S.; Massawe, F. Crop diversification through a wider use of underutilised crops: A strategy to ensure food and nutrition security in the face of climate change. In Sustainable Solutions for Food Security; Sarkar, A., Sensarma, S., vanLoon, G., Eds.; Springer: Cham, Switzerland, 2019; pp. 125–149. [Google Scholar]
- Patient, D.F.; Nchiwan, N.E.; Koehler, H. Abundance and diversity of insect pests on maize cowpea and okra in a comparative experiment testing effects of intercropping and insecticide in the Cameroonian Guinean Savannah and Sudano Sahelian agro-ecological zones. J. Exp. Agric. Int. 2019, 29, 1–20. [Google Scholar] [CrossRef]
- Gerrano, A.S.; Jansen van Rensburg, W.S.; Kutu, F.R. Agronomic evaluation and identification of potential cowpea Vigna unguiculata L Walp genotypes in South Africa. Acta Agric. Scand. Sect. B Soil Plant Sci. 2018, 69, 1–9. [Google Scholar] [CrossRef]
- Munthali, M.G.; Davis, N.; Adeola, A.M.; Botai, J.O.; Kamwi, J.M.; Chisale, H.L.; Orimoogunje, O.O. Local perception of drivers of land-use and land-cover change dynamics across Dedza district Central Malawi region. Sustainability 2019, 11, 832. [Google Scholar] [CrossRef]
- Das, A.; Devi, M.T.; Babu, S.; Ansari, M.; Layek, J.; Bhowmick, S.N.; Singh, R. Cereal-legume cropping system in indian himalayan region for food and environmental sustainability. In Legumes for Soil Health and Sustainable Management; Meena, R., Das, A., Yadav, G., Lal, R., Eds.; Springer: Singapore, 2018; pp. 33–76. [Google Scholar]
- Handavu, F.; Chirwa, P.W.; Syampungani, S. Socio-economic factors influencing land-use and land-cover changes in the miombo woodlands of the Copperbelt province in Zambia. For. Policy Econ. 2019, 100, 75–94. [Google Scholar] [CrossRef]
- Illo, A.I.; Kamba, A.A.; Umar, S.; Abubakar, A. Analysis of crop residues availability for animal feed in Kebbi state Nigeria. Int. J. Agric. Ext. 2018, 62, 89–97. [Google Scholar] [CrossRef]
- Mbiba, M.; Collinson, M.; Hunter, L.; Twine, W. Social capital is subordinate to natural capital in buffering rural livelihoods from negative shocks: Insights from rural South Africa. J. Rural Stud. 2019, 65, 12–21. [Google Scholar] [CrossRef]
- Birhane, E.; Ashfare, H.; Fenta, A.A.; Hishe, H.; Gebremedhin, M.A.; Solomon, N. Land use land cover changes along topographic gradients in Hugumburda national forest priority area Northern Ethiopia. Remote Sens. Appl. Soc. Environ. 2019, 13, 61–68. [Google Scholar] [CrossRef]
- Buyinza, J.; Muthuri, C.W.; Downey, A.; Njoroge, J.; Denton, M.D.; Nuberg, I.K. Contrasting water use patterns of two important agroforestry tree species in the Mt Elgon region of Uganda. Aust. For. 2019, 82, 1–9. [Google Scholar] [CrossRef]
- Musvoto, C.; de Lange, W.J. A framework for selecting crops for irrigation using mining contaminated water: An example from the Olifants basin of South Africa. J. Environ. Manag. 2019, 231, 49–58. [Google Scholar] [CrossRef]
- Mtyobile, M.; Muzangwa, L.; Mnkeni, P.N.S. Tillage and crop rotation effects on selected soil chemical properties and wheat yield in a sandy loam oakleaf soil in the Eastern Cape South Africa. Int. J. Agric. Biol. 2019, 212, 367–374. [Google Scholar]
- Dieni, Z.; Tignegre, J.B.D.L.S.; Tongoona, P.; Dzidzienyo, D.; Asante, I.K.; Ofori, K. Identification of sources of resistance to Alectra vogelii in cowpea Vigna unguiculata L. Walp germplasm from Burkina Faso. Euphytica 2018, 21412, 234. [Google Scholar] [CrossRef]
- Omoregie, A.O.; Ogedegbe, A.B.O. Variation of grasshopper abundance in light and heavy rain periods, significant for effective pest control measures. NISEB J. 2019, 11, 243–250. [Google Scholar]
- Famutimi, O.G.; Adewale, I.O. Induction and catalytic properties of grasshopper (Zonocerus variegatus) glutathione transferase fed on different food plants. Comparat. Biochem. Physiol. Part C Toxicol. Pharmacol. 2021, 241, 108970. [Google Scholar] [CrossRef]
- Eziashi, E.I.; Chidi, N.I. Pathogenicity of entomopathogenic Entomophthora grylli on grasshoppers Diabolocatantops axillaris and Zonocerus variegatus causing leaf damage of shea tree seedlings. J. Agric. Crop. Res. 2017, 5, 11–16. [Google Scholar]
- Heinze, C.; Dundão, M.D.F.; Neinhuis, C.; Lautenschläger, T. Economic potential of selected native plants from Cuanza Norte Northern Angola. Econ. Bot. 2019, 73, 1–16. [Google Scholar] [CrossRef]
- Mabhaudhi, T.; Chibarabada, T.P.; Chimonyo, V.G.P.; Murugani, V.G.; Pereira, L.M.; Sobratee, N.; Govender, L.; Slotow, R.; Modi, A.T. Mainstreaming underutilized indigenous and traditional crops into food systems: A South African perspective. Sustainability 2019, 111, 172. [Google Scholar] [CrossRef]
- Bessah, E.; Bala, A.; Agodzo, S.K.; Okhimamhe, A.A.; Boakye, E.A.; Ibrahim, S.U. The impact of crop farmers’ decisions on future land use land cover changes in Kintampo North Municipality of Ghana. Int. J. Clim. Chang. Strateg. Manag. 2019, 111, 72–87. [Google Scholar] [CrossRef]
- Ayelazuno, J.A. Water and land investment in the “overseas” of Northern Ghana: The land question agrarian change and development implications. Land Use Policy 2019, 81, 915–928. [Google Scholar] [CrossRef]
- Adivappar, N.; Manjesh, M. Impact of frontline demonstrations on productivity and economics of yardlong bean Vigna unguiculata subsp sesquipedalis L. verde. Int. J. Farm Sci. 2018, 81, 86–89. [Google Scholar] [CrossRef]
- Bennett, B.M.; Van Sittert, L. Historicising perceptions and the national management framework for invasive alien plants in South Africa. J. Environ. Manag. 2019, 229, 174–181. [Google Scholar] [CrossRef]
- Berg, H.; Tam, N.T. Decreased use of pesticides for increased yields of rice and fish-options for sustainable food production in the Mekong Delta. Sci. Total Environ. 2018, 619, 319–327. [Google Scholar] [CrossRef]
- Bhugeloo, A.; Peerbhay, K.; Ramdhani, S. Tracking indigenous forest cover within an urban matrix through land use analysis: The case of a rapidly developing African city. Remote Sens. Appl. Soc. Environ. 2019, 13, 328–336. [Google Scholar] [CrossRef]
- Brainard, D.C.; Bryant, A.; Noyes, D.C.; Haramoto, E.R.; Szendrei, Z. Evaluating pest-regulating services under conservation agriculture: A case study in snap beans. Agric. Ecosyst. Environ. 2016, 235, 142–154. [Google Scholar] [CrossRef]
- Cozma, P.; Gavrilescu, M.; Roșca, M.; Apostol, L.C.; Hlihor, R.M.; Gavrilescu, M. Evaluation of human health risks associated with pesticide dietary intake-an overview on quantitative uncertainty analysis. EEMJ 2018, 17, 2263–2274. [Google Scholar]
- Chiteculo, V.; Abdollahnejad, A.; Panagiotidis, D.; Surový, P.; Sharma, R. Defining deforestation patterns using satellite images from 2000 and 2017: Assessment of forest management in miombo forests—A case study of Huambo Province in Angola. Sustainability 2019, 111, 98. [Google Scholar] [CrossRef]
- Cilek, A.; Berberoglu, S. Biotope conservation in a Mediterranean agricultural land by incorporating crop modelling. Ecol. Model. 2019, 392, 52–56. [Google Scholar] [CrossRef]
- Cowan, O.S.; Anderson, P.M.L. Litter decomposition variation across a degradation gradient and two seasons in a critically endangered vegetation type within the Fynbos biome South Africa. S. Afr. J. Bot. 2019, 121, 200–209. [Google Scholar] [CrossRef]
- Bredeson, M.M.; Lundgren, J.G. Neonicotinoid insecticidal seed-treatment on corn contaminates interseeded cover crops intended as habitat for beneficial insects. Ecotoxicology 2019, 28, 1–7. [Google Scholar] [CrossRef]
- de Kock, L.; Russo, V.; von Blottnitz, H. Carbon intensive but decarbonising quickly? Retrospective and prospective life cycle assessments of South African pome fruit. J. Clean. Prod. 2019, 212, 139–150. [Google Scholar] [CrossRef]
- Ekblom, A.; Shoemaker, A.; Gillson, L.; Lane, P.; Lindholm, K.J. Conservation through biocultural heritage—Examples from Sub-Saharan Africa. Land 2019, 81, 5. [Google Scholar] [CrossRef]
- Fanadzo, M.; Dalicuba, M.; Dube, E. Application of conservation agriculture principles for the management of field crops pests. Sustain. Agric. Rev. 2018, 28, 125–152. [Google Scholar]
- Gura, I.; Mnkeni, P.N.S. Crop rotation and residue management effects under no till on the soil quality of a Haplic Cambisol in Alice Eastern Cape South Africa. Geoderma 2019, 337, 927–934. [Google Scholar] [CrossRef]
- Ho, S.Y.; Wasli, M.E.B.; Perumal, M. Evaluation of physicochemical properties of sandy-textured soils under smallholder agricultural land use practices in Sarawak East Malaysia. Appl. Environ. Soil Sci. 2019, 2019, 14. [Google Scholar] [CrossRef]
- da Silva, F.C.V.; do Nascimento, V.V.; Fernandes, K.V.; Machado, O.L.T.; da Silva Pereira, L.; Gomes, V.M.; de Oliveira Carvalho, A. Recombinant production and α-amylase inhibitory activity of the lipid transfer protein from Vigna unguiculata L. Walp seeds. Process. Biochem. 2018, 65, 205–212. [Google Scholar] [CrossRef]
- Aliyu, M.O.; Makinde, O.B. Phenotypic analysis of seed yield and yield components in cowpea Vigna unguiculata L. Walp Plant Breed. Biotechnol. 2016, 4, 252–261. [Google Scholar] [CrossRef]
- De Haan, J.J.; Kroonen, M.; Verstegen, H.; Van der Putten, W.H. Crop yield gap and stability in organic and conventional farming systems. Agric. Ecosyst. Environ. 2018, 256, 123–130. [Google Scholar]
- Ludwig, M.; Morgenthal, T.; Detsch, F.; Higginbottom, T.P.; Valdes, M.L.; Nauß, T.; Meyer, H. Machine learning and multi-sensor based modelling of woody vegetation in the Molopo Area South Africa. Remote Sens. Environ. 2019, 222, 195–203. [Google Scholar] [CrossRef]
- Saxena, B.; Sayyed, R.Z. Botanical insecticides effectively control chickpea weevil Callosobruchus maculatus. Environ. Sustain. 2018, 13, 295–301. [Google Scholar] [CrossRef]
- Koli, P.; Bhardwaj, N.R. Status and use of pesticides in forage crops in India. J. Pesticide Sci. 2018, 434, 225–232. [Google Scholar] [CrossRef]
- Vanti, G.L.; Nargund, V.B.; Vanarchi, R.; Kurjogi, M.; Mulla, S.I.; Tubaki, S.; Patil, R.R. Synthesis of Gossypium hirsutum-derived silver nanoparticles and their antibacterial efficacy against plant pathogens. Appl. Organomet. Chem. 2019, 33, e4630. [Google Scholar]
- Srivastava, A.; Srivastava, P.C. Role of organic soil amendments in controlling ground water pollution due to pesticides: An effective approach. In Microbial Biotechnology in Environmental Monitoring and Cleanup; Bhatt, P., Sharma, A., Eds.; IGI Global: Hershey, PA, USA, 2018; pp. 61–68. [Google Scholar]
- Kalabamu, F.T. Land tenure reforms and persistence of land conflicts in Sub-Saharan Africa–The case of Botswana. Land Use Policy 2019, 81, 337–345. [Google Scholar] [CrossRef]
- Stolk, A.; van Huyssteen, C.W. Clay and iron oxide contents of prismacutanic B G soft plinthic B and E horizons described during the land type survey of South Africa. S. Afr. J. Plant Soil 2019, 36, 1–8. [Google Scholar] [CrossRef]
- Ugbaje, S.; Odeh, I.O.A.; Bishop, T.F.A. Fuzzy measure-based multicriteria land assessment for rainfed maize in West Africa for the current and a range of plausible future climates. Comput. Electron. Agric. 2019, 158, 51–67. [Google Scholar] [CrossRef]
- Wangai, P.W.; Burkhard, B.; Müller, F. Quantifying and mapping land use changes and regulating ecosystem service potentials in a data-scarce peri-urban region in Kenya. Ecosyst. People 2019, 15, 111–132. [Google Scholar] [CrossRef]
- Rahman, S.; Chima, C. Determinants of pesticide use in food crop production in Southeastern Nigeria. Agriculture 2018, 8, 35. [Google Scholar] [CrossRef]
- Watanabe, E.; Miyake, S. Direct determination of neonicotinoid insecticides in an analytically challenging crop such as Chinese chives using selective ELISAs. J. Environ. Sci. Health Part B 2018, 53, 1–6. [Google Scholar] [CrossRef]
- Ali, N.; Khan, S.; Li, Y.; Zheng, N.; Yao, H. Influence of biochars on the accessibility of organochlorine pesticides and microbial community in contaminated soils. Sci. Total Environ. 2019, 647, 551–560. [Google Scholar] [CrossRef]
- Mfeka, N.; Mulidzi, A.R.; Lew, B.F. Growth and yield parameters of three cowpea Vigna unguiculata L. Walp lines as affected by planting date and zinc application rate. S. Afr. J. Sci. 2019, 115, 27–32. [Google Scholar] [CrossRef]
- Patil, S.; Sridevi, D.; Babu, T.R.; Pushpavathi, B. Persistent toxicity of selected insecticides on cowpea aphid Aphis craccivora Koch. IJCS 2018, 63, 2236–2239. [Google Scholar]
- Ndor, E.; Faringoro, U.D. Response of cowpea Vigna unguiculata L Walp to time of application and nitrogen fertilizer on the degraded soil of southern guinea savanna zone of Nigeria. Asian Soil Res. J. 2020, 3, 36–42. [Google Scholar] [CrossRef]
- Abdul Rahman, N.; Larbi, A.; Kotu, B.; Marthy Tetteh, F.; Hoeschle-Zeledon, I. Does nitrogen matter for legumes? Starter nitrogen effects on biological and economic benefits of cowpea Vigna unguiculata l in Guinea and Sudan savanna of West Africa. Agronomy 2018, 87, 120. [Google Scholar] [CrossRef]
- Province de Lomami, R.D. Évaluation variétale de quelques génotypes de niébé (Vigna unguiculata (L.) Walp) en conditions agro-écologiques de Kabinda, province de Lomami, République Démocratique du Congo. Afrique. Science 2017, 13, 24–31. [Google Scholar]
- Agbahoungba, S.; Karungi, J.; Odong, T.L.; Badji, A.; Kumi, F.; Mwila, N.; Rubaihayo, P.R. Biochemical constituents influencing the resistance to flower bud thrips in cowpea Vigna unguiculata l Walp germplasm. JAPS J. Anim. Plant Sci. 2018, 28, 281. [Google Scholar]
- Lautenschläger, T.; Neinhuis, C. Riquezas Naturais de Uíge Uma Breve Introdução Sobre o Estado Actual a Ameaça e a Preservação da Biodiversidade; TU Dresden, Dresden, SCS-Servicepoint im Foyer der SLUB: Dresden, Germany, 2014; pp. 16–17. [Google Scholar]
- Agwu, J.E.; Odo, G.E.; Oloto, J.C.; Uwagbae, M. Effects of cypermethrin on the biochemical profile of the hemolymph of the african pest grasshopper Zonocerus variegatus (Linn). Int. J. Biomater. Sci. Eng. 2016, 3, 15–19. [Google Scholar]
- Patel, S.; Bajpai, J.; Saini, R.; Bajpai, A.K.; Acharya, S. Sustained release of pesticide Cypermethrin from nanocarriers: An effective technique for environmental and crop protection. Proc. Saf. Environ. Protect. 2018, 117, 315–325. [Google Scholar] [CrossRef]
- Naah, J.B.S.; Braun, B. Local agro-pastoralists’ perspectives on forage species diversity habitat distributions abundance trends and ecological drivers for sustainable livestock production in West Africa. Sci. Rep. 2019, 91, 1707. [Google Scholar] [CrossRef]
- Altman, J. Pesticide Interactions in Crop Production: Beneficial and Deleterious Effects; CRC Press: Boca Raton, FL, USA, 2018. [Google Scholar]
- Hammer, R.; Harper, D.A.T.; Ryan, P.D. PAST: Paleontological statistics software package for education and data analysis Palaeontologia. Electronica 2001, 41, 9. [Google Scholar]


| Genotypes | Germination Rate (%) |
|---|---|
| IT07K-311-1 | 86 a |
| IT04K-221-1 | 78 ab |
| DIAMANTE | 77ab |
| IT07K-187-55 | 77 ab |
| IT89KD-288 | 75 b |
| H4 | 63 c |
| IT97K-556-4M | 53 c |
| Mean | 73 |
| p < 0.001; CV = 11% |
| Variable | Factor 1 | Factor 2 | Factor 3 | Factor 4 | Factor 5 | Factor 6 |
|---|---|---|---|---|---|---|
| Grain yield | −0.32 | 0.68 | 0.55 | −0.32 | 0.13 | −0.13 |
| Germination rate | 0.13 | 0.86 | −0.27 | 0.36 | 0.07 | 0.17 |
| Seed yield | 0.82 | 0.00 | −0.27 | −0.04 | 0.42 | −0.28 |
| Number of pods per plant | −0.79 | 0.17 | −0.41 | 0.08 | −0.21 | −0.36 |
| Pod weights | −0.73 | −0.04 | −0.46 | −0.35 | 0.30 | 0.20 |
| Threshing yield | −0.71 | −0.28 | 0.32 | 0.43 | 0.36 | −0.04 |
| Variable | Factor 1 | Factor 2 | Factor 3 | Factor 4 | Factor 5 | Factor 6 |
|---|---|---|---|---|---|---|
| Grain yield | −0.20 | 0.59 | 0.57 | −0.43 | 0.19 | −0.24 |
| Germination rate | 0.08 | 0.75 | −0.28 | 0.49 | 0.10 | 0.31 |
| Seed yield | 0.52 | 0.002 | −0.28 | −0.05 | 0.61 | −0.51 |
| Number of pods per plant | −0.50 | 0.14 | −0.43 | 0.11 | −0.31 | −0.66 |
| Pod weights | −0.47 | −0.04 | −0.48 | −0.47 | 0.45 | 0.37 |
| Threshing yield | −0.45 | −0.24 | 0.33 | 0.59 | 0.53 | −0.07 |
| Variable | Grain Yield | Germination Rate | Seed Yield | Number of Pods Per Plant | Pod Weights | Threshing Yield |
|---|---|---|---|---|---|---|
| Grain yield | 1 | 0.26 | −0.3 | 0.13 | 0.08 | 0.12 |
| Germination rate | 0.26 | 1 | 0.15 | 0.1 | −0.08 | −0.25 |
| Seed yield | −0.3 | 0.15 | 1 | −0.52 | −0.39 | −0.52 |
| Number of pods per plant | 0.13 | 0.1 | −0.52 | 1 | 0.59 | 0.36 |
| Pod weights | 0.08 | −0.08 | −0.39 | 0.59 | 1 | 0.34 |
| Threshing yield | 0.12 | −0.25 | −0.52 | 0.36 | 0.34 | 1 |
| Variable Index | DF | GAM Coefficient | Standard Error | Standard Score | Non-Linear p-Value | |
|---|---|---|---|---|---|---|
| Inception | 0 | 1.000000 | −1.27733 | 0.6999 | −1.82497 | - |
| Weight of 100 grain | 1 | 4.080600 | 0.00340 | 0.0046 | 0.73912 | 0.025104 |
| Seed yield | 2 | 4.115461 | 0.00191 | 0.0022 | 0.86949 | 0.045038 |
| Grain yield | 3 | 4.061803 | −0.05003 | 0.0438 | −1.14305 | 0.102087 |
| Weight of seeds selected | 4 | 3.912032 | 0.02932 | 0.0107 | 2.72839 | 0.008383 |
| Weight of seeds not selected | 5 | 4.006387 | 0.05173 | 0.0265 | 1.95248 | 0.005508 |
| Pod weights | 6 | 4.003659 | 0.10427 | 0.0253 | 4.12764 | 0.874075 |
| Number of harvested plants | 7 | 3.955695 | −0.12843 | 0.0324 | −3.96647 | 0.087135 |
| Germination rate | 8 | 3.975686 | −1.29209 | 569.9148 | −0.00227 | 0.000000 |
| Number of live plants on the central lines | 9 | 4.061591 | −0.00001 | 0.0000 | −0.13349 | 0.000328 |
| Number of live plants in the border lines | 10 | 4.032929 | 0.00024 | 0.0004 | 0.64662 | 0.000000 |
| Coefficient | Standard Error | t | p | R2 | ||
|---|---|---|---|---|---|---|
| Constant | 1084.30 | 2812.90 | 0.39 | 0.70 | ||
| Weight of seeds not selected | 65.93 | 50.32 | 1.31 | 0.20 | 0.50 | |
| Number of pods per plant | 12.20 | 319.51 | 0.04 | 0.97 | 0.19 | |
| Grain yield | Number of harvested plants | −45.60 | 55.79 | −0.82 | 0.42 | 0.05 |
| maturity (95%) | 19.99 | 37.61 | 0.53 | 0.60 | 0.04 | |
| Pod weights | −7.18 | 39.44 | −0.18 | 0.86 | 0.47 | |
| weight of 100 grain | 288.94 | 228.62 | 1.26 | 0.22 | 0.31 | |
| Constant | 7.68 | 0.33 | 23.23 | 0.00 | ||
| Weight of seeds not selected | 0.01 | 0.01 | 1.07 | 0.29 | 0.07 | |
| Number of pods per plant | −0.05 | 0.04 | −1.32 | 0.20 | 0.11 | |
| Risk of aphid-mosaic virus disease | Number of harvested plants | 0.01 | 0.01 | 1.88 | 0.07 | 0.14 |
| Maturity (95%) | −0.07 | 0.00 | −15.85 | 0.04 | 0.88 | |
| Pod weights (gr) | 0.00 | 0.00 | −1.06 | 0.30 | 0.11 | |
| Weight of 100 grain | −0.06 | 0.03 | −2.19 | 0.04 | 0.19 | |
| Constant | −0.46 | 3.28 | −0.14 | 0.89 | ||
| Weight of seeds not selected | −0.01 | 0.06 | −0.17 | 0.87 | 0.80 | |
| Number of pods per plant | 0.33 | 0.37 | 0.90 | 0.38 | 0.40 | |
| Weight of selected seeds | Number of harvested plants | 0.01 | 0.07 | 0.13 | 0.90 | 0.16 |
| maturity (95%) | 0.00 | 0.04 | −0.10 | 0.92 | 0.05 | |
| Pod weights | 0.14 | 0.05 | 2.98 | 0.01 | 0.85 | |
| weight of 100 grain | 0.20 | 0.27 | 0.74 | 0.46 | 0.40 | |
| Constant | 2.15 | 0.77 | 2.78 | 0.01 | ||
| Weight of seeds not selected | 0.01 | 0.01 | 0.51 | 0.62 | 0.24 | |
| Number of pods per plant | −0.10 | 0.09 | −1.11 | 0.28 | 0.29 | |
| Zonocerus variegates prevalence | Number of harvested plants | −0.01 | 0.02 | −0.64 | 0.53 | 0.11 |
| Maturity (95%) | 0.03 | 0.01 | 3.23 | 0.35 | 0.03 | |
| Pod weights | −0.01 | 0.01 | −0.76 | 0.46 | 0.23 | |
| weight of 100 grain | −0.17 | 0.06 | −2.71 | 0.01 | 0.35 |
| Year/2017–2018 | Precipitation (mm) | Average Temperature °C | Relative Humidity (%) | Insolation (Calories in cm3) |
|---|---|---|---|---|
| September | 36.0 | 27.5 | 71.4 | 590.2 |
| October | 214.0 | 27.4 | 76.7 | 622.1 |
| November | 206.0 | 27.4 | 75.9 | 671.6 |
| December | 234.6 | 27.4 | 82.0 | 568.3 |
| January | 99.8 | 27.9 | 81.8 | 731.5 |
| February | 94.2 | 27.1 | 77.2 | 641.1 |
Publisher’s Note: MDPI stays neutral with regard to jurisdictional claims in published maps and institutional affiliations. |
© 2021 by the authors. Licensee MDPI, Basel, Switzerland. This article is an open access article distributed under the terms and conditions of the Creative Commons Attribution (CC BY) license (https://creativecommons.org/licenses/by/4.0/).
Share and Cite
Carvalho, M.d.; Halecki, W. Modeling of Cowpea (Vigna unguiculata) Yield and Control Insecticide Exposure in a Semi-Arid Region. Plants 2021, 10, 1074. https://doi.org/10.3390/plants10061074
Carvalho Md, Halecki W. Modeling of Cowpea (Vigna unguiculata) Yield and Control Insecticide Exposure in a Semi-Arid Region. Plants. 2021; 10(6):1074. https://doi.org/10.3390/plants10061074
Chicago/Turabian StyleCarvalho, Messias de, and Wiktor Halecki. 2021. "Modeling of Cowpea (Vigna unguiculata) Yield and Control Insecticide Exposure in a Semi-Arid Region" Plants 10, no. 6: 1074. https://doi.org/10.3390/plants10061074
APA StyleCarvalho, M. d., & Halecki, W. (2021). Modeling of Cowpea (Vigna unguiculata) Yield and Control Insecticide Exposure in a Semi-Arid Region. Plants, 10(6), 1074. https://doi.org/10.3390/plants10061074