Article

Classification of Cucumber Leaves Based on Nitrogen Content Using the Hyperspectral Imaging Technique and Majority Voting

by
Sajad Sabzi
1,
Razieh Pourdarbani
1,*,
Mohammad Hossein Rohban
2,*,
Alejandro Fuentes-Penna
3,
José Luis Hernández-Hernández
4 and
Mario Hernández-Hernández
5,*
1
Department of Biosystems Engineering, College of Agriculture, University of Mohaghegh Ardabili, Ardabil 56199-11367, Iran
2
Computer Engineering Department, Sharif University of Technology, Tehran 14588-89694, Iran
3
National Technological of México/Campus CIIDET, Querétaro 76000, Mexico
4
National Technological of México/Campus Chilpancingo, Chilpancingo, Guerrero 39070, Mexico
5
Faculty of Engineering, Autonomous University of Guerrero, Chilpancingo, Guerrero 39087, Mexico
*
Authors to whom correspondence should be addressed.
Plants 2021, 10(5), 898; https://doi.org/10.3390/plants10050898
Submission received: 27 February 2021 / Revised: 10 April 2021 / Accepted: 21 April 2021 / Published: 29 April 2021

Abstract

:
Improper usage of nitrogen in cucumber cultivation causes nitrate accumulation in the fruit and results in food poisoning in humans; therefore, mandatory evaluation of food products becomes inevitable. Hyperspectral imaging has a very good ability to evaluate the quality of fruits and vegetables in a non-destructive manner. The goal of the present paper was to identify excess nitrogen in cucumber plants. To obtain a reliable result, the majority voting method was used, which takes into account the unanimity of five classifiers, namely, the hybrid artificial neural network–imperialism competitive algorithm (ANN-ICA), the hybrid artificial neural network–harmonic search (ANN-HS) algorithm, linear discrimination analysis (LDA), the radial basis function network (RBF), and the K-nearest-neighborhood (KNN). The wavelengths of 723, 781, and 901 nm were determined as optimal wavelengths using the hybrid artificial neural network–biogeography-based optimization (ANN-BBO) algorithm, and the performance of classifiers was investigated using the optimal spectrum. The results of a t-test showed that there was no significant difference in the precision of the algorithm when using the optimal wavelengths and wavelengths of the whole range. The correct classification rate of the classifiers ANN-ICA, ANN-HS, LDA, RBF, and KNN were 96.14%, 96.11%, 95.73%, 64.03%, and 95.24%, respectively. The correct classification rate of majority voting (MV) was 95.55% for test data in 200 iterations, which indicates the system was successful in distinguishing nitrogen-rich leaves from leaves with a standard content of nitrogen.

1. Introduction

In cucumber production, a high consumption of nitrogen occurs more often than a low consumption. Balance in the consumption of nitrogen is very important to reduce nitrate accumulation in green cucumber. Failure to maintain a proper nitrogen ratio disrupts plant metabolism, and nitrogen accumulates in the fruits in the form of nitrate, which reduces the amount of vitamin C by up to 26%, according to Bryk et al. [1].
Excessive consumption of nitrate is harmful to humans, due to the conversion to nitrite by microorganisms in the intestine and stomach.
The demand for high-quality fruits and vegetables has been increasing in the past few decades. Therefore, the mandatory evaluation of food products has become inevitable. Human visual inspection is still widely used, but it is nonetheless subjective, time-consuming, and tedious. The most commonly objective methods are chemical analytical methods such as mass spectrometry (MS) and high-performance liquid chromatography (HPLC). However, they have several disadvantages, including being destructive, time-consuming, and costly. Therefore, accurate, reliable, efficient, and non-destructive options are strongly needed to evaluate the quality-related characteristics of food products (Salimi et al. [2]; Pourdarbani et al. [3]; Sabzi et al. [4]).
The spectroscopy technique does not provide spatial information. On the other hand, computer vision is incapable of inspecting samples of the same color and predicting their chemical components [5]. Thus, by integrating the main advantages of spectroscopy and imaging, the hyperspectral imaging technique can simultaneously obtain spectral and spatial information, which is crucial for predicting the quality of agricultural and food products [6].
Hyperspectral imaging has proven to be an excellent technique to assess the quality of fruits and vegetables and determine contamination, bruising, surface damages, the starch index, firmness, the soluble and solid content, the presence of bitter pit, and cold injury. (Lorente et al. [7]; Leiva-Valenzuela et al. [8]; Cen et al. [9]; Chen et al. [10]). Zhang et al. [11] considered individual wavelengths as independent classifiers and used the receiver performance curve (ROC) to select the best classifiers based on their performance. To develop a low-cost multispectral system for fungal quality control, Esquerre et al. [12] identified wavelengths with the most stable regression coefficients using the Monte Carlo Variable Selection (EMCVS). Mealiness is a negative texture characteristic consisting of abnormal soft tissue with no juiciness in the fruit. Various studies have been done on the detection of mealiness in apples using hyperspectral imaging (Huang & Lu [13]; Huang & Zhu [14]; Huang et al. [15]). Jarolmasjed et al. [16] used hyperspectral imaging to diagnose bitter pit in apples. This method was able to classify apples with an accuracy of 85%. The application of hyperspectral imaging to measure the properties of plums has also been conducted in recent years (Bo et al. [17]). The prediction of firmness in tomato was studied by Yuping et al. [18] using visible and near-infrared spectroscopy. Hyperspectral imaging was used as a powerful tool to identify papaya seeds in black pepper. The results showed that hyperspectral imaging in the NIR region was able to identify black pepper mixed with papaya seeds (Imer et al. [19]). Using hyperspectral imaging, the detection of bursting from the center or hollow heart of potatoes was studied in a non-destructive manner and successfully (Angel et al. [20]. The detection of hollow hearts in potatoes was studied non-destructively using hyperspectral imaging in the range of 1700–10,000 nm. The results revealed that support vector machines (SVM) achieved a correct classification rate of 89.1% (Angel et al. [20]). Williams et al. [21] applied hyperspectral imaging to detect Fusarium damage in maize. Sabzi et al. [22] classified cucumber plants on the basis of their nitrogen content using hybrid ANN-ICA. They concluded that their proposed algorithm was able to early detect nitrogen-rich plants, with a classification rate of 96.11%. Chen et al. [23] studied the early detection of nitrogen in apples using hyperspectral techniques and different methods including support vector machine (SVM), partial least-squares regression (PLSR), random forest (RF), back-propagation artificial neural network (BPANN), and extreme learning machine (ELM). Among these models, nonlinear modeling methods obtained better results than the linear method. The best result was achieved by Rfrog-ELM (R2P = 0.843, RMSEP = 2.461 g·kg−1, RPD = 2.508).
As mentioned above, the high consumption of nitrogen causes the accumulation of nitrate (NO3) in agricultural products. Therefore, scientific management of the use of fertilizers is inevitable to improve the health of consumers by reforming the structure of production. For this purpose, the present study attempted to classify cucumber plants based on consumed nitrogen using hyperspectral imaging and majority voting.

2. Results

2.1. The Most Effective Wavelengths for the Classification of Cucumber Leaves Based on Nitrogen Content

The wavelengths of 723, 781, and 901 nm were selected as the effective (optimal) wavelengths, and the performance of the classifiers was obtained based on them.

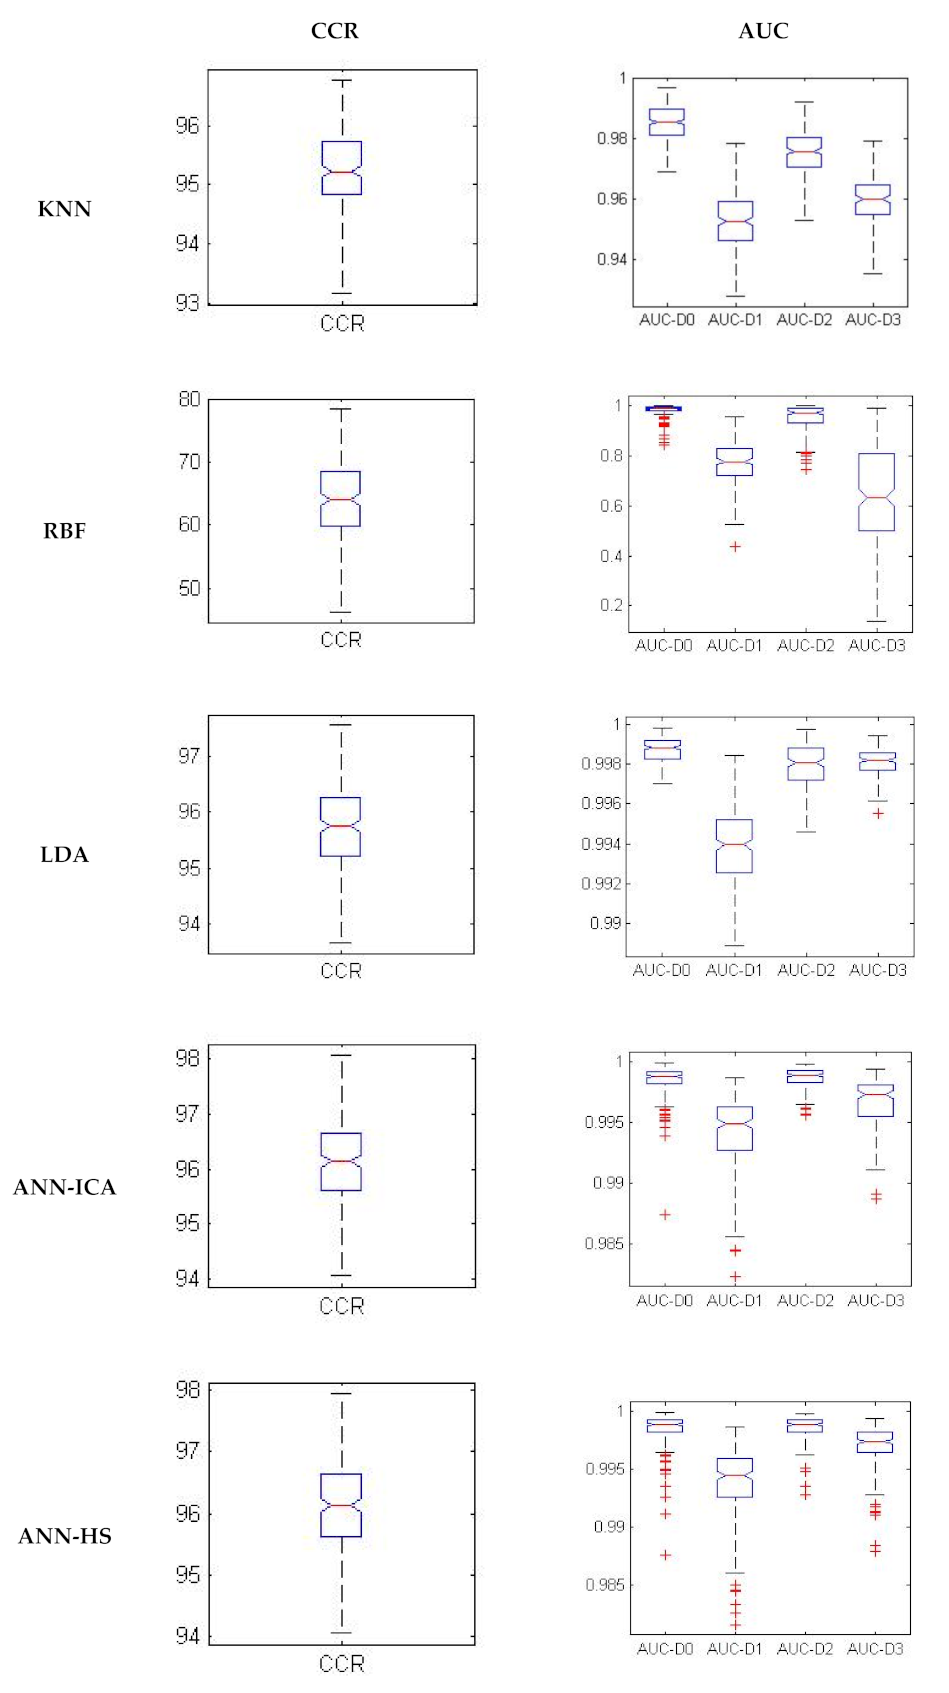
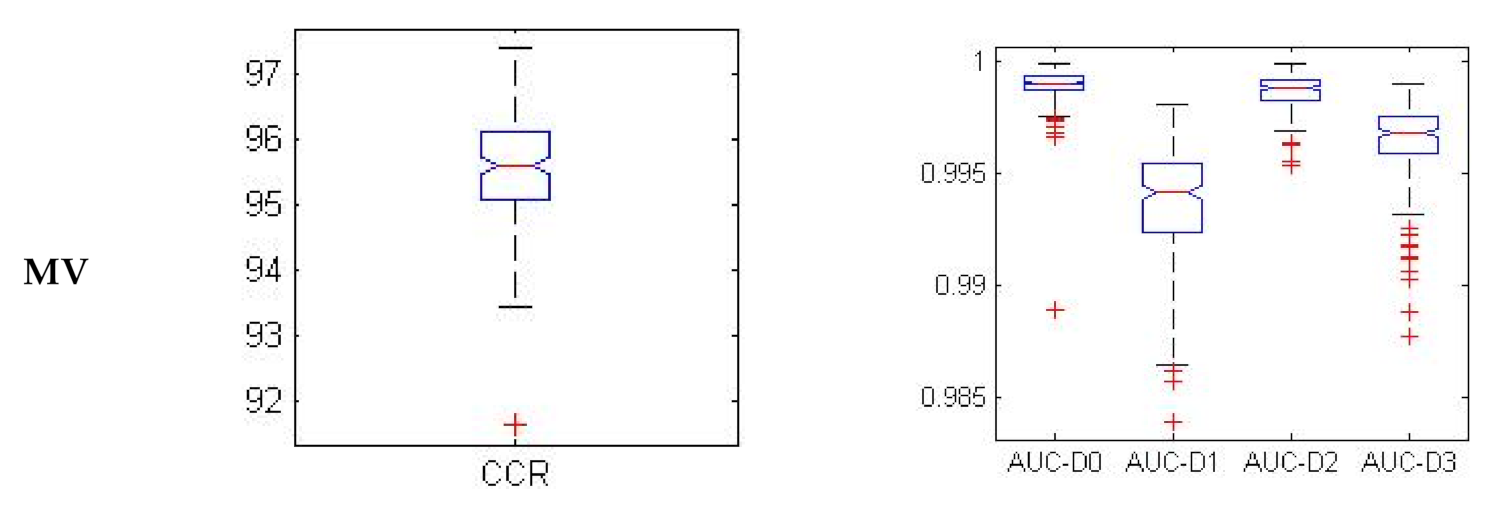
2.2. Investigation of the Performance of Different Classifiers for the Classification of Cucumber Leaves Based on Nitrogen Content in 200 Iterations

Table 1 presents the performance of the various classifiers examined in this study using a confusion matrix, the correct classification rate (CCR), and the incorrect classification rate for the test data at 200 iterations. As shown in the table, there are differences between classifiers in the correct classification rate. The highest and the lowest correct classification rates were determined for the ANN-ICA and RBF methods, respectively. Hereupon, to obtain reliable results, it was quite logical to use the unanimity of all classifiers.
The different evaluation criteria of performance for assessing the different classifiers are presented in Table 2. Since the final decision was made by the majority voting method, the results of the MV method are presented in the table. The accuracy of D0 and D2 was the highest, which indicates that the results of both classes are closer to the actual value of the same class. The accuracy was the highest for classes D0 and D2, which means that the results were less different from each other, and the standard deviation of the data was lower. The high sensitivity of classes D0 and D2 indicated that the classifier was more able to correctly distinguish nitrogen-rich leaves. On the other hand, the values of specificity for classes D0 and D2 were higher than those of the other classes, which indicated the ability of the classifier to correctly identify the sample.
The classifier was more able to detect excess nitrogen 48 h (D2) rather than 24 h (D1) after the application of excess N2, which is completely reasonable, as the symptoms become more apparent on day D2. It was expected that this trend would continue further on day D3. The failure to meet such an expectation was due to sampling newly grown leaves on day D3.
Figure 1 evaluates the performance of the classifiers in 200 iterations using box plot of CCR and the area under the ROC curve (AUCs). More compact box plots indicate a higher performance of a classifier. In general, for all classifiers, the box plots of classed D0 and D2 were more compact, which indicated that they identified the excess of nitrogen more accurately.
Figure 2 illustrates the receiver operating curve of different classifiers in 200 iterations. A curve farther from the bisector line and closer to the vertical line indicates a high performance of the classifier in that class. Except for the classifier RBF, the others showed a high performance.

3. Discussion

3.1. Comparison of Mean and Standard Deviation of the ROC and CCR for Effective Wavelength Spectral Data and Entire Data to Identify Cucumber Leaves in Terms of Nitrogen Content

In order to develop a classifier with high speed and low cost, the most effective wavelengths were used to determine the performance of the classifiers. In this section, the results of the classification related to all tested wavelengths and the effective wavelengths are compared. It is obvious that the correct classification rate at the effective wavelength was slightly lower in comparison to that obtained with all wavelengths (Table 3). However, the t-test indicated that this difference was not significant (Table 4).

3.2. Comparison of the Results Obtained in This Study with Those of Other Researchers

The results obtained in this study were compared with the results of other similar studies. Table 5 shows these comparisons in the form of correct classification rates.

4. Materials and Methods

The different steps performed to classify cucumber leaves based on nitrogen content are shown in Figure 3. As can be seen, the proposed algorithm involves six main stages including data collection, capturing hyperspectral images, extraction of the most effective spectra (optimal wavelength), and classification based on majority voting.

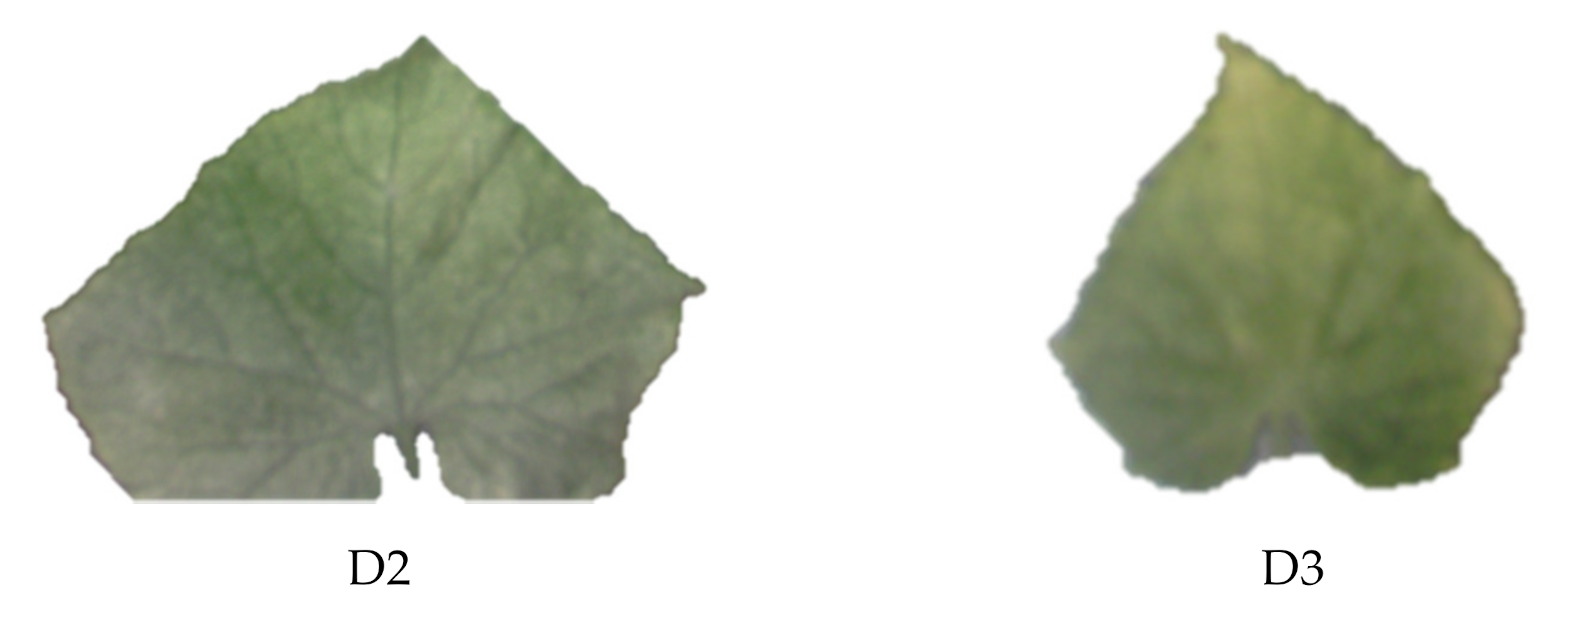
4.1. Preparation of the Samples to Perform HyperSpectral Imaginary

To prepare the samples including cucumber leaves with standard nitrogen content and excess nitrogen content, cucumber seeds, Super Arshiya’F1 cultivar, was planted in 18 pots (Figure 4). All pots were treated with the same inputs of N2 for germination and growth (N2 by 2 g/kg of soil). After reaching the appropriate growth, half of the plants received 30% of the excess nitrogen. This amount was measured by precise scales and applied to the soil. Six leaves were picked from each pot on the day before applying excess N2 (D0) and 3 consecutive days after applying excess N2 (D1 to D3); they were imaged by a hyperspectral camera. The leaves turned pale, and the symptoms of excess N2 became quite apparent after 3 days, thus sampling was stopped.

4.2. Hardware Required for Classification of Cucumber Plants Based on Nitrogen Content

In order to obtain hyperspectral images and extract the spectral–spatial properties of images at each individual wavelength, several systems were used, including Labtab (Intel Corei 5, 2430 M at 2.40 GHz, 4 GB of RAM, Windows 10; DELL Co., Round Rock, TX, USA) for data storage and analysis, a hyperspectral camera (made in Fanavaran Physics Co.; Iran-Kashan) (www.optc.ir; accessed on 22 April 2021) with a range from 400 to 1100 nm, two tungsten halogen light sources (SLI-CAL (StellarNet, Tampa, FL, USA)), and a lighting chamber to prevent the ambient light. The camera was located at a horizontal distance of 1 m from the sample, and two light sources were lit on the sample at angle 45°. Figure 5 shows the required hardware.

4.3. Preprocessing of Original Spectral Data

The reflectance spectra were converted to absorption spectra for resolving the impact of noise due to ambient light, spectroscopy type, etc. Then, light scattering was corrected by the multiplicative scatter correction (MSC) algorithm. Finally, smoothing was performed by the median filter, using Parles software. (Rossel [28]).
Absorption spectra = log(1/Reflectance spectra)

4.4. Selection of the Optimal Wavelength for the Classification of Cucumber Leaves Using Hybrid ANN-BBO

Nowadays, chemical fertilizers are applied as the most economical tool to achieve maximum production per unit area. Major disorders may occur in fruits due to the improper and unbalanced usage of nitrogen. The detection of the nutrient content of leaves is performed through leaf analysis, which is time-consuming and expensive. Thus, to identify nitrogen-rich leaves promptly, it is necessary to develop online algorithms. Undoubtedly, the cost and speed of real-time detection systems are the most important factors. A system of choice achieves the best performance as soon as possible with the least volume of data. Therefore, in this study, the hybrid artificial neural network–biogeography-based optimization (ANN-BBO) algorithm was used to select the most effective wavelengths.
Biogeography is the study of the geographical distribution of living creatures (Simon, [29]). Mathematical simulations of biogeography describe how a species migrates from one habitat to another. Habitats that are more suitable for species have a higher habitat suitability index (HSI). The habitat suitability index depends on factors such as vegetation, rainfall, area, temperature, etc. The variables that determine habitat quality are called suitability index variables (SIVs). In fact, SIVs are independent variables, and HSI is a variable dependent on SIVs. Habitats with high HSIs accommodate more species, and vice versa. On the other hand, habitats with smaller populations show a tendency of the species to migrate more. Maximum migration to a habitat indicates that there are no species in the habitat. As the number of species increases, the habitat becomes more crowded, and fewer species may migrate there.
The method of the hybrid ANN-BBO algorithm is based on introducing different vectors of spectral data in the artificial neural network, and the results of the network are recorded in the form of mean squared error. The output of the network is the class of leaves, determined on the basis of nitrogen content. Any input vector with the least mean square error is considered the optimal vector, and the wavelengths within that vector are known as the optimal wavelengths. Table 6 shows the structure of the hidden layers of the neural network used to select the effective wavelengths.

4.5. Measurement of Nitrogen by a Destructive Method

The actual nitrogen content of the leaves was measured by Kjeldahl’s method that includes 3 steps, i.e., digestion, distillation, and titration. For the calculations, we used Equation (2). In this study, the Gerhardt, Kjeldahl (made in German, Königswinter) was used.
N   total   ( % )   =       V s V b       m d   ×   N H 2 SO 4   ×   0.014 meqN   ×   100
Vs: Volume consumed by the sample (mL)
Vb: Volume consumed by the control treatment (mL)
NH2SO4: Normality of sulfuric acid (eq/L)
md: Dry weight of the sample (g)

4.6. Classification of Cucumber Plants Based on Nitrogen Content by Majority Voting

First, the performance of different classifiers was investigated, and then the final class was determined based on the majority voting method. The different classifiers used in this study were the hybrid artificial neural network–imperialism competitive algorithm (ANN-ICA), the hybrid artificial neural network–harmonic search (ANN-HS) algorithm, linear discrimination analysis (LDA), the radial basis function network (RBF), and K-nearest-neighborhood (KNN).

4.6.1. Classifier ANN-ICA

The Imperialist Competitive Algorithm is based on artificial intelligence, simulate human communities, and explores the optimal point to resolve the optimization problem (Atashpaz-Gargari & Lucas [30]). This algorithm provides a mathematical model for representing the given problems with a number of random populations called “country”. Some of the best members of the population (elites) are selected as colonizers. Other members are considered a colony. The colonizers attract these colonies towards themselves. The power of an empire is dependent on colonial states and colonies. If an empire fails to succeed in colonial competition, it will be wiped out from the competition. Hence, an empire should attract the colonies of rival empires to guarantee its survival.
In fact, the parameters of research are selected by the imperialist competitive algorithm in the form of vectors and delivered to the artificial neural network. The performance of the network is recorded by the algorithm in the form of squared mean error. The input of the artificial neural network consists of spectral data, and the output is the class of cucumber leaf. Ultimately, the structure with the least mean-squares error is considered the optimal structure.
After the parameters were adjusted optimally, 200 iterations were executed to evaluate the validity of the artificial neural network. For each iteration, 60% of the data were used for training, 30% for testing, and 10% for the validation of the artificial neural network.

4.6.2. Classifier ANN-HS

The harmonic search algorithm was developed according to the process of composing a harmonic piece of music. As known, the gamut of each musical instrument describes the beauty of the song, which means that the gamut of an instrument must be in optimal conditions. Thus, the value of the objective function is determined by the values of the problem variables (Simon et al. [30]). The method for the neural network is the same as the one mentioned above.

4.6.3. Classifier K-Nearest-Neighborhood (KNN)

The k-nearest-neighbor algorithm is often used for classification problems. Implementation of the k-nearest-neighborhood model is possible using the following steps:
(1)
Calling the data
(2)
Initial selection of k-value
(3)
Developing the classes, repeat from 1 to the total number of training data points:
(A)
Calculating the distance of the test data from each row of the training data set by Euclidean distance.
(B)
Selection of the top k rows of the sorted array
(C)
Receiving the most repetitive classes in these rows
(D)
Returning the predicted class value.

4.6.4. Classifier Linear Discrimination Analysis (LDA)

The linear discrimination analysis is performed in three ways: direct, hierarchical and step by step. The step-by-step method is more widely used by researchers because it incorporates independent variables based on predictive power. Therefore, in this study, the stepwise method was used (Anuthama et al. [31]).

4.6.5. Classifier Radial Basis Function (RBF)

An RBF network is a feed-forward network including input layer, hidden layer, and output layer. When the number of iterations or calculated error reaches the desired values, the training of the RBF algorithm is over. A Gaussian function is used as the transfer function. The relationship between the input layer and the hidden layer is expressed using Equation (3), and the relationship between the output layer and the hidden layer is expressed using Equation (4).
ω i x = e x p I n C i 2 2 i 2 ( 1 < i < n )
O u t j = j = 1 n β i j ω i x ( 1 < j < q )
where: Ci, i, and βij are the center, width of the hidden layer, and weight between the outputs and the layer, respectively.

4.7. Assessment of Performance of the MV Classifier

The performance of the classifier was evaluated by different criteria. These criteria were recall, accuracy, specificity, precision, and F-criteria and graphical criteria of receiver operation curve diagrams (ROC) as well as the area under the ROC curve (Pourdarbani et al. [32]; Alibaba et al. [33]). Table 7 shows the equations.

5. Conclusions

The balance of nutrients in the soil is disturbed by fertilizers, and this causes environmental degradation. However, in recent years, farmers have often been excessively using water and fertilizers.
Hyperspectral imaging is a non-destructive and rapid analytical tool for quality assessment of different products and disease diagnosis. In this study, excess nitrogen (by 30%) was added to 18 pots, each containing a plant, that were classified using different classifiers, including the hybrid artificial neural network–imperialism competitive algorithm (ANN-ICA), the hybrid artificial neural network–harmonic search (ANN-HS) algorithm, linear discrimination analysis (LDA), the radial basis function network (RBF), and K-nearest-neighborhood (KNN). Due to differences in the results, the majority voting method was used to obtain a reliable result, since it presents a result based on unanimity.
The wavelengths of 723, 781, and 901 nm were selected as effective wavelengths using the hybrid artificial neural network–biogeography-based optimization (ANN-BBO) algorithm. Then, the performance of the majority voting classifier was evaluated using confusion matrix of CCR and mis-classification rate in 200 iterations. The results revealed that the CCR of the algorithm was 95.55%, indicating good performance in detecting excess nitrogen in cucumber plants.
The early detection of excess fertilizer can improve potting soil or farm soil. One of the ways to improve soil is to use mulching. The mulch layer on nitrogen-rich soil decomposes large amounts of soil nitrogen.

Author Contributions

Conceptualization, M.H.R. and A.F.-P.; methodology, R.P. and M.H.-H.; software, J.L.H.-H.; validation, A.F.-P. and M.H.-H.; formal analysis, M.H.R.; investigation, S.S.; resources, M.H.-H.; data curation, M.H.R.; writing—original draft preparation, R.P.; writing—review and editing, S.S., J.L.H.-H.; visualization, R.P.; supervision, A.F.-P.; project administration, S.S.; funding acquisition, J.L.H.-H. All authors have read and agreed to the published version of the manuscript.

Funding

This research received no external funding.

Institutional Review Board Statement

Not applicable.

Informed Consent Statement

Not applicable.

Data Availability Statement

Data sharing not applicable.

Conflicts of Interest

The authors declare no conflict of interest. The funders had no role in the design of the study; in the collection, analyses, or interpretation of data; in the writing of the manuscript, or in the decision to publish the results.

References

  1. Bryk, T.; Zalzstein, E.; Lifshitz, M. Methemoglobinemia induced by refrigerated vegetable puree in conjunction with supraventricular tachycardia. Acta Paediatr. 2007, 92, 1214–1215. [Google Scholar] [CrossRef]
  2. Salimi, M.; Pourdarbani, R.; Nouri, B.A. Factors Affecting the Adoption of Agricultural Automation Using Davis’s Acceptance Model (Case Study: Ardabil). Acta Technol. Agric. 2020, 23, 30–39. [Google Scholar] [CrossRef] [Green Version]
  3. Pourdarbani, R.; Sabzi, S.; García-Amicis, V.M.; García-Mateos, G.; Molina-Martínez, J.M.; Ruiz-Canales, A. Automatic Classification of Chickpea Varieties Using Computer Vision Techniques. Agronomy 2019, 9, 672. [Google Scholar] [CrossRef] [Green Version]
  4. Sabzi, S.; Pourdarbani, R.; Kalantari, D.; Panagopoulos, T. Designing a Fruit Identification Algorithm in Orchard Conditions to Develop Robots Using Video Processing and Majority Voting Based on Hybrid Artificial Neural Network. Appl. Sci. 2020, 10, 383. [Google Scholar] [CrossRef] [Green Version]
  5. Pourdarbani, R.; Rezaei, B. Automatic detection of greenhouse plants pests by image analysis. Tarım Makinaları Bilimi Dergisi 2011, 7, 171–174. [Google Scholar]
  6. Wu, D.; Sun, D.-W. Advanced applications of hyperspectral imaging technology for food quality and safety analysis and assessment: A review—Part I: Fundamentals. Innov. Food Sci. Emerg. Technol. 2013, 19, 1–14. [Google Scholar] [CrossRef]
  7. Lorente, D.; Aleixos, N.; Gomezsanchis, J.; Cubero, S.; García-Navarrete, O.L.; Blasco, J. Recent Advances and Applications of Hyperspectral Imaging for Fruit and Vegetable Quality Assessment. Food Bioprocess Technol. 2012, 5, 1121–1142. [Google Scholar] [CrossRef]
  8. Leiva-Valenzuela, G.A.; Lu, R.; Aguilera, J.M. Prediction of firmness and soluble solids content of blueberries using hyperspectral reflectance imaging. J. Food Eng. 2013, 115, 91–98. [Google Scholar] [CrossRef]
  9. Cen, H.; Lu, R.; Mendoza, F.A.; Ariana, D.P. Assessing Multiple Quality Attributes of Peaches Using Optical Absorption and Scattering Properties. Trans. ASABE 2012, 55, 647–657. [Google Scholar] [CrossRef]
  10. Chen, H.C.; Chen, X.D.; Lu, Q.P. BP-ANN Application to the Model Establishment of Determination Wheat Protein Using Near Infrared Spectroscopy. J. Physics: Conf. Ser. 2006, 48, 29–35. [Google Scholar] [CrossRef]
  11. Zhang, B.; Yang, W.; Gao, L.; Chen, N. Real-time target detection in hyperspectral images based on spatial-spectral information extraction. EURASIP J. Adv. Signal Process. 2012, 2012, 142. [Google Scholar] [CrossRef] [Green Version]
  12. Esquerre, C.; Gowen, A.; Downey, G.; O’Donnell, C.; Fernandez, C.A.E. Wavelength selection for development of a near infrared imaging system for early detection of bruise damage in mushrooms (Agaricus bisporus). J. Near Infrared Spectrosc. 2012, 20, 537. [Google Scholar] [CrossRef]
  13. Huang, M.; Lu, R. Apple mealiness detection using hyperspectral scattering technique. Postharvest Biol. Technol. 2010, 58, 168–175. [Google Scholar] [CrossRef]
  14. Huang, M.; Zhu, Q. Feature extraction of hyperspectral scattering image for apple mealiness based on singular value decomposition. Spectrosc. Spectr. Anal. 2011, 31, 767–770. [Google Scholar] [CrossRef]
  15. Huang, M.; Zhu, Q.; Wang, B.; Lu, R. Analysis of hyperspectral scattering images using locally linear embedding algorithm for apple mealiness classification. Comput. Electron. Agric. 2012, 89, 175–181. [Google Scholar] [CrossRef]
  16. Jarolmasjed, S.; Khot, L.R.; Sankaran, S. Hyperspectral Imaging and Spectrometry-Derived Spectral Features for Bitter Pit Detection in Storage Apples. Sensors 2018, 18, 1561. [Google Scholar] [CrossRef] [PubMed] [Green Version]
  17. Li, B.; Cobo-Medina, M.; Lecourt, J.; Harrison, N.; Harrison, R.J.; Cross, J.V. Application of hyperspectral imaging for nondestructive measurement of plum quality attributes. Postharvest Biol. Technol. 2018, 141, 8–15. [Google Scholar] [CrossRef]
  18. Huang, Y.; Lu, R.; Hu, D.; Chen, K. Quality assessment of tomato fruit by optical absorption and scattering properties. Postharvest Biol. Technol. 2018, 143, 78–85. [Google Scholar] [CrossRef]
  19. Orrillo, I.; Cruz-Tirado, J.; Cardenas, A.; Oruna, M.; Carnero, A.; Barbin, D.F.; Siche, R. Hyperspectral imaging as a powerful tool for identification of papaya seeds in black pepper. Food Control. 2019, 101, 45–52. [Google Scholar] [CrossRef]
  20. Dacal-Nieto, A.; Formella, A.; Carrión, P.; Vázquez-Fernández, E.; Fernández-Delgado, M. Non–destructive Detection of Hollow Heart in Potatoes Using Hyperspectral Imaging. Lect. Notes Comput. Sci. 2011, 6855, 180–187. [Google Scholar]
  21. Williams, P.J.; Manley, M.; Fox, G.; Geladi, P. Indirect Detection of Fusarium Verticillioidesin Maize (Zea mays L.) Kernels by near Infrared Hyperspectral Imaging. J. Near Infrared Spectrosc. 2010, 18, 49–58. [Google Scholar] [CrossRef]
  22. Sabzi, S.; Pourdarbani, R.; Rohban, M.; García-Mateos, G.; Paliwal, J.; Molina-Martínez, J. Early Detection of Excess Nitrogen Consumption in Cucumber Plants Using Hyperspectral Imaging Based on Hybrid Neural Networks and the Imperialist Competitive Algorithm. Agronomy 2021, 11, 575. [Google Scholar] [CrossRef]
  23. Chen, S.; Hu, T.; Luo, L.; He, Q.; Zhang, S.; Li, M.; Cui, X.; Li, H. Rapid estimation of leaf nitrogen content in apple-trees based on canopy hyperspectral reflectance using multivariate methods. Infrared Phys. Technol. 2020, 111, 103542. [Google Scholar] [CrossRef]
  24. Xie, C.; Yang, C.; He, Y. Hyperspectral imaging for classification of healthy and gray mold diseased tomato leaves with different infection severities. Comput. Electron. Agric. 2017, 135, 154–162. [Google Scholar] [CrossRef]
  25. Xia, J.; Cao, H.; Yang, Y.; Zhang, W.; Wan, Q.; Xu, L.; Ge, D.; Zhang, W.; Ke, Y.; Huang, B. Detection of waterlogging stress based on hyperspectral images of oilseed rape leaves (Brassica napus L.). Comput. Electron. Agric. 2019, 159, 59–68. [Google Scholar] [CrossRef]
  26. Zhang, M.; Qin, Z.; Liu, X.; Ustin, S.L. Detection of stress in tomatoes induced by late blight disease in California, USA, using hyperspectral remote sensing. Int. J. Appl. Earth Obs. Geoinf. 2003, 4, 295–310. [Google Scholar] [CrossRef]
  27. Xing, J.; De Baerdemaeker, J. Bruise detection on ‘Jonagold’ apples using hyperspectral imaging. Postharvest Biol. Technol. 2005, 37, 152–162. [Google Scholar] [CrossRef]
  28. Rossel, R.A.; McBratney, A.B. Diffuse reflectance spectroscopy as a tool for digital soil mapping. In Digital Soil Mapping with Limited Data; Mc Bratney, A.B., Hartemink, A.E., Mendonça-Santos, L., Eds.; Developments in Soil Science Series; Elsevier: Amsterdam, The Netherlands, 2008. [Google Scholar]
  29. Atashpaz-Gargari, E.; Lucas, C. Imperialist competitive algorithm: An algorithm for optimization inspired by imperialistic competition. In Proceedings of the 2007 IEEE Congress on Evolutionary Computation, Singapore, 25–28 September 2007. [Google Scholar] [CrossRef]
  30. Simon, D.; Ergezer, M.; Du, D. Population distributions in biogeography-based optimization algorithms with elitism. In Proceedings of the 2009 IEEE International Conference on Systems, Man and Cybernetics, San Antonio, TX, USA, 11–14 October 2009; IEEE: Piscataway, NJ, USA, 2009; pp. 991–996. [Google Scholar]
  31. Anuthama, K.; Shankar, S.; Ilayaraja, V.; Kumar, G.S.; Rajmohan, M. Vignesh Determining dental sex dimorphism in South Indians using discriminant function analysis. Forensic Sci. Int. 2011, 212, 86–89. [Google Scholar] [CrossRef]
  32. Pourdarbani, R.; Sabzi, S.; Kalantari, D.; Karimzadeh, R.; Ilbeygi, E.; Arribas, J.I. Automatic non-destructive video estimation of maturation levels in Fuji apple (Malus Malus pumila) fruit in orchard based on colour (Vis) and spectral (NIR) data. Biosyst. Eng. 2020, 195, 136–151. [Google Scholar] [CrossRef]
  33. Alibaba, M.; Pourdarbani, R.; Manesh, M.H.K.; Ochoa, G.V.; Forero, J.D. Thermodynamic, exergo-economic and exergo-environmental analysis of hybrid geothermal-solar power plant based on ORC cycle using emergy concept. Heliyon 2020, 6, e03758. [Google Scholar] [CrossRef] [PubMed]
Figure 1. Box plots indicating correct classification rate and area under ROC in 200 repetitions.
Plants 10 00898 g001aPlants 10 00898 g001b
Figure 2. Receiver operating curve of classifiers to classify cucumber leaves in terms of nitrogen content in 200 iterations.
Plants 10 00898 g002aPlants 10 00898 g002b
Figure 3. Different stages of the training classification algorithm for cucumber leaves based on nitrogen content.
Plants 10 00898 g003
Figure 4. Example of the cucumber leaves on different sampling days.
Plants 10 00898 g004aPlants 10 00898 g004b
Figure 5. Hardware system for the classification of cucumber plants. (a) Super spectral camera, (b) lighting enclosure.
Plants 10 00898 g005
Table 1. Performance of different classifiers for the classification of cucumber leaves based on nitrogen content in 200 iterations.
MethodsClassesD0D1D2D3Total DataMisclassified (%)CCR.
KNND044,8729480045,8202.1195.24
D1101340,091768122943,1017.5
D2043029,49069530,6153.81
D30151977333,17235,4646.9
RBFD024,24116,7402950188945,82089.0164.03
D116936,0724155270543,10119.48
D20316826,83761030,61514.07
D31417,809554312,09835,464193.13
LDAD043,7031751366045,8204.8495.73
D167340,845266131743,1015.52
D2039529,74447630,6152.92
D3045890434,10235,4643.99
ANN-ICAD044,79499729045,8202.2996.14
D1108740,92613395543,1015.31
D2061029,59640930,6153.44
D3091584633,70335,4645.22
ANN-HSD044,87289949045,8202.1196.11
D1107940,91415195743,1015.34
D2161729,58141630,6153.49
D30100884733,60935,4645.51
MVD044,566115796145,8202.8195.55
D1109440,96513291043,1015.21
D2871429,48640730,6153.82
D30158078833,09635,4647.15
Table 2. Evaluation criteria for comparing different classifiers for the classification of cucumber leaves based on nitrogen content in 200 iterations.
MethodsClassesRecall (%)Accuracy (%)Specificity (%)Precision (%)F (%)
KNND097.7923198.6890599.0858397.9310397.86162
D193.2609196.1525997.277193.016493.1385
D295.03498.2261199.0566896.3253395.67531
D394.5178997.2234198.0367593.5371194.02494
RBFD099.2507482.0163677.6582552.9048569.01942
D148.8853468.9250989.9878983.6917961.71957
D267.9675885.7997595.0412887.6596476.56776
D369.9225577.6479178.8573634.1134745.85529
LDAD098.4834198.1545798.0179495.3797596.90674
D194.0067796.8287997.9454594.7657894.38475
D295.0895198.4038699.2712697.1549996.11116
D395.0048897.9181798.8223596.1594995.57869
ANN-ICAD097.6308398.6018899.0251997.760897.69577
D194.1953696.9443698.0275394.9537194.57302
D296.7063198.6580299.1539596.6715796.68894
D396.110397.9460298.4958695.034495.56932
ANN-HSD097.6497298.6569999.0975997.9310397.79018
D194.1894296.9346898.0163194.9258794.55621
D296.5815698.6223799.141496.6225796.60206
D396.0751297.8791698.4175394.7693495.41777
MVD097.5869398.4342398.8034597.263297.4248
D192.2302896.36598.0454695.044293.6161
D296.6690798.5724699.0572596.3122796.49034
D396.1701697.5717997.9827193.3228194.72509
Table 3. Comparison of means and standard deviations of the AUC and CCR related to effective and all (entire) wavelengths to identify nitrogen-rich leaves in cucumber.
MV Method CCRAUCD0AUCD1AUCD2AUCD3
Effective wavelengthMean95.550.9980.9930.9960.995
SD0.77250.00090.00230.00070.0017
Entire wavelengthMean96.140.9980.9940.9980.996
SD0.07050.00130.00290.00080.00020
Table 4. Comparison of the correct classification rates related to entire and effective wavelengths by t-test.
Statistical CharactreisticValue
Mean−1.180 × 10⁻¹
Std. Deviation0.26381678
t-Value−1.001
Degree of Freedom4
Significance0.374 ns
ns: no significant differences.
Table 5. Comparison of the correct classification rates for entire and effective wavelengths by t-test.
ResearchersProduct TypeEarly Detection TypeCCR (%)
Proposed methodCucumberExcess nitrogen95.55
(Xie et al. [24])TomatoGray mold disease94.44
(Xia et al. [25])oilseed rapewaterlogging stress94.44
(Zhang et al. [26])TomatoStress90
(Xing. & Baerdemaeker [27])AppleBruise93
Table 6. The structure of the hidden layers of the neural network used to select optimal wavelengths.
ParameterSpesification
Number of Neurons18 & 16
Number of Layers2
Transfer Functionposlin, softmax
Back Propagation Network Training Functiontrainbr
Back Propagation Weight/Bias Learning Functionlearnp
Table 7. Equations of performance of MV classifier.
EquationsDescription
Recall = T P T P + F N × 100 How many samples are correctly detected
P r e c i s i o n = T P T P + F P × 100 How many correctly detected outputs are actually correct
Accuracy   = T P + T N T P + F N + F P + T N × 100 Total correct classification
Specificity   = T N T N + F P × 100 How many samples are incorrectly detected
F _ measure = 2 × Recall × P r e c i s i o n Recall + P r e c i s i o n Recall and precision harmonic weighted average
F P   R a t e = F P T N + F P × 100 Receiver operational curve (ROC)
TP: True PositiveFP: False Positive
TN: True NegativeFN: False Negative
Publisher’s Note: MDPI stays neutral with regard to jurisdictional claims in published maps and institutional affiliations.

