Article

Genome-Wide Identification and Development of LTR Retrotransposon-Based Molecular Markers for the Melilotus Genus

The State Key Laboratory of Grassland Agro-Ecosystems, Key Laboratory of Grassland Livestock Industry Innovation, Ministry of Agriculture and Rural Affairs, College of Pastoral Agriculture Science and Technology, Lanzhou University, Lanzhou 730020, China
*
Author to whom correspondence should be addressed.
Contributed equally.
Plants 2021, 10(5), 890; https://doi.org/10.3390/plants10050890
Submission received: 29 January 2021 / Revised: 12 April 2021 / Accepted: 21 April 2021 / Published: 28 April 2021

Abstract

:
Melilotus is an important genus of legumes with industrial and medicinal value, partly due to the production of coumarin. To explore the genetic diversity and population structure of Melilotus, 40 accessions were analyzed using long terminal repeat (LTR) retrotransposon-based markers. A total of 585,894,349 bp of LTR retrotransposon sequences, accounting for 55.28% of the Melilotus genome, were identified using bioinformatics tools. A total of 181,040 LTR retrotransposons were identified and classified as Gypsy, Copia, or another type. A total of 350 pairs of primers were designed for assessing polymorphisms in 15 Melilotus albus accessions. Overall, 47 polymorphic primer pairs were screened for their availability and transferability in 18 Melilotus species. All the primer pairs were transferable, and 292 alleles were detected at 47 LTR retrotransposon loci. The average polymorphism information content (PIC) value was 0.66, which indicated that these markers were highly informative. Based on unweighted pair group method with arithmetic mean (UPGMA) dendrogram cluster analysis, the 18 Melilotus species were classified into three clusters. This study provides important data for future breeding programs and for implementing genetic improvements in the Melilotus genus.

1. Introduction

Transposons, including retrotransposons or DNA transposons, are mobile genetic elements that are common in the genomes of eukaryotes [1]. A single, open reading frame (ORF) in which Gag and Pol are fused is common to both Ty1-copia and Ty3-gypsy elements, although many retroelements have an extra ORF with an unknown function [2]. Long terminal repeat (LTR) retrotransposons that possess two long terminal repeats are the most abundant group of transposons in plants [3], and they are particularly abundant in species with large genomes [4]. Moreover, LTR retrotransposons play key roles in plant phenotype variations and in the evolution of genome structure and function [5,6,7,8]. Mascagni et al. studied the relationship between changes in LTR retrotransposon abundance and the evolution of a genus and confirmed that LTR retrotransposons have continued to evolve during speciation [9]. Barghini et al. investigated LTR retrotransposon dynamics in the evolution of the olive (Olea europaea) genome and found that retrotransposon activity has impacted the olive genome structure in more ancient times than in other angiosperms [10]. Copia and Gypsy are the two main subgroups of LTR retrotransposons, and the major structural difference between the Copia and Gypsy groups is based on the order of reverse transcriptase (RT) and integrase [11].
Given the abundant, ubiquitous, and transcriptionally active retrotransposons in plant genomes, many molecular marker systems have been developed to exploit insertional polymorphisms [12]. Several molecular barcoding methods have been developed for LTR retrotransposons on the basis of PCR technology, including the use of retrotransposon-microsatellite amplified polymorphism (REMAP), retrotransposon-based insertion polymorphism (RBIP), inter-primer binding sequence (IPBS), inter-retrotransposon amplified polymorphism (IRAP), and sequence-specific amplified polymorphism (SSAP) markers [13]. These developed markers have been deployed in a range of crop and wild plant species. Previous studies of the genetic diversity and evolution of field pea (Pisum), as revealed by RBIP analysis, grouped 3020 Pisum germplasms into landraces, cultivars, and wild Pisum [14].
Melilotus presents industrial value for coumarin production and is a highly important legume crop that includes annual or biennial types. Moreover, it is an extremely important green manure crop for agriculture and animal husbandry and is distributed mainly in the northern part of China [15]. Compared to most other forage types, Melilotus tends to show tolerance to harsh environmental conditions and exhibits high seed yields [16,17]. As a forage legume, Melilotus possesses the ability to fix nitrogen in a symbiotic interaction with soil rhizobia [18] and shows excellent nitrogen production, making these plants useful for crop rotations [19]. Because of the biological activity of its flavones, coumarins, and saponin, Melilotus (also known as wild alfalfa) is used in traditional Tibetan medicine and is grown as a honey plant [15,20], but high coumarin content can prohibit the use of this genus for forage. Melilotus has an extremely high market value and is widely used in Chinese herbal medicine, so studying the genetic diversity of Melilotus genus is a worthy endeavor [21]. Additionally, genetic studies of Melilotus are required to better understand the extent of interspecific variations in the genus. In general, molecular markers are extremely useful in assessing genetic diversity and identifying novel genotypes among the Melilotus germplasm. However, LTR retrotransposon markers, which are excellent and sensitive tools for detecting genetic diversity and rapid genome changes, still have not been used to study Melilotus. Thus, the identification and study of LTR elements are two of the basic and indispensable steps for understanding the biology and evolution of this genus [22]. Our research group completed the whole-genome sequencing of diploid M. albus, with a genome size of approximately 1.04 Gb (BioProject ID: PRJNA674670) and eight chromosomes (2n = 16) [23]. In all, 772,285 transposable elements (TEs) and 181,040 LTR-RTs (retrotransposons) were identified. The LTR-RTs accounted for 55.28% of the Melilotus genome, which is higher than the value determined from the Medicago truncatula genomes [24]. Neutrality is a desirable feature in evaluations of genetic differences between populations, so we identified outlier loci and performed neutrality tests on the developed markers. Herein, we aimed to identify and develop LTR retrotransposon markers in the Melilotus genome on the basis of the above data to assess the population structure and genetic diversity in other members of the genus.

2. Results

2.1. Identification and Analysis of LTR Retrotransposons in the Melilotus Genome

The number of identified LTR-RTs was 181,040 in the Melilotus genome (Table S1), with 101,240 belonging to the Ty3-gypsy group, 77,935 belonging to the Ty1-copia subgroup, and 1865 belonging to the other subgroup. In all, 168,428 LTR-RTs were successfully mapped to eight chromosomes of Melilotus. The maximum LTR-RTs was found on chromosome 2 (∼1.38%), and the minimum was observed on chromosome 4 (∼1.18%) (Figure S1). Their total length was 585,894,349 bp, which accounted for 55.28% of the Melilotus genome. In total, 350 primer pairs were designed on the basis of RBIPs, IRAPs, ISBPs, and REMAPs (Table 1).

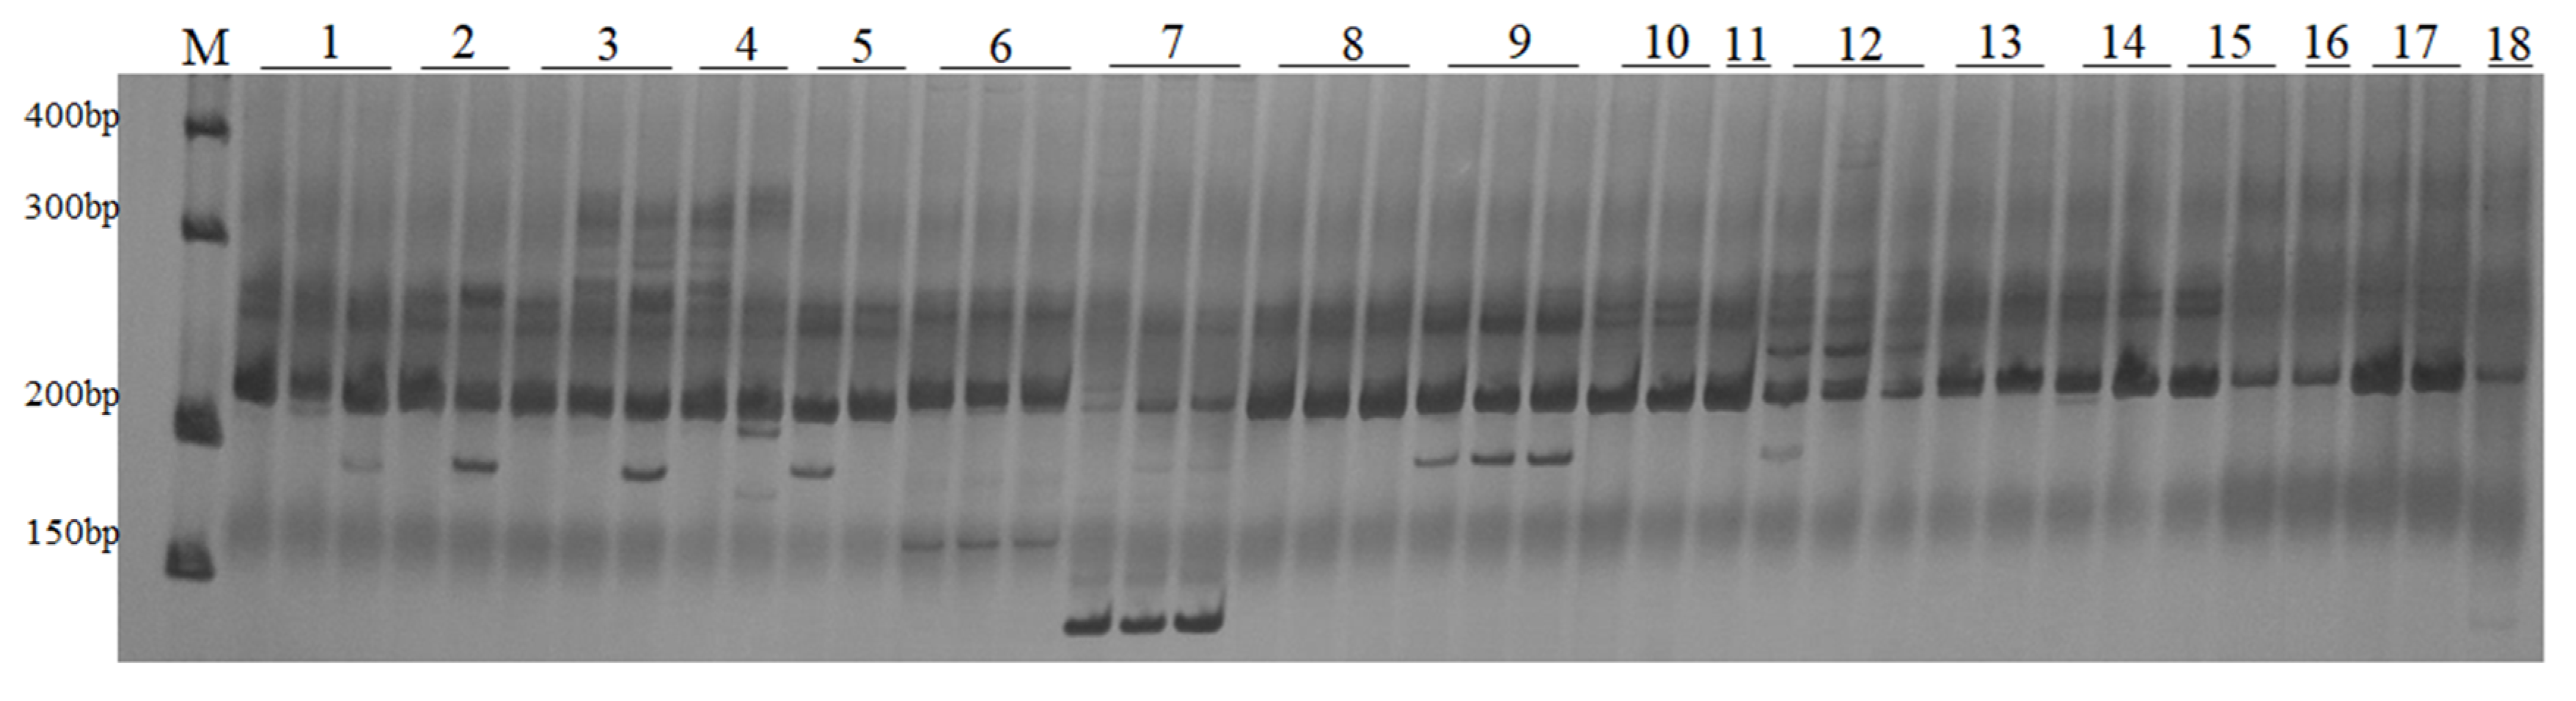
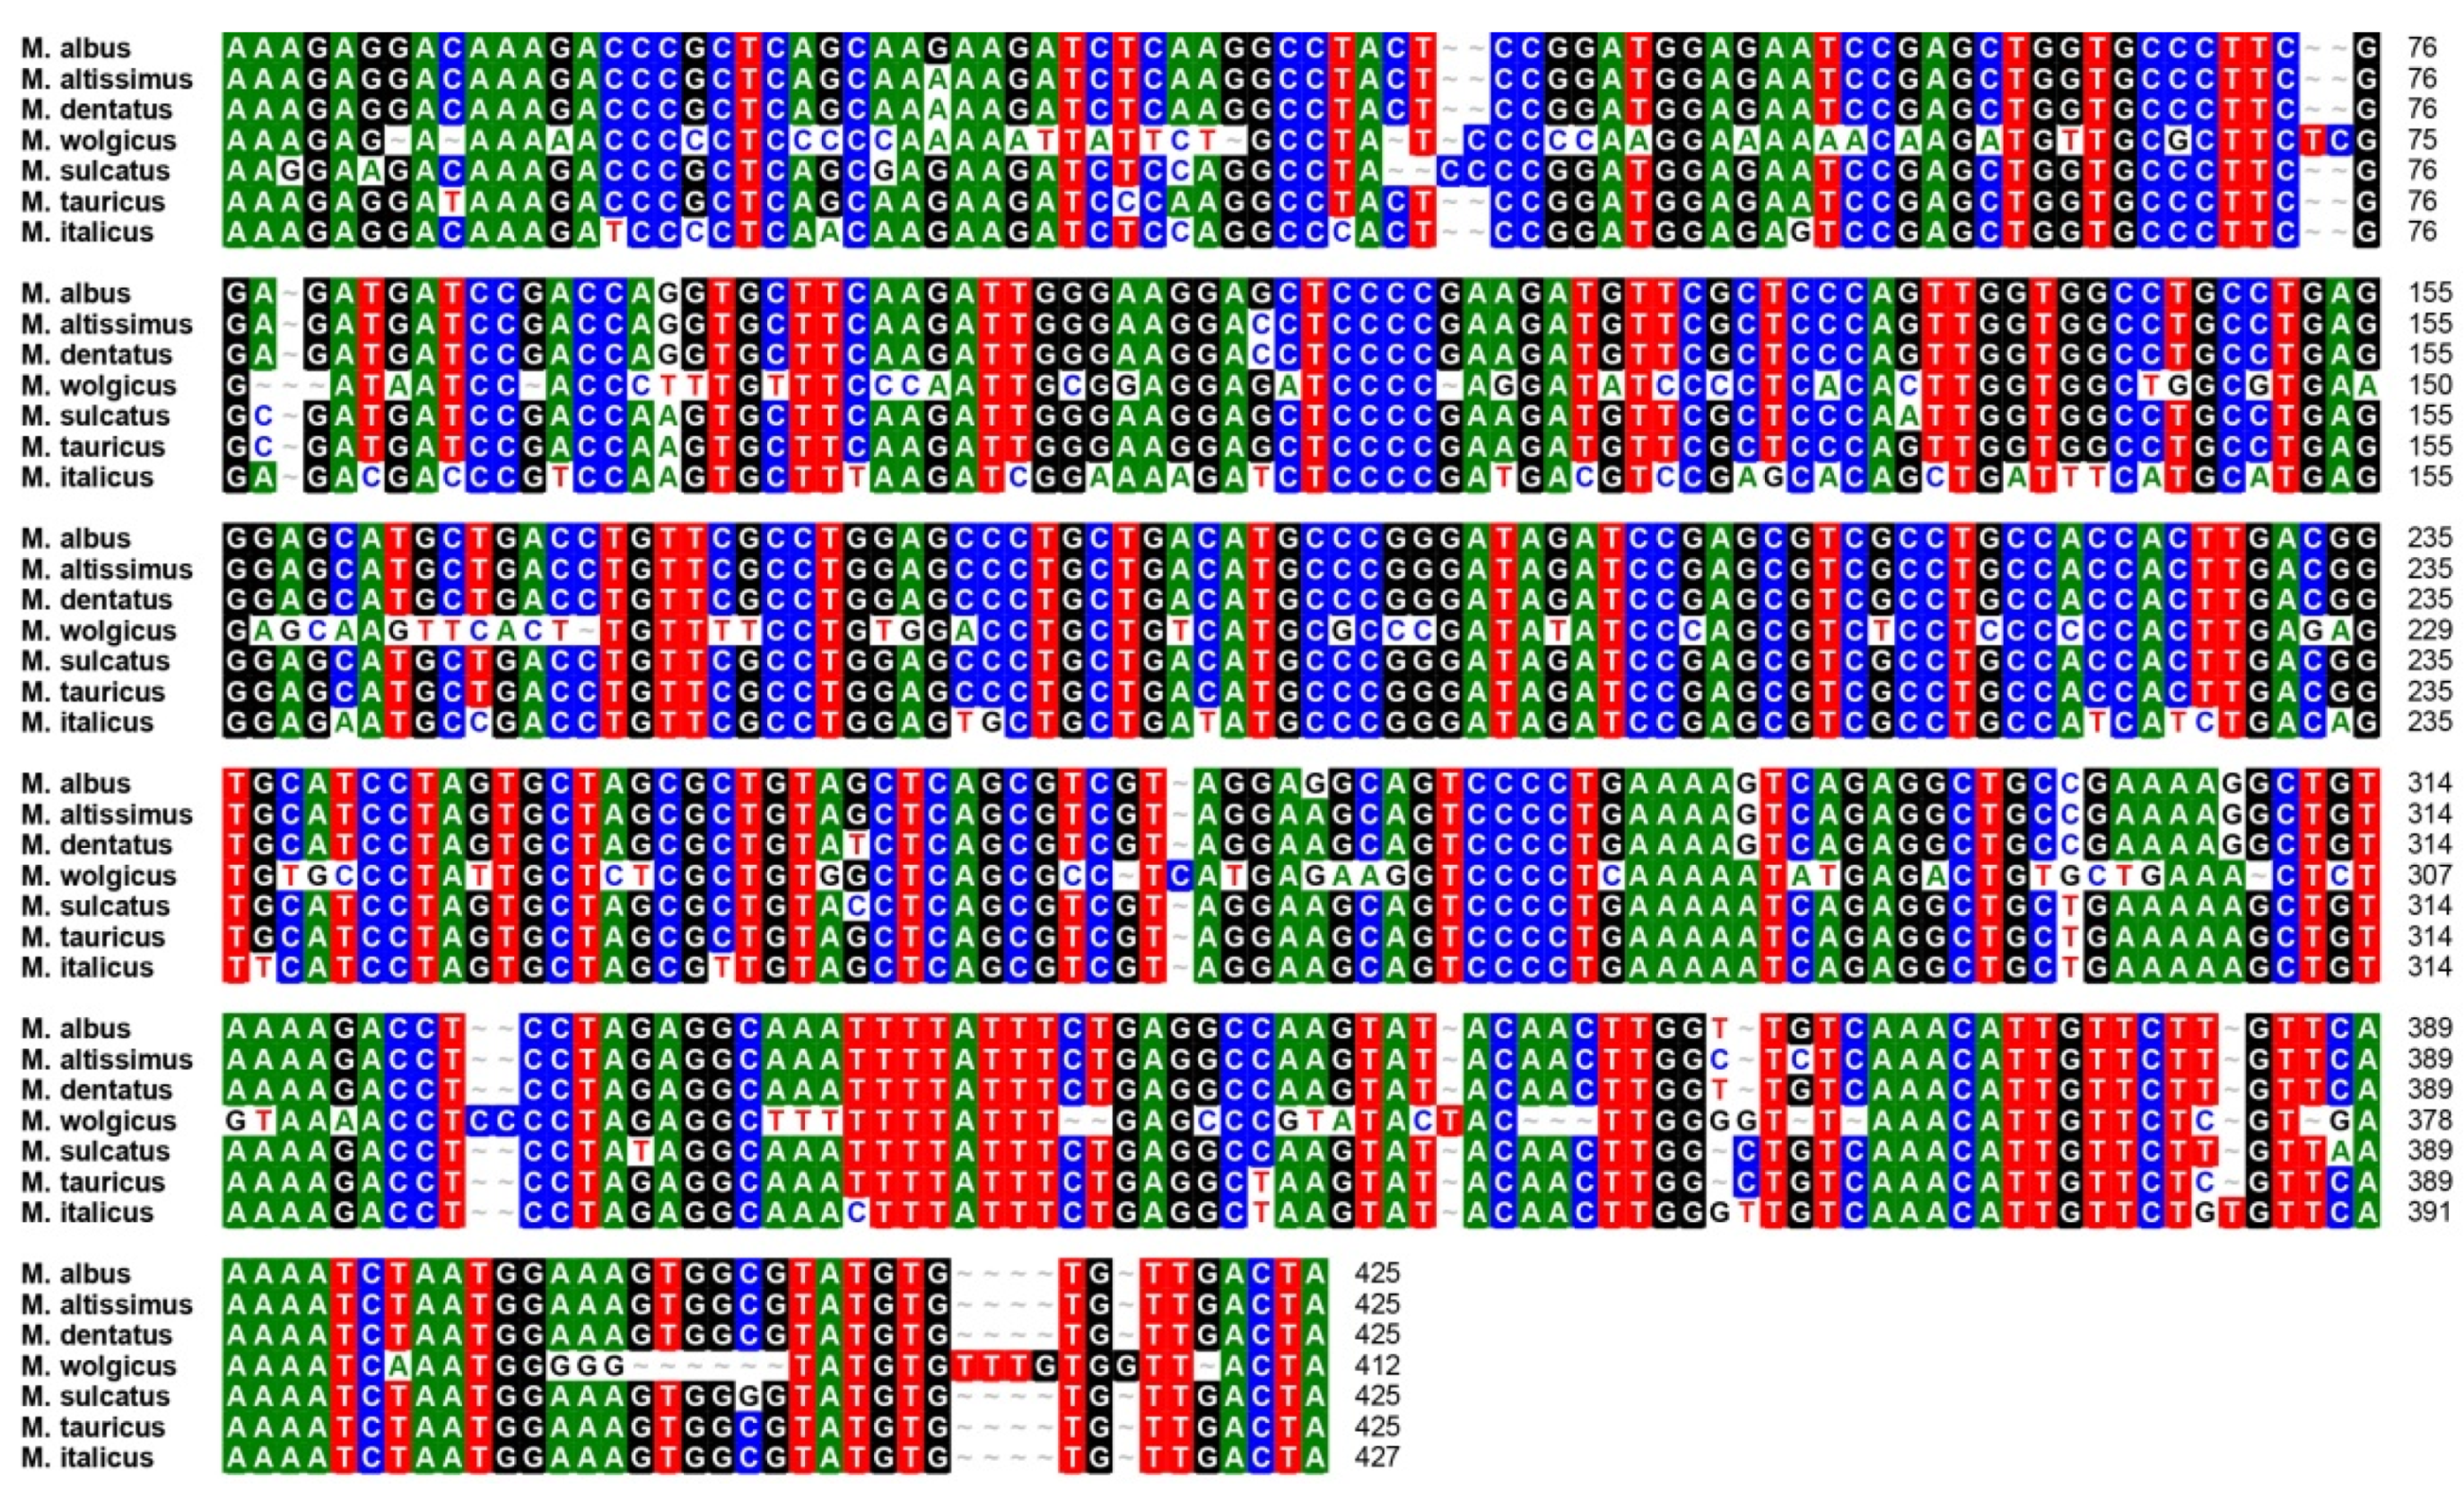
2.2. Amplification with LTR Primers in Melilotus

To amplify the genomic DNA of four accessions (Acc3, Acc5, Acc6, and Acc7) that were randomly selected for primer identification, 350 LTR-RT primer pairs were initially used. The total number of primer pairs that generated amplification products was 320, and 79 primer pairs showed polymorphism in four accessions. The polymorphic primers were chosen for further screening using 15 M. albus accessions, and each accession included four individual plants (Figure S2). Among the primer pairs, 47 produced bands and revealed polymorphisms, including 34 pairs of RBIP primers and 13 pairs of IRAP primers (Figure 1, Table S2). Additionally, to confirm the authenticity and accuracy of the PCR amplification bands obtained, the electrophoretic bands produced by primer pair Ma_LTR_302, which amplified variant alleles ranging from 411 to 426 bp in the seven Melilotus species, were sequenced. The primer pair Ma_LTR_302 belongs to the RBIP type, with the forward primer located outside of the LTR in the surrounding genome sequence of the LTR-RTs and the reverse primer located in the LTR regions of the LTR-RTs (Figure 2). We found that the flanking sequence inserted by LTR-RT is the main cause of polymorphisms, which is in accordance with previous studies [12].

2.3. Transferability of the Newly Developed LTR Retrotransposon-Based Markers

In the first step, 79 pairs of primers were selected and further screened in 15 M. albus accessions. In total, 47of the 79 LTR primer pairs showed polymorphisms among 15 M. albus accessions. A total of 182 alleles were obtained, and 3 to 7 alleles were observed per locus, with an average of 3.96. Primer 229 had the largest number of polymorphic bands (7) and highest polymorphism information content (PIC) value. The average expected heterozygosity (He) was 0.61, ranging from 0.42 to 0.8. The PIC values were between 0.38 and 0.77, with a mean of 0.54 (Table 2).
In this study, 47 newly developed LTR-RT markers generated polymorphic bands in 40 accessions of 18 Melilotus species. A total of 292 alleles were obtained at the 47 transferable LTR-RT-based markers in 18 species, and 3 to 15 alleles were observed per locus, with an average of 6.21 (Table S2), and 265 polymorphic loci were observed (90.75%). Primer 62 had the largest number of polymorphic bands (15) and highest PIC value, while primers 152, 277, and 290 produced the lowest number of polymorphic bands (3). The average He was 0.70, ranging from 0.37 (primer 93) to 0.86 (primer 283). The PIC values were between 0.35 (primer 93) and 0.84 (primer 283), with a mean of 0.66.

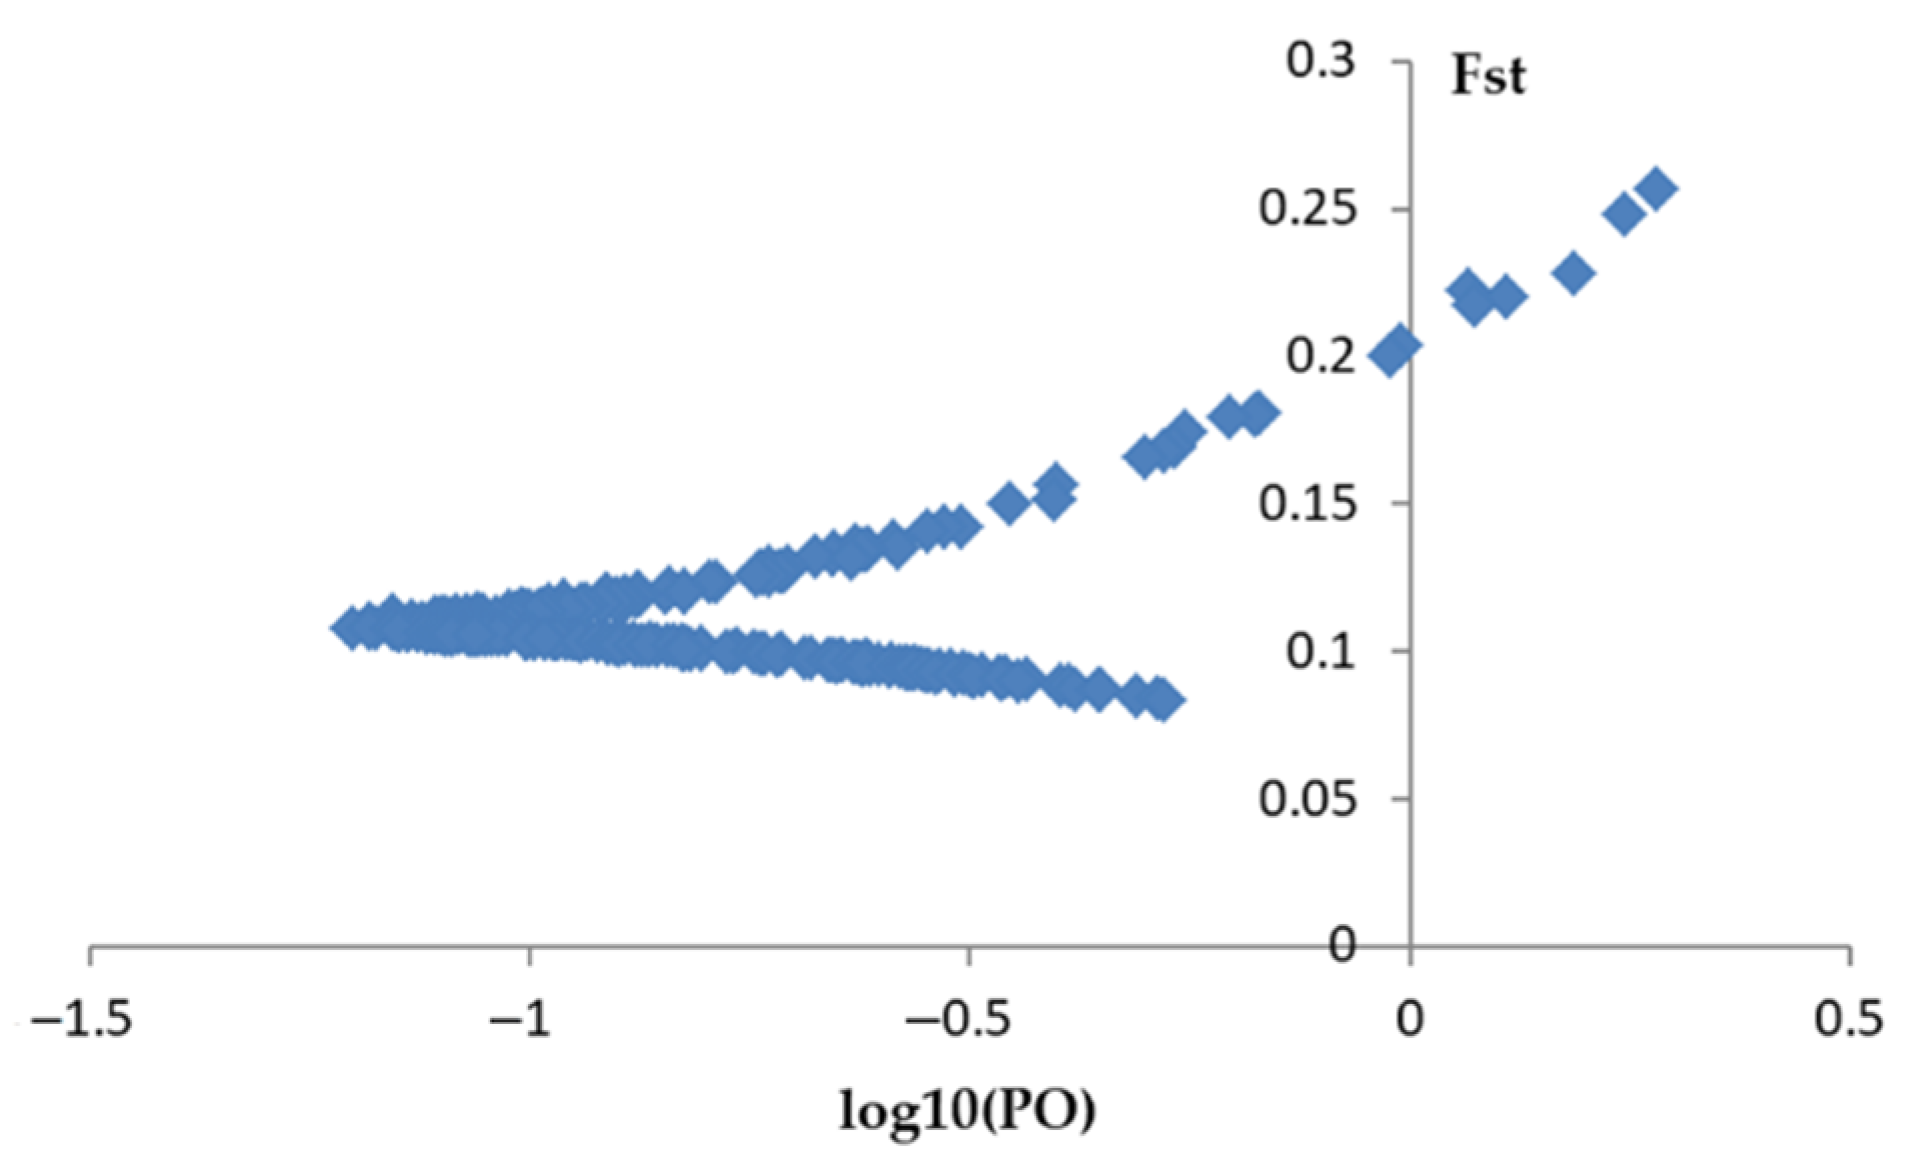
2.4. Outlier Detection

We successfully tested a total of 47 polymorphic LTR-RT markers in 18 Melilotus populations. We used the BayeScan 2.1 program and revealed 14 outlier loci in the group of 292 amplified loci (Figure 3). All the detected outlier loci had positive alpha values and high FST values (FST = 0.16771–0.25660; Table S3).

2.5. Genetic Diversity

The percentage of polymorphic loci (PPL), number of polymorphic loci (NPL), effective number of alleles (Ne), observed number of alleles (NA), Shannon’s information index (I), and Nei’s (1973) gene diversity (h) varied among the Melilotus species (Table 3). The NPL ranged from 0 (M. sulcatus, M. segetalis, and M. wolgicus) to 98 (M. italicus), with a mean of 37.67, and the highest and lowest PPL were 33.56% and 0%, respectively, with a mean of 12.90. The NA ranged between 1 (M. segetalis, M. sulcatus, and M. wolgicus) and 1.3356 in M. italicus, with an average value of 1.1290. The Ne varied from 1 (M. segetalis, M. sulcatus, and M. wolgicus) to 1.2282 (M. italicus), with an average of 1.0879. The highest level of h (0.1309) was observed for M. italicus, while the lowest level of h (0) was recorded for M. segetalis, M. sulcatus, and M. wolgicus, with an average value of 0.0510. Accordingly, the average I was 0.0750.

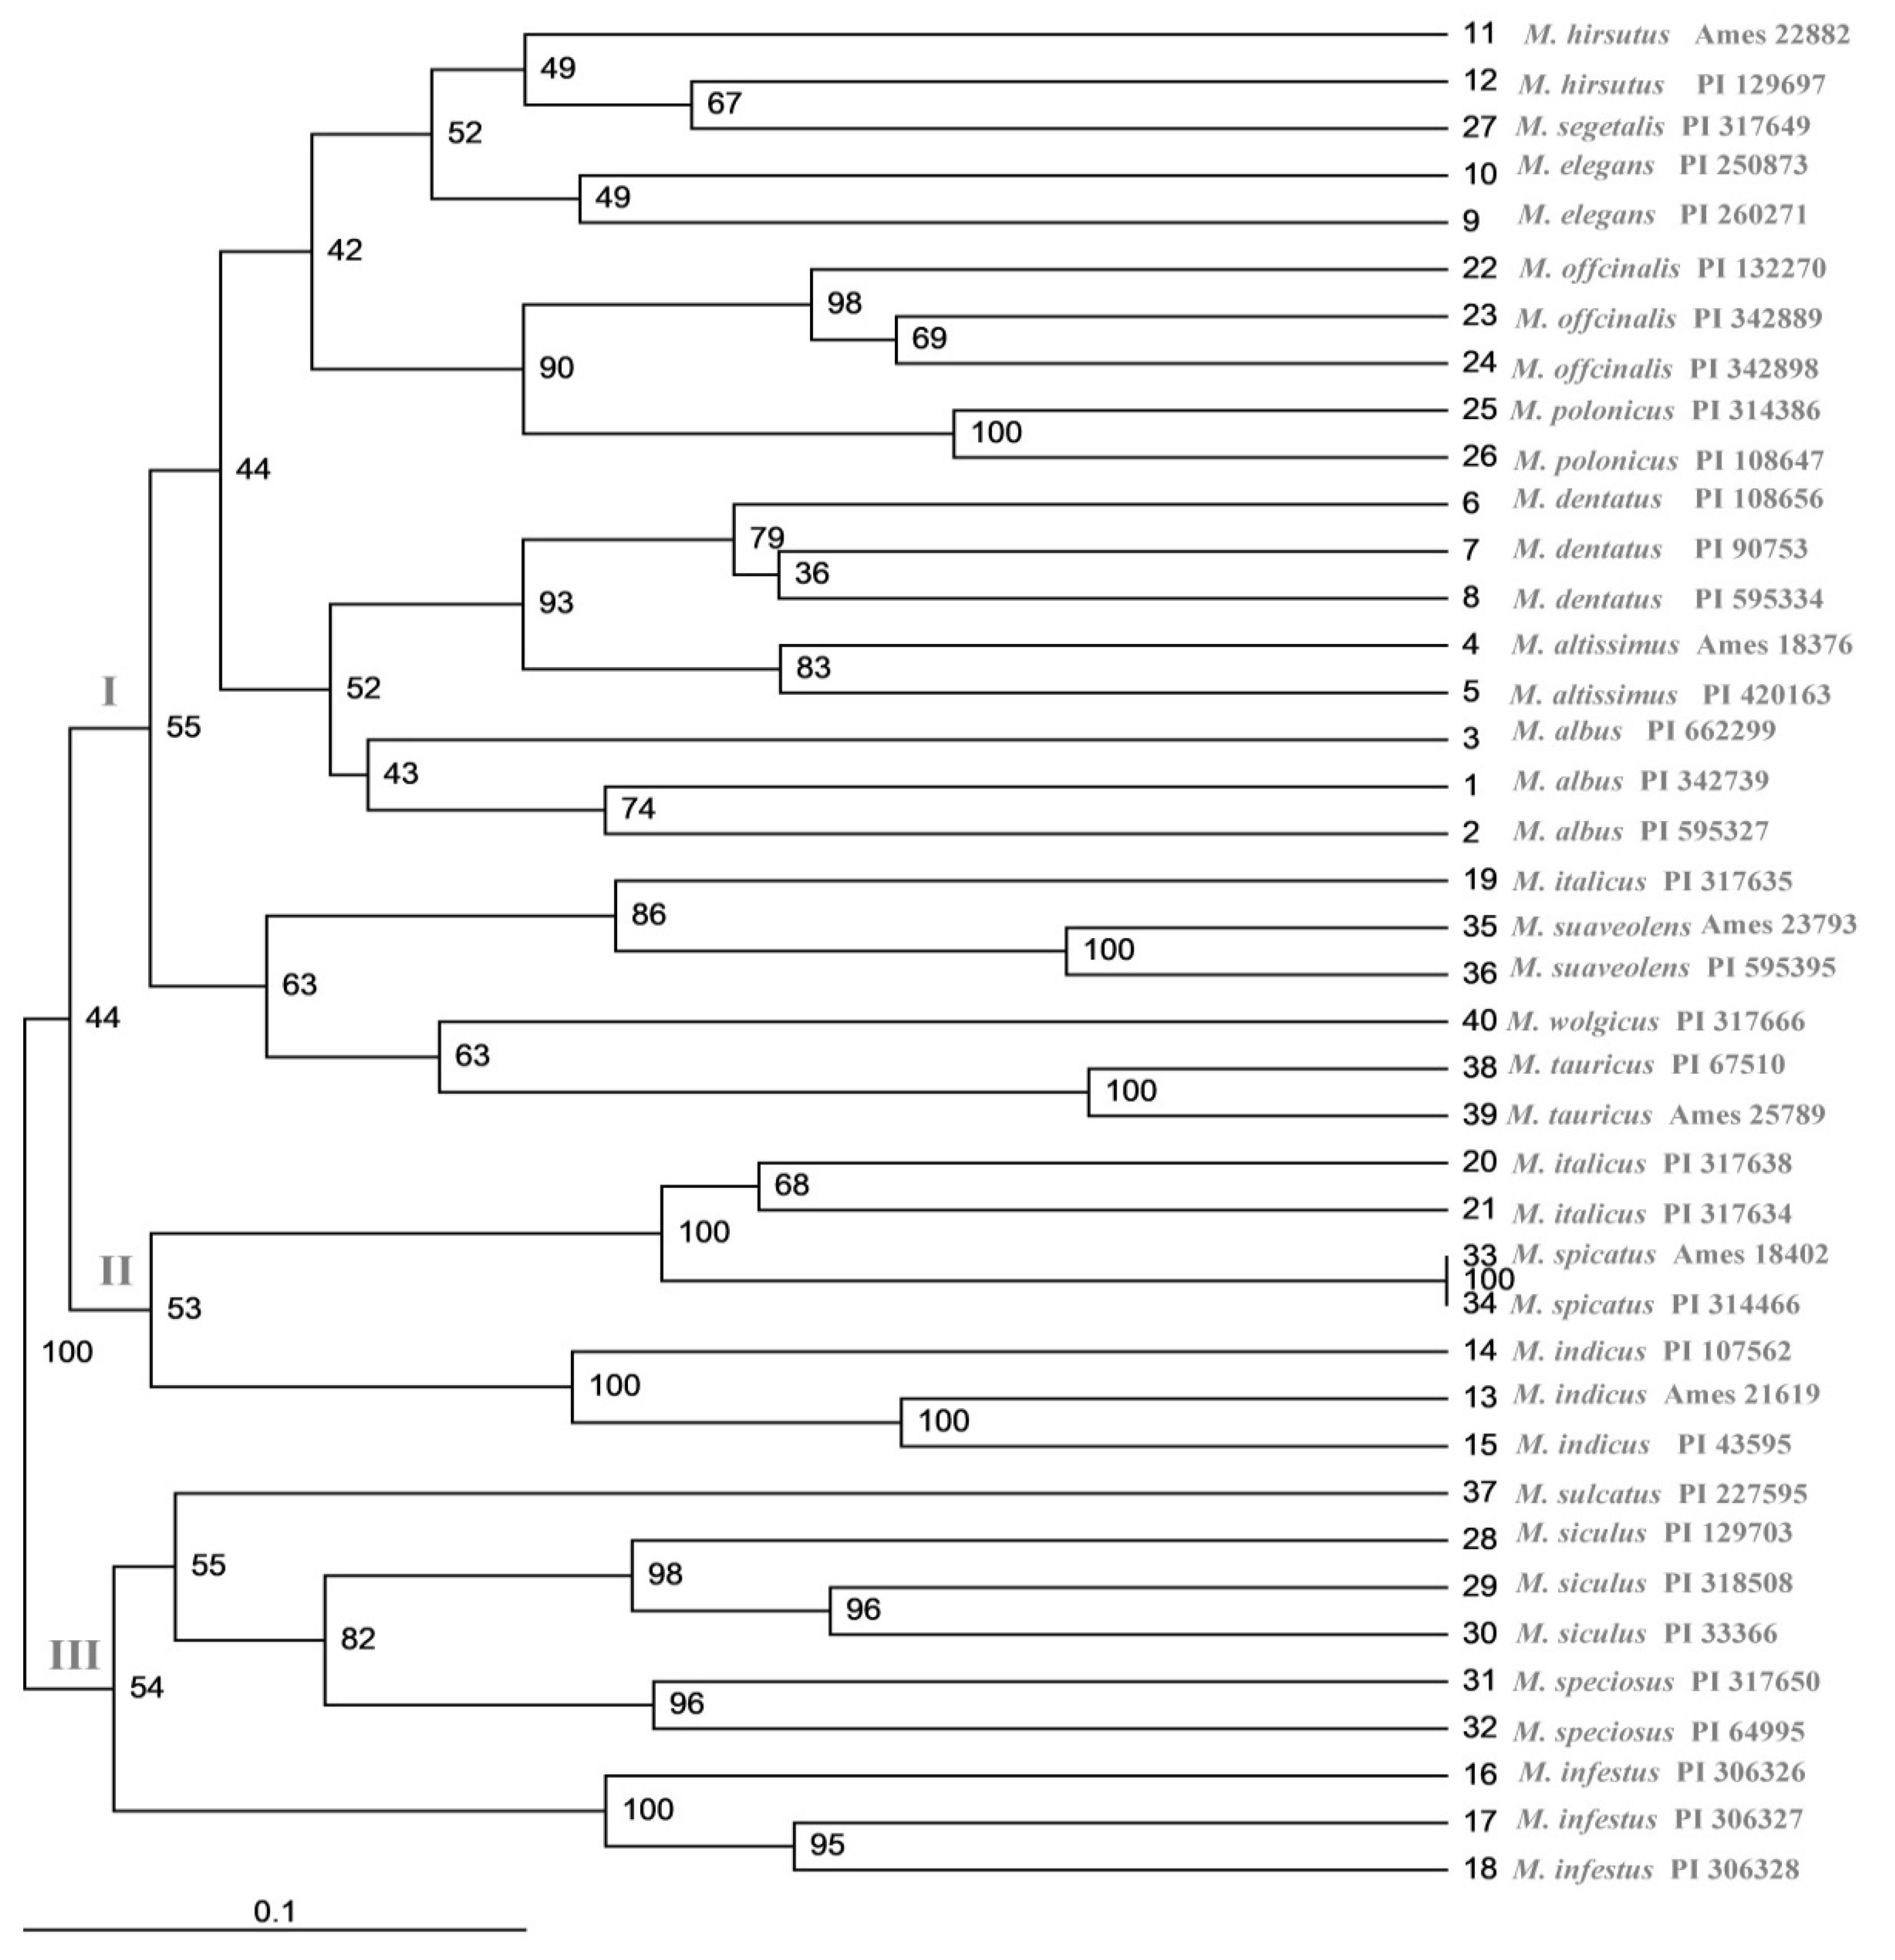
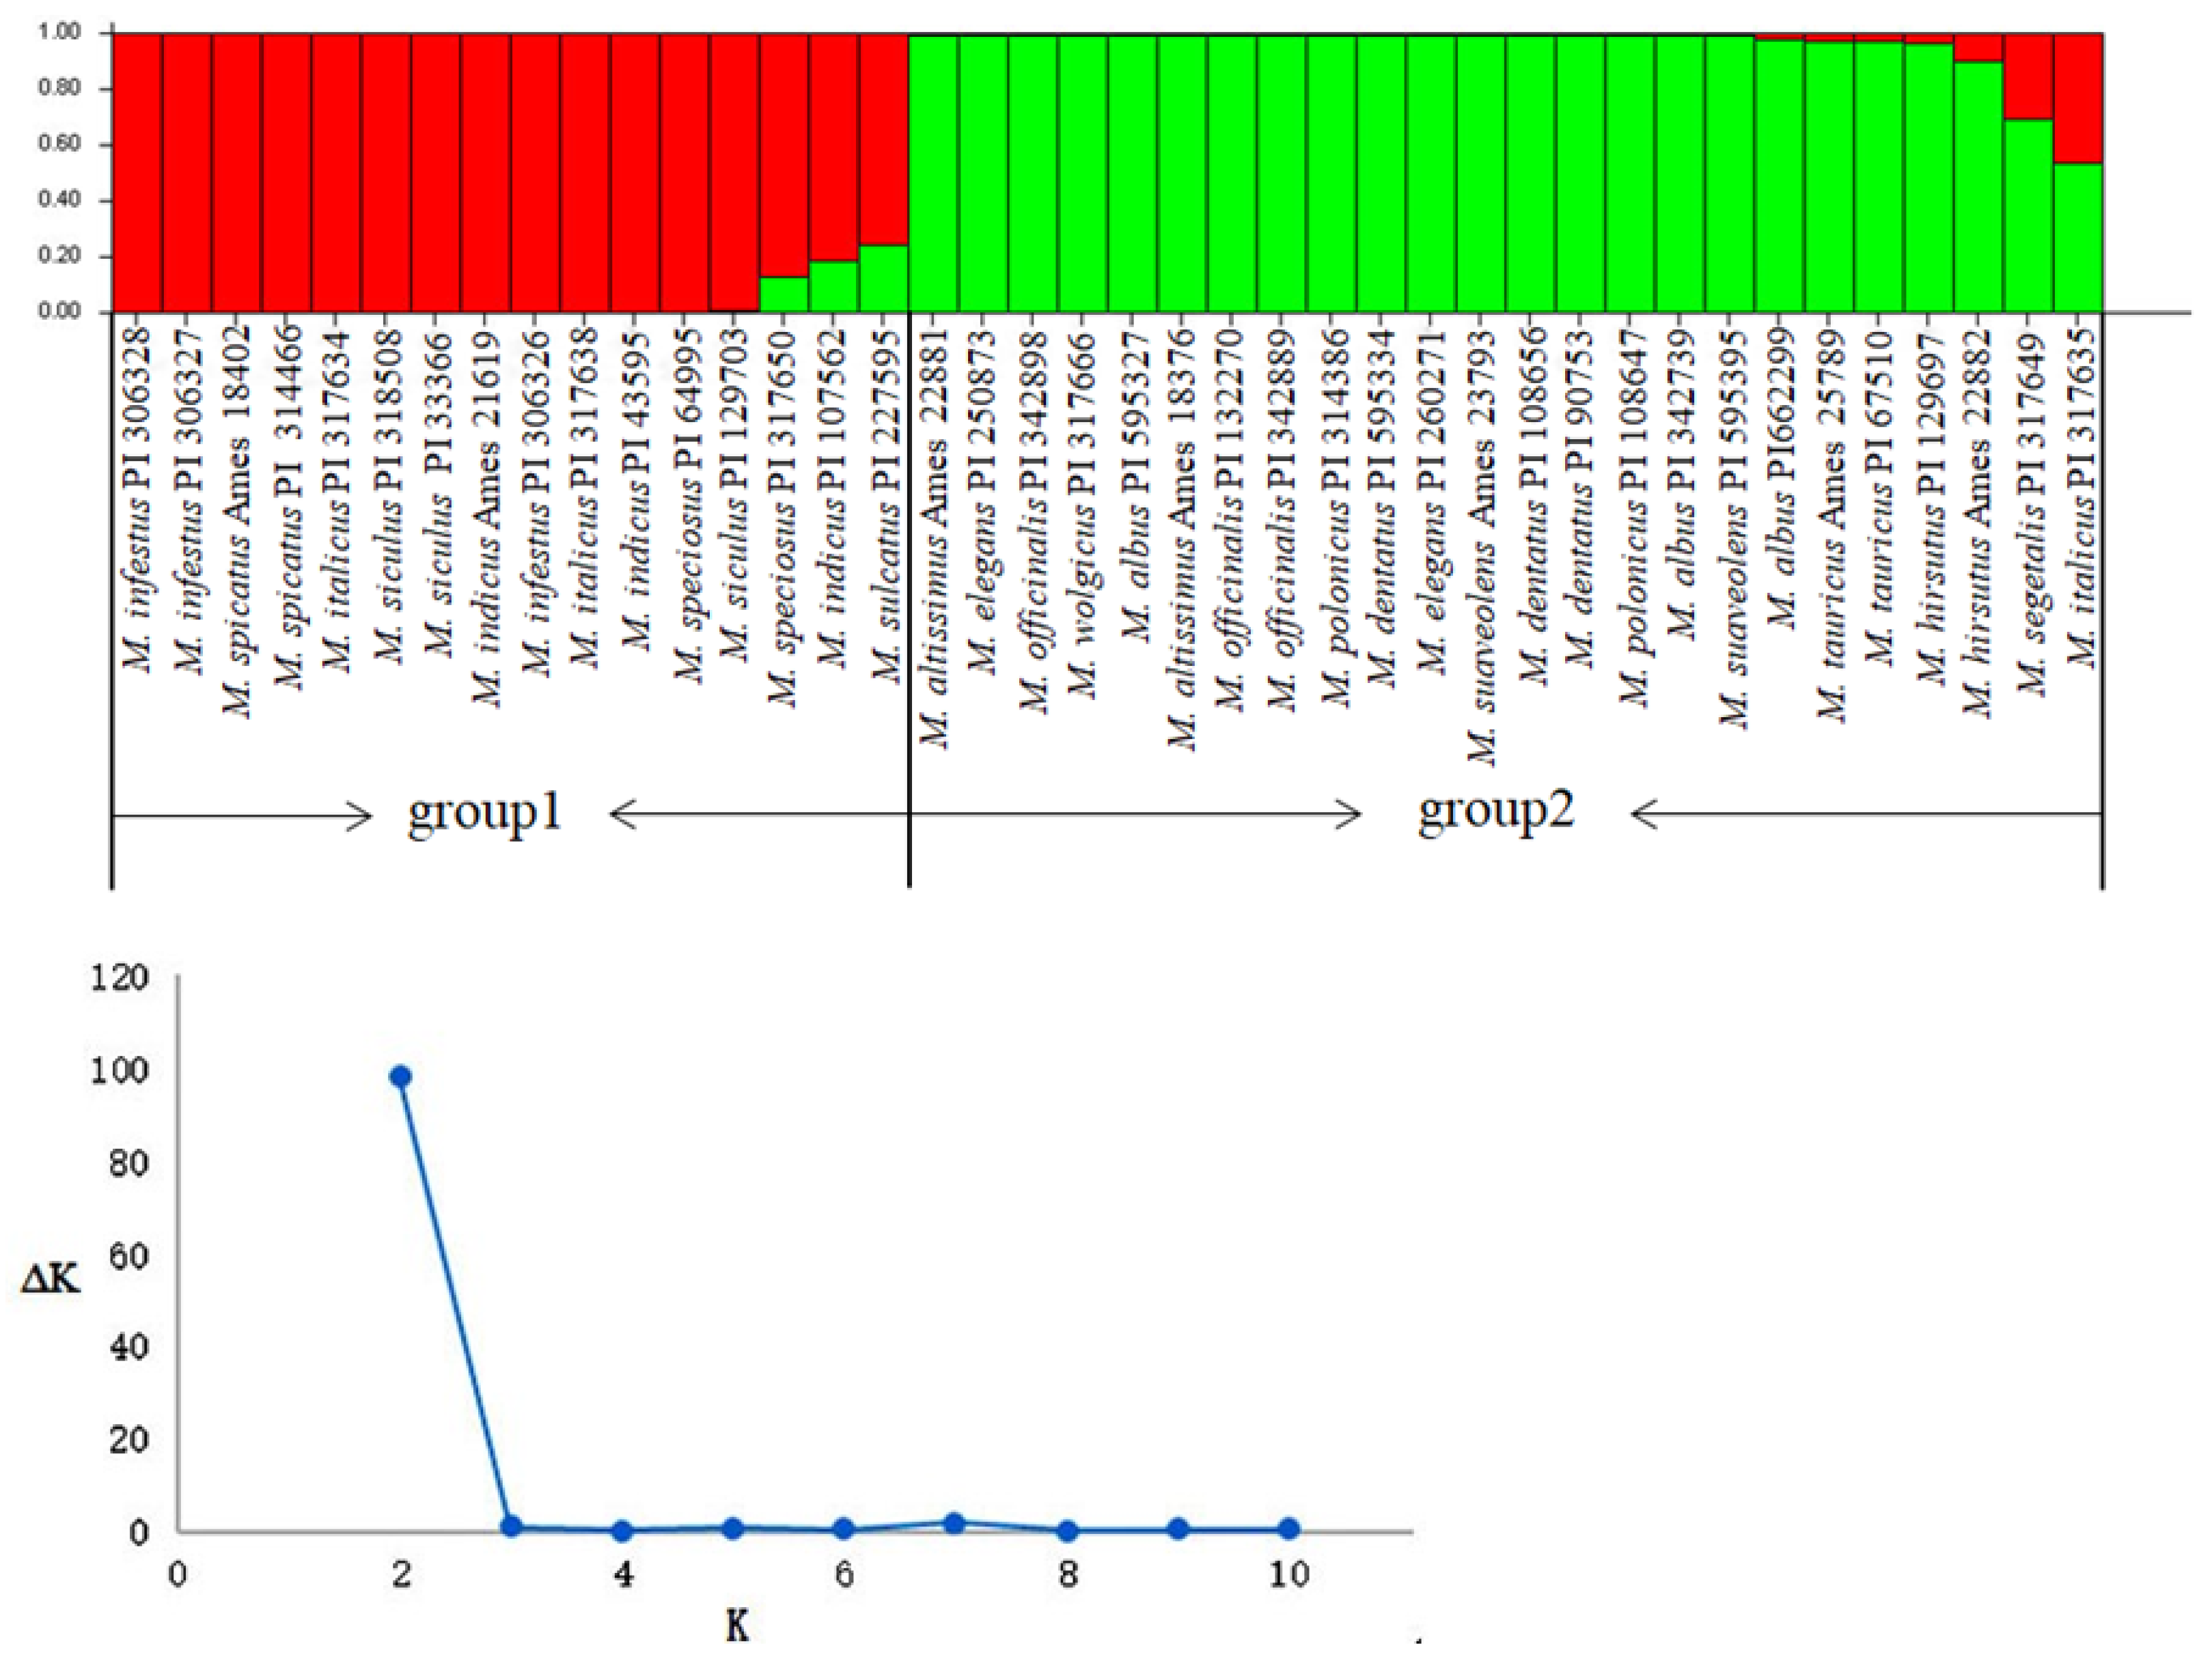
2.6. Cluster and Population Structure Analysis

The unweighted pair group method with arithmetic mean (UPGMA) dendrogram showed that the 18 Melilotus species were divided into three clusters (Figure 4). Cluster I included M. elegans, M. dentatus, M. albus, M. hirsutus, M. altissimus, M. segetalis, M. officinalis, M. polonicus, M. suaveolens, M. tauricus, and M. wolgicus, except for germplasm PI317635 of M. italicus. Cluster II contained four species, namely, M. infestus, M. speciosus, M. sulcatus, and M. siculus. Cluster III contained the remaining three species, namely, M. italicus, M. indicus, and M. spicatus. In the dendrogram constructed, bootstrap values ranged from 36% to 100% between clusters, and the average bootstrap value observed in this study was 75%.
Cophenetic correlation analysis was carried out to confirm the grouping pattern of the Melilotus species (Figure S3). The correlation test results showed that the correlation coefficient r was equal to 0.817 (Figure S3B).
Furthermore, 15 individual plants of M. albus were classified into four main clusters (Figure S4). The cluster analysis showed that single plants from an accession were clustered together, and the genetic similarity coefficients of 15 germplasms ranged between 0.75 and 0.95, thus revealing their close genetic relationships.
In accordance with the observed optimal goodness of fit (K = 2), the Bayesian clustering model, which was carried out with STRUCTURE software on all individuals and run for K = 1–11, divided the 40 evaluated accessions belonging to 18 Melilotus species into two groups (Figure 5). Group 1 contained 16 individuals belonging to 7 species, namely, M. sulcatus, M. siculus, M. spicatus, M. speciosus, M. italicus, M. infestus, and M. indicus. Group 2 contained 11 species, namely, M. altissimus, M. albus, M. hirsutus, M. dentatus, M. elegans, M. segetalis, M. officinalis, M. polonicus, M. suaveolens, M. wolgicus, and M. tauricus, except for germplasm PI317635 of M. italicus.
Genetic variation within and among the Melilotus were determined by analysis of molecular variance (AMOVA). All species were analyzed to be a single group by AMOVA (Table 4). According to the AMOVA results, there were highly significant differences (p < 0.001) in genetic differentiation among species and within species. Of the total genetic variance, 45.19% was due to differences among species, and 54.81% was due to differences within species. Therefore, the results showed significant genetic differences among the 18 Melilotus species of the one group.
According to the structure results, we used the analysis of molecular variance (AMOVA) to evaluate variance components among groups, among species within groups and within species (Table 4). According to the AMOVA results, there were highly significant differences (p < 0.001) in genetic differentiation among groups, among species within groups and within species. Of the total genetic variance, 12.13% was due to differences among groups, 44.29% was due to differences among species within groups, and the remaining 43.58% was due to differences within species. Therefore, the results showed significant genetic differences among the 18 Melilotus species of the two groups.
Table 4. Analysis of molecular variance (AMOVA) for 18 Melilotus species of the two groups.
Source of VariationDegrees of FreedomSum of SquaresVariance ComponentsPercentage of Variationp-Value
Among groups1167.7595.19812.13<0.001
Among species within groups16963.85718.97644.29<0.001
Within species22410.83318.67443.58<0.001
Table 5. The four classifications of molecular phylogeny, SSR, EST-SSR, and LTR-RT makers in Melilotus.
CategoriesClassificationSubclassificationSpecies
Molecular phylogeny [25]Clade I M. albus, M. altissimus, M. hirsatus, M.officinalis, M. polonicus, M. suaveolens, M. wolgicus, M. elegans, M. dentatus, M. tauricus
Clade IIClade 1M. spicatus
IIbM. indicus, M. segetalis
Clade 2M. infestus
IIaM. siculus, M. sulcatus, M. speciosus, M. italicus
SSR makers [26]A M. albus, M. altissimus, M. hirsutus, M. officinalis, M. polonicus, M. suaveolens, M. wolgicus, M. elegans, M.infestus, M. spicatus, M. sulcatus,
A1M. italicus, M. speciosus
B M. dentatus, M. siculus, M. tauricus
B1M. indicus, M. segetalis
EST-SSR markers [27]I M. albus, M. altissimus, M. hirsutus, M. officinalis, M. polonicus, M. suaveolens, M. wolgicus, M. elegans, M. dentatus, M. tauricus
II M. indicus, M. segetalis, M. italicus, M. spicatus
III M. infestus, M. siculus, M. speciosus, M. sulcatus
LTR-RT markersGI M. albus, M. altissimus, M. hirsutus, M. officinalis, M. polonicus, M. suaveolens, M. wolgicus, M. elegans, M. dentatus, M. tauricus, M. segetalis
GIII
GII
M. indicus, M. italicus, M. spicatus
M. infestus, M. siculus, M. speciosus, M. sulcatus

3. Discussion

Molecular markers based on LTR retrotransposons show broad applications in genetic mapping, genetic diversity assessment [28,29], phylogenetic evolution analysis [30], and variety identification [31]. Additionally, compared with traditional phenotypic markers, molecular markers are more efficient, accurate, and reliable for differentiating varieties and closely related species [32]. Nevertheless, relatively few molecular markers have been found in numerous non-model plants, including Melilotus, which considerably limits the genetic research on these species. In previous studies, the genetic diversity of Melilotus has been investigated using different molecular markers, such as simple sequence repeats (SSRs) [26,33] and expressed sequence tags-simple sequence repeats (EST-SSRs) [27,34]. In plant research, retrotransposons play a major role in genome evolution [35], and the presence of a very large number of error-prone retrovirus replications can lead to accumulation of genetic variations [36]. Ramakrishnan et al. deployed retrotransposon-based markers to reveal the genetic diversity and population structure of Asian bamboo [37]. However, LTR-RT-based molecular markers, which are remarkable tools in detecting genetic diversity, have not previously been used in Melilotus.
In this study, 181,040 LTR retrotransposons were used to develop 350 LTR primer pairs for PCR amplification. In total, 47 of the 79 LTR primer pairs showed polymorphisms among 15 M. albus accessions, which indicated that this type of molecular marker can distinguish 15 M. albus accessions well (Figures S2 and Figure S3). The high levels of polymorphism observed may be due to the M. albus materials selected for screening the primers. In addition, the polymorphic primer pairs were screened to validate the availability and transferability of LTR-RTs in a panel of 40 Melilotus accessions, which yielded 292 clear strong bands. The average number of alleles per primer pair found in this study was higher than the number of EST-SSRs [27,38], while 265 (90.75%) of 292 bands were polymorphic and showed the potential for use in genotyping. Moreover, all of the 47 primer pairs could amplify products successfully in most species and showed stable transferability, exhibiting a higher transferability rate than that obtained in chokecherry (Prunus virginiana L.) [39] and that from Melilotus EST-SSR primers [27]. Molecular markers are feasible for evaluating genetic diversity in plant species [40]. The genetic diversity revealed at LTR-RT loci was supported by high values of He and PIC. In this study, the mean He and PIC were 0.70 and 0.66, respectively. Primer 283 showed a stronger ability to discriminate genotypes due to its high PIC value (0.84). The primer 93 marker showed a lower PIC value (0.35), suggesting that this primer had less discriminatory ability in the present study. These results clearly suggest that more diverse LTR-retrotransposon marker loci can be identified and effectively applied to breeding programs to obtain the plant types desired for commercial cultivation. The I value can be used to evaluate the level of genetic diversity in a population, where the greater the I is, the greater the genetic diversity [41]. Yan et al. [27] obtained a lower average I value (0.0670) than this study (0.0750) using EST-SSR markers, indicating that the Melilotus accessions evaluated in this study were more diverse. In addition, the EST-SSR marker analysis did not consider mononucleotide repeats because of the difficulty of distinguishing single nucleotide repeats from polyadenylation products and single nucleotide stretch errors produced by sequencing [27].
In previous molecular phylogenetic analyses [25], 18 Melilotus species were classified into clade I and clade II (Table 5). An SSR maker analysis showed that all Melilotus species were clustered into A and B [26], which were further divided into A1 and B1, respectively (Table 5). An EST-SSR marker analysis showed that the 18 Melilotus species were grouped into I, II, and III [27]. According to the UPGMA cluster analysis involving the LTR-RT markers conducted in this study, the 18 species were grouped into three clusters. Among the 11 species in cluster I, 10, 10 and 8 of the species were consistent with clade I, I and A, respectively. Except for M. segetalis, the GIII of the phylogenetic trees was consistent with II. Cluster II contained the remaining species, which was consistent with III. As the primers increased, the results became more similar. Melilotus germplasms from different countries clustered together, indicating that kinship has a greater impact on the genetic structure than the location provenance used in the present study.
The detection of natural selection signatures within a genome can reveal which genes are under the influence of natural selection. It is possible to identify loci with an atypical variation pattern (outlier loci) by comparing the genetic diversity of loci across the genome, which is likely to be affected by selection. Outlier loci can better explain the adaptive genetic variation that is not accounted for by neutral loci [42]. Although a large number of loci were revealed in this study, less than 5% were identified as outliers (Table S3). Additionally, the results obtained with the LTR-RT markers were similar to those with the microsatellite (SSR) method, which revealed different sizes of DNA fragments by electrophoresis. Although LTR retrotransposons are highly heterogeneous in plants, homoplasy is also obviously important in evaluating phylogenetic relationships among species. However, microsatellites follow a stepwise mutation process, considering allele size difference, and it may be more suitable to use microsatellite data analysis [43].

4. Materials and Methods

4.1. Plant Materials, Genomic DNA Isolation, and PCR Primer Design

A total of 15 accessions of Melilotus albus were utilized to screen polymorphic LTR-RT-based markers and evaluate genetic diversity (Table S4). In total, 40 accessions of 18 Melilotus species were obtained to assess the newly developed LTR-RT-based markers for their transferability (Table 6). The seeds of the accessions utilized in this study were obtained from the National Plant Germplasm System (NPGS, Beltsville, MD, USA). Total genomic DNA was extracted using the sodium dodecyl sulfate (SDS) method [44]. The quality of the isolated DNA was assessed in 1% agarose gels and by a NanoDrop spectrophotometer (ND-1000, Thermo Scientific™, Waltham, MA, USA). The DNA concentrations were normalized to 20 ng/μL for polymerase chain reaction (PCR).

4.2. Identification of LTRs

Our research group completed the whole-genome sequencing of diploid M. albus, with a genome size of approximately 1.04 Gb (BioProject ID: PRJNA674670). The M. albus LTR sequences (LTRs) were identified using the ‘RepeatMasker’ tool on 20 December 2018 (http://www.repeatmasker.org/cgi-bin/WEBRepeatMasker). The ‘cross_match’ search engine was applied, and ‘Rice’ was specified as the DNA source. Other software parameters were run according to the default options. In addition, the LTR primers were designed using DNAMAN Version 6.0 (Lynnon Corporation, San Ramon, CA, USA) (Table S5).

4.3. Primer Selection and PCR Conditions

Four accessions of M. albus were randomly selected and used to screen 350 LTR-RT markers by PCR amplification. Amplification was conducted in a 10 μL reaction solution that included 1.0 μL of genomic DNA (20 ng/μL), 4.95 μL of 2× reaction mix (500 μM dNTP, 20 mM Tris–HCl, 100 mM KCl, 3 mM MgCl2), 2.0 μL of double-distilled water, 1.0 μL of each LTR primer (4 μM each), and 0.05 μL of 2.5 U/μL Golden DNA Polymerase. The PCR program consisted of a pre-denaturation of 3 min at 94 °C, followed by 35 cycles of 94 °C for 30 s, 50–60 °C for 30 s, and 72 °C for 30 s, and finally, an extension cycle of 7 min at 72 °C. The PCR products were separated in 6.0% nondenaturing polyacrylamide gels (400 V, 1.5 h) for visualization under UV Imager Gel Doc XR+ system lights (Bio-Rad, Hengshui, Hebei, China).

4.4. Sequencing of PCR Amplification Products

PCR was conducted in a 25.2 μL volume consisting of 10 μL of 2× reaction mix, 0.2 μL of Golden DNA Polymerase, 8.0 μL of ddH2O, 3.0 μL of genomic DNA (20 ng/μL), and 2.0 μL of each primer. The PCR products were sent to a commercial company (Shanghai Sangon Biological Engineering Technology, Shanghai, China) for sequencing (ABI 3730 DNA sequencer). Sequence information was used for multiple sequence alignment using DNAMAN.

4.5. Data Analysis

The number of amplified bands was recorded to construct a “0, 1” binary matrix. The polymorphism information content (PIC) and expected heterozygosity (He) were calculated as reported previously [45]. BayeScan.V.2.1 software [46] can be used to detect genetic markers under selection using differences in allele frequencies between populations. The default parameters given in the program were used. The POPGENE 32 software was used to calculate the percentage of polymorphic loci (PPL), number of polymorphic loci (NPL), number of observed alleles (NA), number of efficient alleles (Ne), Nei’s (1973) diversity index (h), and Shannon’s information index (I) [47]. Analysis of molecular variance (AMOVA) was carried out using the method of Arlequin suite version 3.5 [48]. The UPGMA dendrogram was produced using Free Tree V.9.1.50 software [49]. To assess the reliability, the field repetition count we used was 100. The phylogram was visualized by TreeViewX V.5.0 software [50]. In addition, the Cophenetic correlation test was carried out by using a matrix comparison plot in NTSYSpc.V.2.1. To subdivide the individuals into different subgroups, a Bayesian clustering analysis was carried out in STRUCTURE 2.3 software [51]. Because of the estimated ‘log probability of data’ [LnP(D)] of STRUCTURE overestimating the number of subgroups [52], we used the ad hoc measure K [53] to estimate the number of groups. Values of K to explore were chosen according to [53] and were calculated in Excel tables. It was run for K = 1–11 with the admixture model, and a total of 20 independent runs were set for each K value and for each run.

5. Conclusions

In conclusion, 350 pairs of LTR retrotransposon primers for identifying the molecular markers were designed for M. albus. Overall, 47 primer pairs showed high polymorphism among 15 M. albus accessions, and all of the polymorphic primer pairs showed transferability among 40 accessions of 18 Melilotus species. In addition, the origin of the accessions did not have an influence on the genetic structures in the 18 Melilotus species. Our results suggest that the markers investigated here will be useful for studying the genetic diversity, population structure, and germplasm of Melilotus species.

Supplementary Materials

The following are available online at https://www.mdpi.com/article/10.3390/plants10050890/s1, Table S1: The information of being identified LTR-RTs in the Melilotus genome. Table S2: Primer sequence, allele size range and polymorphism information for 47 LTR retrotransposon loci among 18 Melilotus species. Table S3: Detection of outlier loci using BayeScan. Table S4: List of M. albus accessions used for LTR-RT molecular marker validation. Table S5: Information of LTR primers designed using DNAMAN software. Figure S1: Distribution of the ratio of LTR retrotransposons on eight chromosomes of Melilotus. Figure S2: The result of PAGE (polyacrylamide gel electrophoresis) of primer 25 in 15 M. albus accessions. Figure S3: Matrix comparison plot for cophenetic correlation test. Figure S4: Dendrogram of 15 M. albus by the UPGMA cluster analysis based on LTR-RT analysis.

Author Contributions

J.Z., Z.O., and Y.W. conceptualized the study. T.M., G.K., and Z.O. contributed to the investigation. Z.O. and F.W. were in charge of data curation. Z.O. wrote the original draft, and J.Z. reviewed. All authors have read and agreed to the published version of the manuscript.

Funding

This research was funded by the National Natural Science Foundation of China (32061143035), the Gansu Provincial Science and Technology Major Projects (19ZD2NA002), the Gansu Provincial Intellectual Property Program (19ZSCQ044), and the 111 Project (B12002).

Institutional Review Board Statement

Not applicable.

Informed Consent Statement

Informed consent was obtained from all subjects involved in the study.

Data Availability Statement

The whole-genome sequencing of diploid M. albus was deposited in NCBI (PRJNA674670).

Conflicts of Interest

The authors declare no conflict of interest.

References

  1. Wicker, T.; Sabot, F.O.; Hua-Van, A.; Bennetzen, J.L.; Capy, P.; Chalhoub, B.; Flavell, A.; Leroy, P.; Morgante, M.; Panaud, O. A unified classification system for eukaryotic transposable elements. Nat. Rev. Genet. 2007, 10, 276. [Google Scholar] [CrossRef] [Green Version]
  2. Havecker, E.R.; Gao, X.; Voytas, D.F. The diversity of LTR retrotransposons. Genome Biol. 2004, 5, 225. [Google Scholar] [CrossRef] [Green Version]
  3. Özer, G.; Bayraktar, H.; Baloch, F.S. iPBS retrotransposons ‘A Universal Retrotransposons now’ in molecular phylogeny of fungal pathogens. Biochem. Syst. Ecol. 2016. [Google Scholar] [CrossRef]
  4. Wu, J. Construction and application of identification and analysis process of full-length LTR-retrotransposons (D). Anhui Agric. Univ. 2017, 56. [Google Scholar]
  5. Mccarthy, E.M.; Liu, J.; Gao, L.; Mcdonald, J.F. Long terminal repeat retrotransposons of Oryza sativa. Genome Biol. 2002, 3, 1–11. [Google Scholar] [CrossRef] [PubMed] [Green Version]
  6. Nie, Q.; Qiao, G.; Peng, L.; Wen, X. Transcriptional activation of long terminal repeat retrotransposon sequences in the genome of pitaya under abiotic stress. Plant Physiol. Bioch. 2018. [Google Scholar] [CrossRef]
  7. Arystanbekkyzy, M.; Nadeem, M.A.; Aktaş, H.; Yeken, M.Z.; Zencirci, N. Phylogenetic and taxonomic relationship of Turkish wild and cultivated Emmer (Triticum turgidum ssp. dicoccoides) revealed by iPBS-Retrotransposons markers. Int. J. Agric. Biol. 2018, 1814–9596. [Google Scholar] [CrossRef]
  8. Zhao, M.; Zhi, H.; Zhang, X.; Jia, G.; Diao, X. Retrotransposon-mediated DELLA transcriptional reprograming underlies semi-dominant dwarfism in foxtail millet. Crop J. 2019, 7, 458–468. [Google Scholar] [CrossRef]
  9. Flavia, M.; Tommaso, G.; Marilena, C.; Andrea, C.; Lucia, N. Genome-wide analysis of LTR-retrotransposon diversity and its impact on the evolution of the genus Helianthus (L.). BMC Genom. 2017, 18, 634. [Google Scholar] [CrossRef] [Green Version]
  10. Barghini, E.; Natali, L.; Giordani, T.; Cossu, R.M.; Scalabrin, S.; Cattonaro, F.; Imkova, H.; Vrana, J.; Dole El, J.; Morgante, M. LTR retrotransposon dynamics in the evolution of the olive (Olea europaea) genome. DNA Res. 2014, 1–10. [Google Scholar] [CrossRef] [PubMed]
  11. Friesen, N.; Brandes, A.; Heslop-Harrison, J.S. Diversity, origin, and distribution of retrotransposons (gypsy and copia) in conifers. Mol. Biol. Evol. 2001, 18, 1176–1188. [Google Scholar] [CrossRef]
  12. Kalendar, R.; Flavell, A.J.; Ellis, T.H.N.; Sjakste, T.; Moisy, C.; Schulman, A.H. Analysis of plant diversity with retrotransposon-based molecular markers. Heredity 2011, 106, 520. [Google Scholar] [CrossRef] [Green Version]
  13. Schulman, A.H.; Flavell, A.J.; Paux, E.; Ellis, T.H.N. The Application of LTR Retrotransposons as Molecular Markers in Plants. Methods Mol. Biol. 2012, 859, 115–153. [Google Scholar] [CrossRef] [PubMed]
  14. Jing, R.; Vershinin, A.; Grzebyta, J.; Shaw, P.; Smykal, P.; Marshall, D.; Ambrose, M.J.; Ellis, T.N.; Flavell, A.J. The genetic diversity and evolution of field pea (Pisum) studied by high throughput retrotransposon based insertion polymorphism (RBIP) marker analysis. BMC Evol. Biol. 2010, 10, 1–20. [Google Scholar] [CrossRef] [PubMed] [Green Version]
  15. Cong, J.M.; Chen, F.Q.; Sun, C.L. Study on Comprehensive Development of Melilotus suaverolens L. Anhui Agric. Sci. 2012, 2962–2963. [Google Scholar] [CrossRef]
  16. Ma, L. Talking about the Comprehensive Utilization of Plants. Xinjiang Anim. Husb. 2005, 56–57. [Google Scholar] [CrossRef]
  17. Cowan, R.S.; Allen, O.N.; Allen, E.K. The Leguminosae. A Source Book of Characteristics, Uses and Nodulation; University of Wisconsin Press: Madison, WI, USA, 1982; pp. 369–382. [Google Scholar]
  18. Sherif, E.A.A. Melilotus indicus (L.) All., a salt-tolerant wild leguminous herb with high potential for use as a forage crop in salt-affected soils. Flora 2009, 204, 737–746. [Google Scholar] [CrossRef]
  19. Stickler, F.C.; Johnson, I.J. Dry Matter and Nitrogen Production of Legumes and Legume Associations in the Fall of the Seeding Year1. Agron. J. 1959, 51, 135–137. [Google Scholar] [CrossRef]
  20. Zhang, H.X.; Bai, R.; Wu, F.; Guo, W.I.; Yan, Z.Z.; Yan, Q.; Zhang, Y.F.; Ma, J.X.; Zhang, J.Y. Genetic diversity, phylogenetic structure and development of core collections in Melilotus accessions from a Chinese gene bank. Sci. Rep. 2019, 9, 13017. [Google Scholar] [CrossRef] [Green Version]
  21. Wu, F.; Luo, K.; Yan, Z.Z.; Zhang, D.Y.; Yan, Q.; Zhang, Y.F.; Yi, X.; Zhang, J.Y. Analysis of miRNAs and their target genes in five Melilotus albus NILs with different coumarin content. Sci. Rep. 2018. [Google Scholar] [CrossRef]
  22. Wang, H.; Liu, J.S. LTR retrotransposon landscape in Medicago truncatula: More rapid removal than in rice. BMC Genom. 2008, 9, 382. [Google Scholar] [CrossRef] [PubMed] [Green Version]
  23. Liu, Y.H. Karyotype compartive studies of nine species on Melilotus. Bull. Bot. Res. 1984, 4, 145–157. [Google Scholar]
  24. Grzebelus, D. Class II transposable elements in Medicago truncatula. Model Legume Med. Truncatula 2019, 888–892. [Google Scholar] [CrossRef]
  25. Di, H.Y.; Duan, Z.; Luo, K.; Zhang, D.Y.; Wu, F.; Zhang, J.Y.; Liu, W.X.; Wang, Y.R.; Sun, G.L. Interspecific phylogenic relationships within genus Melilotus based on Nuclear and Chloroplast DNA. PLoS ONE 2015, 10, e0132596. [Google Scholar] [CrossRef]
  26. Wu, F.; Zhang, D.Y.; Ma, J.X.; Luo, K.; Di, H.Y.; Liu, Z.P.; Zhang, J.Y.; Wang, Y.R. Analysis of genetic diversity and population structure in accessions of the genus Melilotus. Ind. Crop. Prod. 2016, 85, 84–92. [Google Scholar] [CrossRef]
  27. Yan, Z.Z.; Wu, F.; Luo, K.; Zhao, Y.F.; Yan, Q.; Zhang, Y.F.; Wang, Y.R.; Zhang, J.Y. Cross-species transferability of EST-SSR markers developed from the transcriptome of Melilotus and their application to population genetics research. Sci. Rep. 2017, 7. [Google Scholar] [CrossRef]
  28. Özer, G.; Sameeullah, M.; Bayraktar, H.; Göre, M.E. Genetic diversity among phytopathogenic Sclerotiniaceae, based on retrotransposon molecular markers. Phytopatholo. Mediterr. 2017, 56, 251–258. [Google Scholar] [CrossRef]
  29. Ishikawa, H.; Watano, Y.; Kano, K.; Ito, M.; Kurita, S. Development of primer sets for PCR amplification of the PgiC gene in ferns. J. Plant Res. 2002, 115, 0065–0070. [Google Scholar] [CrossRef]
  30. Konovalov, F.A.; Goncharov, N.P.; Goryunova, S.; Shaturova, A.; Proshlyakova, T.; Kudryavtsev, A. Molecular markers based on LTR retrotransposons BARE-1 and Jeli uncover different strata of evolutionary relationships in diploid wheats. Mol. Genet. Genom. 2010, 283, 551–563. [Google Scholar] [CrossRef] [PubMed]
  31. Jia, J.H.; Wang, P.; Jin, D.M.; Qu, X.P.; Wang, B. The application of RAPD markers in diversity detection and variety identification of Porphyra. Acta. Bot. Sin. 2000, 42, 403–407. [Google Scholar] [CrossRef]
  32. Aneja, B.; Yadav, N.R.; Chawla, V.; Yadav, R.C. Sequence-related amplified polymorphism (SRAP) molecular marker system and its applications in crop improvement. Mol. Breed. 2012, 30, 1635–1648. [Google Scholar] [CrossRef]
  33. Winton, L.M.; Krohn, A.L.; Conn, J.S. Microsatellite markers for the invasive plant species white sweetclover (Melilotus alba) and yellow sweetclover (Melilotus officinalis). Mol. Ecol. Notes 2007, 7, 1296–1298. [Google Scholar] [CrossRef]
  34. Yan, Z.Z.; Yan, R.; Fan, W.; Kai, L.; Zhang, D.Y.; Qi, Y.; Zhang, Y.F.; Zhao, Y.F.; Zhang, J.Y. The development and screening of EST-SSR markers in Melilotus albus. Pratacultural Sci. 2017. [Google Scholar] [CrossRef]
  35. Kumar, A.; Bennetzen, J.L. Plant retrotransposons. Annu. Rev. Genet. 1999, 33, 479. [Google Scholar] [CrossRef] [Green Version]
  36. Casacuberta, J.M.; Vernhettes, S.; Audeon, C.; Grandbastien, M.A. Quasispecies in retrotransposons: A role for sequence variability in Tnt1 evolution. Genetica 1997, 100, 109–117. [Google Scholar] [CrossRef]
  37. Ramakrishnan, M.; Yrjl, K.; Mingbing, Z.; Kurungara, V.K.; Kalendar, R. Development and deployment of High-Throughput retrotransposon-based markers reveal genetic diversity and population structure of Asian Bamboo. Forests 2019, 11, 31. [Google Scholar] [CrossRef] [Green Version]
  38. Zhou, Q.; Chen, T.L.; Wang, Y.R.; Liu, Z.P. The development of 204 novel EST-SSRs and their use for genetic diversity analyses in cultivated alfalfa. Biochem. Syst. Ecol. 2014, 57, 227–230. [Google Scholar] [CrossRef]
  39. Liang, Y.H.; Lenz, R.R.; Dai, W. Development of retrotransposon-based molecular markers and their application in genetic mapping in chokecherry (Prunus virginiana L). Mol. Breed. 2016, 36, 109. [Google Scholar] [CrossRef]
  40. Nadeem, M.A.; Habyarimana, E.; Çiftçi, V.; Nawaz, M.A.; Karaköy, T.; Comertpay, G.; Shahid, M.Q.; Hatipoğlu, R.; Yeken, M.Z.; Ali, F. Characterization of genetic diversity in Turkish common bean gene pool using phenotypic and whole-genome DArTseq-generated silicoDArT marker information. PLoS ONE 2018, 13, e0205363. [Google Scholar] [CrossRef]
  41. Zhang, M. The genetic diversity of geograhical popualtions of the migratory locust analyzed with the percent of polymorphic loci and Shannon’s Index. Chin. Agric. Sci. Bull. 2008, 9, 376–381. [Google Scholar]
  42. Luikart, G.; England, P.R.; Tallmon, D.; Jordan, S.; Taberlet, P. The power and promise of population genomics: From genotyping to genome typing. Nat. Rev. Genet. 2003, 4, 981–994. [Google Scholar] [CrossRef]
  43. Estoup, A.; Jarne, P.; Cornuet, J.M. Homoplasy and mutation model at microsatellite loci and their consequences for population genetics analysis. Mol. Ecol. 2010, 11, 1591–1604. [Google Scholar] [CrossRef]
  44. Shan, Z. Improved SDS method for general plant genomic DNA extraction. Guangdong Agric. Sci. 2011, 38, 3. [Google Scholar] [CrossRef]
  45. Jong-Wook, C.; Tae-Sung, K.; Sundan, S.; Sok-Young, L.; Gyu-Taek, C. Development of 65 Novel Polymorphic cDNA-SSR Markers in Common Vetch (Vicia sativa subsp. sativa) using next generation sequencing. Molecules 2013, 8376–8392. [Google Scholar] [CrossRef]
  46. Gaggiotti, F.O. A Genome-Scan method to identify selected loci appropriate for both dominant and codominant markers: A Bayesian Perspective. Genetics 2008, 180, 977–993. [Google Scholar] [CrossRef] [Green Version]
  47. Yeh, F.; Yang, R.C.; Boyle, T. Software Microsoft Window-Based Freeware for Population Genetic Analysis, Popgene Version 1.32 ed.; University of Alberta: Edmonton, AB, Canada, 1997. [Google Scholar]
  48. Excoffier, L.; Lischer, H.E.L. Arlequin suite ver 3.5: A new series of programs to perform population genetics analyses under Linux and Windows. Mol. Ecol. Res. 2010, 10, 564–567. [Google Scholar] [CrossRef]
  49. Pavlícek, A.; Hrdá, S.; Flegr, J. Free-Tree--freeware program for construction of phylogenetic trees on the basis of distance data and bootstrap/jackknife analysis of the tree robustness. Application in the RAPD analysis of genus Frenkelia. Folia Bio. 1999, 45, 97–99. [Google Scholar]
  50. Page, R.D.M. Tree View: An application to display phylogenetic trees on personal computers. Bioinformatics 1996, 12. [Google Scholar] [CrossRef] [PubMed] [Green Version]
  51. Falush, D.; Stephens, M.; Pritchard, J.K. Inference of population structure using multilocus genotype data: Dominant markers and null alleles. Mol. Ecol. Notes 2007, 7, 574–578. [Google Scholar] [CrossRef]
  52. Pritcharda, J.K.; Wena, X.; Falush, D. Documentation for Structure Software: Version 2.3; University of Chicago: Chicago, IL, USA, 2010. [Google Scholar]
  53. Evanno, G.S.; Regnaut, S.J.; Goudet, J. Detecting the number of clusters of individuals using the software structure: A simulation study. Mol. Ecol. 2005, 14, 2611–2620. [Google Scholar] [CrossRef] [Green Version]
Figure 1. DNA amplification with primer 95 in genotyping of 18 Melilotus species process.
Plants 10 00890 g001
Figure 2. Multiple sequence alignment of PCR products of LTR_RT_302 primer in seven Melilotus species.
Plants 10 00890 g002
Figure 3. BayeScan plot of 47 polymorphic LTR-RT markers in 18 Melilotus. Fst is plotted against the log10 of the posterior odds (PO).
Plants 10 00890 g003
Figure 4. Dendrogram of 18 Melilotus by the UPGMA cluster analysis based on the LTR-RT analysis. The numbers present inside the clusters represent the bootstrap values. The numbers in bold represent different Melilotus species as defined in Table 5.
Plants 10 00890 g004
Figure 5. Genetic structure of 40 accessions for 18 Melilotus species as inferred by STRUCTURE with 47 LTR-RT markers.
Plants 10 00890 g005
Table 1. Statistics of the type, number of identified, and designed primers of LTR-RTs.
Total Length of LTR-RTs Screened (bp)No. of LTR-RTs IdentifiedNo. of Primers Designed for Each Type of LTR-RTs
585,894,349Ty1/Copia77,935RBIP232
Ty3/gypsy101,240IRAP105
Unknown1865ISBP10
REMAP3
RBIP: retrotransposon-based insertion polymorphisms, IRAP: inter-retrotransposon amplified polymorphisms, ISBP: insertion-site-based polymorphisms, REMAP: retrotransposon-microsatellite amplified polymorphisms.
Table 2. Primer sequence, allele size range and polymorphism information for 47 LTR retrotransposon loci among 15 M. albus accessions.
Primer CodeTypePrimer SequenceAllele Size Range (kp)NAHePIC
25RBIPF:GAGAACTGAGAAGAGGGTC
R:CTCCACCTTGACTTGAATC
0.2–0.350.760.72
40RBIPF:GAAAGGATTCTGAGCGTAG
R:ATACTCTCCACCACTGTCA
0.5–0.730.670.6
41RBIPF:GAAAGGATTCTGAGCGTAG
R:GTAATACTCTCCACCACTGTC
0.4–0.750.670.63
45IRAPF:TATGCTTCAACCTGAGGG
R:GTTCATTTCTGCTCGCTC
0.3–0.440.620.56
46RBIPF:GAAAGTCTAATGCCGAGG
R:AATACTCTCCACCACGGT
0.4–0.550.450.43
54RBIPF:TCTCAGACATAGAACCCG
R:AGTGATGGTAACCCAACC
0.3–0.440.590.53
55RBIPF:GTGTCCACAAAGGATTCC
R:TCTCCACAAGACCACTTC
0.2–0.440.430.4
62IRAPF:ATTTAGTGGCAGCCCTTC
R:GACCTTTCTTTCCGCATC
0.3–0.430.60.52
67RBIPF:GACAACTTGAACGGACAAAC
R:AGGGTAAAGGCTAAGGGAG
0.15–0.230.570.48
68RBIPF: GGGACAACTACATAACTTGG
R: GCTGCCACTAAATCAGAG
0.4–0.530.540.44
69RBIPF: TCACTTACCTATTGCTCTCC
R: TGCTTCCTTGACAGTCTTAG
0.15–0.430.640.57
74RBIPF:TTCATACCACTCCGAGAG
R:GGATGTCCATTAGAGGCT
0.15–0.340.680.61
76RBIPF: TGTGTGTGTGTGTCTGTTCT
R: AACCTCGTAGTTCGGGTA
0.4–0.530.510.45
78RBIPF: CATCCTGAATAGAGTCCCT
R: ATCGGTATCCCTTAGCAC
0.2–0.330.490.43
83RBIPF: CTGTAGTATTCAAGGGTGG
R: GAAGCCATTCTAAGGGTC
0.2–0.440.580.49
93RBIPF: CTCCTTGACTGTTGCCATTA
R: GGGAAGAAACCCTGGATT
0.2–0.330.570.51
95RBIPF: CCTGAAGAAGAATGGTCC
R: GTGGTAAGAAGTTGAAGCC
0.15–0.340.580.52
105RBIPF: TCTCAACTCCAATGGCAG
R: TTCAGAGGCAGAAGCATC
0.2–0.440.520.43
138IRAPF: GCATTGTTGTCACAGTCAAG
R:GCAAGTTACTCTTCATACCTGG
0.3–0.750.640.59
146RBIPF: ATCCCTTCTCTCCTTCCCT
R: TCACCTTGATACTTGCCG
0.1–0.230.570.48
148IRAPF: GGTGTGGACAGATAGTAAGG
R: GAGTTGGTAGGTTGAGTTTG
0.1–0.250.770.73
149RBIPF: CTAAATGGAGGGAAGAGAGA
R: GTGACAACTTGAGTGCCA
0.2–0.330.560.46
152IRAPF: CTTATCTCCCTCAACAAGC
R: CTACAGAAATGGCGACTTC
0.1–0.240.70.65
153IRAPF: CAGCAACATAACGAGAACG
R:CCGAGAGAAATGAGAGAGAAGT
0.2–0.540.680.62
155RBIPF: CTTGTTGCGTTAGTGTGC
R: AACTGGGATGGTCCGTAT
0.5–0.730.420.38
170RBIPF: GTGACGAGAAGAAGAAAGG
R:CACAGATTTACCACTGGC
0.2–0.330.630.56
183RBIPF: TTACTAATCCCACCACCC
R: GACGAAGGAGAAGAGAATG
0.2–0.430.560.47
196RBIPF: GATTGTTCCGATTCAGGC
R: AGGACTTGCTGGATTTGG
0.3–0.550.660.6
209RBIPF: GTCTCACACACAAGATTCC
R: GGTGGTTAGGGAGGTTAT
0.15–0.350.750.71
210RBIPF: GTCTCACACACAAGATTCC
R: GGTGGTTAGGGAGGTTAT
0.15–0.350.760.72
226RBIPF: GCTTCAAGTGTGGTGGAT
R: AACGCAACCCTTCTCTCT
0.15–0.350.640.59
229RBIPF: ATCGGAATGGACTCTACC
R: GTGTATGCGTATGTGTGAG
0.15–0.370.80.77
277RBIPF: TCAGATGGAGTTGTGAGG
R: GAGGCTAAACCCTACGAT
0.2–0.340.560.52
280RBIPF: GAACTGTATGTGTCCAAGG
R: CCAGGAAGAGAACAAGAC
0.15–0.330.580.51
281RBIPF: AGAGGAAGAAGACAACCG
R:GTCACAAAGGATGAGGGT
0.15–0.340.670.61
283RBIPF: CCCGAATCTAAGGTCAAAGT
R: CACGCAAGAAACACATCAC
0.3–0.530.520.41
284IRAPF: ATTTGGACCAGGCACACT
R: AAGCACTCCGTCATCGTA
0.2–0.440.630.55
286IRAPF: CGGATGATACGAAAGTGAG
R: GCTTCTGTTGTTAGCCCAT
0.15–0.350.730.69
290RBIPF: ACTAAGGTTCCAGGCTGT
R: GACTCATCCAACAATCCC
0.3–0.430.590.51
293RBIPF: CGGCAAGGTAGAGAGAAGT
R: AATGGGCTTTGGAGTAGG
0.15–0.340.580.52
300IRAPF: CTCTCACACATACACAAAGG
R: ATCTGGAGTTCTGGAAGTC
0.3–0.540.560.51
301RBIPF: CAAGCACGGTAAGTTAGC
R: CGAGTTCAAGAGCACCTT
0.15–0.440.490.46
302RBIPF: AAAGAGGACAAAGACCCG
R: TAGTCAACGCACATACGC
0.2–0.550.50.47
324IRAPF: GGTATCAGAGCCTGGTTAG
R: AAACAGTCCTCAGTTCCTC
0.15–0.350.650.6
336IRAPF: GAGGAAGTAGACGCTTATTG
R: GTTGGTGGTGTCATTCAC
0.2–0.330.570.51
350RBIPF: TCACAGAGTTTGAGTCCC
R: GAAGAAGAAGGTGGGTTC
0.2–0.340.620.54
Mean 3.960.610.54
NA: number of alleles, He: expected heterozygosity, PIC: polymorphic information content, RBIP: retrotransposon-based insertion polymorphisms, IRAP: inter-retrotransposon amplified polymorphisms.
Table 3. Genetic variability of 18 Melilotus species detected by 47 LTR-RT-based markers.
SpeciesAccessionsNPLPPL (%)NANehI
M. albus37927.051.27051.16790.09980.1493
M. altissimus2299.931.09931.07020.04110.0601
M. dentatus35017.121.17121.11280.06550.0970
M. elegans24515.411.15411.10900.06380.0932
M. hirsutus24314.731.14731.10410.06100.0891
M. indicus37023.971.23971.15830.09180.1360
M. infestus36120.891.20891.14520.08260.1213
M. italicus39833.561.33561.22820.13090.1929
M. officinalis34916.781.16781.11500.06580.0968
M. polonicus2248.221.08221.05810.03400.0497
M. segetalis100.001100
M. siculus35619.181.19181.13420.07620.1117
M. speciosus23813.011.13011.09200.05390.0787
M. spicatus220.681.00681.00480.00280.0041
M. suaveolens2175.821.05821.04120.02410.0352
M. sulcatus100.001100
M. tauricus2175.821.05821.04120.02410.0352
M. wolgicus100.001100
Mean 37.6712.901.12901.08790.05100.0750
NPL: number of polymorphic loci, PPL: the percentage of polymorphic loci, NA: observed number of alleles, Ne: effective number of alleles, h: Nei’s (1973) gene diversity, I: Shannon’s information index.
Table 6. Accessions of 18 Melilotus species used for analysis of primer transferability.
CodeSpeciesAccession NumberOriginLatitudeLongitude
1M. albusPI 342739England, United KingdomN 52°26′W 19°06′
PI 595327ChinaN 43°18′E 86°40′
PI 662299Vienna, AustriaN 48°20′E 16°33′
2M. altissimusAmes 18376Nebraska, United StatesN 41°26′W 99°23′
PI 420163FranceN 46°13′E 2°12′
3M. dentatusPI 108656ArmeniaN 40°4′E 45°2′
PI 90753ChinaN 35°51′E 104°11′
PI 595334ChinaN 42°49′E 85°30′
4M. elegansPI 260271EthiopiaN 9°9′E 37°48′
PI 250873IranN32°4′E 54°4′
5M. hirsutusAmes 22882Russian Federation
PI 129697SwedenN 60°7′E 18°38′
6M. indicusAmes 21619Nebraska, United StatesN 41°29′W 99°54′
PI 107562UzbekistanN 41°23′E 69°4′
PI 43595
7M. infestusPI 306326AlgeriaN 27°13′E 2°29′
PI 306327ItalyN 41°52′E12°34′
PI 306328HungaryN 47°9′E 19°30′
8M. italicusPI 317635CzechoslovakiaN 14°28′E 121°2′
PI 317638IsraelN 31°2′E 34°51′
PI 317634Manitoba CanadaN 56°11′W 97°4′
9M. offcinalisPI 132270RomaniaN 45°49′E 24°29′
PI 342889GermanyN 51°13′E 10°23′
PI 342898FranceN 46°34′E 2°18′
10M. polonicusPI 314386Former Soviet UnionN 45°5′E 41°50′
PI 108647Former Soviet UnionN 45°5′E 41°50′
11M. segetalisPI 317649CzechoslovakiaN 48°2′E 18°22′
12M. siculusPI 129703MaltaN 35°56′E 14°22′
PI 318508GreeceN 39°4′E 21°49′
PI 33366Former Soviet Union
13M. speciosusPI 317650Manitoba, CanadaN 53°45′W 98°48′
PI 64995MoroccoN 31°52′W 6°13′
14M. spicatusAmes 18402Nebraska, United StatesN 41°29′W 99°54′
PI 314466Uzbekistan
15M. suaveolensAmes 23793MongoliaN 48°10′E 91°45′
PI 595395United StatesN 41°52′W 93°5′
16M. sulcatusPI 227595TunisiaN 33°53′E 9°32′
17M. tauricusPI 67510UkraineN 44°24′E 33°49′
Ames 25789UkraineN 44°24′E 33°49′
18M. wolgicusPI 317666CzechoslovakiaN 48°2′E 18°22′
—: note unknown.
Publisher’s Note: MDPI stays neutral with regard to jurisdictional claims in published maps and institutional affiliations.

