Article

Climatic Diversity and Ecological Descriptors of Wild Tomato Species (Solanum sect. Lycopersicon) and Close Related Species (Solanum sect. Juglandifolia y sect. Lycopersicoides) in Latin America

by
Gabriela Ramírez-Ojeda
1,
Iris E. Peralta
2,3,
Eduardo Rodríguez-Guzmán
4,
José Luis Chávez-Servia
5,
Jaime Sahagún-Castellanos
1 and
Juan Enrique Rodríguez-Pérez
1,*
1
Departamento de Fitotecnia, Universidad Autónoma Chapingo (UACh), Chapingo 56230, Mexico
2
Facultad de Ciencias Agrarias, Universidad Nacional del Cuyo (UNCUYO), Mendoza M5502JMA, Argentina
3
Centro Científico Tecnológico CONICET, Instituto Argentino de Investigaciones de las Zonas Áridas, Mendoza C1425FQB, Argentina
4
Centro Universitario de Ciencias Biológicas y Agropecuarias, Universidad de Guadalajara (UdG), Zapopan 45200, Mexico
5
Centro Interdisciplinario de Investigación para el Desarrollo Integral Regional Unidad Oaxaca, Instituto Politécnico Nacional (IPN) Xoxocotlán, Oaxaca 71230, Mexico
*
Author to whom correspondence should be addressed.
Plants 2021, 10(5), 855; https://doi.org/10.3390/plants10050855
Submission received: 25 February 2021 / Revised: 16 April 2021 / Accepted: 19 April 2021 / Published: 23 April 2021
(This article belongs to the Special Issue Germplasm Diversity for Sustainability and Crop Improvement)

Abstract

:
Conservation and sustainable use of species diversity require a description of the environment where they develop. The objectives were to determine ecological descriptors and climatic diversity of areas along the distribution range of 12 species of wild tomatoes (Solanum sect. Lycopersicon) and four wild species of phylogenetically related groups (Solanum sect. Juglandifolia and sect. Lycopersicoides), as well as their ecological similarity in Latin America. With 4228 selected tomato accessions and an environmental information system (EIS) composed of 21 climatic variables, diversity patterns of the distribution areas were identified for each species, as well as ecological descriptors through the use of geographic information systems (GIS). The contribution of climatic variables to the species geographical distribution was identified by principal component analysis (PCA), and similarity in species distribution as a function of the variables identified with cluster analysis (CA). Climatic characteristics and the environmental amplitude of wild tomatoes and related species along their distributional range were satisfactorily determined by ecological descriptors. Eleven climate types were identified, predominantly BSk (arid, steppe, cold), BWh (arid, desert, hot), and Cfb (temperate, no dry season, warm summer). PCA determined 10 most important variables were the most important for the geographical distribution. Six groups of species were identified according to CA and climatic distribution similarity. This approach has shown promissory applications for biodiversity conservation of valuable genetic resources for tomato crop breeding.

Graphical Abstract

1. Introduction

Tomato (Solanum lycopersium L.), a member of the Solanaceae family, is one of the world’s leading vegetable crops with worldwide distribution growing in an extensive variety of habitats [1]. Peru has been considered the center of origin, but it is accepted that the tomato diversification process involved two transitions; the first occurred in South America, from the wild species Solanum pimpinellifolium L. to a partially domesticated species Solanum lycopersicum L. var. cerasiforme (SLC); while the second occurred in Mesoamerica from SLC to the completely domesticated species Solanum lycopersicum L. var. lycopersicum. However, Razifard et al. [2] recently reported that the origin of SLC may be prior to its domestication since many typical characteristics of tomatoes grown in South America come from this species; later, SLC was lost or diminished once the partially domesticated forms extended toward the north. Further strong artificial selection after the tomato was first introduced to Europe in the XVI century and in modern times greatly reduced the genetic variation of the crop [3]. Wild tomato species related to cultivated tomatoes are valuable resources because they provide genetic diversity due to their ecological adaptation. In addition to the cultivated species, there are 12 species of wild tomatoes (Solanum sect. Lycopersicon (Mill.) Wettst), and four wild species from two phylogenetically related groups (Solanum sect. Juglandifolia (Rydb.) A. Child and Solanum sect. Lycopersicoides (A. Child) Peralta). Wild tomato species of the Lycopersicon section are: Solanum arcanum Peralta, Solanum cheesmaniae (L. Riley) Fosberg, Solanum chilense Dunal, Solanum chmielewskii (C. M. Rick, Kesicki, Fobes, and M. Holle), D. M. Spooner, G. J. Anderson and R.K. Jansen, Solanum corneliomulleri J. F. Macbride, Solanum galapagense S.C. Darwin and Peralta, Solanum habrochaites S. Knapp and D. M. Spooner, Solanum huaylasense Peralta, Solanum neorickii D. M. Spooner, G. J. Anderson and R. K. Jansen, Solanum pennellii Correll, Solanum peruvianum L. and S. pimpinellifolium [1], and from the Junglandifolia and Lycopersicoides sections are Solanum juglandifolium Dunal, Solanum lycopersicoides Dunal, Solanum ochranthum Dunal, and Solanum sitiens I. M. Johnston [1,4,5].
A comprehensive treatment of wild tomatoes and close relatives, combining different evidence and their phylogenetic relationships, led to the proposed new classification proposed by Peralta et. al. [1]. The predictability of this classification has been verified in recent studies based on different molecular, genomic, and transcriptomic data of wild tomatoes [3,6,7]. The work of Peralta et. al. [1] has been considered to compare diversity climatic patterns and ecological descriptors. Wild tomatoes, Section Lycopersicon: “Lycopersicon group” (S. pimpinellifolium, S. cheesmaniae and S. galapagense), “Arcanum group” (S. arcanum, S. chmielewskii and S. neorickii), “Eriopersicon group” (S. habrochaites, S. huaylasense, S. corneliomulleri, S. peruvianum, and S. chilense), “Neolycopersicon group” (S. pennellii); outgroup close related species in Section Juglandifolia (S. juglandifolium and S. ochranthum) and Section Lycopersioides (S. lycopersicoides and S. sitiens).
Species of Lycopersicoides and Lycopersicon sections are generally plants that grow in dry habitats along the Pacific coastal range and in inter-Andean valleys, while species of Junglandifolia section are distributed in cloudy forests and open areas with high light intensity. Unlike wild species, cultivated tomato is more dependent on humidity and is located in disturbed sites from the tropics, subtropics to temperate zones with defined summers [1].
Wild tomatoes are generally annual; they germinate, grow, reach flowering, fructification, and die in a growing season, but if there is continuous humidity, they manifest as perennials. In other regions, they rarely persist for generations if agronomic management is not provided [1,8].
Breeding programs generally use a limited genetic base, so it is extremely important to explore and know the sources of natural variation [9,10] for identification of genes associated with more rustic characteristics such as resistance to drought [11], extreme temperatures [12], and resistance to pests and diseases [13,14], among others. Likewise, the characteristics of the organoleptic and nutraceutical quality of the fruit have gained importance in the improvement, characteristics that can be found in some wild populations [15,16].
There are various sources of information on the geographical location of tomato species and their gene pools, ex situ and in situ conservation programs, and germplasm banks [17,18,19,20]. In addition, some research has been carried out to identify the geographical and ecological patterns of some species [1,21,22,23]. However, the information on all the wild and related tomato species is scarce since the ecological descriptors and the particular climatic characteristics in which they are distributed are unknown or limited.
Ecogeographic studies of plant genetic resources allow the identification of the adaptive ranges of the species and the most relevant environmental variables that define their distribution [24]. Its main applications are related to the collection, conservation, characterization, documentation, and use of plant genetic resources [7,24,25,26,27]. Additionally, it is possible to predict the environmental conditions of the collection sites [11,28,29] from the ecological descriptors derived from the geographical location of germplasm and environmental variables obtained through GIS tools [10,11,28,29,30].
The central hypothesis of this research postulate that patterns of climatic diversity might coincide with the classification of wild tomatoes reflecting close ancestral relationships.
The objectives were determining the ecological descriptors and the climatic diversity of 16 species (12 species of wild tomatoes (Solanum sect. Lycopersicon) and four species of phylogenetically related groups (Solanum sect. Juglandifolia and sect. Lycopersicoides)), as well as their ecological similarity in Latin America.

2. Results

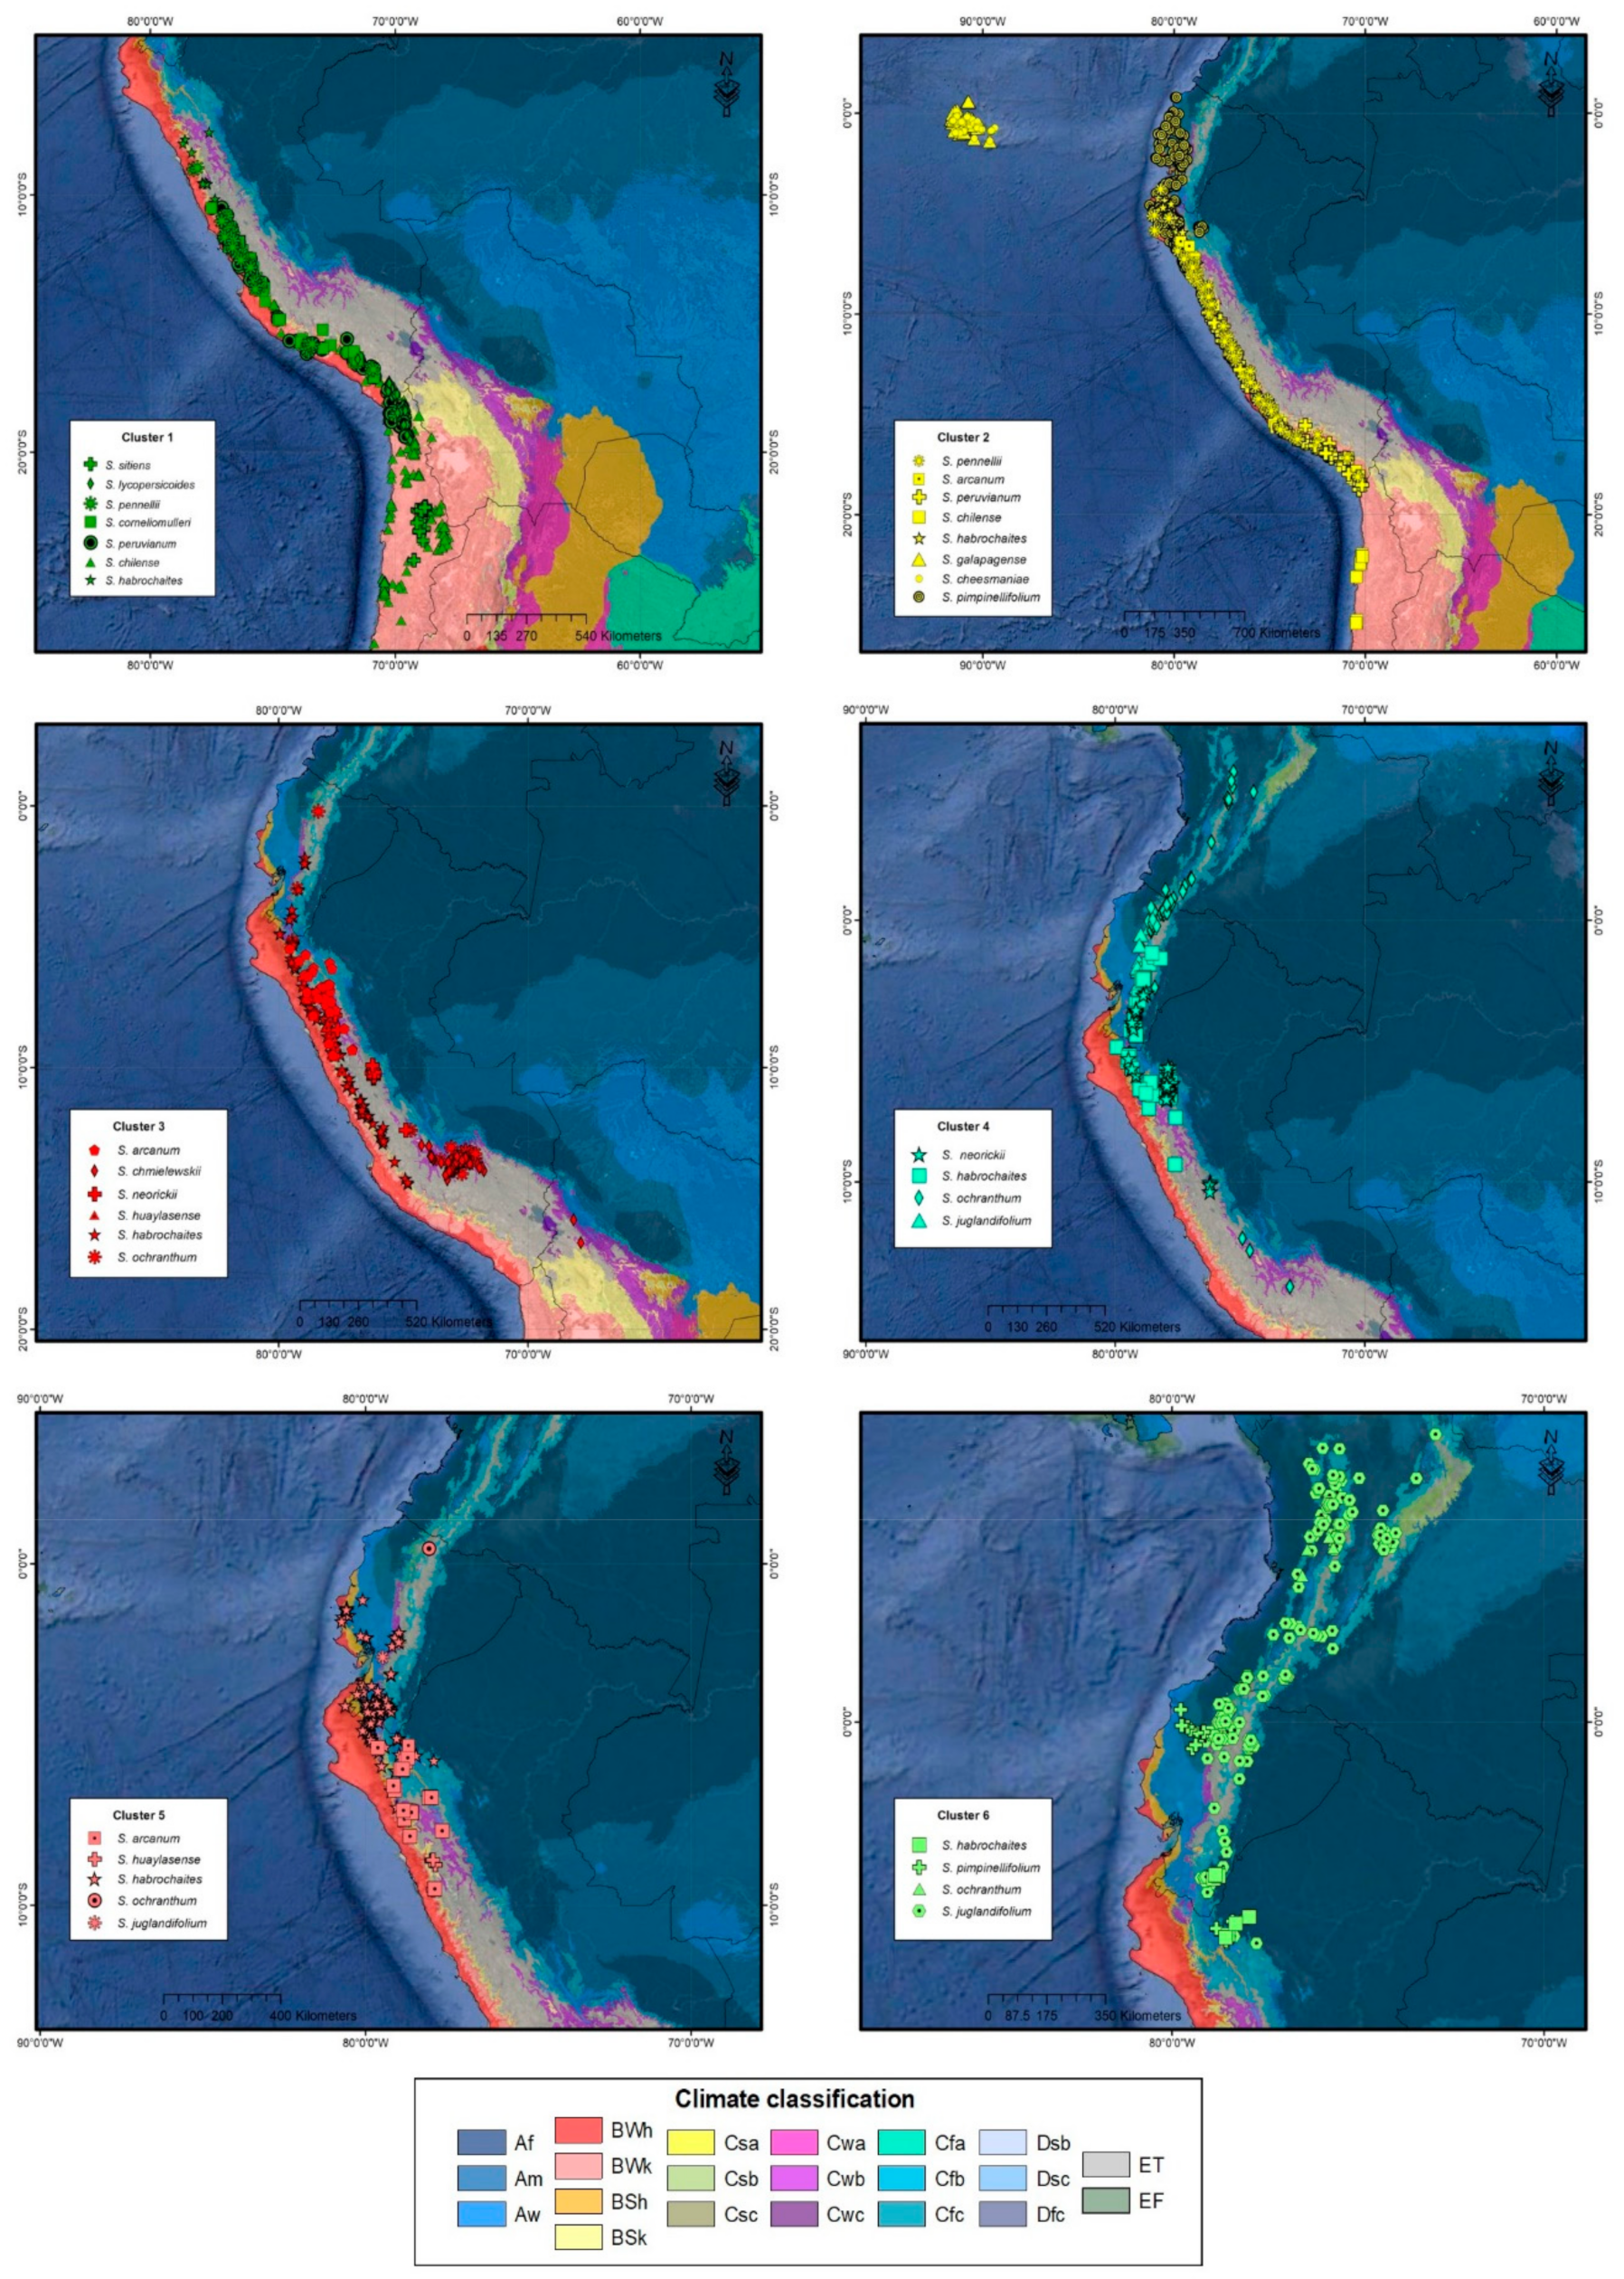
2.1. Climatic Diversity

Of the 21 existing climates in Latin America, according to the Köpen-Geiger classification adapted by Beck et al. [31], 12 wild tomatoes and four close related outgroup species were located in 11 of them. Some of the 16 species of the genus Solanum showed specific patterns in their distribution within the identified climate types (Figure 1).
The species that presented accessions in the greatest number of climates are S. habrochaites, S. arcanum, S. ochranthum, and S. juglandifolum. In contrast, the species with the highest environmental restrictions were S. sitiens, S. lycopersicoides, S. corneliomulleri, and S. chmielewskii. Regarding the diversity of climates, those with the greatest predominance among the species are BSk, BWk, and BWh, corresponding to climates of the cold steppe arid type, arid cold desert, and hot arid desert, respectively. Figure 2 shows the distribution and percentage of climates in each species. In this image, the climatic similarity between nearby taxonomic groups derived from phylogenetic data can be observed [1], identifying the same climate types in different proportions for species groups.

2.2. Ecological Descriptors

Ecological zones, as well as the distribution environments and altitudinal ranges reported in the literature for the 16 species of Solanum (Sect. Lycopersicon, Juglandifolia, and Lycopersicoides), are shown in Table 1. There were no specific reports of annual mean temperature, annual precipitation, mean diurnal range and annual evapotranspiration, or any other variable in the available literature. In some cases, some climatic parameters associated with the distribution zones are mentioned in general [1,22,23].
The ecological descriptors derived from the geographic location of the accessions and the EIS through the use of GIS tools are shown in Table 2. The variables considered were chosen due to their influence on the establishment of the species: altitude, annual mean temperature, mean diurnal range, annual precipitation, and annual evapotranspiration.
Both the ecological descriptors and the values reported by Peralta et al. [1] and Grandillo et al. [22] show very similar altitudinal ranges. Considering the median altitude values (Table 2) S. cheesmaniae, S. galapagense, and S. pimpinelifollium are the species with the lowest altitudinal range (45–93 m above sea level), and S. lycopersicoides, S. sitiens, and S. ochranthum are the species with the highest altitude range (2740–2928 m above sea level).
The annual mean temperature is a useful variable in the establishment and development of species. It influences, together with other biophysical variables such as relative humidity and precipitation, growth, and productivity of the species.
S. cheesmaniae, S. galapagense, and S. pimpinelifollium are distributed in areas where the median annual mean temperature is above 20 °C, while S. lycopersicoides and S. sitiens are the species distributed in sites with the lowest annual mean temperature value. The amplitude of the temperature changes, valued by the mean diurnal range, places S. peruvianum as the species that are located in places with less thermal oscillation; in contrast, S. chilense is located in places with greater thermal oscillation.
S. juglandifolium and S. ochrantum require the highest water requirements (annual precipitation and evapotranspiration); in contrast, S. lycopersicoides and S. sitiens are species characteristics of more arid and drier sites.

2.3. Statistical Analysis

Linear correlation analysis detected multicollinearity between variables BIO6, BIO9-BIO11, BIO16, and BIO17, discarding them (10 variables) from subsequent statistical analyzes. The association patterns between variables were identified using a PCA. Thus, three principal components (PC1, PC2, and PC3) explained 86.2% of the variation, with an individual contribution of 47.8, 27.2, and 11.2%, respectively. Figure 3 shows the biplot of PC1 and PC2 (explaining 75% of the variation), showing the dispersion of the accessions and the contribution of the variables used. PC1 grouped variables related to water and humidity requirements: precipitation of wettest month (BIO13), annual precipitation (BIO12), and annual evapotranspiration (ETPA). PC2 was associated with annual mean temperature (BIO1), mean diurnal range (BIO2), altitude (ALT), mean temperature of the wettest quarter (BIO8), and maximum temperature of the warmest month (BIO5). Finally, PC3 was integrated by the coefficient of variation of seasonal precipitation (BIO15) and isothermality (BIO3).
The CA was carried out in order to identify patterns of similarity between accession distribution areas. This analysis included the median values of informative variables previously selected for 67 combinations identified, resulting from the interaction of species by climate type, using the distances of Gower and Ward’s grouping method. According to the statistical indicators pseudo-F and pseudo t2, the number of statistically significant groups was six. In order to corroborate the belonging observations to each identified group, a discriminant analysis was carried out, where the test of restitution of linear discriminant function was applied, which did not indicate changes in the groups generated by the CA, confirming that the classification is reliable. The geographical distribution of the accessions that belong to each group is shown in Figure 4. Table 3 shows the medians and coefficients of variation of each of the groups identified in the CA. The significant variables of the PC were used to describe the groups generated in the CA. From these results, it is possible to identify ecological patterns among the groups formed; for example, the accessions of cluster 1 are those that are found at the highest altitude, and with the lowest annual mean temperature, the species that form cluster 4 and 6 are those with the highest annual precipitation and evapotranspiration, and species of group 1 are located in sites with less availability of humidity. Regarding Kruskal–Wallis non-parametric test of variables for obtained clusters, in all cases, the results were statistically significant (p ≤ 0.001). Table 4 shows the median values for each cluster, and the corresponding results of rank means comparison of informative variables of 3 PCs.

3. Discussion

Characterization of genetic resources through environmental information of accession sites, also called ecogeographic description, allows the typification of adaptive ranges and the most relevant environmental factors that determine species adaptation [24]. On the other hand, using GIS techniques, georeferencing species sites allows the analysis of geographical distances and distribution patterns of germplasm collection sites. With this approach, it is possible to determine environmental conditions in which the wild species and local varieties of crops have acquired their adaptive ranges [25]. This ecogeographic characterization complements the phenotypic and genetic information, useful for the characterization of the germplasm.
The distribution of the 67 combinations of species with climates in the clusters and the phylogenetic group to which they belong can be observed in Table 3. The Lycopersicon group, corresponding to the species of the Galapagos Islands and some continental areas, is located in clusters 2 and 6. S. pennelli (Neolicopersicon group) is located in clusters 1 and 2. The species of the Arcanum group and S. sect. Juglandifolia are located in four of the six proposed clusters. S. huaylasense, S. corneliomulleri, S. peruvianum, S. chilense, and S. habrochaites, species of the Ericopersicon group are distributed in all the clusters formed. On the other hand, S. sect. Lycopersicoides is only present in cluster 1.
Some species are distributed in a more restricted area (S. lycopersicoides, S. sitiens), and others are more widely located, a condition attributed to their wide distribution. It is worth mentioning that each species has a specific geographic distribution, with overlapping regions between various species, reflecting their ecological adaptation patterns and habitat preferences [22] (Figure 2).
Regarding the climatic diversity of the species of the genus Solanum, there were no concrete data in the literature for all the species considered within the tomato group. Thus, the diversity of climates, ecological descriptors, and abundance patterns described by this research for each species constitutes new and valuable information, with potential use for the identification of germplasm tolerant to specific adverse biotic and abiotic factors, among other purposes (Table 2, Table 3 and Table 4, Figure 2 and Figure 3). Wild tomato species are frequently found in isolated valleys with adaptations to particular types of climate, with possible tolerance or resistance to adverse conditions. Probably the Andean geography, the ecological diversity of habitats and climates together contributed to the diversity of wild species [32,33]. In general, it is mentioned that the wild tomato species are distributed in Ecuador, the Galapagos Islands, Peru, and the north of Chile and Colombia, in various ecosystems from sea level to approximately 3300 m above sea level [33,34,35]. It is important to highlight that a predictive classification of tomatoes and closely related groups were considered as a framework for the ecogeographic characterization and the actual taxonomic knowledge to select reliable species accessions from different sources of the database. This selection process is fundamental to generate a trustworthy species database for further analysis. There are often mistakes and inconsistencies due to incorrect taxonomic identification of accessions or wrong information of collection sites.
Few studies have been carried out with an ecogeographic or climatic approach, highlighting the publications of Peralta et al. [1], Nakazato et al. [22], Grandillo et al. [23], and Pease et al. [7]. These authors identified the ecological distribution environments and altitudinal ranges of adaptation of the tomato species. Both the ecological descriptors and the patterns of climatic diversity were generated from more current and more representative sources of information due to the diversity of variables of the EIS used and a large number of accessions from different sources of information. It should be noted that, although the results in altitude and ecological zones of distribution are very similar, the ecological descriptors provide information for the 16 species with greater amplitude and precision (Table 2 and Table 3).
With the information generated, it is also possible to begin to identify those species found in critical environments that can be potentially used as a source of germplasm for genetic breeding programs for resistance to drought [11], extreme temperatures [12], resistance to pests and diseases [13,14], to mention some examples.
There are specific studies of some species to which a certain adaptation or tolerance characteristic has been attributed due to their distribution; For example, S. pennellii is considered a species with extreme tolerance to drought attributed to strict control of transpiration, increased efficient use of water, and tolerance to soil salinity [36,37]; S. sitiens is considered the species that inhabits the most arid places [38] with the ability to tolerate high levels of salinity [22], S. habrochaites is known to have good growth at low temperatures [39,40,41], and S. lycopersicoides has resistance to drought and has a preference for colder sites [42,43]. These statements coincide with the values obtained in the ecological descriptors; for example, S. sitiens and S. lycopersicoides are located as the species from sites with the lowest availability of humidity.
In the present study, the use of multivariate analysis allowed to satisfactorily identify the climatic variables with the greatest association with the distribution of the ecogeographic diversity of the species. The present results, through the PCA, indicated associations among variables of altitude, humidity, and temperature, explaining in good proportion the variability of the data. Such behavior in the results satisfactorily summarizes the importance of the variables in the distribution of the Solanum species evaluated.
The characterization of the species generated from the CA could be satisfactorily validated by means of a discriminating analysis. In addition, some of the species that form the groups agree with the analysis of morphological and genetic characters, so it is possible to assume that there are relationships between these characters and the climatic characteristics generated, coinciding with the results of previous research [1].
An example of the validation of groups mentioned above is shown between S. sitiens and S. lycopersicoides considered as a group of related species or sister taxa by a cladistic study carried out by Peralta and Spooner [3] with morphological data and other similar investigations [1,44,45,46]. S. neorickii and S. chmielewskii are considered sister species [1], according to studies based on ITS sequences [47], analysis of phenotypic data and microsatellite markers [48], and cladistic studies with morphological data [49].
Conesa et al. [50] performed a climatic classification of 14 of the wild and related species to S. lycopersicum based on the mean value of annual precipitation and temperature and the De Martonne index. These authors proposed the formation of three groups: species from humid regions (S. ochranthum, S. neorickii, S. chmielewskii, S. juglandifollium and S. lycopersicum), species from semi-arid sites (S. arcanum, S. habrochaites, S. pimpinelifollium, S. galapagense, and S. chesmaniae) and species from arid regions (S. sitiens, S. chilense, S. lycopersicoides, S. penneellii, and S. peruvianum). This classification agrees with the results obtained from the mean annual precipitation reported in the ecological descriptors (Table 2).
The present study, in addition to identifying valuable ecogeographic information not previously reported in the literature, constitutes a precedent for investigating from the use of tools developed by GIS, collections and/or valuable distribution areas as a source of germplasm for the development of varieties tolerant and resistant to specific biotic and abiotic factors through genetic improvement.
In addition, this information can be used for the formation of germplasm conservation strategies, identification of material in danger of extinction due to climate change, and germplasm collection routes for the formation of core collections. Likewise, when addressing the classification of the ecogeographic conditions achieved, they could be associated with the presence of adverse factors, both biotic and abiotic, to define areas with the probable presence of genes for resistance to such factors. Finally, it is important to mention that it is necessary to identify the actual and future ecological niches of the studied species, in that sense, these results constitute the first step on the ecogeography of the wild tomato species, being necessary to identify the ecological niches and the impact of climate change on their distribution and ecological patterns.

4. Materials and Methods

4.1. Database

Passport data of georeferenced accessions of 12 species of wild tomatoes (S. sect. Lycopersicon) and 4 species of phylogenetically related groups (S. sect. Juglandifolia and S. sect. Lycopersicoides) were used. A database was built with information from scientific reports and articles [36,51,52,53,54,55] and national (World Biodiversity Information Network) [56] and international plant inventories (Tomato Genetics Resource Center, Global Biodiversity Information Facility, Solanaceae source) [21,57,58].
It was possible to collect the coordinates of 11,707 accessions, which were reviewed to rule out atypical data, eliminating repeated records, with coordinates of little geographic precision (less than 3 decimal places) and accessions outside the study area according to altitude reported and respecting the previously distributed areas described by Peralta et al. [1] and Grandillo et al. [23] (Table 1). All these strategies were applied to avoid considering accessions that correspond to introductions outside the natural areas of distribution. Finally, a frequency analysis was applied, eliminating those accessions associated with climatic types with less than 3 accessions. From this, 4228 accessions of 12 wild tomatoes and 4 closely related species distributed in Latin America were selected (Figure 1).

4.2. Environmental Information

The EIS was built with 21 variables included annual evapotranspiration (EVAPO, mm) and site altitude (ALT, m), as well as the bioclimatic variables from WorldClim version 2.1 (1970–2000) with spatial resolution of ~1 km2 [59]: annual mean temperature (BIO1, °C), mean diurnal range (BIO2, °C), isothermality (BIO3), seasonal temperature (BIO4), maximum temperature of warmest month (BIO5, °C ), minimum temperature of coldest month (BIO6, °C), temperature annual range (BIO7, °C), mean temperature of wettest quarter (BIO8, °C), mean temperature of driest quarter (BIO9, °C ), mean temperature of warmest quarter (BIO10, °C), mean temperature of coldest quarter (BIO11, °C), annual precipitation (BIO12, mm), precipitation of wettest month (BIO13, mm), precipitation of driest month (BIO14, mm), precipitation seasonality (BIO15), precipitation of wettest quarter (BIO16, mm), precipitation of driest quarter (BIO17, mm), precipitation of warmest quarter (BIO18, mm) and precipitation of coldest quarter (BIO19, mm).
Annual evapotranspiration was calculated from monthly values in raster format with a spatial resolution of 30 arcs second (~1 km2) [60]. Finally, the altitude of the collection site of each accession was determined from an elevation model in raster format, also with spatial resolution ~1 km2 [61].
Climatic types of the accession sites were defined from the world climatic classification with the Köppen–Geiger system [62] with a spatial resolution of ~1 km2 proposed by Beck et al. [31]: Af, Am, Aw, BWh, BWk, BSh, BSk, Csa, Csb, Csc, Cwa, Cwb, Cwc, Dsa, Dsb, Dsc, Dsd, Dwa, Dwb, Dwc, Dwd, Dfa, Dfb, Dfc, Dfd, ET, and EF.

4.3. Climatic Diversity and Ecological Descriptors

Climatic diversity patterns were identified with vectors of the geographical location of each accession. With these vectors and the “Extraction” module of the ArcGis software “Spatial Analyst Tools”, the value of each pixel of the corresponding climatic classification was considered, then all the information was integrated into a worksheet (Microsoft Excel) to identify all types and frequencies of climates for each species.
Ecological descriptors were determined with the methodology proposed by Ruiz-Corral et al. [11], using geographic location vectors of all accessions and the EIS; with this, climatic ranges of adaptation were identified. These values were obtained with the ArcGis “Spatial Analyst Tools”. Information was concentrated in a worksheet where extreme (minimum and maximum) and median and coefficient of variation of each variable for each species were subsequently determined [10,27].

4.4. Statistical Analysis

Linear correlations between pairs were obtained to identify multicollinearity between variables. In those variables with an absolute coefficient greater than 0.95, one of the corresponding pairs was chosen. With the chosen variables, a PCA was carried out to identify the most important variables in the description of the variation between accessions. In order to identify the similarity between the species from the present climatic diversity, a grouping analysis (CA) was carried out with the Gower distances and Ward’s method of minimum variance. In order to carry out this analysis, the possible combinations between species (16) and climatic type (11) were identified, with which 67 combinations were obtained. To corroborate the belonging observations to each identified group, a discriminant analysis was carried out. Finally, the non-parametric test Kruskal–Wallis and range comparison test [63] were performed for clusters generated. To describe the groups, the variables identified as significant in the PCA were used. Statistical analyses were carried out using the Statistical Analysis System software version 9.4 [64].

Author Contributions

Conceptualization, G.R.-O. and J.E.R.-P.; methodology, G.R.-O., J.E.R.-P., J.S.-C., E.R.-G., I.E.P., and J.L.C.-S.; software, G.R.-O. and J.E.R.-P.; validation, J.E.R.-P., J.S.-C., E.R.-G., I.E.P., and J.L.C.-S.; formal analysis, G.R.-O., J.E.R.-P., and J.S.-C.; investigation, G.R.-O., J.E.R.-P., and I.E.P.; data curation, I.E.P.; writing—original draft preparation, G.R.-O. and J.E.R.-P.; writing—review and editing, G.R.-O., J.E.R.-P., J.S.-C., E.R.-G., and I.E.P. All authors have read and agreed to the published version of the manuscript.

Funding

This research received funding from Universidad Autónoma Chapingo through project: D.G.I.P. 20001-C66.

Institutional Review Board Statement

Not applicable.

Informed Consent Statement

Not applicable.

Data Availability Statement

All data sources supporting accessions and climatic information used are mentioned at Methodology section: Solanaceae Source (http://solanaceaesource.org/, accessed on 15 December 2020), GBIF (https://www.gbif.org/, accessed on 19 December 2020), TGRC (https://tgrc.ucdavis.edu/, accessed on 19 December 2020) WorldClim (https://www.worldclim.org/, accessed on 10 December 2020).

Conflicts of Interest

The authors declare no conflict of interest.

References

  1. Peralta, I.E.; Spooner, D.M.; Knapp, S. Taxonomy of wild tomatoes and their relatives (Solanum sect. Lycopersicoides, sect. Juglandifolia, sect. Lycopersicon; Solanaceae). Syst. Bot. Monogr. 2008, 84, 1–186. [Google Scholar]
  2. Razifard, H.; Ramos, A.; Valle, A.L.D.; Bodary, C.; Goetz, E.; Manser, E.J.; Li, X.; Zhang, L.; Visa, S.; Tieman, D.; et al. Evidence for Complex Domestication History of the Cultivated Tomato in Latin America. Mol. Biol. Evol. 2020, 37, 1118–1132. [Google Scholar] [CrossRef] [PubMed]
  3. Aflitos, S.; Schijlen, E.; de Jong, H.; de Ridder, D.; Smit, S.; Finkers, R.; Wang, J.; Zhang, G.; Li, N.; Mao, L.; et al. Exploring genetic variation in the tomato (Solanum section Lycopersicon) clade by whole-genome sequencing. Plants 2014, 80, 136–148. [Google Scholar]
  4. Causse, M.; Giovannoni, J.; Bouzayen, M.; Zouine, M. (Eds.) The Tomato Genome; Springer: Berlin, Germany, 2016; 259p. [Google Scholar] [CrossRef]
  5. Tropicos.org. Available online: https://tropicos.org/home (accessed on 20 December 2020).
  6. Rodríguez, F.; Feinan, W.; Cécile, A.; Tanksley, S.; Spooner, D.M. Do potatoes and tomatoes have a single evolutionary history, and what proportion of the genome supports this history? BMC Evol. Biol. 2009, 191. [Google Scholar] [CrossRef] [PubMed] [Green Version]
  7. Pease, J.B.; Haak, D.C.; Hahn, M.W.; Moyle, L.C. Phylogenomics Reveals Three Sources of Adaptive Variation during a Rapid Radiation. PLoS Biol. 2016, 14, e1002379. [Google Scholar] [CrossRef] [PubMed]
  8. Rodríguez-Guzmán, E.; Vargas-Canela, D.; de Sánchez-González, J.J.; Lépiz-Idelfonso, R.; Rodríguez-Contreras, A.; Ruiz-Corral, J.A.; Puente-Ovalle, P.; Miranda-Medrano, R. Etnobotánica de Solanum var cerasiforme en el occidente de México. Nat. Desarro. 2009, 7, 45–57. [Google Scholar]
  9. Chávez-Servia, J.L.; Carrillo-Rodríguez, J.C.; Vera, A.; Rodríguez-Guzmán, E.; Lobato-Ortíz, R. Utilización Actual del Jitomate Silvestre Mexicano; Subsistema Nacional de Recursos Fitogenéticos para la Alimentación y la Agricultura, Secretaria de Agricultura, Ganadería, Desarrollo Rural, Pesca y Alimentación, CIIDIR-Unidad Oaxaca del Instituto Politécnico Nacional, ITVO-Oaxaca: Oaxaca, México, 2009; 72p. [Google Scholar]
  10. Carrillo-Rodríguez, J.C.; Chávez-Servia, J.L. Caracterización agromorfológica de muestras de tomate de Oaxaca. Rev. Fitotec. Mex. 2010, 33, 1–6. [Google Scholar]
  11. Ramírez-Ojeda, G.; Ruiz-Corral, J.A.; Pérez-Mendoza, C.; Villavicencio-García, R.; Mena-Munguía, S.; Durán-Puga, N. Impactos del cambio climático en la distribución geográfica de Gossypium hirsutum L. en México. Rev. Mex. Cienc. Agríc. 2014, 5, 1885–1895. [Google Scholar] [CrossRef] [Green Version]
  12. Ruiz-Corral, J.A.; Durán-Puga, N.; Sánchez-González, J.J.; Ron-Parra, J.; González-Eguiarte, D.R.; Holland, J.B.; Medina-García, G. Climatic adaptation and ecological descriptors of 42 Mexican Maize (Zea mays L.) races. Crop Sci. 2008, 48, 1502–1512. [Google Scholar] [CrossRef] [Green Version]
  13. Ruiz-Corral, J.A.; Sánchez-González, J.J.; Hernández-Casillas, J.M.; Willcox, M.C.; Ramírez-Ojeda, G.; Ramírez-Díaz, J.L.; González-Eguiarte, D.R. Identificación de razas de maíz adaptadas a condiciones deficientes de humedad mediante datos biogeográficos. Rev. Mex. Cienc. Agric. 2013, 4, 829–842. [Google Scholar] [CrossRef] [Green Version]
  14. De la Paz-Gutierréz, S.; Sánchez-González, J.J.; Ruiz-Corral, J.A.; Ron-Parra, J.; Miranda-Medrano, R.; De la Cruz-Larios, L.; Lépiz-Idelfonso, R. Diversidad de especies insectiles en maíz y teocintle en México. Folia Entomo. Mex. 2010, 48, 103–118. [Google Scholar]
  15. Cervantes-Moreno, R.; Rodríguez-Pérez, J.E.; Carrillo-Fonseca, C.; Sahagún-Castellanos, J.; Rodríguez-Guzmán, E. Tolerancia de 26 colectas de tomates nativos de México al nematodo Meloidogyne incognita (Kofoid y White) Chitwood. Rev. Chapingo Ser. Hortic. 2014, 20, 5–18. [Google Scholar] [CrossRef]
  16. Marín-Montes, I.M.; Lobato-Ortiz, R.; Carrillo-Castañeda, G.; Rodríguez-Pérez, J.E.; García-Zavala, J.J.; Velasco-García, A.M. Riqueza alélica de poblaciones nativas de jitomate (Solanum lucopersicum L.) para el mejoramiento genético. Agrociencia 2019, 53, 355–370. [Google Scholar]
  17. Magallanes-López, A.M.; Martínez-Damián, M.T.; Sahagún-Castellanos, J.; Pérez-Flores, L.J.; Marín-Montes, I.M.; Rodríguez-Pérez, J.E. Post-harvest quality of 40 collections of tomato (Solanum lycopersicum L.) native of Mexico. Agrociencia 2020, 54, 779–795. [Google Scholar] [CrossRef]
  18. Córdova-Téllez, L.; Molina-Moreno, J.C. Conservación ex situ. In Recursos Fitogenéticos de México para la Alimentación y la Agricultura; Informe Nacional sobre el estado de los recursos fitogenéticos para la agricultura y la alimentación; Moreno, J.C.M., Téllez, L.C., Eds.; Secretaria de Agricultura, Ganadería, Desarrollo Rural, Pesca y Alimentación y Sociedad Mexicana de Fitogenética, A.C: Chapingo, México, 2006; 172p. [Google Scholar]
  19. Florido, M.; Plana, D.; Álvarez, M.; Moya, C.; Regla, M.; Caballero, A. Evaluación del germoplasma de tomate (Solanum L. sección Lycopersicon) conservado Ex situ en Cuba utilizando prueba In vitro para predecir las respuestas a altas temperaturas. Cultiv. Trop. 2009, 30, 57–61. [Google Scholar]
  20. Juárez-López, P.; Castro-Brindis, R.; Colinas-León, T.; Ramírez-Vallejo, P.; Sandoval-Villa, M.; Reed, D.W.; Cisneros-Zeballos, L.; King, S. Evaluación de calidad de frutos de siete genotipos nativos de jitomate (Lycopersicum esculentum var. cerasiforme). Rev. Chapingo Ser. Hortic. 2009, 15, 5–9. [Google Scholar] [CrossRef]
  21. TGRC (Tomato Genetics Resource Center). Available online: https://tgrc.ucdavis.edu/ (accessed on 19 December 2020).
  22. Nakazato, T.; Warren, D.L.; Moyle, L.C. Ecological and geographic modes of species divergence in wild tomatoes. Am. J. Bot. 2010, 4, 680–693. [Google Scholar] [CrossRef]
  23. Grandillo, S.; Chetelat, R.; Knapp, S.; Spooner, D.; Peralta, I.E.; Cammareri, M.; Pérez, O.; Termolino, P.; Tripodi, P.; Chiusano, M.L.; et al. Solanum sect. Lycopersicon. In Wild Crop Relatives: Genomic and Breeding Resources Vegetables; Chittaranjan, K., Ed.; Springer: Berlin/Heidelberg, Germany, 2011; Chapter 9; pp. 129–215. [Google Scholar] [CrossRef]
  24. Parra-Quinajo, M.; Iriondo, J.M.; Torres, E. Review. Applications of ecogeography and geographic information systems in conservation and utilization of plant genetic resources. Span. J. Agric. Res. 2012, 10, 419–429. [Google Scholar] [CrossRef] [Green Version]
  25. Hijmans, J.R.; Spooner, D.M. Geographic distribution of wild potato species. Am. J. Bot. 2001, 88, 2101–2112. [Google Scholar] [CrossRef] [Green Version]
  26. López-Soto, J.L.; Ruiz-Corral, J.A.; Sánchez-González, J.J.; Lépiz-Idelfonso, R. Adaptación climática de 25 especies de frijol silvestre (Phaseolus spp.) en la República Mexicana. Rev. Fitotec. Mex. 2005, 28, 221–230. [Google Scholar]
  27. Ruiz-Corral, J.A.; Sánchez-González, J.J.; Aguilar, M. Potential geographical distribution of teosinte in México: A GIS approach. Maydica 2001, 46, 105–110. [Google Scholar]
  28. Sánchez-González, J.J.; Ruiz-Corral, J.A.; Medina-García, G.; Ramírez-Ojeda, G.; de la Cruz-Larios, L.; Holland, J.B.; Miranda-Medrano, R.; García-Romero, G.E. Ecogeography of teosinte. PLoS ONE 2018, 13, e0192676. [Google Scholar] [CrossRef] [Green Version]
  29. Steiner, J.J.; Greene, S.L. Proposed ecological descriptors and their utility for plant germplasm collections. Crop Sci. 1996, 36, 439–451. [Google Scholar] [CrossRef]
  30. Lobo-Burle, M.; Torres-Cordeiro, C.M.; Fonseca, J.R.; de Melo, L.A.M.P.; de Belem-das, R.N.A.; Abadie, T. Characterization of germplasm according to environmental conditions at the collecting site using GIS: Two case studies from Brazil. Plant Genet. Resour. Newsl. 2013, 135, 1–11. [Google Scholar]
  31. Beck, H.E.; Zimmermann, N.E.; Mcvicar, T.R.; Vergopolan, N.; Berg, A.; Wood, E.F. Present and future Köppen-Geiger climate classification maps at 1-km resolution. Sci. Data 2018, 5, 180214. [Google Scholar] [CrossRef] [Green Version]
  32. Nakazato, T.; Housworth, E.A. Spatial genetics of wild tomato species reveals roles of the Andean geography on demographic history. Am. J. Bot. 2011, 98, 88–98. [Google Scholar] [CrossRef]
  33. Bergougnoux, V. The history of tomato: From domestication to biopharming. Biotechnol. Adv. 2013, 32, 170–189. [Google Scholar] [CrossRef]
  34. Rick, C.M. Biosystematic studies in Lycopersicon and closely related species of Solanum. In The Biology and Taxonomy of Solanaceae; Hawkes, J.G., Lester, R.N., Skelding, A.D., Eds.; Academic Press: New York, NY, USA, 1979; pp. 667–677. [Google Scholar]
  35. Taylor, I.B. Biosystematic of the tomato. In The Tomato Crop: A Scientific Basis for Improvement; Atherton, I.G., Rudich, I., Eds.; Chapman and Hall: London, UK, 1986; pp. 1–34. [Google Scholar] [CrossRef]
  36. Flores-Hernández, L.A.; Lobato-Ortiz, R.; García-Zavala, J.J.; Molina-Galán, J.D.; Sangerman-Jarquín, D.M.; Velasco-Alvarado, M.J. Parientes silvestres del tomate como fuente de germoplasma para el mejoramiento genético de la especie. Rev. Fitotec. Mex. 2017, 40, 83–91. [Google Scholar] [CrossRef]
  37. Mittova, V.; Guy, M.; Tal, M.; Volokita, M. Salinity up-regulates the antioxidative system in root mitochondria and peroxisomes of the wild salt-tolerant tomato species Lycopersicon pennellii. J. Exp. Bot. 2004, 55, 1105–1113. [Google Scholar] [CrossRef]
  38. Xu, X.; Martin, B.; Comstock, J.P.; Vision, T.J.; Tauer, C.G.; Zhao, B.; Pausch, R.C.; Knapp, S. Fine mapping a QTL for carbon isotope composition in tomato. Theor. Appl. Genet. 2008, 117, 221–233. [Google Scholar] [CrossRef]
  39. Chetelat, R.T.; Pertuzé, R.A.; Faúndez, L.; Graham, E.B.; Jones, C.M. Distribution, ecology and reproductive biology of wild tomates and related nightshades from the Atacama Desert region of northern Chile. Euphytica 2009, 167, 77–93. [Google Scholar] [CrossRef] [Green Version]
  40. Foolad, M.R.; Lin, G.Y. Relationship between cold tolerance during seed germination and vegetative growth in tomato: Germplasm evaluation. J. Amer. Soc. Hort. Sci. 2000, 125, 679–683. [Google Scholar] [CrossRef]
  41. Venema, J.H.; Linger, P.; Van-Heusden, A.W.; Van-Hasselt, P.R.; Brüggemann, W. The inheritance of chilling tolerance in tomato (Lycopersicon spp.). Plant Biol. 2005, 7, 118–130. [Google Scholar] [CrossRef] [PubMed]
  42. Chen, H.; Chen, X.; Chen, D.; Li, J.; Yi, Z.; Wang, A. A comparison of the low temperature transcriptomes of two tomato genotypes that differ in freezing tolerance: Solanum lycopersicum and Solanum habrochaites. BMC Plant Biol. 2015, 15, 132. [Google Scholar] [CrossRef] [Green Version]
  43. Zhao, L.; Qiu, C.; Li, J.; Chai, Y.; Kai, G.; Li, Z.; Sun, X.; Tang, K.X. Investigation of Disease Resistance and Cold Tolerance of Solanum lycopersicoides for Tomato Improvement. Hort. Sci. 2005, 40, 43–46. [Google Scholar] [CrossRef]
  44. Correll, D.S. The Potato and Its Wild Relatives; Texas Research Foundation, University of Michigan: Ann Arbor, MI, USA, 1962; Volume 4, pp. 1–606. [Google Scholar]
  45. Child, A. A synopsis of Solanum subgenus Potatoe (G. Don) (D’Arcy) (Tuberarium (Dun.) Bitter (s.l.)). Feddes Reper. 1990, 101, 209–235. [Google Scholar] [CrossRef]
  46. Peralta, I.E.; Spooner, D.M. Granule-Bound Starch Synthase (GBSSI) gene phylogeny of wild tomatoes (Solanum L. section Lycopersicon [Mill.] Wettst. subsection Lycopersicon). Am. J. Bot. 2001, 88, 1888–1902. [Google Scholar] [CrossRef] [Green Version]
  47. Marshall, J.A.; Knapp, S.; Davey, M.R.; Power, J.B.; Cocking, E.C.; Bennett, M.D.; Cox, A.V. Molecular systematics of Solanum section Lycopersicum (Lycopersicon) using the nuclear ITS rDNA region. Theor. Appl. Genet. 2001, 103, 1216–1222. [Google Scholar] [CrossRef]
  48. Álvarez, A.E.; van de Wiel, C.; Smulders, M.; Vosman, B. Use of microsatellites to evaluate genetic diversity and species relationships in the genus Lycopersicon. Theor. Appl. Genet. 2001, 103, 1283–1292. [Google Scholar] [CrossRef]
  49. Peralta, I.E.; Spooner, D.M. Morphological characterization and relationships of wild tomatoes (Solanum L. Section Lycopersicon [Mill.]). In A Festschrift for William G. D’Arcy: The Legacy of a Taxonomist; Keating, R.C., Hollowell, V.A., Croat, T.B., Eds.; Missouri Botanical Garden Press: St. Louis, MO, USA, 2005; pp. 227–257. [Google Scholar]
  50. Conesa, M.A.; Muir, C.D.; Roldán, E.J.; Molins, A.; Perdomo, J.A.; Galmés, J. Growth capacity in wild tomatoes and relatives correlates with original climate in arid and semi-arid species. Environ. Exp. Bot. 2017. [Google Scholar] [CrossRef]
  51. Arellano-Rodríguez, L.J.; Rodríguez-Guzmán, E.; Ron-Parra, J.; Martínez-Ramírez, J.L.; Lozoya-Saldaña, H.; Sánchez-Martínez, J.; Lépiz-Idelfonso, R. Evaluación de resistencia a Phytophthora en poblaciones silvestres de Solanum lycopersicum var. cerasiforme. Rev. Mex. Cien. Agríc. 2013, 4, 753–766. [Google Scholar] [CrossRef] [Green Version]
  52. Bonilla-Barrientos, O.; Lobato-Ortíz, R.; García-Zavala, J.J.; Cruz-Izquierdo, S.; Reyes-López, D.; Hernández-Leal, E.; Hernández-Bautista, A. Diversidad agronómica y morfológica de tomates arriñonados y tipo pimiento de uso local en Puebla y Oaxaca, México. Rev. Fitotec. Mex. 2014, 37, 129–139. [Google Scholar] [CrossRef]
  53. Maldonado-Peralta, R.; Ramírez-Vallejo, P.; González-Hernández, V.A.; Castillo-González, F.; Sandoval-Villa, M.; Livera-Muñoz, M.; Cruz-Huerta, N. Riqueza agronómica en colectas mexicanas de tomates (Solanum lycopersicum L.) nativos. Agroproductividad 2016, 9, 68–75. [Google Scholar]
  54. Velasco-Alvarado, M.J.; Lobato-Ortiz, R.; García-Zavala, J.J.; Castro-Brindis, R.; Cruz-Izquierdo, S.; Corona-Torres, T.; Moedano-Mariano, M.K. Mexican native tomatoes as rootstocks to increase fruit yield. Chilean J. Agric. Res. 2017, 77, 187–193. [Google Scholar] [CrossRef] [Green Version]
  55. Flores-Hernández, L.A.; Lobato-Ortíz, R.; Sangerman-Jarquín, D.M.; García-Zavala, J.J.; Molina-Galán, J.D.; Velasco-Alvarado, M.J.; Marín-Montes, I.M. Genetic diversity within wild species of Solanum. Rev. Chapingo Ser. Hortic. 2018, 24, 85–96. [Google Scholar] [CrossRef]
  56. REMIB (Red Mundial de Información sobre Biodiversidad), Comisión Nacional para el Conocimiento y Uso de la Biodiversidad. México. Available online: http://www.conabio.gob.mx/remib/ (accessed on 19 December 2020).
  57. GBIF (Global Biodiversity Information Facility). Available online: https://www.gbif.org/ (accessed on 19 December 2020).
  58. Solanaceae Source. A Global Taxonomic Source for the Nightshade Family. Available online: http://solanaceaesource.org/ (accessed on 15 December 2020).
  59. Worldclim. 2019. Available online: https://www.worldclim.org/data/index.html (accessed on 10 December 2020).
  60. Trabucco, A.; Zomer, R.J. Global High-Resolution Soil-Water Balance. Figshare. Fileset 2019. [Google Scholar] [CrossRef]
  61. Fick, S.E.; Hijmans, R.J. WorldClim 2: New 1-km spatial resolution climate surfaces for global land areas. Int. J. Climatol. 2017, 37, 1. [Google Scholar] [CrossRef]
  62. Kottek, M.; Grieser, J.; Beck, C.; Rudolf, B.; Rubel, F. World map of the Köppen-Geiger climate classification updated. Meteolologische Z. 2006, 15, 259–263. [Google Scholar] [CrossRef]
  63. Conover, W.J. Practical Nonparametric Statistics, 3rd ed.; John Wiley & Sons: Hoboken, NJ, USA, 1999; p. 584. [Google Scholar]
  64. SAS Institute. SAS/STAT User’s Guide: Software Version 9.3; Statistical Analysis System Institute: Cary, NC, USA, 2011. [Google Scholar]
Figure 1. Climate classification according to Beck et al. [31] and geographic distribution of 12 wild tomatoes (Sect. Lycopersicon) and 4 closely related species (Sect. Juglandifolia and Lycopersicoides) Climate classification: Af (tropical, rainforest), Am (tropical, monsoon), Aw (tropical, savannah), BWh (arid, desert, hot), BWk (arid, desert, cold), BSh (arid, steppe, hot), BSk (arid, steppe, cold), Csb (temperate, dry summer, warm summer), Cwb (temperate, dry winter, warm summer), Cfb (temperate, no dry season, warm summer), and ET (polar, frost). In parentheses number of accessions.
Plants 10 00855 g001
Figure 2. Percentage of climatic type by species according to Beck et al. [31] of 12 wild tomatoes (Sect. Lycopersicon) and 4 closely related species (Sect. Juglandifolia and Sect. Lycopersicoides). Climate classification: Af (tropical, rainforest), Am (tropical, monsoon), Aw (tropical, savannah), BWh (arid, desert, hot), BWk (arid, desert, cold), BSh (arid, steppe, hot), BSk (arid, steppe, cold), Csb (temperate, dry summer, warm summer), Cwb (temperate, dry winter, warm summer), Cfb (temperate, no dry season, warm summer), ET (polar, frost). Within each rectangle, species that belong to the phylogenetic groups proposed by Peralta et al. [1]: Red = Lycopersicon, yellow = Arcanum, green = Ericopersicon, blue = Neoricopersicon, gray = S. sect. Juglandifolia, pink = S. sect. Lycopersicoides.
Plants 10 00855 g002
Figure 3. Biplot based on 4228 accessions of wild tomato and related species and 10 climatic variables. BIO13: precipitation of wettest month, BIO12: annual precipitation, ETPA: annual evapotranspiration, BIO1: annual mean temperature, BIO2: mean diurnal range, ALT: altitude, BIO8: mean temperature of wettest quarter, BIO5: maximum temperature of the warmest month, BIO15: coefficient of variation of seasonal precipitation, and BIO3: isothermality. PC1 and PC2 explained 47.8 and 27.2% of the total variation, respectively.
Plants 10 00855 g003
Figure 4. Clusters formed and their distribution of 12 wild tomatoes and 4 related species of S. lycopersicum based on climatic variables using Gower’s distances and Ward’s grouping method.
Plants 10 00855 g004
Table 1. Distribution and altitude (m above sea level) of 16 species of Solanum reported in two publications: Peralta et al. [1] and Grandillo et al. [23]. Species described according to taxonomic sections and groups proposed by Peralta et al. [1].
Section/GroupSolanum SpeciesEcological DistributionAltitude
[1]
Altitude
[23]
Section Lycopersicon
Lycopersicon
S. cheesmaniaeEndemic to the Galapagos Islands. It inhabits dry, open, and rocky slopes, cold places.0–13000–1500
S. galapagenseEndemic to the Galapagos Islands, on dry, open, and rocky slopes.0–600 (1500)0–650
S. pimpinellifoliumSouthern region of Ecuador to the northern region of Chile. Dry slopes, plains, and associated with crop areas.0–5000–500
ArcanumS. arcanumNorthern Peru in inter-Andean dry valleys and coastal ecosystems with seasonal fog. Generally dry sites, rocky slopes.100–2500500–3000
S. chmielewskiiSouthern zone of Peru and the northern zone of Bolivia. Wet and well-drained rocky slopes.2300–30001600–3100
S. neorickiiSouthern Ecuador to southern Peru, in inter-Andean dry valleys.1950–30001500–2500
EricopersiconS. huaylasenseNorthern and central Peru, on dry, open, and rocky slopes.1700–0001000–900
S. corneliomulleriSouthern Peru in regions with dry and rocky slopes.1000–30001000–3000
S. peruvianumCentral region of Peru to northern Chile in dry coastal deserts and seasonal mist ecosystems.0–6000–2500
S. chilenseCoastal zone of Chile and northern Peru, on dry rocky slopes, and occasionally saline.0–300050–3500
S. habrochaitesAndean region of Ecuador and Peru in montane forests and dry slopes, occasionally found in seasonal fog ecosystems.400–360040–3300
NeolicopersiconS. pennelliiNorth of Peru to the north of Chile, in areas of dry slopes, generally in flat areas.0–30000–1920
Section
Juglandifolia
S. ochranthumAndean region of Colombia, Ecuador, and Peru, areas of mountain mesophilic forest.1900–41001200–3200
S. juglandifolliumAndean region of Colombia, Ecuador, and Peru in areas of mountain mesophilic forest.1200–31001200–3100
Section
Lycopersicoides
S. lycopersicoidesSouthern area of Peru and northern Chile. In ravines and rocky slopes.1500–37001200–3700
S. sitiensHyper-arid areas, northern region of Chile.2350–35002500–3500
Table 2. Ecological descriptors of the wild and related species to S. lycopersicum. ALT = altitude, TEMP = annual mean temperature, DRAN = mean diurnal range, RAIN = annual precipitation, EVAPO = annual evapotranspiration. Max = maximum, Min = minimum, Med = median, and CV = coefficient of variation. Species divided according to sections and groups proposed by Peralta et al. [1].
Sections/GroupSpeciesALTTEMPDRANRAINEVAPO
(m)(°C)(°C)(mm)(mm)
MaxMinMedCVMaxMinMedCVMaxMinMedCVMaxMinMedCVMaxMinMedCV
Section Lycopersicon
Lycopersicon
S. cheesmaniae1478587155.202517.123.63.2710.37.68.54.5756210727721.70112518745442.24
S. galapagense868445240.002519.823.92.8710.17.68.74.9154613527416.0693026253130.60
S. pimpinelifollium633193100.0026.817.922.78.5413.36.39.88.372989170157.861710145202.22
ArcanumS. arcanum3292132168136.7624.111.418.49.1914.410.312.43.4211932252743.4510941139543.29
S. chmielewskii3195195325839.5219.91316.89.8815.611.714.93.21131850494418.5187442964716.74
S. neorickii32621705231711.5720.311.716.97.8815.59.913.12.19136642681623.53103132667214.29
EricopersiconS. huaylasense31241141229116.0620.311.216.88.3813.910.813.41.2750012834623.994167327830.76
S. corneliomulleri30971018234418.7518.39.614.112.9516.69.412.34.074341920160.703541214148.58
S. peruvianum26172528124.0320.911.718.66.9815.54.79.415.6143402592.00324013130.77
S. chilense39950190459.5320.45.415.219.2918.64.912.610.8235502869.6427532072.50
S. habrochaites369240203333.7825.8716.617.3014.56.511.85.2623581162243.251682855543.69
NeolicopersiconS. pennellii2921582253.1625.110.518.47.3813.76.210.28.3540414995.9228903396.97
Section
Juglandifolia
S. juglandifolium33531005219514.4922.98.915.810.6812.57.29.11.943214550189528.791648413117710.24
S. ochranthum40081195275010.2721.96.713.911.6515.67.211.43.422358507101011.44147428681813.57
Section
Lycopersicoides
S. lycopersicoides37751290292813.5417.37.611.215.2815.110.414.14.552151310453.1418298060.94
S. sitiens3330227627405.9013.28.411.47.9417.615.616.81.263181725.002692116.67
Table 3. Median (Med) and coefficient of variation (CV) of the ecological descriptors of the combinations of 16 wild and related tomato species by the 11 climatic types identified according to the formation of CA groups. Group = A (Arcanum), E (Ericopersicon), N (Neolicopersicon), Y (Section Lycopersicoides), L (Lycopersicon), and J (Section Juglandifolia). Spe = species, Clim = climate type [31], ALT = altitude, TEMP = annual mean temperature, DRAN = mean diurnal range, RAIN = annual precipitation, EVAPO = annual evapotranspiration. JUG = S. juglandifolium, OCH = S. ochranthum, CHI = S. chilense, COR = S. corneliomulleri, HAB = S. habrochaites, HUA = S. huaylasense, LYC = S. lycopersicoides, PEN = S. pennelli, ARC = S. arcanum, CHM = S. chmielewskii, NEO = S. neorickii, CHE = S. cheesmaniae, GAL = S. galapagense, PIM = S. pimpinelifollium, PER = S. peruvianum, SIT = S. sitiens. Climate types: 1 = Af (tropical, rainforest), 2 = Am (tropical, monsoon), 3 = Aw (tropical, savannah), 4 = BWh (arid, desert, hot), 5 = BWk (arid, desert, cold), 6 = BSh (arid, steppe, hot), 7 = BSk (arid, steppe, cold), 9 = Csb (temperate, dry summer, warm summer), 12 = Cwb (temperate, dry winter, warm summer), 15 = Cfb (temperate, no dry season, warm summer), 29 = ET (polar, frost).
GroupCLUTERSpe-ClimALT (msnm)TEMP (°C)DRAN (°C)RAINF (mm)EVAPO (mm)
MedCVMedCVMedCVMedCVMedCV
E1CHI-5228044.5214.120.3613.116.983654.172659.62
E1CHI-7366212.568.126.3914.88.2623816.8120813.73
E1COR-5198922.0815.66.651213.8113046.159436.9
E1COR-726377.4711.78.412.32.23609.1723915.9
E1HAB-2935583.119.23.3813.44.235621.648018.13
E1HAB-518059.1715.87.6611.62.4819416.4913728.1
Y1LYC-528811311.613.83144.789359.687661.18
Y1LYC-7365408.1014.9021301820.27
N1PEN-5153116.9816.74.53116.649056.117546.67
N1PEN-725268.2212.815.1812.61.7333511.7925014.83
E1PER-5171329.19167.7211.612.9855104.555177.45
E1PER-724724.6912.93.0312.33.7333912.2421317.84
Y1SIT-527405.911.47.9416.80.9517252116.67
A2ARC-467938.25202.311.55.2991101.184108.33
L2CHE-162013.4321.33.68.78.233057.469886.4
L2CHE-15101310.2719.72.61102.723284.819924.39
L2CHE-314479.4423.42.128.24.82751645738.29
L2CHE-44763.9824.30.698.91.6620222.42907.67
L2CHE-639108.9724.11.248.42.5435939.2850412.81
E2CHI-438590.7818.72.31920.18771.43721.43
L2GAL-316781.1423.42.718.64.727617.9356229.36
L2GAL-42077.524.41.279.14.3224918.0732239.91
L2GAL-61883.3324.40.529.35.127511.2753119.68
E2HAB-4326110.4320.69.3311.36.2811457.467792.86
N2PEN-462243.0919.64.5108.153488.241973.68
L2PIM-327414.8125.21.429.15.01119035.8886112.31
L2PIM-49587.37228.0310.112.635011925224
L2PIM-664276.3824.72.589.84.6160214.2948515.77
A3ARC-1223739.5916.36.0413.62.397168.15949.6
A3ARC-15211513.3616.86.2812.32.438636.557457.99
A3ARC-7253717.0315.111.9813.42.4635234.2337013.24
A3CHM-1226019.8816.710.31151.9294814.4566314.25
A3CHM-725604.0217.14.8114.31.6653417.8844924.28
E3HAB-1226929.6814.89.0213.78.137618.546457.67
E3HAB-7264810.8413.412.7312.94.9639321.1229632.6
E3HUA-723379.9916.65.5113.62.6735420.0628228.19
A3NEO-12256410.2616.89.7514.65.1799927.1862616.37
A3NEO-7209611.0918.78.4513.82.155417.9541924.94
J3OCH-12301011.0513.810.5114.44.6296717.1266414.31
J3OCH-7286510.12154.0415.210.95508254423.73
E4HAB-1522708.3716.15.6511.67.6992113.7479912.52
E4HAB-9273312.2213.98.39111.025952.6958210.82
J4JUG-1224287.9113.74.34106.1276018.427788.74
J4JUG-293144010.9010.70122201,0150
A4NEO-15215311.1816.96.6811.84.1781715.097197.82
J4OCH-1526269.12149.0811.28104110.2582513.58
J4OCH-2933724.099.16.249.97.9910106.7681211.02
J4OCH-927255.4213.85.1210.96.91100410.489329.87
A5ARC-21216021.4011.101193010940
A5ARC-314486.0119.92.2512.20.316945.695374.75
A5ARC-518286.4417.32.7712.24.9923227.0517942.58
A5ARC-6125913.1519.45.5912.53.2145322.0235824.23
E5HAB-3141520.6120.77.8211.75.3891813.7384012.56
E5HAB-6107732.421.37.6511.73.7756618.7347918.37
E5HUA-4123415.3619.32.6512.47.7224732.7919434.54
E5HUA-6147719.7719.33.6612.63.353048.222157.44
J5JUG-315109.318.43.4110.23.231,09918.1573723.0
J5OCH-317346.3119.23.6911.74.158606.8986714.95
E6HAB-162951.5524.23.7910.92.0617089.6915498.78
J6JUG-1151510.7319.75.069.66.7422749.813636.64
J6JUG-1522759.7815.48.239.17.35194127.7911838.54
J6JUG-213258.4219.63.038.62.7620878.5311893.36
J6JUG-9193312.7816.66.319.05.15145618.3711483.53
J6OCH-1147210.0919.94.579.95.47200910.63133312.87
L6PIM-137941.5625.53.510.46.78208020.82165515.38
L6PIM-228960.1424.33.528.21.62249417.312215.2
Table 4. Medians comparisons of the informative variables that integrate the first three principal components for the 6 clusters formed in the CA of the wild tomato species in Latin America. EVAPO = Annual evapotranspiration, BIO12 = annual precipitation, BIO13 = precipitation of wettest month, ALT = altitude, BIO8 = mean temperature of wettest quarter, BIO5 = maximum temperature of warmest month, BIO2 = mean diurnal range, BIO1 = annual mean temperature, BIO15 = precipitation seasonality, and BIO3 = isothermality.
CP1CP2CP3
EVAPOBIO12BIO13ALTBIO8BIO5BIO2BIO1BIO15BIO3
1137 d194 d69 c2526 b14.0 cd20.5 d12.6 b12.8 d127 a74.6 c
2389 c262 d54 c155 d25.1 a30.0 a9.0 e22.7 a89 b67.7 d
3521 c628 c117 b2562 ab16.5 c24.0 c13.7 a16.4 c80 c84.1 b
4805 b962 b141 b2675 a13.9 d20.7 d10.9 d13.8 cd43 d85.0 ab
5508 c630 c129 b1431 c20.3 b26.0 b11.9 c19.3 b92 bc86.6 a
61277 a2044 a253 a1398 c19.8 b25.4 b9.3 e19.7 ab35 d88.9 a
Medians with the same letter within each column are not statistically different (p ≤ 0.05) according to the multiple comparisons and Kruskal–Wallis test.
Publisher’s Note: MDPI stays neutral with regard to jurisdictional claims in published maps and institutional affiliations.

