Brief Report

Retrieval of Vegetation Indices Related to Leaf Water Content from a Single Index: A Case Study of Eucalyptus globulus (Labill.) and Pinus radiata (D. Don.)

by
Juan Villacrés
1,†,
Andrés Fuentes
2,†,
Pedro Reszka
3,† and
Fernando Auat Cheein
1,*,†
1
Department of Electronic Engineering, Universidad Técnica Federico Santa María, Av. España 1680, Valparaiso 2390123, Chile
2
Department of Industrial Engineering, Universidad Técnica Federico Santa María, Av. España 1680, Valparaiso 2390123, Chile
3
Faculty of Engineering and Sciences, Universidad Adolfo Ibáñez, Santiago 7941169, Chile
*
Author to whom correspondence should be addressed.
These authors contributed equally to this work.
Plants 2021, 10(4), 697; https://doi.org/10.3390/plants10040697
Submission received: 21 March 2021 / Revised: 27 March 2021 / Accepted: 28 March 2021 / Published: 5 April 2021

Abstract

:
The vegetation indices derived from spectral reflectance have served as an indicator of vegetation’s biophysical and biochemical parameters. Some of these indices are capable of characterizing more than one parameter at a time. This study examines the feasibility of retrieving several spectral vegetation indices from a single index under the assumption that all these indices are correlated with water content. The models used are based on a linear regression adjusted with least squares. The spectral signatures of Eucalyptus globulus and Pinus radiata, which constitute 97.5% of the forest plantation in Valparaiso region in Chile, have been used to test and validate the proposed approach. The linear models were fitted with an independent data set from which their performance was assessed. The results suggest that from the Leaf Water Index, other spectral indices can be recovered with a root mean square error up to 0.02, a bias of 1.12%, and a coefficient of determination of 0.77. The latter encourages using a sensor with discrete wavelengths instead of a continuum spectrum to estimate the forestry’s essential parameters.

1. Introduction

The use of sensors operating in the electromagnetic (EM) spectrum has allowed the estimation of several biophysical parameters in forest and urban environments [1,2]. Such estimates employ narrow bands of the EM spectrum, spectral transformations (e.g., derivatives, continuum removal, wavelets), or vegetation indices (VIs). The latter has been used in qualitative and quantitative studies of vegetation on a temporal and spatial scale [3,4]. Vegetation indices are structured from a limited set of wavelengths; VIs attempt to maximize sensitivity to a biophysical parameter while minimizing adverse effects (e.g., atmospheric composition and variations in canopy background) [5].
Some of the spectral indices are used to predict more than one parameter at a time, on scales ranging from leaf level to canopy level, and even on global scales. For example, one of the most common VI, the Normalized Difference Vegetation Index (NDVI), is used in applications to assess biomass, phenology, Leaf Area Index, plant growth, among others [2,5]. Another spectral index is the Double Difference Index (DDI), developed to evaluate chlorophyll levels, but it has also presented a high correlation with the equivalent water thickness [6,7]. Li and coworkers evaluated several chlorophyll-sensitive spectral indices to recover the nitrogen content in the vegetation [8]. Since each individual of a given plant species will have a specific spectral signature which depends on its biophysical and biochemical state and, therefore, on environmental conditions, it can be argued that, through the use of spectral reconstruction techniques based on data analysis, the characterization of several vegetation parameters can be performed from a single vegetation index.
In our previous work [9], we studied the correlation of several vegetation indices with the water content in the leaves of Eucalyptus globulus and Pinus radiata. Given the coefficient of determination values, we hypothesized that it is possible to estimate some spectral indices using only the most suitable one used to recover the moisture content. In this brief, 18 spectral indices related to water content are studied, and the most suitable one—from a water content perspective—is selected to recover the remaining ones. To validate this hypothesis, we carried out a dehydration process and worked with two data sets, one for fitting and the other for validating the model. The specific objectives of this study are (1) to develop a model to select the most appropriate index to recover moisture content; (2) to estimate the remaining seventeen water-related spectral indices from the index chosen in (1); and (3) to evaluate the performance of the model in terms of mean square error, coefficient of determination, and percent bias.

2. Materials and Methods

Figure 1 represents the work-flow followed in this study. It began with the acquisition stage, where leaves were collected and their reflectance spectrum measured. With this information, the fuel moisture content (FMC) and the eighteen vegetation indices were obtained. Then, the relationship of the fuel moisture content and the vegetation indices was expressed in terms of the coefficient of determination ( R 2 ). The index with the highest R 2 was selected as suitable, and then the models were obtained to recover the rest of the indices from the selected one. Finally, a validation stage was carried out with an independent dataset. Each of these stages is detailed below.

2.1. Leaf Sampling

In the region of Valparaiso, located in central Chile, a field sampling of Pinus radiata and Eucalyptus globulus leaves was carried out. These leaves were collected from the lower part of the canopy during four measurement campaigns. The months in which these samples were obtained were July, August and September 2018, and the last one in January 2020. In the first three campaigns, a total of 90 samples were obtained, while in the last one, 27 samples were collected (per each species). This separation is due to the fact that this last data set will be used to evaluate the performance of the models.
Once the branches were cut from the trees, they were stored in plastic bags to minimize aging effects. The samples were taken to the laboratory in less than one hour to start the measuring process.

2.2. Reflectance Measurement and Dehydration Process

The Eucalyptus leaves were detached individually from the branches; on the contrary, as Pinus needles have an acicular shape, they were arranged in batches of approximately 5 g. At this point, the leaves were considered alive, their masses were registered with a balance and their reflectance was recorded with the ASD spectrometer. To perform the spectral measurement, each leaf was placed on a panel with constant reflectance throughout the spectrum. Then the contact probe, illuminated with a tungsten filament, was placed over the samples, and the spectral signature of each sample was recorded three times. The spectrometer was calibrated with a Spectralon before use, and after 30 measurements.
Since the models to be used depended on the variation of water content in the leaves, a dehydration process was carried out to have a wide range of samples with different moisture content levels. This process consisted of placing the leaves in a drying oven at 65 ° C for 15 min for Eucalyptus leaves and 60 min for Pinus needles. After the drying process, the spectrum and mass were measured. This dehydration was repeated a total of three times, following the guidelines presented in [9,10]. Finally, to obtain the completely dry leaf mass, a 24-h drying process was carried out. In summary, five mass and reflectance values were measured for each vegetation sample. Table 1 lists the technical characteristics of the equipment used in this procedure. A general scheme of the measurement process is given at the top of Figure 1.

2.3. Moisture Content and Vegetation Indices

Once the measurement process was complete, the FMC was calculated as follows:
F M C = W f , t W d W d
where W f , t is the weight of the leaf at the time t, and W d is the dried leaf’s mass. Several researches have developed spectral indices with a high correlation with the moisture content. In this regard, we selected 18 vegetation indices previously reviewed in [9]. The complete list of indices is shown in Table 2.

2.4. Vegetation Index Retrieval

As stated in Section 1, this study aimed to retrieve water-related vegetation indices from a single index. Therefore, it was crucial to determine which index will be the basis for recovering the remaining 17. In this regard, the FMC was correlated from each spectral index using a linear model as shown in Equation (2):
F M C = α 1 , x V I x + α 2 , x
where α 1 , x , α 2 , x are the parameters of the linear model fitted with least squares, the suffix x 1 , 2 , 3 , , 18 represents each one of the indices in Table 2. The model with the highest coefficient of determination is selected and named with suffix H. The FMC of the selected index V I H is equalized to each of the remaining spectral index models (indicated as V I N ) from this model stack. The final linear model with input V I H , and the output each of the resting 17 indices is shown in Equation (3):
V I N = 1 α 1 , N α 1 , H · V I H + α 2 , H α 2 , N

2.5. Model Evaluation Metrics

The validation stage was conducted on an independent data set. The performance of the linear models was tested based on three metrics: coefficient of determination R 2 , Root Mean Square Error (RMSE) as shown in Equation (4); and percentage bias ( b i a s ), see Equation (5). The first indicated how well the actual and predicted values of the VI fitted together. The second quantified the error made in the prediction; the lower the RMSE value, the better the model. The percentage bias indicated the estimated data’s tendency to be larger or smaller than their actual values. Positive bias values represented overestimation, and negative bias values represented underestimation [25].
R M S E = 1 n i = 1 n V I ^ i V I i 2
b i a s = V I V I ^ V I × 100 %
where V I ^ i is the prediction of the ith—vegetation index sample, V I i is the actual value of the ith—vegetation index, and n is the number of samples.

2.6. Non-Water Content Related VIs

We also estimated five vegetation indices—different from the 18 VIs chosen in Table 2—based on the index selected in Section 2.4. These VIs provided information on nitrogen content, anthocyanin, and carotenoid content. Besides, we included the most widespread VI in vegetation assessment, the NDVI [26]. Table 3 shows the acronym, formula, and reference information for each index.

3. Results

As reported in Section 2, the data from the first three measurement campaigns were used to fit the models, while the last one was used to validate them. The time between the measurement of these two sets was 15 months and thus they were considered independent sets. The first column of Figure 2 presents the group used in the linear modeling, while the second column represents the validation set. The dehydration process resulted in a variation of the FMC between 0% when the leaves were dry (after 24 h in the oven), and a maximum of 157.68% and 180.04% for Pinus needles and Eucalyptus leaves, respectively. Nevertheless, we limited our work to water contents higher than 30% and 50% for Pinus and Eucalyptus, respectively. Those thresholds were defined according to the results obtained in [31,32], for Pinus and Eucalyptus species. These values were obtained under drought stress conditions; lower values of water content caused the plant to show traits of mortality [31].

3.1. Model Fitting

Table 4 shows that the maximum value of R 2 for both species was 0.8699, and was obtained with the Leaf Water Index (LWI) for Eucalyptus globulus. Also, this same index for Pinus radiata was the highest with R 2 = 0.7742. Thus, the LWI was selected as a suitable index to retrieve the rest of the indices. As supplementary material, the reader can refer to Appendix A for the variation of the 18 vegetation indices as function of FMC for Pinus radiata and Eucalyptus globulus.
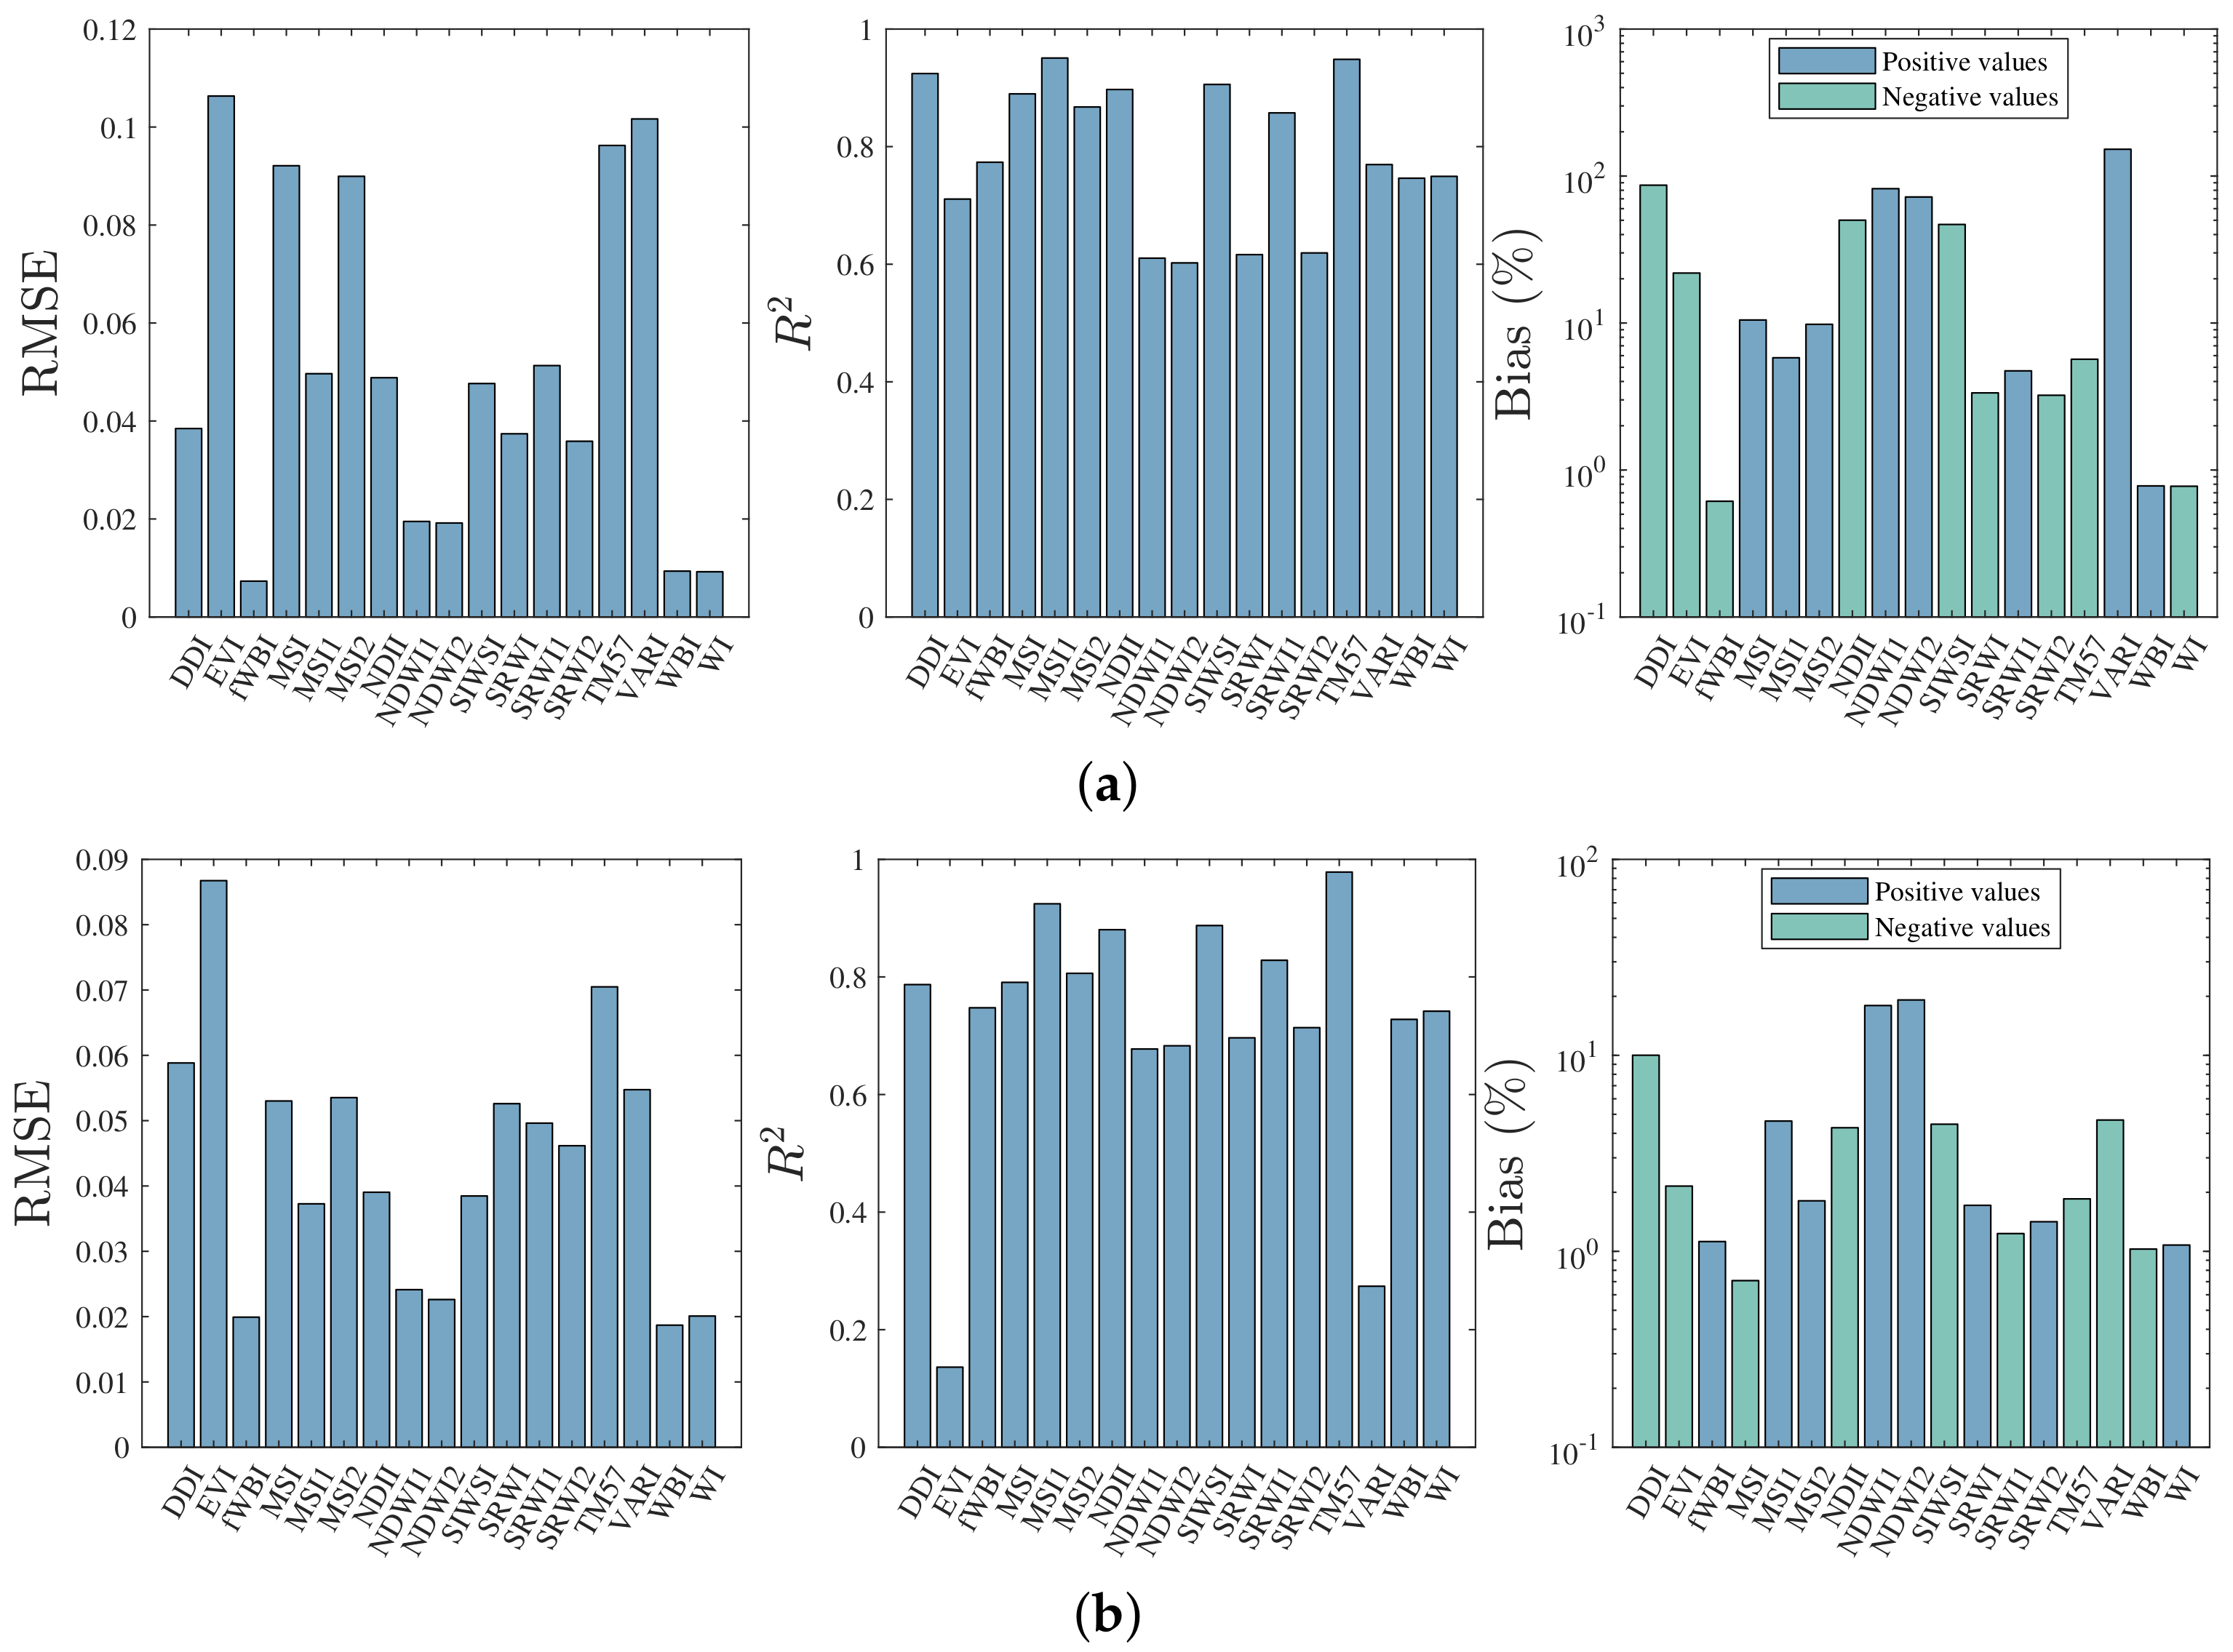
The 17 remaining spectral indices were calculated following Equation (3). For both species, the R 2 , the RMSE, and the percentage bias are depicted in Figure 3. The percentage bias was expressed with two different colors for positive and negative values—this distinction was made because the axis of the ordinates was logarithmic.
The spectral indices recovered from the LWI with the lowest RMSE were fWBI, WI, WBI, with values less than 0.0094 and 0.0201 for Pinus and Eucalyptus, respectively. On the other hand, the TM57 and MSI1 indices presented a coefficient of determination higher than 0.9244 in both species. Finally, considering the indices with lower RMSE and R 2 values; the WBI and WI indices had an absolute percentage bias lower than 1.07% for both species. It is worth noting that none of the wavelengths of the LWI formulation were contained in the five indices mentioned above.
In addition to these five vegetation indices, other spectral indices with significant evaluation metrics were obtained. In particular, for Pinus radiata, MSI, MSI2, NDII, SIWSI and SRWI1 with an RMSE was lower than 0.092, and the R 2 was higher than 0.85. On the other hand, for Eucalyptus globulus, the spectral indices MSI, MSI2, NDII, SIWSI and SRWI1 had an RMSE lower than 0.054, and R 2 higher than 0.791.

3.2. Retrieval of Non-Water Content Related VIs

After observing that the LWI was able to recover several vegetation indices related to water content, we used such an index to estimate other VIs not associated with moisture content (see Table 3). The results indicated that the LWI was suitable to estimate the VIs presented in Table 5 with an R 2 higher than 0.71, an RMSE lower than 0.0908 for Pinus radiata. For Eucalyptus globulus, the coefficient of determination is more elevated than 0.7475, and an RMSE lower than 0.0588.

4. Discussion

The assumption that the adjustment and validation sets are independent can be supported due to the difference in the mean spectrum of the two sets (see black line in Figure 2). Additionally, the spread of the individual reflectance spectra shows noticeable differences between the model and validation sets, as seen in Figure 2.
The relationship between the FMC and the eighteen VIs understudy is expressed as a coefficient of determination in Table 4. In general, the mean value of the R 2 coefficient, for the ten indices with the highest coefficient of determination, is 0.6723 and 0.7639 for Pinus radiata and Eucalyptus globulus, respectively. Such values suggest that given the correlation of spectral indices and water content, it would be possible to use only one to determine the others. The selection of the most suitable spectral index was made based on the coefficient of determination. The values obtained for RMSE, R 2 , and bias suggest that it is possible to estimate several related spectral indices from a single one, in specific, Leaf Water Index (LWI). On the other hand, the results obtained when retrieving VIs that are not related to water content from the LWI point to the possibility of using such index to estimate a wide range of VIs; however, further work is needed in this area.

5. Conclusions

This study presents the findings on the potential of exploiting the relationship between FMC and vegetation indices to estimate the values of several moisture-related spectral indices form the knowledge of a single index. The work has focused on linear models, which are adjusted with data obtained in field sampling. The results suggest that it is possible to retrieve some vegetation indices from a Leaf Water Index (LWI). Specifically, the fWBI, WBI, WI can be recovered from the LWI up to an RMSE = 0.0201; R 2 = 0.77; and bias = 1.12% for both species. The main use of such a method is for the use of airborne sensors with discrete wavelengths instead of a continuous spectrum one to estimate vegetation indices.

Author Contributions

Conceptualization, F.A.C., A.F. and P.R.; methodology, J.V.; software, J.V.; validation, J.V.; formal analysis, F.A.C. and J.V.; investigation, J.V.; resources, F.A.C.; data curation, A.F. and P.R.; writing—original draft preparation, J.V., F.A.C., A.F. and P.R.; writing—review and editing, F.A.C., A.F.; visualization, J.V.; supervision, F.A.C.; project administration, A.F.; funding acquisition, A.F. All authors have read and agreed to the published version of the manuscript.

Funding

This research was funded by ANID PIA/ANILLO ACT172095, ANID FB0008.

Data Availability Statement

The data presented in this report are available on request from the corresponding author.

Acknowledgments

The authors would like to thank to Agencia Nacional de Investigación y Desarrollo (ANID) PFCHA/DoctoradoNacional/2020-2120068, Universidad Técnica Federico Santa María, Dirección General de Investigación, Innovación y Postgrado (DGIIP), Fondecyt 1201319, and PIIC 25/2020.

Conflicts of Interest

The authors declare no conflict of interest.

Abbreviations

The following abbreviations are used in this manuscript:
EMElectromagnetic
FMCFuel Moisture Content
R 2 Coefficient of determination
VIVegetation index

Appendix A. Vegetation Indices Variation versus Fuel Moisture Content
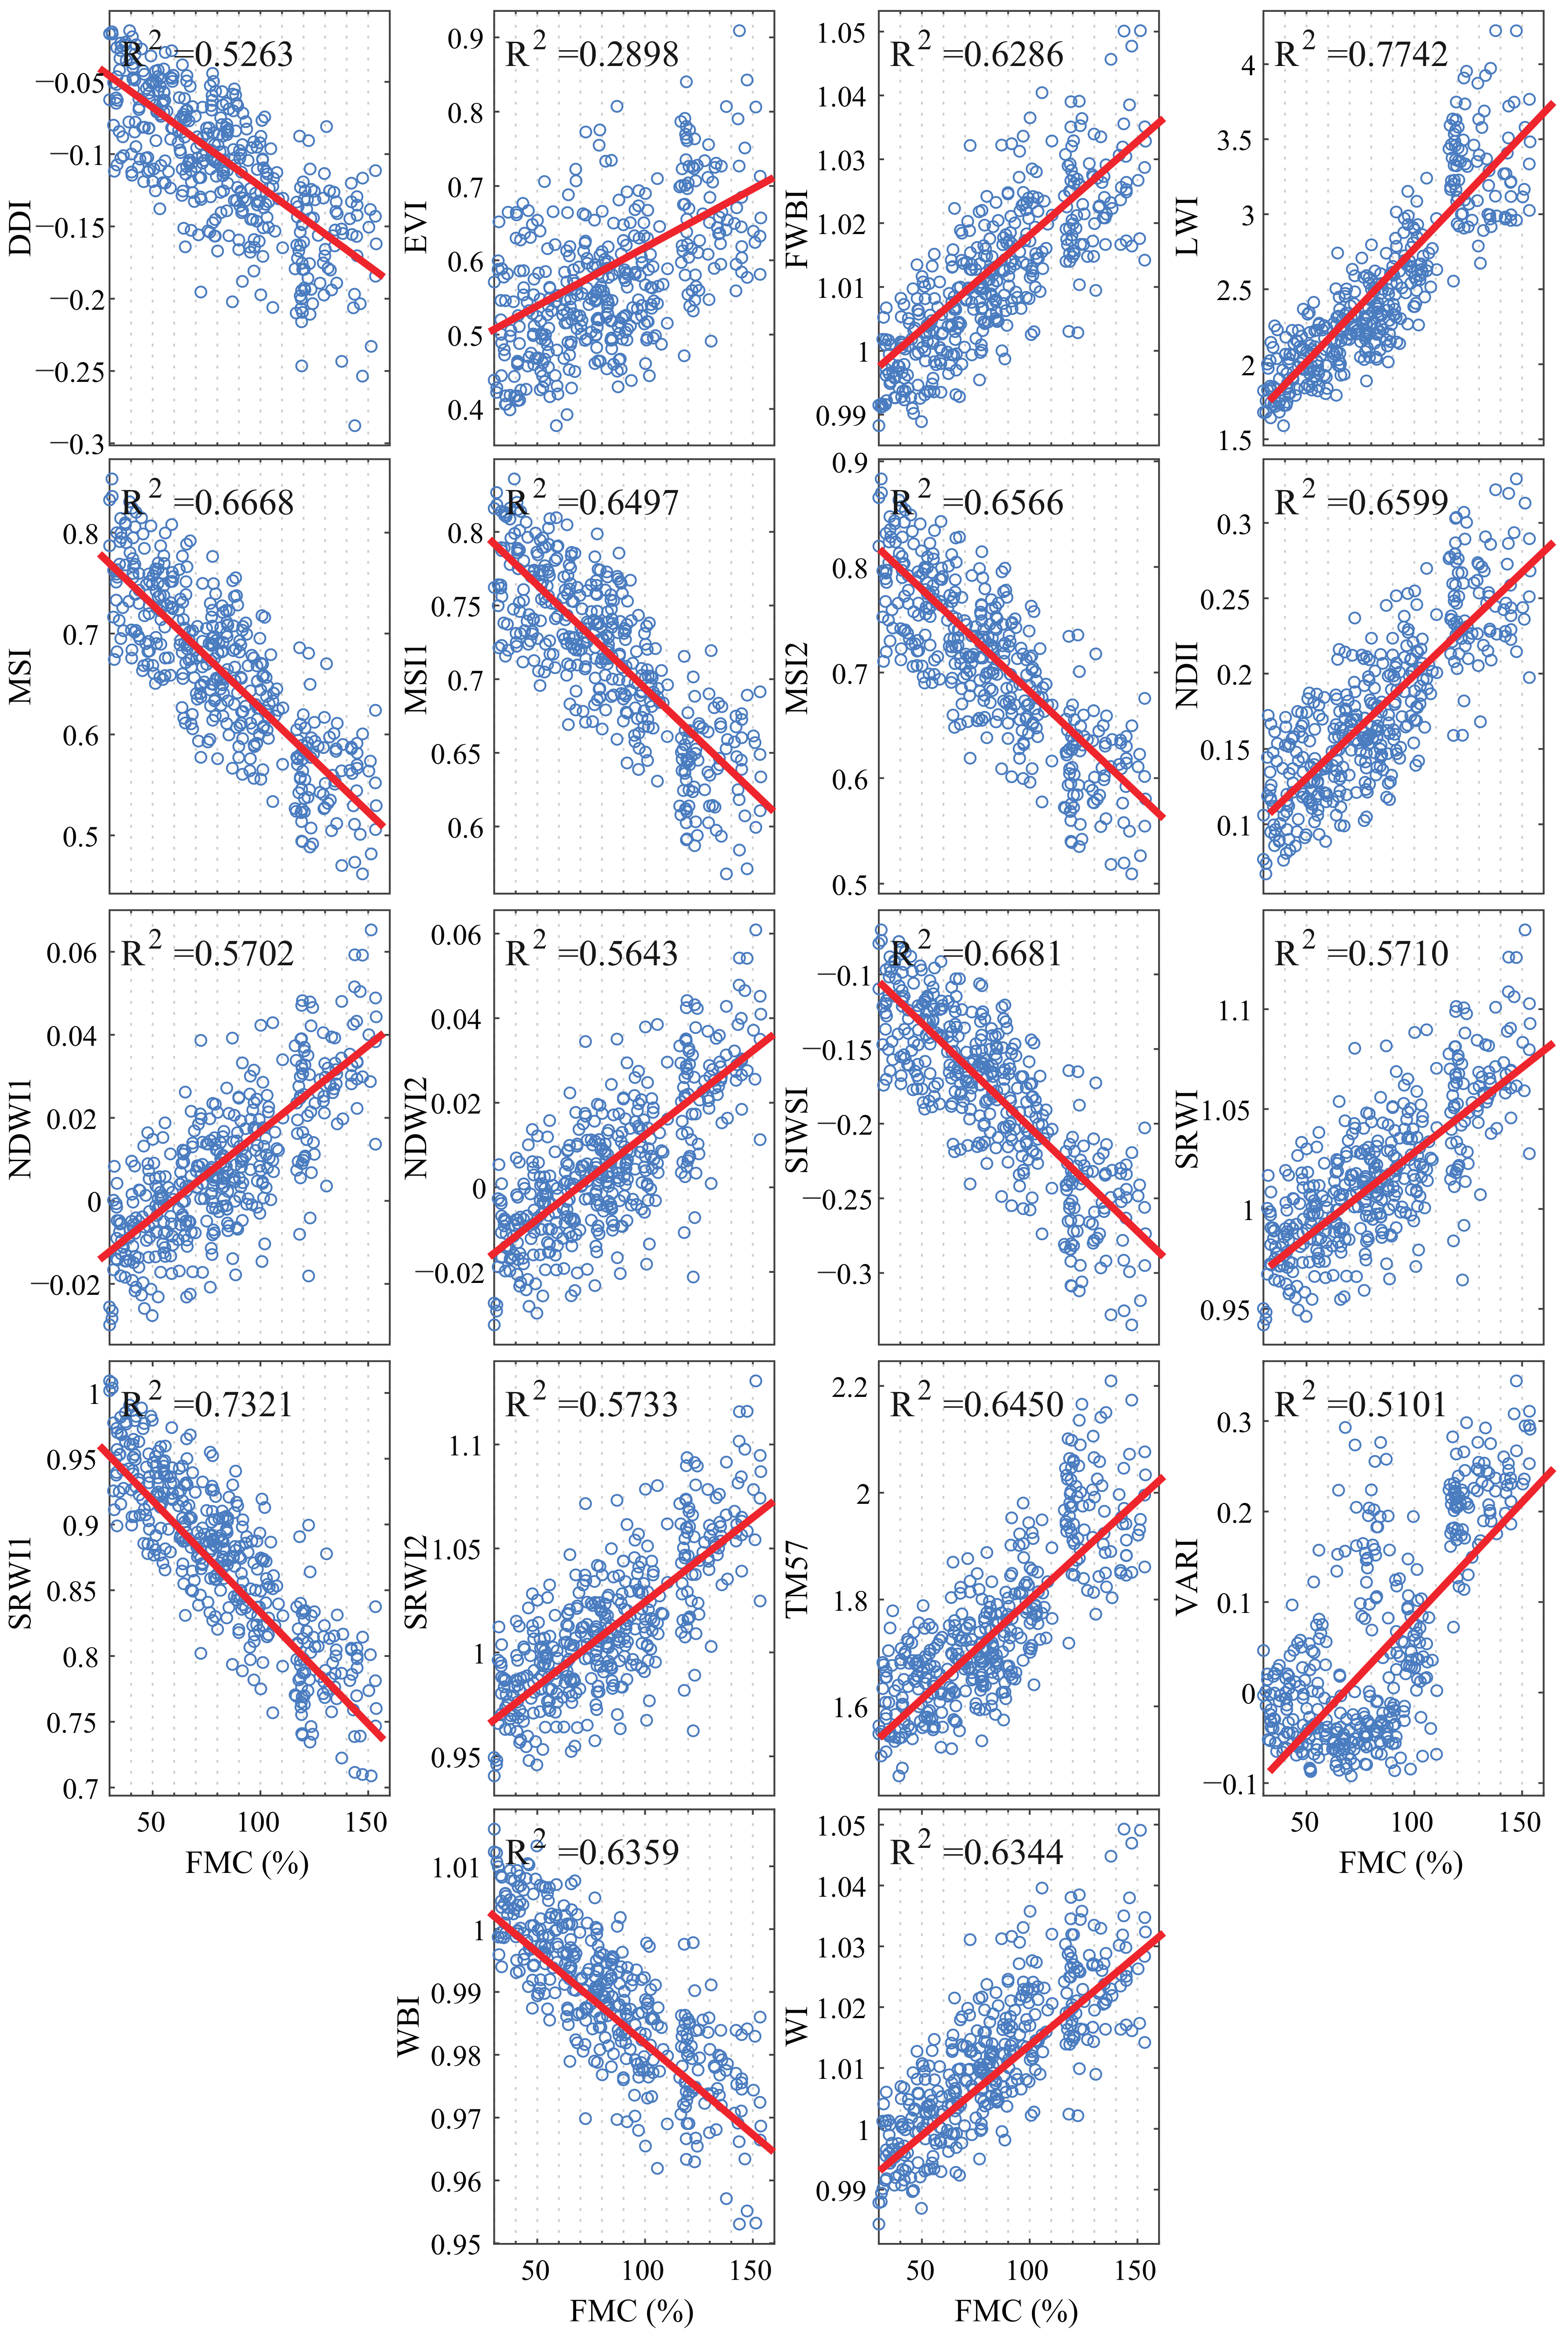
Figure A1. VIs variation as function of Fuel Moisture Content for Pinus radiata.
Plants 10 00697 g0a1
Figure A2. VIs variation as function of Fuel Moisture Content for Eucalyptus globulus.
Plants 10 00697 g0a2

References

  1. Lutz, D.A.; Washington-Allen, R.A.; Shugart, H.H. Remote sensing of boreal forest biophysical and inventory parameters: A review. Can. J. Remote Sens. 2008, 34, S286–S313. [Google Scholar] [CrossRef]
  2. Cârlan, I.; Mihai, B.A.; Nistor, C.; Große-Stoltenberg, A. Identifying urban vegetation stress factors based on open access remote sensing imagery and field observations. Ecol. Inform. 2020, 55, 101032. [Google Scholar] [CrossRef]
  3. Xue, J.; Su, B. Significant remote sensing vegetation indices: A review of developments and applications. J. Sens. 2017, 2017. [Google Scholar] [CrossRef] [Green Version]
  4. Freitas, W.; Gois, G.; Pereira, E.; Oliveira Junior, J.; Magalhães, L.; Brasil, F.; Sobral, B. Influence of fire foci on forest cover in the Atlantic Forest in Rio de Janeiro, Brazil. Ecol. Indic. 2020, 115, 106340. [Google Scholar] [CrossRef]
  5. Pôças, I.; Calera, A.; Campos, I.; Cunha, M. Remote sensing for estimating and mapping single and basal crop coefficientes: A review on spectral vegetation indices approaches. Agric. Water Manag. 2020, 106081. [Google Scholar] [CrossRef]
  6. Le Maire, G.; Francois, C.; Dufrene, E. Towards universal broad leaf chlorophyll indices using PROSPECT simulated database and hyperspectral reflectance measurements. Remote Sens. Environ. 2004, 89, 1–28. [Google Scholar] [CrossRef]
  7. Wang, Q.; Li, P. Hyperspectral indices for estimating leaf biochemical properties in temperate deciduous forests: Comparison of simulated and measured reflectance data sets. Ecol. Indic. 2012, 14, 56–65. [Google Scholar] [CrossRef]
  8. Li, F.; Miao, Y.; Feng, G.; Yuan, F.; Yue, S.; Gao, X.; Chen, X. Improving estimation of summer maize nitrogen status with red edge-based spectral vegetation indices. Field Crop. Res. 2014, 111–123. [Google Scholar] [CrossRef]
  9. Villacrés, J.; Arevalo-Ramirez, T.; Fuentes, A.; Reszka, P.; Cheein, F. Foliar moisture content from the spectral signature for wildfire risk assessments in Valparaíso-Chile. Sensors 2019, 19, 5475. [Google Scholar] [CrossRef] [Green Version]
  10. Arevalo-Ramirez, T.; Villacrés, J.; Fuentes, A.; Reszka, P.; Auat Cheein, F. Moisture content estimation of Pinus radiata and Eucalyptus globulus from reconstructed leaf reflectance in the SWIR region. Biosyst. Eng. 2020, 193, 187–205. [Google Scholar] [CrossRef]
  11. Gao, X.; Huete, A.R.; Ni, W.; Miura, T. Optical—Biophysical relationships of vegetation spectra without background contamination. Remote Sens. Environ. 2000, 74, 609–620. [Google Scholar] [CrossRef]
  12. Strachan, I.B.; Pattey, E.; Boisvert, J.B. Impact of nitrogen and environmental conditions on corn as detected by hyperspectral reflectance. Remote Sens. Environ. 2002, 80, 213–224. [Google Scholar] [CrossRef]
  13. Seelig, H.D.; Hoehn, A.; Stodieck, L.; Klaus, D.; Adams Iii, W.; Emery, W. The assessment of leaf water content using leaf reflectance ratios in the visible, near-, and short-wave-infrared. Int. J. Remote Sens. 2008, 29, 3701–3713. [Google Scholar] [CrossRef]
  14. Hunt Jr, E.R.; Rock, B.N. Detection of changes in leaf water content using near-and middle-infrared reflectances. Remote Sens. Environ. 1989, 30, 43–54. [Google Scholar] [CrossRef]
  15. Rock, B.; Vogelmann, J.; Williams, D.; Vogelmann, A.; Hoshizaki, T. Remote Detection of Forest Damage: Plant responses to stress may have spectral “signatures” that could be used to map, monitor, and measure forest damage. Bioscience 1986, 36, 439–445. [Google Scholar] [CrossRef]
  16. Hardisky, M.; Klemas, V.; Smart, M. The influence of soil salinity, growth form, and leaf moisture on the spectral radiance of. Spartina Alterniflora 1983, 49, 77–83. [Google Scholar]
  17. Gao, B.C. NDWI—A normalized difference water index for remote sensing of vegetation liquid water from space. Remote Sens. Environ. 1996, 58, 257–266. [Google Scholar] [CrossRef]
  18. Rodríguez-Pérez, J.R.; Riaño, D.; Carlisle, E.; Ustin, S.; Smart, D.R. Evaluation of hyperspectral reflectance indexes to detect grapevine water status in vineyards. Am. J. Enol. Vitic. 2007, 58, 302–317. [Google Scholar]
  19. Fensholt, R.; Sandholt, I. Derivation of a shortwave infrared water stress index from MODIS near-and shortwave infrared data in a semiarid environment. Remote Sens. Environ. 2003, 87, 111–121. [Google Scholar] [CrossRef]
  20. Zarco-Tejada, P.J.; Ustin, S. Modeling canopy water content for carbon estimates from MODIS data at land EOS validation sites. In Proceedings of the IGARSS 2001 Scanning the Present and Resolving the Future, IEEE 2001 International Geoscience and Remote Sensing Symposium (Cat. No. 01CH37217), Sydney, Australia, 9–13 July 2001; Volume 1, pp. 342–344. [Google Scholar]
  21. Elvidge, C.D.; Lyon, R.J. Estimation of the vegetation contribution to the 1· 65/2· 22 μm ratio in airborne thematic-mapper imagery of the Virginia Range, Nevada. Int. J. Remote Sens. 1985, 6, 75–88. [Google Scholar] [CrossRef]
  22. Gitelson, A.; Kaufman, Y.; Stark, R.; Rundquist, D. Novel algorithms for remote estimation of vegetation fraction. Remote Sens. Environ. 2002, 80, 76–87. [Google Scholar] [CrossRef] [Green Version]
  23. Peñuelas, J.; Filella, I.; Biel, C.; Serrano, L.; Save, R. The reflectance at the 950–970 nm region as an indicator of plant water status. Int. J. Remote Sens. 1993, 14, 1887–1905. [Google Scholar] [CrossRef]
  24. Peñuelas, J.; Pinol, J.; Ogaya, R.; Filella, I. Estimation of plant water concentration by the reflectance water index WI (R900/R970). Int. J. Remote Sens. 1997, 18, 2869–2875. [Google Scholar] [CrossRef]
  25. Dube, A.C.O.M.T. Remote sensing leaf water stress in coffee (Coffea arabica) using secondary effects of water absorption and random forests. Phys. Chem. Earth Parts A/B/C 2017, 317–324. [Google Scholar] [CrossRef]
  26. Huang, S.; Tang, L.; Hupy, J.P.; Wang, Y.; Shao, G. A commentary review on the use of normalized difference vegetation index (NDVI) in the era of popular remote sensing. J. For. Res. 2021, 32, 1–6. [Google Scholar] [CrossRef]
  27. Aparicio, N.; Villegas, D.; Casadesus, J.; Araus, J.; Royo, C. Spectral vegetation indices as nondestructive tools for determining durum wheat yield. Agron. J. 2000, 92, 83–91. [Google Scholar] [CrossRef]
  28. Gitelson, A.; Merzlyak, M.; Chivkunova, O. Optical properties and nondestructive estimation of anthocyanin content in plant leaves. Photochem. Photobiol. 2001, 74, 38–45. [Google Scholar] [CrossRef]
  29. Zarco-Tejada, P.; González-Dugo, V.; Berni, J. Fluorescence, temperature and narrow-band indices acquired from a UAV platform for water stress detection using a micro-hyperspectral imager and a thermal camera. Remote Sens. Environ. 2012, 117, 322–337. [Google Scholar] [CrossRef]
  30. Tucker, C. Red and photographic infrared linear combinations for monitoring vegetation. Remote Sens. Environ. 1979, 8, 127–150. [Google Scholar] [CrossRef] [Green Version]
  31. Stimson, H.; Breshears, D.; Ustin, S.; Kefauver, S. Spectral sensing of foliar water conditions in two co-occurring conifer species: Pinus edulis and Juniperus monosperma. Remote Sens. Environ. 2005, 96, 108–118. [Google Scholar] [CrossRef]
  32. Meo, M. Physiological responses of eucalyptus nitens × nitens under experimentally imposed water stress. South. For. 2010, 72, 63–68. [Google Scholar] [CrossRef]
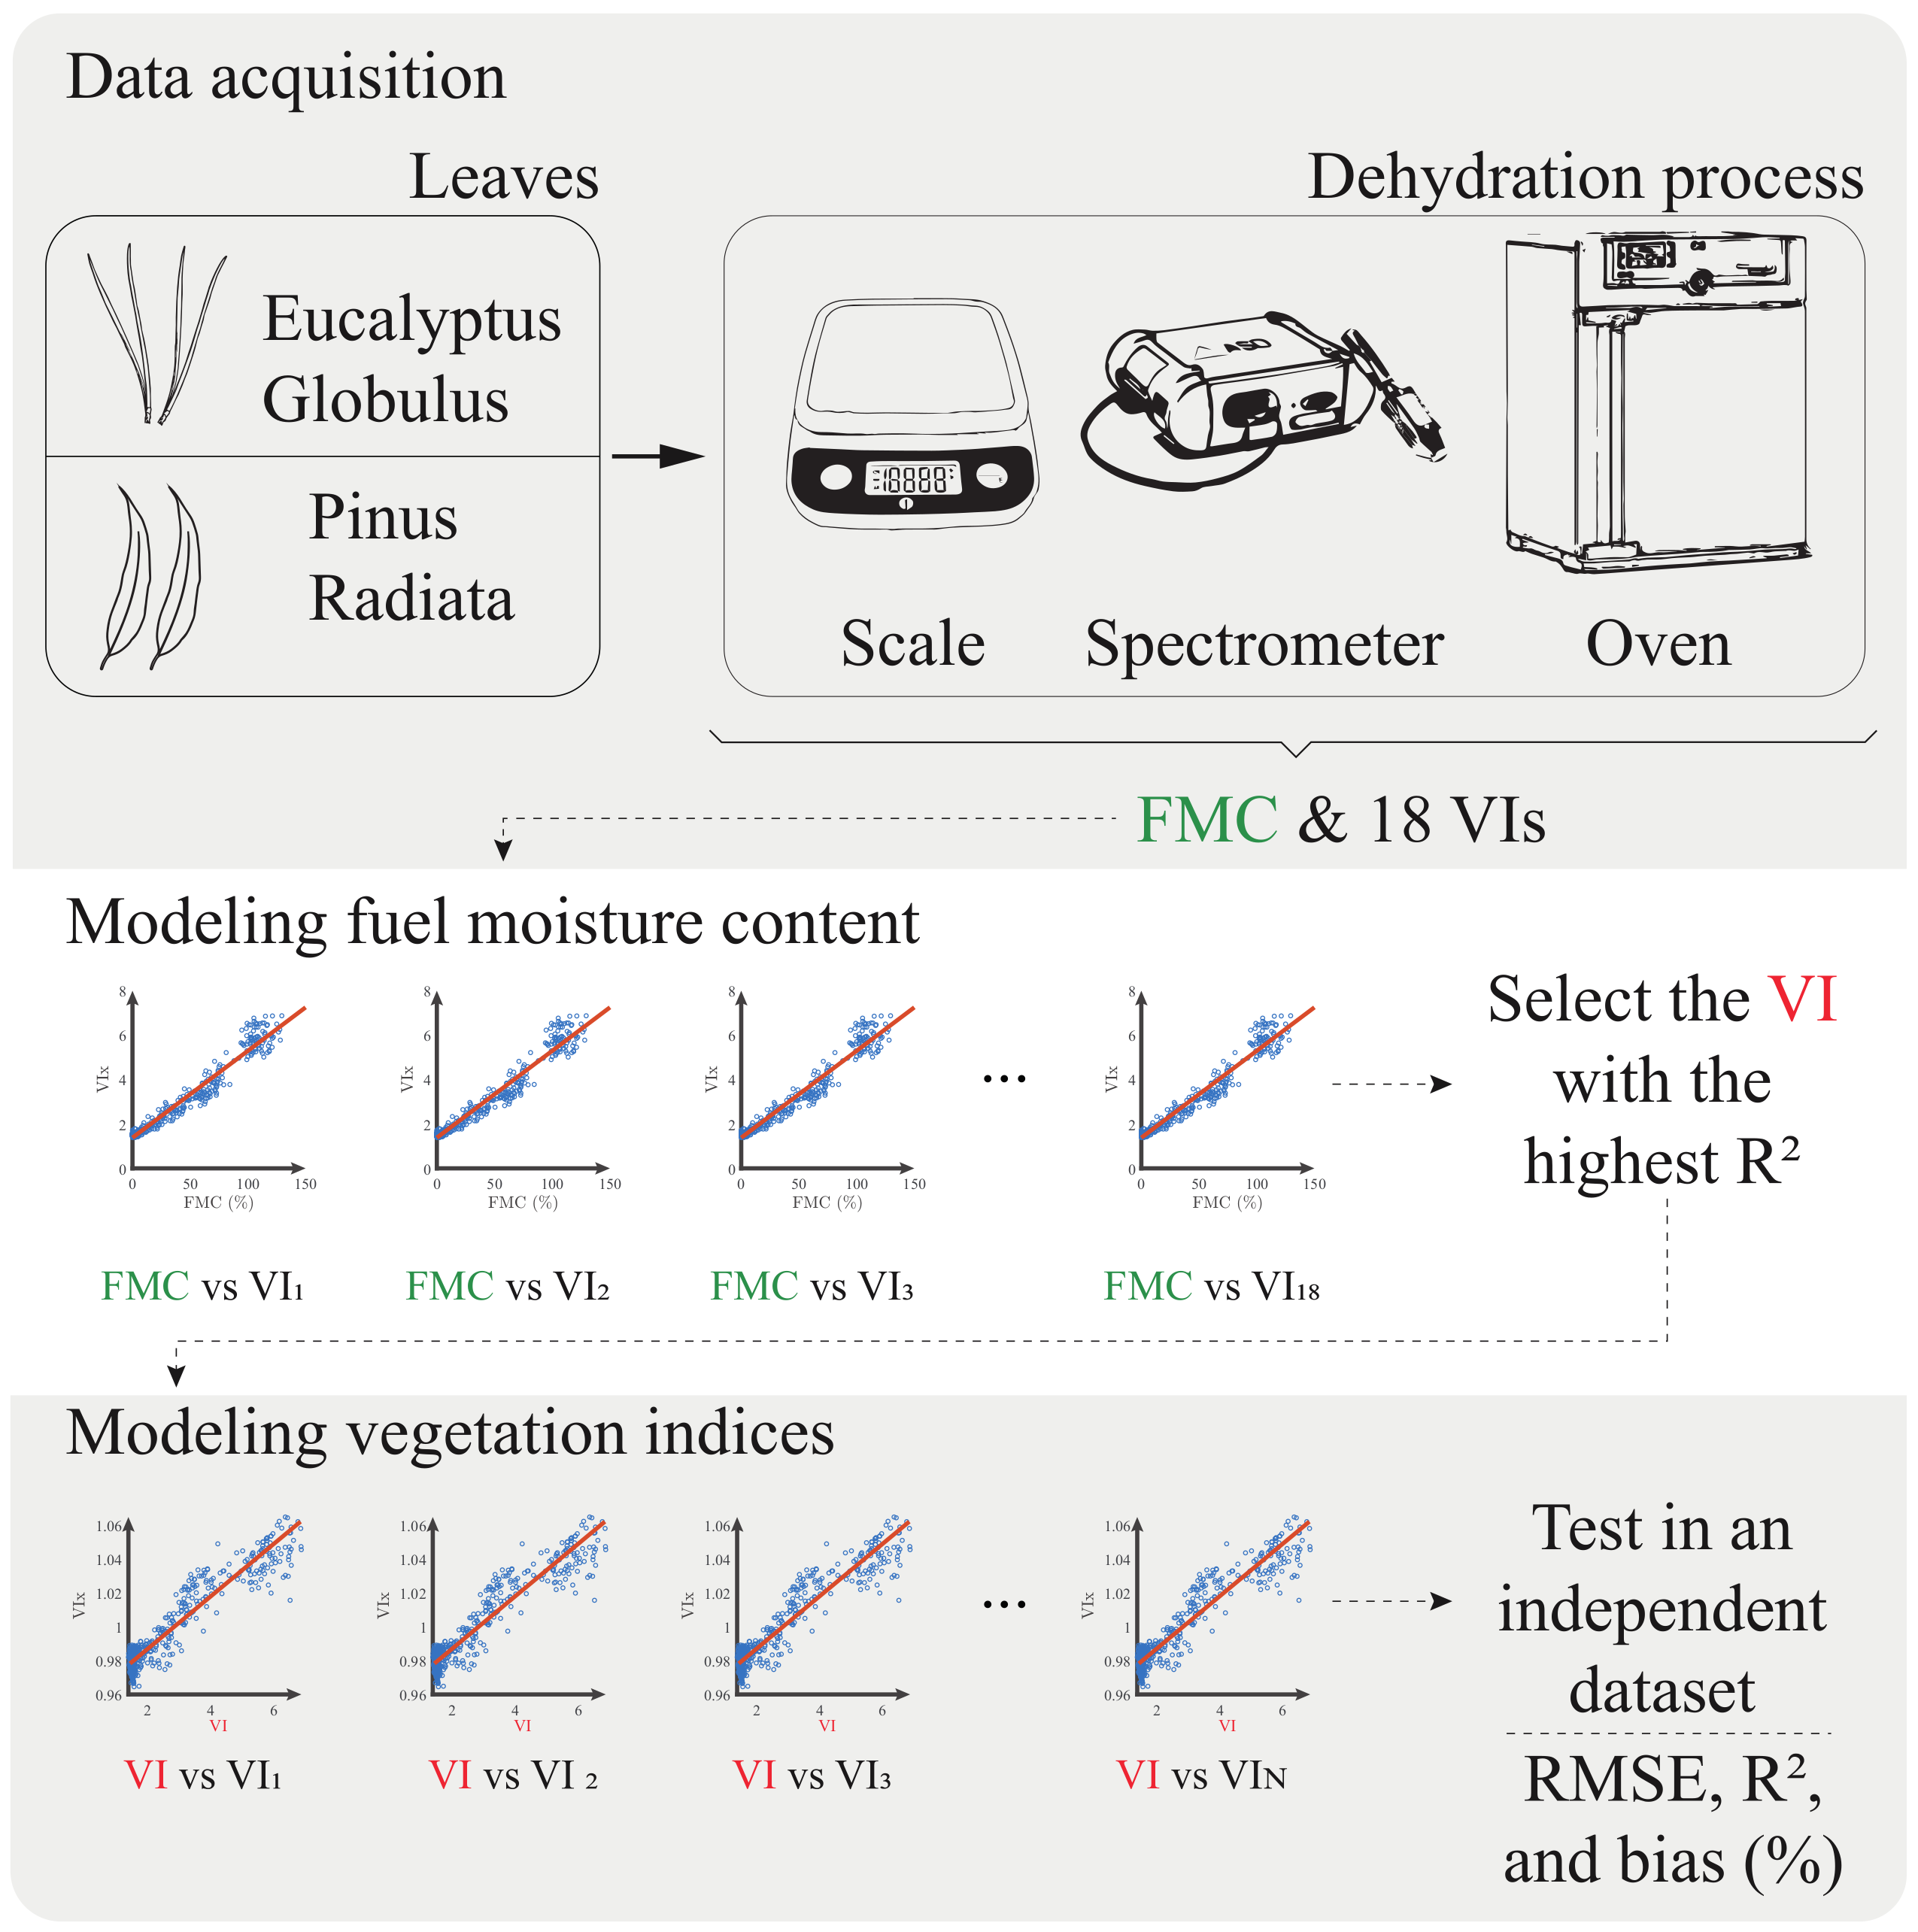
Figure 1. General scheme of the measurement and modeling process of the vegetation indices.
Plants 10 00697 g001
Figure 2. Set of samples used for fitting and validating the models. In black line the average reflectance spectra and in grey the reflectance of the individual samples. Where: (a) Pinus radiata and (b) Eucalyptus globulus.
Plants 10 00697 g002
Figure 3. Evaluation of model performance for retrieval of vegetation indices. Where: (a) Pinus radiata and (b) Eucalyptus globulus.
Plants 10 00697 g003
Table 1. Technical characteristics of the instruments.
InstrumentSpecifications
SpectrometerModelTerraspec 4 Hi-Res
ManufacturerASD
Range350–2500 nm
Spectral resolution3 nm at 700 nm, 6 nm at 1400 nm
ScaleModelPFB 120-3
ManufacturerKERN
Max. weighing120 g
Reproducibility0.001 g
OvenModelUN30
ManufacturerMemmert
Range20 ° C to 30 ° C
Temperature accuracyup to 99.9 ° C: 0.1
Table 2. Vegetation indices used in the estimation of moisture content, including their acronym, name, formulation and source.
AcronymVegetation IndexFormulationSource
DDIDouble Difference Index 2 R 1530 R 1005 R 2055 [6,7]
EVIEnhanced Vegetation Index 2.5 R n i r R r e d / R n i r + 6 R r e d 7.5 R b l u e + 1 [11]
fWBIFloating-position Water Band Index R 900 / min R 930 R 980 [12]
LWILeaf Water Index R 1300 / R 1450 [13]
MSIMoisture Stress Index R 1600 / R 820 [14]
MSI1Moisture Stress Index 1 R 1650 / R 1230 [15]
MSI2Moisture Stress Index 2 R 1650 / R 830 [15]
NDIINormalized Difference Infrared Index R 850 R 1650 / R 850 + R 1650 [16]
NDWI1Normalized Difference Water Index 1 R 860 R 1240 / R 860 + R 1240 [17]
NDWI2Normalized Difference Water Index 2 R 870 R 1260 / R 870 + R 1260 [18]
SIWSIShortwave Infrared Water Stress R 1640 R 858 / R 1640 + R 858 [19]
SRWISimple Ratio Water Index R 860 / R 1240 [20]
SRWI1Simple Ratio Water Index 1 R 1350 / R 870 [18]
SRWI2Simple Ratio Water Index 2 R 880 / R 1265 [18]
TM57Ratio of Thematic Mapper Band 5 to Band 7 R 1650 / R 2220 [21]
VARIVisible Atmospheric Resistant Index R g r e e n R r e d / R g r e e n + R r e d R b l u e [22]
WBIWater Band Index R 970 / R 900 [23]
WIWater Index R 900 / R 970 [24]
Table 3. Vegetation indices non-related to the estimation of moisture content, including their acronym, name, formulation and source.
AcronymVegetation IndexFormulationSource
NRINitrogen reflectance index R 570 R 670 / R 570 + R 670 [27]
ARIAnthocyanin reflectance index 1 / R 550 1 / R 700 [28]
CICarotenoid Index R 520 / R 500 [29]
NDVINormalized Difference Vegetation Index R n i r R r e d / R n i r + R r e d [30]
Table 4. Coefficient of determination for the FMC vs VI models using the fitting set.
Vegetation IndexP. radiataE. globulus
DDI0.52630.7379
EVI0.28980.2061
fWBI0.62860.6567
LWI0.77420.8699
MSI0.66680.7892
MSI10.64970.7637
MSI20.65660.7559
NDII0.65990.7600
NDWI10.57020.6062
NDWI20.56430.6042
SIWSI0.66810.7696
SRWI0.57100.6068
SRWI10.73210.7818
SRWI20.57330.6146
TM570.64500.7497
VARI0.51010.1525
WBI0.63590.6606
WI0.63440.6616
Table 5. Evaluation of Leaf Water Index (LWI) to retrieve non-water content related vegetation indices (VIs).
Pinus radiataEucalyptus globulus
RMSE R 2 Bias (%)RMSE R 2 Bias (%)
NRI0.03380.9243−75.97490.05880.7870−9.9942
ARI0.00730.7735−0.61430.02010.74751.0940
CI0.08980.889810.23680.05300.7908−0.6564
NDVI0.04640.95075.43690.03640.92444.5324
Publisher’s Note: MDPI stays neutral with regard to jurisdictional claims in published maps and institutional affiliations.