Abstract
Global warming has two dangerous global consequences for agriculture: drought, due to water scarcity, and salinization, due to the prolonged use of water containing high concentrations of salts. Since the global climate is projected to continue to change over this century and beyond, choosing salt-tolerant plants could represent a potential paramount last resort for exploiting the secondary saline soils. Olive is considered moderately resistant to soil salinity as compared to other fruit trees, and in the present study, we investigated the influence of NaCl solutions (ranging from 0 to 200 mM) in a salt-tolerant (cv Canino) and two of its transgenic lines (Canino AT17-1 and Canino AT17-2), overexpressing tobacco osmotin gene, and in a salt-sensitive (Sirole) olive cultivar. After four weeks, most of the shoots of both Canino and Sirole plants showed stunted growth and ultimate leaf drop by exposure to salt-enriched media, contrary to transgenic lines, that did not show injuries and exhibited a normal growth rate. Malondialdehyde (MDA) content was also measured as an indicator of the lipid peroxidation level. To evaluate the role of the S assimilatory pathway in alleviating the adverse effects of salt stress, thiols levels as well as extractable activities of ATP sulfurylase (ATPS) and O-acetyl serine(thiol)lyase (OASTL), the first and the last enzyme of the S assimilation pathway, respectively, have been estimated. The results have clearly depicted that both transgenic lines overexpressing osmotin gene coped with increasing levels of NaCl by the induction of S metabolism, and particularly increase in OASTL activity closely paralleled changes of NaCl concentration. Linear correlation between salt stress and OASTL activity provides evidence that the S assimilation pathway plays a key role in adaptive response of olive plants under salt stress conditions.
1. Introduction
Global warming has two dangerous global consequences for agriculture: drought, due to water scarcity, and salinization, due to the prolonged use of water containing high concentrations of salts. Thus, it is important to identify plants that can cope with drought and salt stress to increase crop resilience under different climatic changes. Olive (Olea europaea L.) tree belonging to family Oleaceae, is one of the most popular species of the genus Olea which is used for food purpose [1,2]. Olive is widely grown all over the world, with a great potential for expansion because of its ability to cope with unfavorable conditions [3,4,5]. However, most of the olive production (about 98%) comes from the Mediterranean basin [1]. Therefore, climate change will have a strong impact on olive cultivation as this area is warming up to 20% faster than the rest of the world average.
Olive is known as a glycophytic species presenting medium tolerance to salts [6] with marked differences among cultivars [7,8,9]. One of the major effects of salt stress is oxidative stress, resulting in increased levels of reactive oxygen species (ROS) [10]. ROS have the potential to interfere with many cellular components, causing cell membrane and other cellular structures damage, metabolic disorders, inhibited photosynthesis, and impaired nutrient uptake [11]. To face increased ROS production, plants have developed defensive strategies, including enzymatic and non-enzymatic antioxidant systems. Thiol compounds, and in particular glutathione (GSH) [12], act as antioxidants that protect plants against the damaging effects of increased ROS levels under salt stress conditions [13]. Furthermore, plant responses to salinity include the synthesis of harmonious osmolytes, and stimulation of phytohormones production [14]. The molecular mechanism involves the overexpression of particular genes triggering different stress-related proteins and play a pivotal role in stress adaptation mechanisms [15].
Among the several stress-related proteins, osmotin is known to be induced in response to both biotic and abiotic stresses in plants [16]. Osmotin is a cationic protein belonging to the PR5 family proteins [17,18]. It has been suggested that osmotin confers the tolerance to salinity stress by increasing the accumulation of osmolytes, such as proline and glycine betaine [15,17,19,20].
The main objective of this study was to understand whether osmotin is involved or not, to show resistance against salt stress in olive shoots. This goal was achieved by using a salt-tolerant (cv Canino), with two of its transgenic lines (Canino AT17-1 and Canino AT17-2), overexpressing tobacco osmotin gene, and a salt-sensitive (cv Sirole) olive cultivar, exposed to NaCl solutions (ranging from 0 to 200 mM). We investigated whether the mechanisms of proline accumulation and lipid peroxidation (as an estimate of oxidative damage) were affected by the presence of the osmotin gene.
Furthermore, as GSH plays an active role in the process of response to salinity, we tested the hypothesis that a close relationship might exist between salt tolerance and sulfur (S) assimilation rate. Thus, changes in thiols levels as well as in extractable activities of ATP sulfurylase (ATPS) and O-acetyl serine(thiol)lyase (OASTL), the first and the last enzyme of the S assimilation pathway, respectively, have been estimated in plants exposed to salt stress.
2. Results
2.1. Effect of NaCl on In Vitro Shoot Growth Performance
Statistical analysis showed significant interaction between relative growth rate at different concentrations of NaCl for both wt genotypes (Canino and Sirole) and transgenic lines (Canino AT17-1 and Canino AT17-2). Positive interaction between each genotype and treatment with 50 mM NaCl has been observed, as showed in Table 1.

Table 1.
Relative growth rate, node number, shoot number, shoot length (cm), and mean internode length (cm) of olive cv Canino, Sirole, and the transgenic lines Canino AT17-1 and Canino AT17-2 under different concentration of NaCl. Data are represented as mean ± SD. Different letters within the same columns indicating significant differences according to Fisher’s test (p < 0.01). Significant effect: * p ≤ 0.05; ** p ≤ 0.01; *** p ≤ 0.001; - not significant.
The in vitro shoot growth was significantly influenced by NaCl concentration in the growing media (Figure 1). The highest relative growth rate (RGR) has been observed in Canino shoots in medium enriched with 50 mM NaCl, followed by Sirole at the same salt concentration. However, both cultivars showed a significantly reduced RGR at higher NaCl concentrations (100 and 200 mM), compared to the transgenic lines, Canino AT17-1 and Canino AT17-2, which showed a RGR of 3.92 and 3.72 at 100 mM NaCl, and 2.55 and 1.77 at 200 mM NaCl, respectively (Table 1).
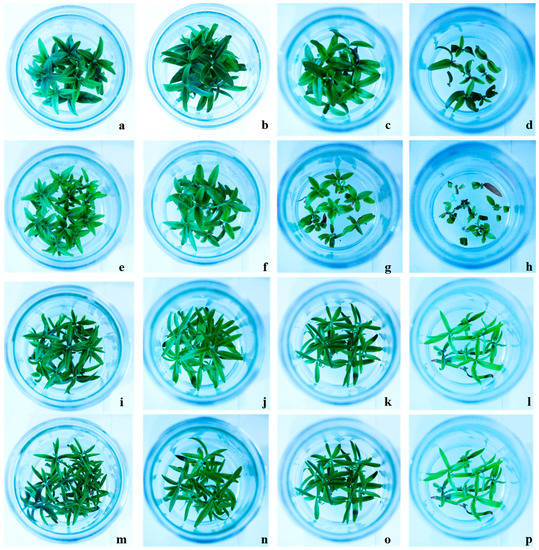
Figure 1.
Effect of different concentrations of NaCl on different olive cultivars Canino (a–d) at 0, 50, 100, and 200 mM NaCl, respectively, Sirole (e–h) at 0, 50, 100, and 200 mM NaCl, respectively, along with two transgenic Canino AT17-1 (i–l) at 0, 50, 100, and 200 mM NaCl, respectively and Canino AT17-2 (m–p) at 0, 50, 100, and 200 mM NaCl, respectively.
The McKinney index (MKI) and tolerance index (TI) were also calculated to evaluate the level of shoot chlorosis and necrosis resulting from NaCl treatment. Our results showed that MKI was positively correlated with increasing NaCl concentrations. However, values of MKI were higher in Canino and Sirole shoots, as compared to Canino AT17-1 and Canino AT17-2 transgenic lines (Table 2).
Table 2.
Olive plantlets of cv Canino and Sirole, and transgenic genotypes Canino AT17-1 and Canino AT17-2 maintained in NaCl-enriched media: (a) McKinney index (MKI) and (b) tolerance index (TI).
Contrarily, the exposure of shoots to increasing NaCl concentrations resulted in values for TI of 4.7, 16.5, and 23.4% for Canino, and 9.1, 18.2, and 20.5% for Sirole, at 50, 100, and 200 mM, respectively (Table 2). Interestingly, both transgenic lines (Canino AT17-1 and Canino AT17-2) responded better to exogenous NaCl treatments, showing values for TI of 28.8, 46.4, and 47.9% and 14.3, 25.9, and 32.30%, at 50, 100, and 200 mM NaCl, respectively.
2.2. Effect of Different Levels of NaCl on Photosynthetic Pigments
After four weeks of exposure to salt stress, all genotypes showed typical toxicity symptoms, such as decreased chlorophyll content. Total chlorophyll concentration of Canino shoots slowly decreased with increasing NaCl concentration (7, 22, and 30%, at 50, 100, and 200 mM, respectively). While on the other hand, Sirole and both transgenic lines exhibited relatively worse response to salt stress, resulting in more rapid and greater reduction of total chlorophyll concentration. The highest NaCl concentration (200 mM) resulted in 40, 57, and 48% lower chlorophyll content in Sirole, Canino AT17-1 and Canino AT17-2, respectively (Figure 2a–c).
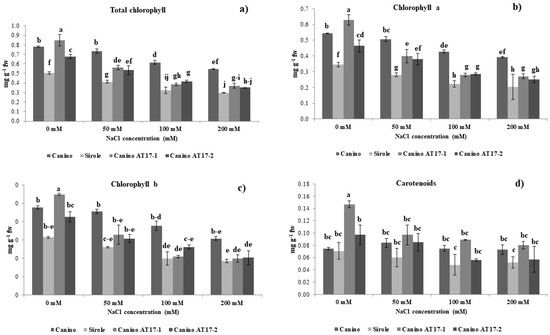
Figure 2.
(a) Total chlorophyll content, (b) chlorophyll a, (c) chlorophyll b, and (d) carotenoids of olive cv Canino, Sirole, and the transgenic lines Canino AT17-1 and Canino AT17-2 under different concentration of NaCl. Data are means ± SD of four independent replications run in triplicate. Significant differences between samples are indicated by different letters according to Fisher’s test (p < 0.01).
Carotenoid concentration was approximately the same in both Canino and Sirole shoots in control condition (0 mM NaCl), whereas both transgenic lines showed higher carotenoid content. In particular, Canino AT17-1 showed an almost twofold increase from that of Canino wt, whereas in Canino AT17-2, it increased by a lesser extent (30% with respect to Canino wt). Furthermore, Canino wt maintained approximately the same carotenoid concentration irrespective of the NaCl in the growth medium, in Sirole and in both transgenic lines, it significantly declined with increasing NaCl concentration. However, when the growth medium was supplemented with 200 mM NaCl, the highest values for carotenoid concentration were found in Canino AT17-1, showing values similar to Canino wt, followed by Canino AT17-2 (Figure 2d).
2.3. Effect of Different Levels of NaCl on Malondialdehyde (MDA) Content
Oxidative stress due to the presence of NaCl in the growth medium often results in lipid peroxidation which is generally evaluated by enhanced MDA content. However, our results showed that salt exposure did not increase shoot MDA levels of both wt and transgenic lines irrespective of NaCl concentrations (Figure 3a). On the other hand, it is interesting to note that the transgenic line AT17-1 showed higher MDA concentration (+30%) as compared to Canino wt under control conditions (0 mM NaCl).
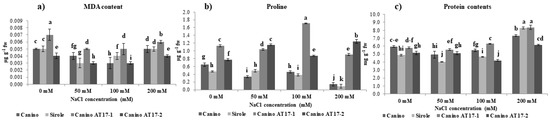
Figure 3.
(a) Malondialdehyde, (b) proline content and (c) protein content of olive cv Canino, Sirole, and the transgenic lines Canino AT17-1 and Canino AT17-2 under different concentration of NaCl. Statistics as in Figure 2.
2.4. Effect of Different Levels of NaCl on Proline Accumulation
The proline accumulation in the salt-tolerant cv Canino was significantly higher (36%) as compared to the salt-sensitive one (cv Sirole), but the same metabolite accumulated in even greater extent in the shoots of Canino AT17-1 and Canino AT17-2 (+75 and +20% compared to Canino wt in the control condition, respectively). In addition, both Canino and Sirole shoots were severely affected by 200 mM NaCl treatment and showed a significative decrease of proline concentration (78 and 82%, respectively) (Figure 3b). whereas, both transgenic lines, resulted a consistent accumulation of proline in shoots when exposed to increasing NaCl concentrations. It is noteworthy that the increase of proline accumulation due to highest salt treatment (200 mM) in both Canino AT17-1 and Canino AT17-2 reached levels almost 7- and 9-fold higher, respectively, as compared to those found in Canino wt in the same condition (Figure 3b).
2.5. Effect of Different Levels of NaCl on Protein Contents
Data indicated that imposed NaCl stress was closely related to shoot protein concentration as showed in Figure 3c. There was a lower accumulation of protein in shoots of all genotypes as well under control conditions (without NaCl). Furthermore, a significant increase in protein accumulation was observed in all tested shoots of both wt and transgenic lines but no significant differences were observed between wt cultivars and transgenic lines overexpressing osmotin gene at higher concentrations of NaCl (200 mM).
2.6. Effect of Different Levels of NaCl on Non-Protein Thiol Contents
It is well known that thiol compounds, and GSH particularly, act as antioxidants to counteract oxidative stress induced by NaCl toxicity [21]. Our results show that non-protein thiols production and NaCl concentration in the growth medium significantly correlated in all four studied genotypes (Canino r2 = 0.8762; Sirole r2 = 0.8193; Canino AT17-1 r2 = 0.6807; Canino AT17-2 r2 = 0.8259), even if at different extent) (Figure 4a). As evidenced by the slope of the increase of thiols accumulation with increasing salt concentration, this response showed the following trend: Sirole > Canino > Canino AT17-1 = Canino At17-2) (Figure 4a).
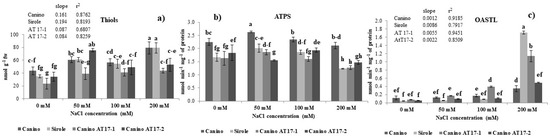
Figure 4.
(a) Thiols content, (b) ATP sulfurylase (ATPS) and (c) O-acetyl serine(thiol)lyase (OASTL)activities of olive cv Canino, Sirole, and the transgenic lines Canino AT17-1 and Canino AT17-2 under different concentration of NaCl. Statistics as in Figure 2.
2.7. Effect of Different Levels of NaCl on ATPS and OASTL Activities
In order to evaluate if changes in thiols level required an adjustment in plant S assimilation rate, the changes in ATPS and OASTL activity, the first and last enzyme of the sulfur assimilation pathway, respectively, were measured (Figure 4b,c). A slight induction of ATPS activity was observed in response to the lowest NaCl concentration (50 mM) in Canino and Sirole cultivars, and in transgenic line Canino AT17-1, but the increase ranged between 15 and 20% (Figure 4b). On the other hand, the same stress condition resulted in slightly decreased ATPS activity (−15%) in Canino AT17-2 (Figure 4b). No significant differences were observed in ATPS activity at 100 mM NaCl, relative to controls, in all four genotypes and, finally, when plants were treated with the highest salt concentration (200 mM) ATPS activity levels significantly decreased compared to control (decrease ranged from 25 to 30%), except for Canino which maintained approximately the same activity as in the control condition (Figure 4b).
As for thiols, OASTL activity was positively correlated with salt concentration in the growth medium (Figure 4c) and, indeed, the correlation was very high in all four studied genotypes (Canino r2 = 0.9185; Sirole r2 = 0.7917; Canino AT17-1 r2 = 0.9451; Canino AT17-2 r2 = 0.8509) (Figure 4c). However, distinct differences among genotypes were observed and, as evidenced by the slope of the increase of OASTL activity with increasing salt concentration, the induction showed the following trend: Sirole > Canino AT17-1 > Canino At17-2 > Canino) (Figure 4c).
2.8. Principal Component Analysis (PCA)
To test the sampling adequacy for the data set to multivariate statistical analysis (such as PCA) the Kaiser–Meyer–Olkin (KMO) measure has been used for the overall data set and for each individual variable. KMO statistic varies between 0 and 1, Hair et al. [22] recommends accepting values of 0.5 or more, appropriate as regards to minimum threshold for robustness of factor structure. Findings (KMO = 0.509) stressed the need for a data reduction, to avoid redundancy due to high correlation from variables as also showed by Bartlett’s test. Variables selected showed individual KMO greater than 0.5—not including TI, Ch ToT, carotenoids, ATPS. The KMO and Bartlett’s test performed for the new dataset justified the multivariate analysis (PCA) (Table 3). Pearson’s correlation matrix (Table 4) was detected and significant correlations displayed in bold.
Table 3.
Kaiser–Meyer–Olkin (KMO) and Bartlett’s test for reduced data.
Table 4.
Pearson’s correlation matrix. Significant correlation at the 0.05 levels were shown in bold.
Principal component analysis (PCA) was carried out using the selection of factors loading and scores showed in Figure 5a and dendrogram of cluster analysis in Figure 5b. In Table 5, the set of the eigenvalues of PCA was reported, with the amount of inertia explained by each corresponding axis (F), and the cumulate inertia. Two principal axes (F1 and F2) were selected, which explained about 71% of the total variation (measured by the inertia), yet 60% is the minimum cumulate quality of representation of all the variables. The contribution of variables to the first principal axis (F1) (also shown on the principal plane spanned by F1 and F2 in Figure 5 is due mostly to the RGR, node and shoot number, internode length, MKI, protein, and OASTL contents. The second principal axis (F2) mainly contributes Chl a and b content and MDA.
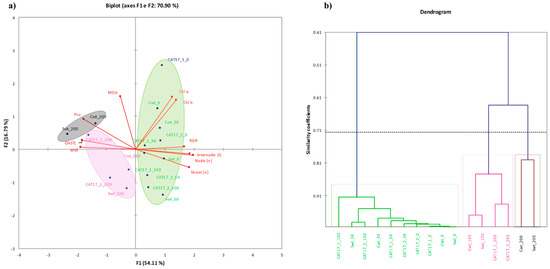
Figure 5.
PCA representation of the factors levels on the plane spanned by the principal axes F1 and F2 (a) and dendrogram of cluster analysis (b). Legend: Swt-0—Sirole wt 0mM NaCl, Swt-50—Sirole wt 50 mM NaCl, Swt-100—Sirole wt 100 mM NaCl, Swt-200—Sirole wt 200 mM NaCl; Cwt-0—Canino wt 0 mM NaCl, Cwt-50—Canino wt 50 mM NaCl, Cwt-100—Canino wt 100 mM NaCl, Cwt-200—Canino wt 200 mM NaCl; CAT17-2-0—Canino AT17-2 0 mM NaCl, CAT17-2-50—Canino AT17-2 50 mM NaCl, CAT17-1-100—Canino AT17-1 100 mM NaCl, CAT17-1-200—Canino AT17-1-200 mM NaC; CAT17-2-0—Canino AT17-2-0 mM NaCl, CAT17-2-50—Canino AT17-2-50 mM NaCl, CAT17-2-100—Canino AT17-2-100 mM NaCl, CAT17-2-200—Canino AT17-2-200 mM NaCl.
Table 5.
PCA: eigenvalues, explained and cumulate inertia.
3. Discussion
Owing to their sessile lifestyle, plants are continuously challenged with a broad range of environmental stresses, among which salinity stress is recognized as one of the most negatively impacting stress on plant growth and crop yield [23]. Plant response to stress commonly rely on expression of specific genes and synthesis of a large number of stress-related proteins, which plays a crucial role in stress adaptation [24]. Thus, the expression of genes involved in signaling and regulatory pathways could represent one of the most promising approach for improving stress tolerance in plants. In the past two decades, overexpression of osmotin gene in tobacco [18,25], tomato [26], strawberry [20,27], and chili pepper [24] have been reported to enhance tolerance under NaCl-mediated salinity stress.
Olive (Olea europaea L.) is a typical crop of the Mediterranean basin, where soil salinization is projected to worsen because of global climate change. In this study, the contribution of osmotin has been investigated in olive in response to salinity by using four different olive genotypes: a salt-tolerant (cv Canino) with its two transgenic lines (Canino AT17-1 and Canino AT17-2), overexpressing tobacco osmotin gene, and a salt-sensitive (cv Sirole). Since one of the major effects of salt stress is oxidative stress, resulting in increased levels of reactive oxygen species (ROS) [10], and being GSH actively involved as antioxidant in the process of response to salinity, we also tested the hypothesis that a close relationship might exist between salt tolerance and S assimilation rate.
The evaluation of olive resistance to salinity stress in terms of the McKinney index (MKI) and tolerance index (TI), indicating the level of shoot chlorosis and necrosis, respectively, we demonstrated that the lower effects of salt-induced stress were observed in both transgenic lines (Table 2). Zero MKI values, corresponding to green leaves and stems, were observed in all tested genotypes grown in control condition (0 mM NaCl) until the end of the experiment. Both Canino and Sirole showed significantly increased chlorosis, with increasing salt concentration in the growth medium, while the transgenic lines showed normal growth even at highest salt stress level (Figure 1). This is a clear indication that both transgenic lines responded better to exogenous NaCl treatments, showing lower MKI values as well as higher TI values, than Canino and Sirole (Table 2). These findings are consistent with previous study showing that Myrtus communis L. plants exposed to 150 and 250 mM NaCl showed high chlorosis levels, with highest MKI values found in shoots exposed to 250 mM NaCl for 30 days [28].
Nevertheless, this effect seemed not to be directly linked to total chlorophyll content. In fact, in our experimental conditions, we observed that the treatment with NaCl was more negatively impacting on Sirole and both transgenic lines, which showed a higher rate of chlorophyll loss from shoots, as compared to Canino (Figure 2). In fact, in this latter case concentration of chlorophyll remained relatively stable from 0 to 50 mM NaCl, to later decrease further increasing NaCl concentration (Figure 2). Salinity effect on chlorophyll content is often ambiguous. For instance, it has been recently demonstrated that salt stress increased photosynthetic pigments in both tolerant and sensitive alfalfa ecotypes [29]. This could also be the case for olive, which has not been previously reported and suggests that chlorophyll content alone do not to provide an indication of the extent of salt stress.
It is well known that several abiotic stresses influence the accumulation of carotenoids, whose regulation is suggested to lead to stress tolerant phenotypes. In our experimental conditions, we found that both transgenic lines showed higher carotenoid contents as compared to Canino and Sirole in control condition (0 mM NaCl), whereas Sirole and transgenic lines exhibited a net reduction of carotenoids level under salt stress (Figure 2d). This data was in consistent with those results obtained by [30], which showed that β-carotene content decreases in pepper under oxidative-induced stress.
Our findings under salt stress resulted in similar decrease rate of carotenoids for genotypes with contrasted tolerance (Sirole and Canino transgenic lines), suggesting that carotenoids metabolism is not directly involved in the stress tolerance mechanism, and changes in carotenoid accumulation are rather due to plant general metabolic modifications occurring during adaptation to stress conditions.
Although it has not been clearly demonstrated that the mechanism by which osmotin improves plant response under abiotic stress, a few studies have shown that under salinity stress osmotin allows the reduction of Na+ ions uptake into the cytoplasm though a Na+/H+ anti-porter [31], in addition that osmotin could be involved in osmotic adjustment of plants under stress either by facilitating the accumulation or compartmentation of different solutes in intracellular spaces [18]. As salinity results in water stress, plants have to accomplish an osmotic adjustment as well to maintain their metabolic activities. Osmotic adjustment is achieved by the accumulation of the compatible solutes such as free proline. It has been reported that stress tolerance increases with increasing proline accumulation [32] and, furthermore, that proline can induce the expression of several genes involved in stress tolerance [33], suggesting a role for this metabolite not only to low water potential but also in plant protection from osmotic stress [34]. Thus, the transgenic approach could represent a promising strategy to increase proline production and improve stress tolerance in plants.
Interestingly, our results showed that the salt-tolerant cv Canino accumulated more proline as compared to the salt-sensitive one (cv Sirole) (Figure 3b), confirming the previous study which suggested that proline accumulation is genotype-dependent [35]. Moreover, we found that shoots of both transgenic lines were able to increase proline accumulation with increasing NaCl concentrations in the medium and when they were exposed to the highest salt concentration (200 mM), proline content accumulated substantially (almost 7- and 9-fold higher in Canino AT17-1 and Canino AT17-2, respectively, compared to those found in Canino wt in the same condition) (Figure 3b). This result reasonably suggests that the presence of osmotin gene could play an important role in the regulation of the mechanism of proline accumulation under salt stress. Proline synthesis is commonly induced under stressed conditions through an intercellular signal pathway mediated by ROS accumulation [34]. Certainly, in plants exposed to environmental constraints, the accumulation of ROS is generally associated to proline accumulation [34].
Salt stress provokes an excessive ROS production resulting in oxidative damage leading to cell injury and death [36]. Therefore, we compared the changes in MDA concentration (as an estimate of lipid peroxidation) to assess the degree of oxidative damage induced by NaCl treatment [37]. Our data showed that all tested genotypes were able to maintain on average a lower MDA content than that found in control condition (Figure 3a). This result might be explained by assuming a significant role of proline in modulating both ROS generation and scavenging of ions [38], but also to high efficiency of the antioxidant system leading to an increased stress tolerance. This result meant that the olive shoots had a proper membrane stability even under salt stress.
According to the literature, plants possess some strategies to cope with oxidative stress, such as enzymatic and non-enzymatic antioxidant systems. Non-enzymatic systems include thiol compounds such as glutathione and cysteine, playing an important role in improving the tolerance to oxidative stress induced by NaCl toxicity [13,34,39]. Our results showed that non-protein thiols production and NaCl concentration in the growth medium were significantly positively correlated in all four studied genotypes (Canino r2 = 0.8762; Sirole r2 = 0.8193; Canino AT17-1 r2 = 0.6807; Canino AT17-2 r2 = 0.8259) (Figure 4a) and Sirole cv exhibited the highest slope of the increase of thiols accumulation with increasing salt concentration (Figure 4a). Thus, based on our results, we suggest that in Sirole, being a salt-sensitive cv, a large amount of ROS is likely produced due to salt stress, leading to increased pressure on ROS scavenging activity and thus to accumulate increased amounts of antioxidant compounds to cope with stress condition. Moreover, this response was well in line with the lowest proline contents found in Sirole.
Changes in thiols production reasonably require an adjustment of sulfate assimilation rate under salt stress, thus the activities of ATPS and OASTL, the first and the last enzyme of S assimilation pathway, respectively, have been estimated in plants exposed to salt stress. In this study, the increase of thiols production (Figure 4a) was parallel with that of OASTL activity (Figure 4c), indicating that S assimilation pathway plays an important role in the regulation of plant response to salt stress. As for thiols, OASTL activity increased with increasing salt concentration in the growth medium and, indeed, the correlation was very high in all four studied genotypes (Canino r2 = 0.9185; Sirole r2 = 0.7917; Canino AT17-1 r2 = 0.9451; Canino AT17-2 r2 = 0.8509) (Figure 4f), and as for thiols, the highest slope of the linear correlation was found in Sirole cv (Figure 4c). Interestingly, for both thiols and OASTL activity the lowest slope of the linear correlation was found in both transgenic lines (Figure 4a,c). The different pattern observed for ATPS and OASTL activity could be explained by assuming that OASTL directly catalyzes the biosynthesis of cysteine [40], the precursor for glutathione synthesis, and thus its activity could play a more important role in adaptation mechanisms to salt stress condition, than ATPS (Figure 4b). These results are well in line with previous studies showing ATPS activity increase [41,42] as well as decrease [43] in response to salt treatment.
Summarizing all these findings by the PCA analysis computed with the complete dataset comprising MDA and thiols levels, and enzyme activities (Figure 5) appeared a clear clustering along the first component (describing 54.11% of the total variance) based on NaCl concentration in the media. Most of samples treated with the highest salt concentrations were found on the negative axis and interestingly with a negative loading for MDA, proline, and OASTL (Figure 5). In conclusion, our results suggested that both Canino AT17-1 and Canino AT17-2 transgenic lines had better salt tolerance ability as compared to their relative wt (Canino), suggesting that the presence of osmotin could likely improve olive salt stress tolerance. Although the mechanism involved is still not fully understood, our results indicate that osmotin could play an important role in the regulation of proline accumulation, which in turn would exert a protective role preventing or modulating ROS generation.
Furthermore, the data obtained suggests an interesting interaction between salt stress and S metabolism and the involvement of this nutrient during adaptation of olive shoots to salt stress. Indeed, we have revealed that antioxidant response to scavenging excessive ROS requires the stimulation of S assimilation rate to sustain higher demand of reduced S.
4. Materials and Methods
4.1. Plant Material and Growing Conditions
Shoot culture derived from in vitro propagation of two olive cultivar (Canino and Sirole) and two transgenic lines (Canino AT17-1 and Canino AT17-2) expressing tobacco osmotin gene obtained by A. tumefaciens-mediated transformation of olive somatic embryos [3,44,45] have been used.
The shoots were sub-cultured for four weeks on OM medium [46] containing mannitol 36 g/L, L-glutamine 2.2 g/L, and zeatin 1 mg/L (added filter-sterilized after autoclave) and plant agar (Duchefa, NL) 0.6%. The pH of the medium was adjusted to 5.8 before autoclaving. Three 250 mL jars each containing ten single node explants were sub-cultured in with 50 mL proliferation medium as above described, supplemented with three different NaCl concentrations NaCl (50, 100 and 200 mM), corresponding to the electrical conductivity reported in Table 6, compared to the control (NaCl 0 mM). Explants were kept under controlled conditions in a growth chamber with a day/night cycle of 16/8 h at 24 ± 1 °C air temperature, 80% relative humidity, and 40 mmol m−2 s−1 light intensity. Data collection were performed after 28 days in culture.
Table 6.
Electrical conductivity (Ec) expressed in (µS/cm) of the proliferation media enriched with different concentrations of NaCl (50, 100, 200 mM and 0 as control).
Sampling for both morphological observations and analyses was performed after 30 days and decrease in medium pH was calculated as well (Figure 6). Samples collected for analyses were stored at −80 °C until use.
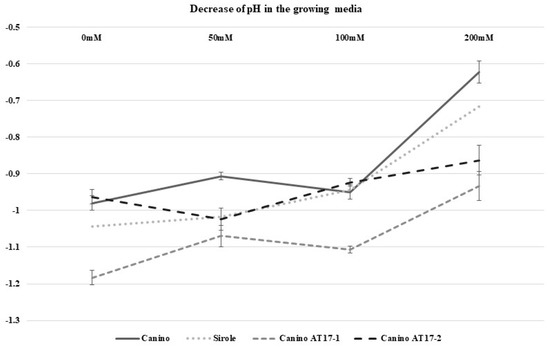
Figure 6.
Media pH decrease after 4 weeks of culture of the 4 genotypes maintained on media enriched with different NaCl concentrations.
4.2. Test for Transgenesis
Before starting the present experiment, the shoots of transgenic olive lines were tested again for kanamycin resistance, at 150 mg L−1 kanamycin-enriched media, and the presence of the transgenic genes in their DNA were ascertain. Olive genomic DNA was extracted from young leaves (150m g of fresh tissue) using a based CTAB (cetyl-trimethyl-ammonium bromide) method [47]. DNA concentration and quality were determined by 1% agarose gel electrophoresis and using a Nanodrop Bioanalyzer ND1000 (Thermo Scientific). Then, the transformant was screened for the transgene by polymerase chain reaction (PCR) using the osmotin-specific primers Osm-F (5′-CCAACAACCCAACTTGTTAAAA-3′) and Osm-R (5′-CGACAGAATAATTTGACCAAAAG-3′).
The PCR conditions were 95 °C for 5 min; 35 cycles of 94 °C for 30 s, 60 °C for 45 s, and 72 °C for 80 s, and final extension at 72 °C for 10 min. The reaction products were separated electrophoretically on 1.5% (w/v) agarose gel, stained with ethidium bromide, and photographed with a digital camera (Nikon coolpix 5700) (Figure 7).
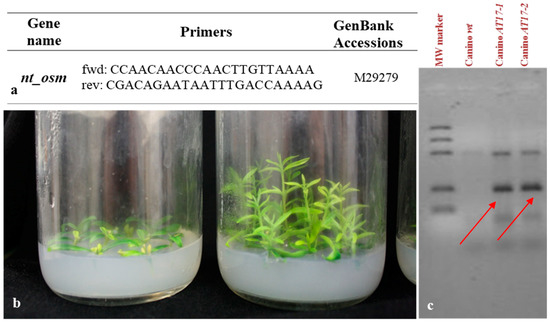
Figure 7.
Tobacco osmotin gene with GenBank accession number and associated primers utilized in PCR (a), Canino wt (Control) and transgenic Canino AT17-1 growing on selection medium enriched with kanamycin (150 mg L−1) (b), Analysis of tobacco osmotin gene integration in olive transgenic shoots: red arrows indicate the PCR products of the transgenic clones Canino AT17-1 and Canino AT17-2 (c).
4.3. Growth Analysis
To evaluate shoot proliferation, the data for node number, shoot number, shoot length (cm), and mean internode length (cm) were collected. The relative growth rate (RGR) index was also calculated after four weeks of culture as per methods described by [48].
McKinney index (MKI) and tolerance index were calculated to evaluate the damage caused by salinity stress and data were recorded based on a rating scale by dividing each shoot into ten classes using MKI (Table 7), as reported by [28]. The estimation of the tolerance index (TI) was performed based on chlorophyll content by using the formula described by [49].
Table 7.
Rating scale consisting of ten classes with the numeric values for the McKinney index (MKI).
4.4. Photosynthetic Pigments
To determine pigment concentration, 100 mg of fresh leaves were collected in 15 mL tubes and 4 mL of methanol 100% were added for the extraction. The tubes were heated at 65 °C for 10 min and then stored at 4 °C for 24 h. The values of total chlorophyll content, chlorophyll a, chlorophyll b, and carotenoid content were determined after centrifugation at 5000 rpm for 5 min, using a spectrophotometer (model EVO 60, made: Thermo Fisher Scientific Inc.) by following the methods described by [50].
4.5. Proline Accumulation
Freshly harvested leaf samples (100 mg of fresh weight) were collected, and proline concentration was determined colorimetrically, based on proline reaction with ninhydrin according to [51]. Briefly, shoot tissues (0.2 g) were powdered in liquid nitrogen, and then homogenized in a 1:1:1 solution of proline, ninhydrin, and glacial acetic acid. After an incubation at 100 °C for 1 h, the reaction was arrested in an iced bath. The red product (chromophore) was extracted with 4 mL toluene and the absorbance at 520 nm was determined with a spectrophotometer EVO 60 (Thermo Fischer Scientific Inc. Waltham, Massachusetts, United States). Free proline concentration was calculated using a standard curve.
4.6. Determination of MDA
The lipid peroxidation was estimated as malondialdehyde (MDA) content by following the methods described by [52]. Briefly, fresh shoot tissues (0.2 g) were homogenized in 10 mL of 0.25% TBA buffer prepared in 10% TCA, crushed with a mortar and pestle. Extracts were then heated at 95 °C for 30 min and then quickly cooled in ice. After a centrifugation step at 10,000 rpm for 10 min, the absorbance of the supernatant was measured at 532 nm absorbance in spectrophotometer EVO 60 (Thermo Fischer Scientific Inc. Waltham, Massachusetts, United States). The correction of non-specific turbidity was done by subtracting the absorbance values taken at 600 nm absorbance. The level of lipid peroxidation was presented as mmol g−1 fresh weight by using coefficient of 155 mM cm−1.
4.7. Non-Protein Thiols Extraction and Determination
Water soluble non-protein thiol compounds were determined colorimetrically with 5,5′ dithio-bis-(2-nitrobenzoic acid) (DTNB), following the procedure reported by [53]. Briefly, both shoots and roots (1 g fresh weight) were grounded in liquid N2 and extracted in 3 mL of a solution composed of 80 mM trichloroacetic acid (TCA), 1 mM ethylenediaminetetraacetic acid (EDTA), 0.15% (w/v) ascorbic acid, and 10% (w/v) polyvinylpolypyrrolidone (PVP). The final pH was between 5 and 6. After a centrifugation step (30 min at 4000 g and 4 °C), the supernatants were collected, and the concentrations of DTNB-reactive compounds were measured spectrophotometrically by reading the A415. Measurements of extracts were corrected for the absorbance at 415 nm in both the absence of DTNB (cuvette with extract but no DTNB) and the basal absorbance of DTNB (cuvette with DTNB but no extract or standard).
4.8. Determination of ATPs and OASTL
Shoot tissues (1 g fresh weight) were powdered in a pre-chilled mortar with liquid N2. Cold extraction buffer, containing 50 mM HEPES-KOH (pH 7.4), 5 mM MgCl2, 1 mM EDTA, 10% (v/v) glycerol, 0.1% (v/v) Triton X-100, 5 mM dithiothreitol (DTT), 1 mM phenylmethylsulfonyl fluoride (PMSF), and 1% (w/v) polyvinylpyrrolidone (PVP), was added in a ratio of 1:7 (w/v). The following extraction steps were performed according to the method described by [53]. The activity of ATP sulfurylase (ATPS; EC 2.7.7.4) was determined by the bioluminescence technique according to [53]. The ATP production during the enzyme reaction is coupled to the light producing reaction catalyzed by firefly luciferase (E.C. 1.13.12.7). The reaction mixture contained in a total volume of 0.25 mL:16 mM tris-acetate buffer pH 7.75, 8 mM APS, 68 mM Na4P2O7, 40 mL of firefly luciferase (ATP Monitoring Reagent, ThermoLabSystems), and 5 mL of sample. Light emission was measured with LKB 1250 luminometer. O-acetylserine (thiol) lyase (OASTL; EC 4.2.99.8) activity was determined colorimetrically, measuring the cysteine synthesis using ninhydrin as described by [53]. The crude extract was added to a final volume of 0.9 mL of reaction mixture, containing 30 mM of K-phosphate buffer (pH 7.5), and 12 mM of OAS. The reaction was started by the addition of 6 mM Na2S, and after 10 min at 90 °C, it was stopped by the addition 50 µL of a 20% (v/v) trichloroacetic acid solution and vigorous stirring.
4.9. Estimation of Protein Content
Protein concentration in the extracts was determined by a standard spectrophotometer (595 nm) following the procedures described by Bradford [54], using the Pierce™ Coomassie Plus™ Protein Assay Reagent (Thermo Fisher Scientific, Waltham, Massachusetts, United States) and bovine serum albumin (BSA) as a standard.
4.10. Statistical Analysis
The effects of NaCl, genotypes, and interaction between them were evaluated at three levels of significance: p < 0.05 (*), p < 0.01 (**), and p < 0.001 (***). Data were subjected to two-way ANOVA and the Fisher’s test was used for mean separation and to provide homogeneous groups for the means (at p ≤ 0.01).
All data were process in XLSTAT, a user-friendly statistical software for Microsoft Excel. Statistical elaboration consisted in the production of a correlation matrix (Pearson’s coefficient) to analyze intra-variable links and into a principal component analysis (PCA) to investigate the relationship among different genotypes submitted to different salt stress conditions. The sampling adequacy of individual and set variables was verified by the Kaiser–Meyer–Olkin measure (>0.50) and by Bartlett’s test of sphericity (<0.05). Variables with communality values <0.5 could be removed. PCA was performed and the main components selected by the latent root criterion (eigenvalues >1.0) [22].
A cluster analysis (CA) run after PCA was explained according to correlation matrix. Taken together, multivariate analysis allowed us to identify sensitive cultivars for different NaCl concentration and to identify chemical or physical parameters that better concur to characterize the response of plant to induced salt stress.
Author Contributions
M.A.B. and C.S. were responsible for conception and design of experiments, data analysis, drafting of the manuscript and edited the paper. E.C. conducted the enzyme analysis and data analysis. E.B. took part of study conception and statistical analysis. V.C. and E.R. took care of study conception and design and drafting the manuscript. T.A., I.A.H., N.A.A. and M.K.N.S. took part of draft preparation. S.A. was responsible for conception and design of experiments, data analysis, drafting of the manuscript and edited the paper. All authors have read and agreed to the published version of the manuscript.
Funding
The research was equally supported by MIUR (Ministry for Education, University and Research), Law232/2016, “Department of Excellence” University of Tuscia—Italy, and Higher Education Commission of Pakistan (IRSIP scholarship).
Institutional Review Board Statement
Not applicable.
Informed Consent Statement
Not applicable.
Data Availability Statement
The datasets generated during and/or analyzed during the current study are available from the corresponding author on reasonable request.
Acknowledgments
The authors thank Antonella Minandri for her technical assistance. We do not endorse any of the companies or product mentioned; names of manufacturers and products are mentioned for information only.
Conflicts of Interest
The authors declare no conflict of interest.
References
- Rugini, E.; Cristofori, V.; Silvestri, C. Genetic improvement of olive (Olea europaea L.) by conventional and in vitro biotechnology methods. Biotechnol. Adv. 2016, 34, 687–696. [Google Scholar] [CrossRef] [PubMed]
- Hashmi, M.A.; Khan, A.; Hanif, M.; Farooq, U.; Perveen, S. Traditional uses, phytochemistry, and pharmacology of Olea europaea (Olive). Evid. Based Complement. Altern. Med. 2015, 2015, 541591. [Google Scholar] [CrossRef] [PubMed]
- Rugini, E.; Silvestri, C.; Ceccarelli, M.; Muleo, R.; Cristofori, V. Mutagenesis and biotechnology techniques as tools for selecting new stable diploid and tetraploid olive genotypes and their dwarfing agronomical characterization. Hortic. Sci. 2016, 51, 799–804. [Google Scholar] [CrossRef]
- Ghanbari, R.; Anwar, F.; Alkharfy, K.M.; Gilani, A.H.; Saari, N. Valuable nutrients and functional bioactives in different parts of olive (Olea europaea L.), a review. Int. J. Mol. Sci. 2012, 13, 3291–3340. [Google Scholar] [CrossRef] [PubMed]
- Uylaşer, V.; Yildiz, G. The historical development and nutritional importance of olive and olive oil constituted an important part of the Mediterranean diet. Crit. Rev. Food Sci. Nutr. 2014, 54, 1092–1101. [Google Scholar] [CrossRef] [PubMed]
- Gucci, R.; Tattini, M. Salinity tolerance in olive. Hortic. Rev. 1997, 21, 177–214. [Google Scholar]
- Mousavi, S.; Regni, L.; Bocchini, M.; Mariotti, R.; Cultrera, N.G.M.; Mancuso, S.; Googlani, J.; Chakerolhosseini, M.R.; Guerrero, C.; Albertini, E.; et al. Physiological, epigenetic and genetic regulation in some olive cultivars under salt stress. Sci. Rep. 2019, 9, 1–17. [Google Scholar] [CrossRef] [PubMed]
- Bracci, T.; Sebastiani, L.; Busconi, M.; Fogher, C.; Belaj, A.; Trujillo, I. SSR markers reveal the uniqueness of olive cultivars from the Italian region of Liguria. Sci. Hortic. 2009, 122, 209–215. [Google Scholar] [CrossRef]
- Chartzoulakis, K.S. Salinity and olive: Growth, salt tolerance, photosynthesis and yield. Agric. Water Manag. 2005, 78, 108–121. [Google Scholar] [CrossRef]
- Zhu, J.; Fu, X.; Koo, Y.D.; Zhu, J.K.; Jenney, F.E.; Adams, M.W.; Zhu, Y.; Shi, H.; Yun, D.J.; Hasegawa, P.M.; et al. An enhancer mutant of Arabidopsis salt overly sensitive 3 mediates both ion homeostasis and the oxidative stress response. Mol. Cell Biol. 2007, 27, 5214–5224. [Google Scholar] [CrossRef]
- Hasegawa, P.M.; Bressan, R.A.; Zhu, J.K.; Bohnert, H.J. Plant cellular and molecular responses to high salinity. Annu. Rev. Plant Biol. 2000, 51, 463–499. [Google Scholar] [CrossRef]
- Rennenberg, H. The fate of excess sulfur in higher plants. Annu. Rev. Plant Physiol. 1984, 35, 121–153. [Google Scholar] [CrossRef]
- Foyer, C.H.; Noctor, G. Redox homeostasis and antioxidant signaling: A metabolic interface between stress perception and physiological responses. Plant Cell 2005, 17, 1866–1875. [Google Scholar] [CrossRef] [PubMed]
- Parida, A.K.; Das, A.B. Salt tolerance and salinity effects on plants: A review. Ecotox. Environ. Saf. 2005, 60, 324–349. [Google Scholar] [CrossRef]
- Subramanyam, K.; Sailaja, K.V.; Subramanyam, K.; Rao, D.M.; Lakshmidevi, K. Ectopic expression of an osmotin gene leads to enhanced salt tolerance in transgenic chilli pepper (Capsicum annum L.). Plant Cell Tissue Org. Cult. 2011, 105, 181–192. [Google Scholar] [CrossRef]
- Parkhi, V.; Kumar, V.; Sunilkumar, G.; Campbell, L.M.; Singh, N.K.; Rathore, K.S. Expression of apoplastically secreted tobacco osmotin in cotton confers drought tolerance. Mol. Breed. 2009, 23, 625–639. [Google Scholar] [CrossRef]
- Bashir, M.A.; Silvestri, C.; Ahmad, T.; Hafiz, I.A.; Abbasi, N.A.; Manzoor, A.; Cristofori, V.; Rugini, E. Osmotin: A Cationic Protein Leads to Improve Biotic and Abiotic Stress Tolerance in Plants. Plants 2020, 9, 992. [Google Scholar] [CrossRef] [PubMed]
- Singh, N.K.; Handa, A.K.; Hasegawa, P.M.; Bressan, R.A. Proteins associated with adaptation of cultured tobacco cells to NaCl. Plant Physiol. 1985, 79, 126–137. [Google Scholar] [CrossRef] [PubMed]
- Singh, N.K.; Bracker, C.A.; Hasegawa, P.M.; Handa, A.K.; Buckle, S.; Hermodson, M.A.; Pfankoch, E.; Regnier, F.E.; Bressan, R.A. Characterization of osmotin. Plant Physiol. 1987, 85, 529–536. [Google Scholar] [CrossRef]
- Husaini, A.M.; Abdin, M.Z. Overexpression of tobacco osmotin gene leads to salt stress tolerance in strawberry (Fragaria × ananassa Duch.) plants. Indian J. Biotechnol. 2008, 7, 465–471. [Google Scholar]
- Astolfi, S.; Zuchi, S. Adequate S supply protects barley plants from adverse effects of salinity stress by increasing thiol contents. Acta Physiol. Plant. 2013, 35, 175–181. [Google Scholar] [CrossRef]
- Hair, J.F.; Black, W.C.; Babin, B.J.; Anderson, R.E.; Tatham, R.L. Multivariate Data Analysis; Pearson University Press: Upper Saddle River, NJ, USA, 2006; Volume 6, p. 289. [Google Scholar]
- Suzuki, N.; Rivero, R.M.; Shulaev, V.; Blumwald, E.; Mittler, R. Abiotic and biotic stress combinations. New Phytol. 2014, 203, 32–43. [Google Scholar] [CrossRef] [PubMed]
- Subramanyam, K.; Arun, M.; Mariashibu, T.S.; Theboral, J.; Rajesh, M.; Singh, N.K.; Manickavasagam, M.; Ganapathi, A. Overexpression of tobacco osmotin (Tbosm) in soybean conferred resistance to salinity stress and fungal infections. Planta 2012, 236, 1909–1925. [Google Scholar] [CrossRef] [PubMed]
- Sokhansanj, A.; Noori, S.A.; Niknam, V. Comparison of bacterial and plant genes participating in proline biosynthesis with osmotin gene, with respect to enhancing salinity tolerance of transgenic tobacco plants. Russ. J. Plant Physiol. 2006, 53, 110–115. [Google Scholar] [CrossRef]
- Sarad, N.; Rathore, M.; Singh, N.K.; Kumar, N. Genetically engineered tomatoes: New vista for sustainable agriculture in high altitude regions. In Proceedings of the Fourth International Crop Science Congress, Brisbane, Australia, 26 September–1 October 2004. [Google Scholar]
- Rugini, E.; Bashir, M.A.; Cristofori, V.; Ruggiero, B.; Silvestri, C. A review of genetic improvement of main fruit trees through modern biotechnological tools and considerations of the cultivation and research of the engineered plant restrictions. Pak. J. Agric. Sci. 2020, 57, 17–42. [Google Scholar] [CrossRef]
- Di Cori, P.; Lucioli, S.; Frattarelli, A.; Nota, P.; Tel-Or, E.; Benyamini, E.; Gottlieb, H.; Caboni, E.; Forni, C. Characterization of the response of in vitro cultured Myrtus communis L. plants to high concentrations of NaCl. Plant Physiol. Biochem. 2013, 73, 420–426. [Google Scholar] [CrossRef]
- Boukari, N.; Jelali, N.; Renaud, J.B.; Youssef, R.B.; Abdelly, C.; Hannoufa, A. Salicylic acid seed priming improves tolerance to salinity, iron deficiency and their combined effect in two ecotypes of alfalfa. Environ. Exp. Bot. 2019, 167. [Google Scholar] [CrossRef]
- Bouvier, F.; Backhaus, R.A.; Camara, B. Induction and control of chromoplast-specific carotenoid genes by oxidative stress. J. Biol. Chem. 1998, 273, 30651–30659. [Google Scholar] [CrossRef] [PubMed]
- Le, T.T.; Williams, B.; Mundree, S. An osmotin from the resurrection plant Tripogon loliiformis (TlOsm) confers tolerance to multiple abiotic stresses in transgenic rice. Physiol. Plant. 2017, 162, 13–34. [Google Scholar] [CrossRef]
- Wang, C.; Deng, P.; Chen, L.; Wang, X.; Ma, H.; Hu, W.; Yao, N.; Feng, Y.; Chai, R.; Yang, G.; et al. A wheat WRKY transcription factor TaWRKY10 confers tolerance to multiple abiotic stresses in transgenic tobacco. PLoS ONE 2013, 8, e65120. [Google Scholar] [CrossRef] [PubMed]
- Ashraf, M.; Foolad, M.R. Roles of glycine betaine and proline in improving plant abiotic stress resistance. Environ. Exp. Bot. 2007, 59, 206–216. [Google Scholar] [CrossRef]
- Rejeb, K.B.; Abdelly, C.; Savouré, A. How reactive oxygen species and proline face stress together. Plant Physiol. Biochem. 2014, 80, 278–284. [Google Scholar] [CrossRef]
- Regni, L.; Del Pino, A.M.; Mousavi, S.; Palmerini, C.A.; Baldoni, L.; Mariotti, R.; Mairech, H.; Gardi, T.; D’Amato, R.; Proietti, P. Behavior of Four Olive Cultivars During Salt Stress. Front. Plant Sci. 2019, 10, 867. [Google Scholar] [CrossRef] [PubMed]
- Khan, M.I.R.; Asgher, M.; Khan, N.A. Alleviation of salt-induced photosynthesis and growth inhibition by salicylic acid involves glycine betaine and ethylene in mung bean (Vigna radiata L.). Plant Physiol. Biochem. 2014, 80, 67–74. [Google Scholar] [CrossRef] [PubMed]
- Wang, W.; Kim, Y.; Lee, H.; Kim, K.; Deng, X.; Kwak, S. Analysis of antioxidant enzyme activity during germination of alfalfa under salt and drought stresses. Plant Physiol. Biochem. 2009, 47, 570–577. [Google Scholar] [CrossRef] [PubMed]
- Szabados, L.; Savoure, A. Proline: A multifunctional amino acid. Trends Plant Sci. 2010, 15, 89–97. [Google Scholar] [CrossRef] [PubMed]
- Sharma, A.; Shahzad, B.; Rehman, A.; Bhardwaj, R.; Landi, M.; Zheng, B. Response of phenylpropanoid pathway and the role of polyphenols in plants under abiotic stress. Molecules 2019, 24, 2452. [Google Scholar] [CrossRef] [PubMed]
- Hesse, H.; Nikiforova, V.; Gakiere, B.; Hoefgen, R. Molecular analysis and control of cysteine biosynthesis: Integration of nitrogen and sulphur metabolism. J. Exp. Bot. 2004, 55, 1283–1292. [Google Scholar] [CrossRef] [PubMed]
- Zuchi, S.; Cesco, S.; Astolfi, S. High S supply improves Fe accumulation in durum wheat plants grown under Fe limitation. Environ. Exp. Bot. 2012, 77, 25–32. [Google Scholar] [CrossRef]
- Wirtz, M.; Hell, R. Functional analysis of the cysteine synthase protein complex from plants: Structural, biochemical and regulatory properties. J. Plant Physiol. 2006, 163, 273–286. [Google Scholar] [CrossRef] [PubMed]
- Khan, N.A.; Anjum, N.A.; Nazar, R.; Iqbal, N. Increased activity of ATP-sulfurylase and increased contents of cysteine and glutathione reduce high cadmium-induced oxidative stress in mustard cultivar with high photosynthetic potential. Russ. J. Plant Physiol. 2009, 56, 670–677. [Google Scholar] [CrossRef]
- Rugini, E.; Caricato, G. Somatic embryogenesis and plant recovery from mature tissues of olive cultivars (Olea europaea L.) “Canino” and “Moraiolo”. Plant Cell Rep. 1995, 14, 257–260. [Google Scholar] [CrossRef] [PubMed]
- Rugini, E.; Silvestri, C. Somatic Embryogenesis in Olive (Olea europaea L. subsp. europaea var. sativa and var. sylvestris). In In Vitro Embryogenesis in Higher Plants, 1st ed.; Germana, M.A., Lambardi, M., Eds.; Humana Press: New York, NY, USA, 2016; pp. 341–349. [Google Scholar]
- Rugini, E. In vitro propagation of some olive (Olea europaea sativa L.) cultivars with different root-ability, and medium development using analytical data from developing shoots and embryos. Sci. Hortic. 1984, 24, 123–134. [Google Scholar] [CrossRef]
- Doyle, J.J.; Doyle, J.L. Isolation ofplant DNA from fresh tissue. Focus 1990, 12, 39–40. [Google Scholar]
- Gatti, E.; Sgarbi, E.; Ozudogru, E.A.; Lambardi, M. The effect of PlantformTM bioreactor on micropropagation of Quercus robur in comparison to a conventional in vitro culture system on gelled medium, and assessment of the microenvironment influence on leaf structure. Plant Biosys. 2017, 151, 1129–1136. [Google Scholar] [CrossRef]
- Köhl, K.I.; Lösch, R. Experimental characterisation of metal tolerance. In Heavy Metal Stress in Plants, 1st ed.; Prasad, M.N.N., Ed.; Springer: Berlin/Heidelberg, Germany, 2004; pp. 434–454. [Google Scholar]
- Lichtenthaler, H.K. Chlorophylls and carotenoids: Pigments of photosynthetic biomembranes. Meth. Enzymol. 1987, 148, 350–382. [Google Scholar]
- Bates, L.S.; Waldren, R.P.; Teare, I.D. Rapid determination of free proline for water-stress studies. Plant Soil 1973, 39, 205–207. [Google Scholar] [CrossRef]
- Astolfi, S.; Zuchi, S.; Passera, C. Effect of cadmium on H+ ATPase activity of plasma membrane vesicles isolated from roots of different S-supplied maize (Zea mays L.) plants. Plant Sci. 2005, 169, 361–368. [Google Scholar] [CrossRef]
- Celletti, S.; Pii, Y.; Mimmo, T.; Cesco, S.; Astolfi, S. The characterization of the adaptive responses of durum wheat to different Fe availability highlights an optimum Fe requirement threshold. Plant Physiol. Biochem. 2016, 109, 300–307. [Google Scholar] [CrossRef] [PubMed]
- Bradford, M.M. A rapid and sensitive method for the quantitation of microgram quantities of protein utilizing the principle of protein-dye binding. Anal. Biochem. 1976, 72, 248–254. [Google Scholar] [CrossRef]


Publisher’s Note: MDPI stays neutral with regard to jurisdictional claims in published maps and institutional affiliations. |
© 2021 by the authors. Licensee MDPI, Basel, Switzerland. This article is an open access article distributed under the terms and conditions of the Creative Commons Attribution (CC BY) license (http://creativecommons.org/licenses/by/4.0/).