
Mutation in the Ciliary Protein C2CD3 Reveals Organ-Specific Mechanisms of Hedgehog Signal Transduction in Avian Embryos

 , and
, and 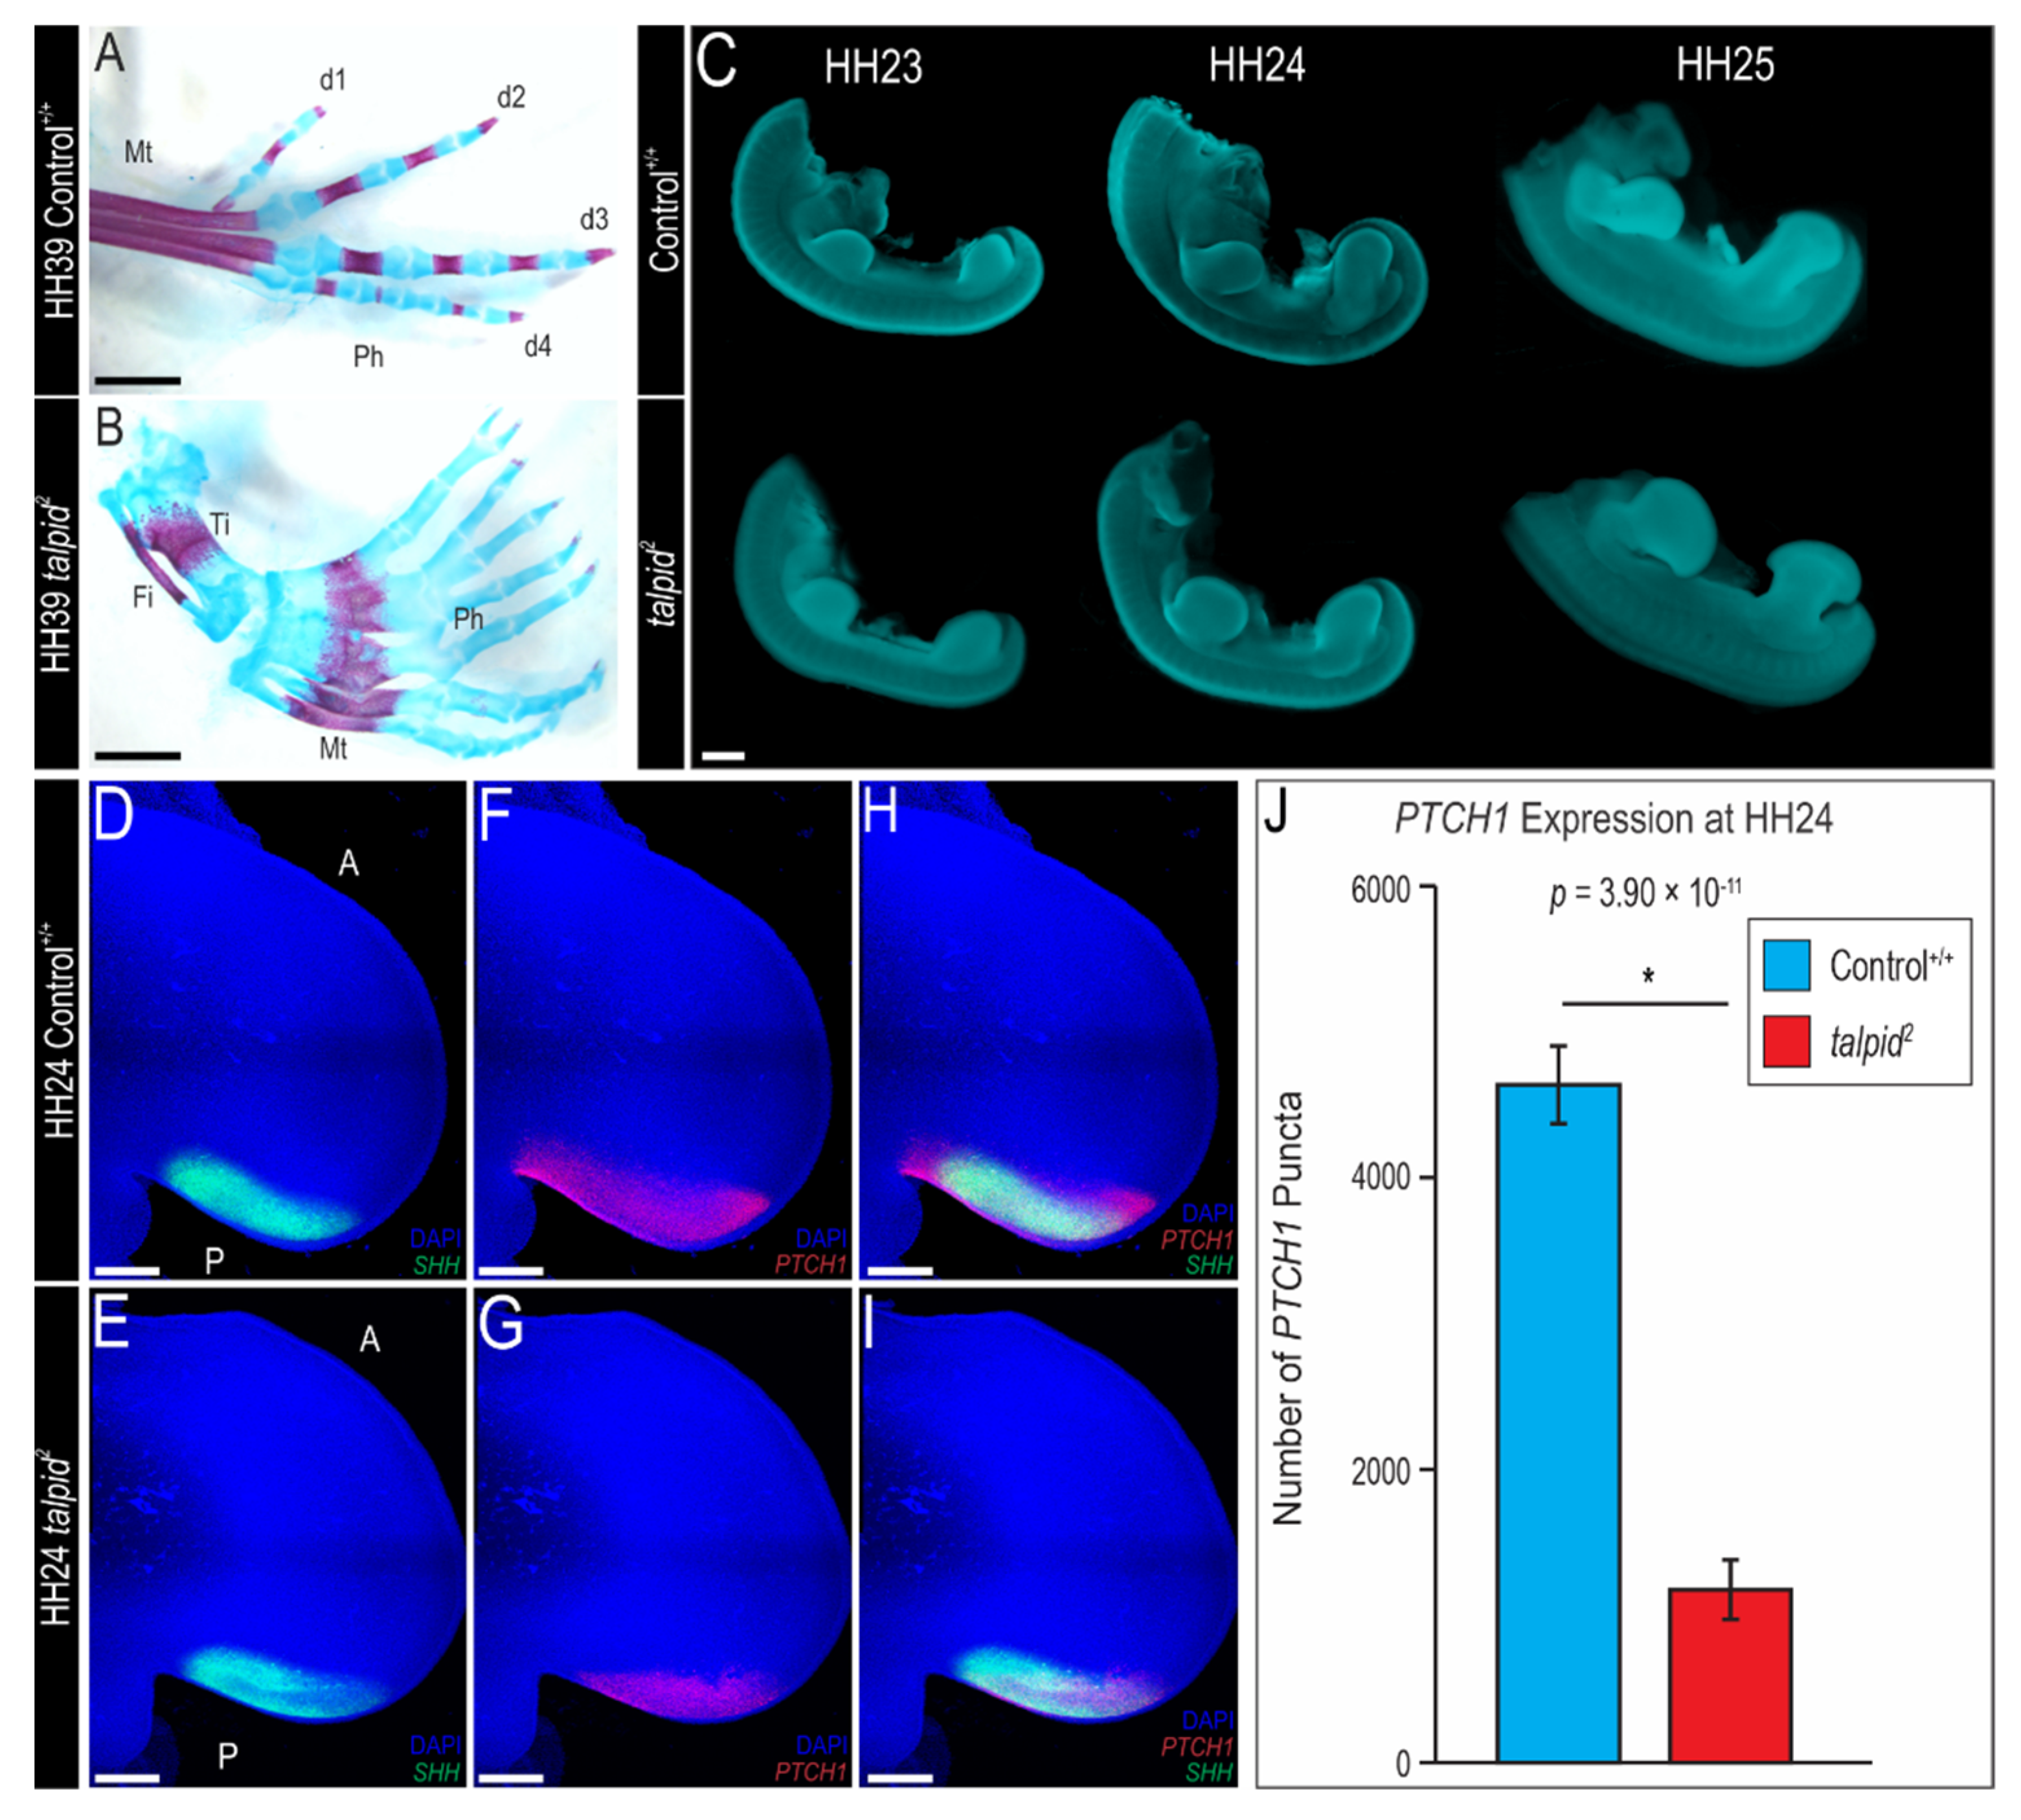
Abstract
1. Introduction
2. Materials and Methods
2.1. Avian Embryo Collection, Genotyping, and Tissue Preparation
2.2. Wholemount Skeletal Staining
2.3. RNAscope In Situ Hybridization Assay
2.4. RNAscope Puncta Quantification
2.5. Morphometric Measurements
2.6. Immunohistochemistry
3. Results
3.1. Polydactyly in the ta2 Hindlimb Does Not Correlate with Ectopic Expression of PTCH1
3.2. Loss of Ventral Neuronal Cell Types in ta2 Neural Tube Correlates with Reduced PTCH1 Expression
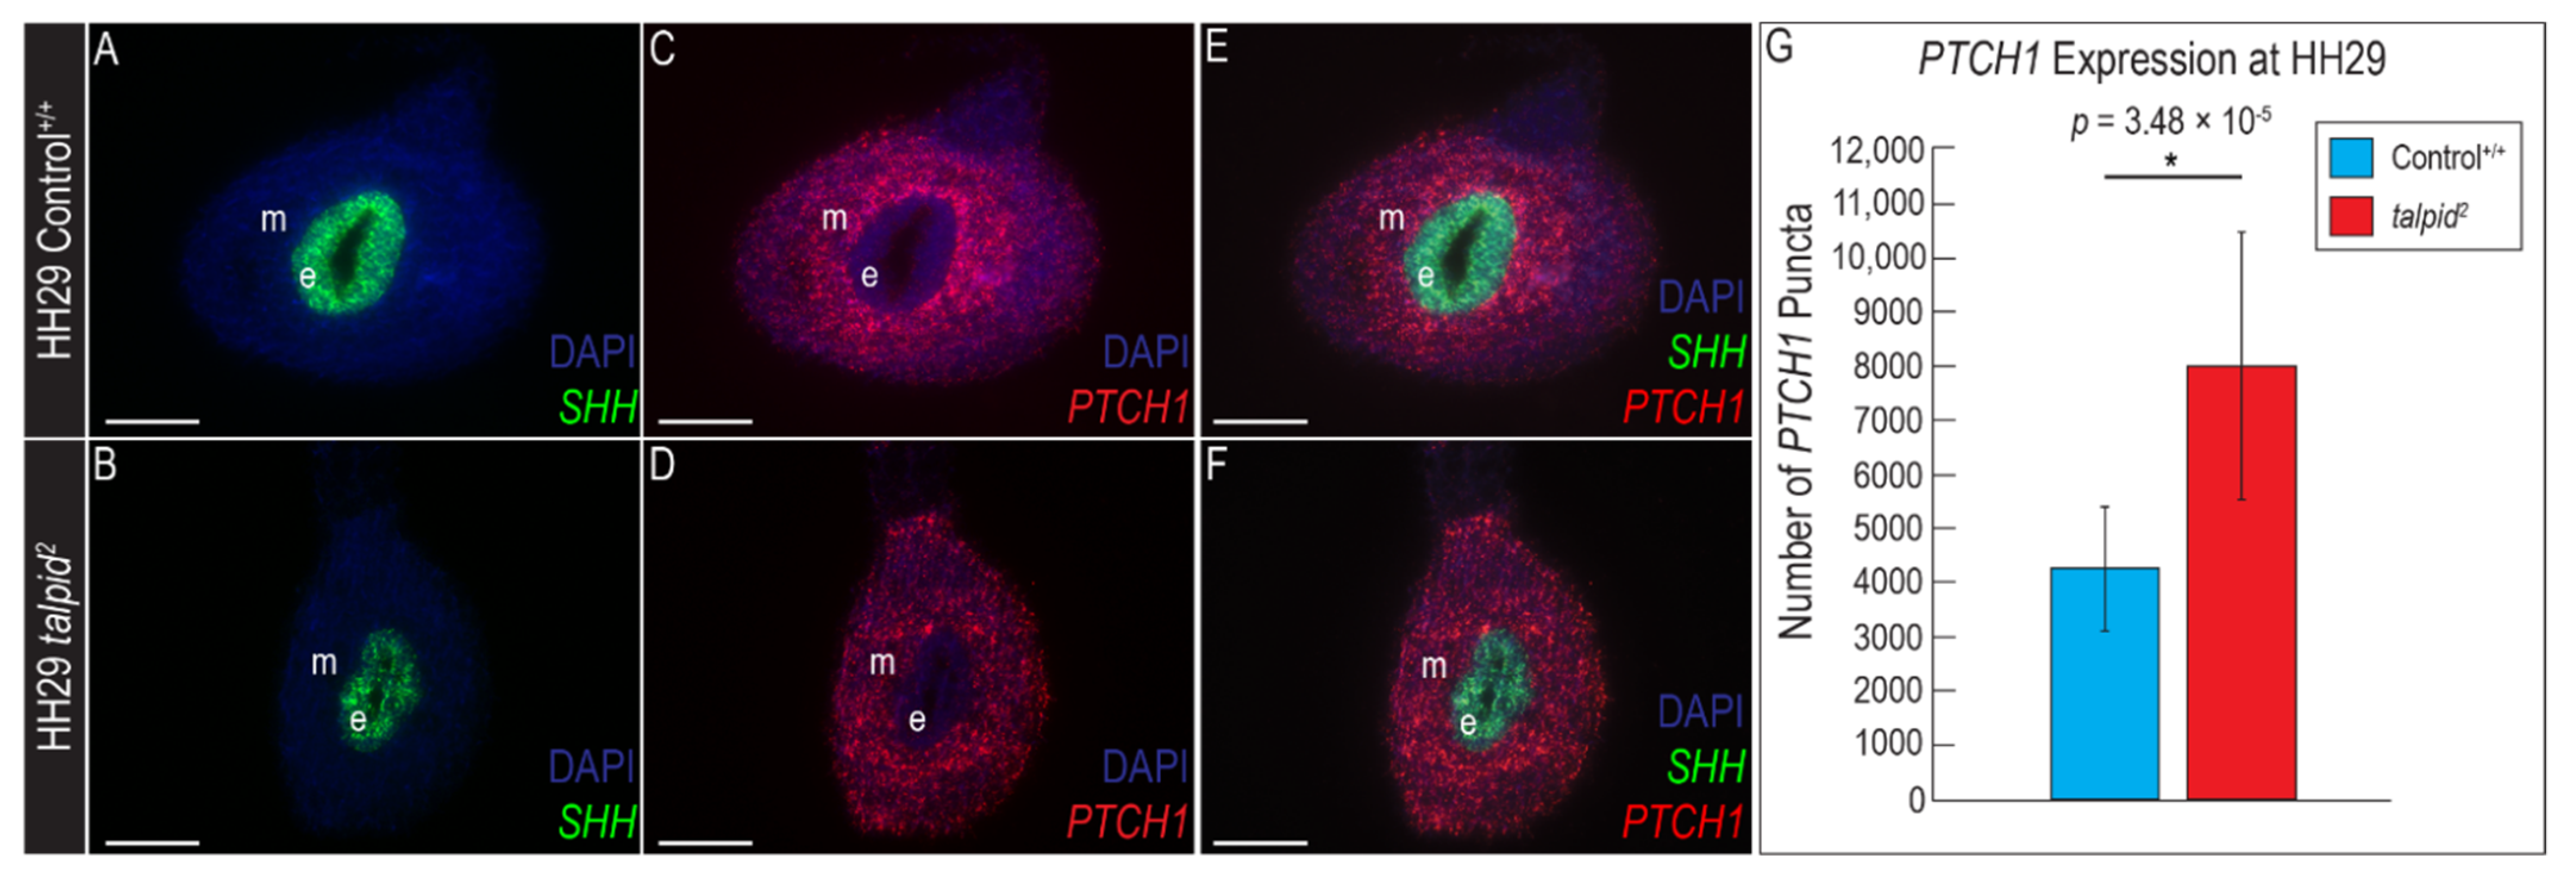
3.3. Midfacial Widening in the ta2 Correlates with Increased PTCH1 Expression in the Frontonasal Prominence
3.4. Hypoplastic Gastrointestinal Tract in the ta2 Does Not Correlate with Increased PTCH1 Expression
4. Discussion
Supplementary Materials
Author Contributions
Funding
Institutional Review Board Statement
Acknowledgments
Conflicts of Interest
References
- Goetz, S.C.; Anderson, K.V. The Primary Cilium: A Signaling Center During Vertebrate Development. Nat. Rev. Genet. 2010, 11, 331–344. [Google Scholar] [CrossRef]
- Baker, K.; Beales, P.L. Making Sense of Cilia in Disease: The Human Ciliopathies. Am. J. Med. Genet. C Semin. Med. Genet. 2009, 151, 281–295. [Google Scholar] [CrossRef]
- Elliott, K.H.; Brugmann, S.A. Sending Mixed Signals: Cilia-Dependent Signaling during Development and Disease. Dev. Biol. 2019, 447, 28–41. [Google Scholar] [CrossRef]
- Huangfu, D.; Liu, A.; Rakeman, A.S.; Murcia, N.S.; Niswander, L.; Anderson, K.V. Hedgehog Signalling in the Mouse Requires Intraflagellar Transport Proteins. Nature 2003, 426, 83–87. [Google Scholar] [CrossRef]
- Huangfu, D.; Anderson, K.V. Cilia and Hedgehog Responsiveness in the Mouse. Proc. Natl. Acad. Sci. USA 2005, 102, 11325–11330. [Google Scholar] [CrossRef]
- Goodrich, L.V.; Johnson, R.L.; Milenkovic, L.; McMahon, J.A.; Scott, M.P. Conservation of the Hedgehog/Patched Signaling Pathway from Flies to Mice: Induction of a Mouse Patched Gene by Hedgehog. Genes Dev. 1996, 10, 301–312. [Google Scholar] [CrossRef] [PubMed]
- Marigo, V.; Davey, R.A.; Zuo, Y.; Cunningham, J.M.; Tabin, C.J. Biochemical Evidence That Patched Is the Hedgehog Receptor. Nature 1996, 384, 176–179. [Google Scholar] [CrossRef] [PubMed]
- Stone, D.M.; Hynes, M.; Armanini, M.; Swanson, T.A.; Gu, Q.; Johnson, R.L.; Scott, M.P.; Pennica, D.; Goddard, A.; Phillips, H.; et al. The Tumour-Suppressor Gene Patched Encodes a Candidate Receptor for Sonic Hedgehog. Nature 1996, 384, 129–134. [Google Scholar] [CrossRef] [PubMed]
- Chen, Y.; Struhl, G. Dual Roles for Patched in Sequestering and Transducing Hedgehog. Cell 1996, 87, 553–563. [Google Scholar] [CrossRef]
- Corbit, K.C.; Aanstad, P.; Singla, V.; Norman, A.R.; Stainier, D.Y.R.; Reiter, J.F. Vertebrate Smoothened Functions at the Primary Cilium. Nature 2005, 437, 1018–1021. [Google Scholar] [CrossRef]
- Rohatgi, R.; Milenkovic, L.; Scott, M.P. Patched1 Regulates Hedgehog Signaling at the Primary Cilium. Science 2007, 317, 372–376. [Google Scholar] [CrossRef]
- Park, H.L.; Bai, C.; Platt, K.A.; Matise, M.P.; Beeghly, A.; Hui, C.C.; Nakashima, M.; Joyner, A.L. Mouse Gli1 Mutants Are Viable but Have Defects in SHH Signaling in Combination with a Gli2 Mutation. Development 2000, 127, 1593–1605. [Google Scholar]
- Hui, C.; Angers, S. Gli Proteins in Development and Disease. Annu. Rev. Cell Dev. Biol. 2011, 27, 513–537. [Google Scholar] [CrossRef] [PubMed]
- Bai, C.B.; Stephen, D.; Joyner, A.L. All Mouse Ventral Spinal Cord Patterning by Hedgehog Is Gli Dependent and Involves an Activator Function of Gli3. Dev. Cell 2004, 6, 103–115. [Google Scholar] [CrossRef]
- Bai, C.B.; Auerbach, W.; Lee, J.S.; Stephen, D.; Joyner, A.L. Gli2, but Not Gli1, Is Required for Initial Shh Signaling and Ectopic Activation of the Shh Pathway. Development 2002, 129, 4753–4761. [Google Scholar] [PubMed]
- Dai, P.; Akimaru, H.; Tanaka, Y.; Maekawa, T.; Nakafuku, M.; Ishii, S. Sonic Hedgehog-Induced Activation of the Gli1 Promoter Is Mediated by GLI3. J. Biol. Chem. 1999, 274, 8143–8152. [Google Scholar] [CrossRef] [PubMed]
- Sasaki, H.; Hui, C.; Nakafuku, M.; Kondoh, H. A Binding Site for Gli Proteins Is Essential for HNF-3beta Floor Plate Enhancer Activity in Transgenics and Can Respond to Shh in Vitro. Development 1997, 124, 1313–1322. [Google Scholar]
- McDermott, A.; Gustafsson, M.; Elsam, T.; Hui, C.-C.; Emerson, C.P.; Borycki, A.-G. Gli2 and Gli3 Have Redundant and Context-Dependent Function in Skeletal Muscle Formation. Development 2005, 132, 345–357. [Google Scholar] [CrossRef] [PubMed]
- Ding, Q.; Motoyama, J.; Gasca, S.; Mo, R.; Sasaki, H.; Rossant, J.; Hui, C.C. Diminished Sonic Hedgehog Signaling and Lack of Floor Plate Differentiation in Gli2 Mutant Mice. Development 1998, 125, 2533–2543. [Google Scholar]
- Persson, M.; Stamataki, D.; te Welscher, P.; Andersson, E.; Böse, J.; Rüther, U.; Ericson, J.; Briscoe, J. Dorsal-Ventral Patterning of the Spinal Cord Requires Gli3 Transcriptional Repressor Activity. Genes Dev. 2002, 16, 2865–2878. [Google Scholar] [CrossRef]
- Kim, J.; Kato, M.; Beachy, P.A. Gli2 Trafficking Links Hedgehog-Dependent Activation of Smoothened in the Primary Cilium to Transcriptional Activation in the Nucleus. Proc. Natl. Acad. Sci. USA 2009, 106, 21666–21671. [Google Scholar] [CrossRef] [PubMed]
- Haycraft, C.J.; Banizs, B.; Aydin-Son, Y.; Zhang, Q.; Michaud, E.J.; Yoder, B.K. Gli2 and Gli3 Localize to Cilia and Require the Intraflagellar Transport Protein Polaris for Processing and Function. PLoS Genet. 2005, 1, e53. [Google Scholar] [CrossRef]
- Liu, A.; Wang, B.; Niswander, L.A. Mouse Intraflagellar Transport Proteins Regulate Both the Activator and Repressor Functions of Gli Transcription Factors. Development 2005, 132, 3103–3111. [Google Scholar] [CrossRef]
- Marigo, V.; Tabin, C.J. Regulation of Patched by Sonic Hedgehog in the Developing Neural Tube. Proc. Natl. Acad. Sci. USA 1996, 93, 9346–9351. [Google Scholar] [CrossRef] [PubMed]
- Marigo, V.; Johnson, R.L.; Vortkamp, A.; Tabin, C.J. Sonic Hedgehog Differentially Regulates Expression of GLI and GLI3 during Limb Development. Dev. Biol. 1996, 180, 273–283. [Google Scholar] [CrossRef] [PubMed]
- Lee, J.; Platt, K.A.; Censullo, P.; I Altaba, A.R. Gli1 Is a Target of Sonic Hedgehog That Induces Ventral Neural Tube Development. Development 1997, 124, 2537–2552. [Google Scholar] [PubMed]
- Goodrich, L.V.; Milenković, L.; Higgins, K.M.; Scott, M.P. Altered Neural Cell Fates and Medulloblastoma in Mouse Patched Mutants. Science 1997, 277, 1109–1113. [Google Scholar] [CrossRef]
- Ingham, P.W.; Taylor, A.M.; Nakano, Y. Role of the Drosophila Patched Gene in Positional Signalling. Nature 1991, 353, 184–187. [Google Scholar] [CrossRef]
- Capdevila, J.; Estrada, M.P.; Sánchez-Herrero, E.; Guerrero, I. The Drosophila Segment Polarity Gene Patched Interacts with Decapentaplegic in Wing Development. EMBO J. 1994, 13, 71–82. [Google Scholar] [CrossRef]
- Von Ohlen, T.; Hooper, J.E. Hedgehog Signaling Regulates Transcription through Gli/Ci Binding Sites in the Wingless Enhancer. Mech. Dev. 1997, 68, 149–156. [Google Scholar] [CrossRef]
- Concordet, J.P.; Lewis, K.E.; Moore, J.W.; Goodrich, L.V.; Johnson, R.L.; Scott, M.P.; Ingham, P.W. Spatial Regulation of a Zebrafish Patched Homologue Reflects the Roles of Sonic Hedgehog and Protein Kinase A in Neural Tube and Somite Patterning. Development 1996, 122, 2835–2846. [Google Scholar]
- Marigo, V.; Scott, M.P.; Johnson, R.L.; Goodrich, L.V.; Tabin, C.J. Conservation in Hedgehog Signaling: Induction of a Chicken Patched Homolog by Sonic Hedgehog in the Developing Limb. Development 1996, 122, 1225–1233. [Google Scholar]
- Hidalgo, A.; Ingham, P. Cell Patterning in the Drosophila Segment: Spatial Regulation of the Segment Polarity Gene Patched. Development 1990, 110, 291–301. [Google Scholar]
- Chang, C.-F.; Chang, Y.-T.; Millington, G.; Brugmann, S.A. Craniofacial Ciliopathies Reveal Specific Requirements for GLI Proteins during Development of the Facial Midline. PLoS Genet. 2016, 12. [Google Scholar] [CrossRef]
- Schock, E.N.; Struve, J.N.; Chang, C.-F.; Williams, T.J.; Snedeker, J.; Attia, A.C.; Stottmann, R.W.; Brugmann, S.A. A Tissue-Specific Role for Intraflagellar Transport Genes during Craniofacial Development. PLoS ONE 2017, 12, e0174206. [Google Scholar] [CrossRef]
- Brugmann, S.A.; Allen, N.C.; James, A.W.; Mekonnen, Z.; Madan, E.; Helms, J.A. A Primary Cilia-Dependent Etiology for Midline Facial Disorders. Hum. Mol. Genet. 2010, 19, 1577–1592. [Google Scholar] [CrossRef]
- Kolpakova-Hart, E.; Jinnin, M.; Hou, B.; Fukai, N.; Olsen, B.R. Kinesin-2 Controls Development and Patterning of the Vertebrate Skeleton by Hedgehog- and Gli3-Dependent Mechanisms. Dev. Biol. 2007, 309, 273–284. [Google Scholar] [CrossRef] [PubMed]
- Liu, B.; Chen, S.; Cheng, D.; Jing, W.; Helms, J.A. Primary Cilia Integrate Hedgehog and Wnt Signaling during Tooth Development. J. Dent. Res. 2014, 93, 475–482. [Google Scholar] [CrossRef] [PubMed]
- Millington, G.; Elliott, K.H.; Chang, Y.-T.; Chang, C.-F.; Dlugosz, A.; Brugmann, S.A. Cilia-Dependent GLI Processing in Neural Crest Cells Is Required for Tongue Development. Dev. Biol. 2017, 424, 124–137. [Google Scholar] [CrossRef] [PubMed]
- Elliott, K.H.; Millington, G.; Brugmann, S.A. A Novel Role for Cilia-Dependent Sonic Hedgehog Signaling during Submandibular Gland Development. Dev. Dyn. 2018, 247, 818–831. [Google Scholar] [CrossRef] [PubMed]
- Abbott, U.; Taylor, L.W.; Abplanalp, H. A 2nd Talpid-like Mutation in the Fowl. In Poultry Science; Oxford University Press: Oxford, UK, 1959; Volume 38, p. 1185. [Google Scholar]
- Abbott, U.; Taylor, L.W.; Abplanalp, H. Studies with Talpid2, an Embryonic Lethal of the Fowl. J. Hered. 1960, 51, 195–202. [Google Scholar] [CrossRef]
- Chang, C.-F.; Schock, E.N.; O’Hare, E.A.; Dodgson, J.; Cheng, H.H.; Muir, W.M.; Edelmann, R.E.; Delany, M.E.; Brugmann, S.A. The Cellular and Molecular Etiology of the Craniofacial Defects in the Avian Ciliopathic Mutant Talpid2. Development 2014, 141, 3003–3012. [Google Scholar] [CrossRef]
- Hoover, A.N.; Wynkoop, A.; Zeng, H.; Jia, J.; Niswander, L.A.; Liu, A. C2cd3 Is Required for Cilia Formation and Hedgehog Signaling in Mouse. Development 2008, 135, 4049–4058. [Google Scholar] [CrossRef] [PubMed]
- Ye, X.; Zeng, H.; Ning, G.; Reiter, J.F.; Liu, A. C2cd3 Is Critical for Centriolar Distal Appendage Assembly and Ciliary Vesicle Docking in Mammals. Proc. Natl. Acad. Sci. USA 2014, 111, 2164–2169. [Google Scholar] [CrossRef] [PubMed]
- Bonatto Paese, C.L.; Brooks, E.C.; Aarnio-Peterson, M.; Brugmann, S.A. Ciliopathic Micrognathia Is Caused by Aberrant Skeletal Differentiation and Remodeling. Development 2021, 148, dev194175. [Google Scholar] [CrossRef] [PubMed]
- Schock, E.N.; Chang, C.-F.; Struve, J.N.; Chang, Y.-T.; Chang, J.; Delany, M.E.; Brugmann, S.A. Using the Avian Mutant Talpid2 as a Disease Model for Understanding the Oral-Facial Phenotypes of Oral-Facial-Digital Syndrome. Dis. Model. Mech. 2015, 8, 855–866. [Google Scholar] [CrossRef] [PubMed]
- Dvorak, L.; Fallon, J.F. Talpid2 Mutant Chick Limb Has Anteroposterior Polarity and Altered Patterns of Programmed Cell Death. Anat. Rec. 1991, 231, 251–260. [Google Scholar] [CrossRef] [PubMed]
- Chang, Y.-T.; Chaturvedi, P.; Schock, E.N.; Brugmann, S.A. Understanding Mechanisms of GLI-Mediated Transcription during Craniofacial Development and Disease Using the Ciliopathic Mutant, Talpid2. Front. Physiol. 2016, 7. [Google Scholar] [CrossRef]
- Harris, M.P.; Hasso, S.M.; Ferguson, M.W.J.; Fallon, J.F. The Development of Archosaurian First-Generation Teeth in a Chicken Mutant. Curr. Biol. 2006, 16, 371–377. [Google Scholar] [CrossRef]
- Schneider, R.A.; Hu, D.; Helms, J.A. From Head to Toe: Conservation of Molecular Signals Regulating Limb and Craniofacial Morphogenesis. Cell Tissue Res. 1999, 296, 103–109. [Google Scholar] [CrossRef]
- Caruccio, N.C.; Martinez-Lopez, A.; Harris, M.; Dvorak, L.; Bitgood, J.; Simandl, B.K.; Fallon, J.F. Constitutive Activation of Sonic Hedgehog Signaling in the Chicken Mutant Talpid(2): Shh-Independent Outgrowth and Polarizing Activity. Dev. Biol. 1999, 212, 137–149. [Google Scholar] [CrossRef]
- Rodriguez, C.; Kos, R.; Macias, D.; Abbott, U.K.; Belmonte, J.C.I. Shh, HoxD, Bmp-2, and Fgf-4 Gene Expression during Development of the Polydactylous Talpid2, Diplopodia1, and Diplopodia4 Mutant Chick Limb Buds. Dev. Genet. 1996, 19, 26–32. [Google Scholar] [CrossRef]
- Agarwala, S.; Aglyamova, G.V.; Marma, A.K.; Fallon, J.F.; Ragsdale, C.W. Differential Susceptibility of Midbrain and Spinal Cord Patterning to Floor Plate Defects in the Talpid2 Mutant. Dev. Biol. 2005, 288, 206–220. [Google Scholar] [CrossRef]
- Hamburger, V.; Hamilton, H.L. A Series of Normal Stages in the Development of the Chick Embryo. J. Morphol. 1951, 88, 49–92. [Google Scholar] [CrossRef] [PubMed]
- Wang, F.; Flanagan, J.; Su, N.; Wang, L.-C.; Bui, S.; Nielson, A.; Wu, X.; Vo, H.-T.; Ma, X.-J.; Luo, Y. RNAscope: A Novel in Situ RNA Analysis Platform for Formalin-Fixed, Paraffin-Embedded Tissues. J. Mol. Diagn. 2012, 14, 22–29. [Google Scholar] [CrossRef] [PubMed]
- Morrison, J.A.; McKinney, M.C.; Kulesa, P.M. Resolving In Vivo Gene Expression During Collective Cell Migration Using an Integrated RNAscope, Immunohistochemistry and Tissue Clearing Method. Mech. Dev. 2017, 148, 100–106. [Google Scholar] [CrossRef] [PubMed]
- Li, W.; Germain, R.N.; Gerner, M.Y. Multiplex, Quantitative Cellular Analysis in Large Tissue Volumes with Clearing-Enhanced 3D Microscopy (Ce3D). Proc. Natl. Acad. Sci. USA 2017, 114, E7321–E7330. [Google Scholar] [CrossRef] [PubMed]
- Schindelin, J.; Arganda-Carreras, I.; Frise, E.; Kaynig, V.; Longair, M.; Pietzsch, T.; Preibisch, S.; Rueden, C.; Saalfeld, S.; Schmid, B.; et al. Fiji: An Open-Source Platform for Biological-Image Analysis. Nat. Methods 2012, 9, 676–682. [Google Scholar] [CrossRef] [PubMed]
- Nagy, N.; Goldstein, A.M. Endothelin-3 Regulates Neural Crest Cell Proliferation and Differentiation in the Hindgut Enteric Nervous System. Dev. Biol. 2006, 293, 203–217. [Google Scholar] [CrossRef] [PubMed]
- Weskamp, G.; Reichardt, L.F. Evidence That Biological Activity of NGF Is Mediated through a Novel Subclass of High Affinity Receptors. Neuron 1991, 6, 649–663. [Google Scholar] [CrossRef]
- Dutt, S.; Cassoly, E.; Dours-Zimmermann, M.T.; Matasci, M.; Stoeckli, E.T.; Zimmermann, D.R. Versican V0 and V1 Direct the Growth of Peripheral Axons in the Developing Chick Hindlimb. J. Neurosci. 2011, 31, 5262–5270. [Google Scholar] [CrossRef] [PubMed][Green Version]
- Riddle, R.D.; Johnson, R.L.; Laufer, E.; Tabin, C. Sonic Hedgehog Mediates the Polarizing Activity of the ZPA. Cell 1993, 75, 1401–1416. [Google Scholar] [CrossRef]
- Chiang, C.; Litingtung, Y.; Lee, E.; Young, K.E.; Corden, J.L.; Westphal, H.; Beachy, P.A. Cyclopia and Defective Axial Patterning in Mice Lacking Sonic Hedgehog Gene Function. Nature 1996, 383, 407–413. [Google Scholar] [CrossRef] [PubMed]
- Wang, B.; Fallon, J.F.; Beachy, P.A. Hedgehog-Regulated Processing of Gli3 Produces an Anterior/Posterior Repressor Gradient in the Developing Vertebrate Limb. Cell 2000, 100, 423–434. [Google Scholar] [CrossRef]
- MacCabe, J.A.; Abbott, U.K. Polarizing and Maintenance Activities in Two Polydactylous Mutants of the Fowl: Diplopodia1 and Talpid2. J. Embryol. Exp. Morphol. 1974, 31, 735–746. [Google Scholar] [PubMed]
- Muñoz-Sanjuán, I.; Fallon, J.F.; Nathans, J. Expression and Regulation of Chicken Fibroblast Growth Factor Homologous Factor (FHF)-4 at the Base of the Developing Limbs. Mech. Dev. 2000, 95, 101–112. [Google Scholar] [CrossRef]
- Dvorak, L.; Fallon, J.F. The Talpid2 Chick Limb Has Weak Polarizing Activity and Can Respond to Retinoic Acid and Polarizing Zone Signal. Dev. Dyn. 1992, 193, 40–48. [Google Scholar] [CrossRef]
- Echelard, Y.; Epstein, D.J.; St-Jacques, B.; Shen, L.; Mohler, J.; McMahon, J.A.; McMahon, A.P. Sonic Hedgehog, a Member of a Family of Putative Signaling Molecules, Is Implicated in the Regulation of CNS Polarity. Cell 1993, 75, 1417–1430. [Google Scholar] [CrossRef]
- Roelink, H.; Augsburger, A.; Heemskerk, J.; Korzh, V.; Norlin, S.; Ruiz i Altaba, A.; Tanabe, Y.; Placzek, M.; Edlund, T.; Jessell, T.M.; et al. Floor Plate and Motor Neuron Induction by Vhh-1, a Vertebrate Homolog of Hedgehog Expressed by the Notochord. Cell 1994, 76, 761–775. [Google Scholar] [CrossRef]
- Davey, M.G.; Paton, I.R.; Yin, Y.; Schmidt, M.; Bangs, F.K.; Morrice, D.R.; Smith, T.G.; Buxton, P.; Stamataki, D.; Tanaka, M.; et al. The Chicken Talpid3 Gene Encodes a Novel Protein Essential for Hedgehog Signaling. Genes Dev. 2006, 20, 1365–1377. [Google Scholar] [CrossRef]
- Briscoe, J.; Sussel, L.; Serup, P.; Hartigan-O’Connor, D.; Jessell, T.M.; Rubenstein, J.L.R.; Ericson, J. Homeobox Gene Nkx2.2 and Specification of Neuronal Identity by Graded Sonic Hedgehog Signalling. Nature 1999, 398, 622–627. [Google Scholar] [CrossRef] [PubMed]
- Novitch, B.G.; Chen, A.I.; Jessell, T.M. Coordinate Regulation of Motor Neuron Subtype Identity and Pan-Neuronal Properties by the BHLH Repressor Olig2. Neuron 2001, 31, 773–789. [Google Scholar] [CrossRef]
- Briscoe, J.; Pierani, A.; Jessell, T.M.; Ericson, J. A Homeodomain Protein Code Specifies Progenitor Cell Identity and Neuronal Fate in the Ventral Neural Tube. Cell 2000, 101, 435–445. [Google Scholar] [CrossRef]
- Marcucio, R.S.; Cordero, D.R.; Hu, D.; Helms, J.A. Molecular Interactions Coordinating the Development of the Forebrain and Face. Dev. Biol. 2005, 284, 48–61. [Google Scholar] [CrossRef]
- Hu, D.; Marcucio, R.S.; Helms, J.A. A Zone of Frontonasal Ectoderm Regulates Patterning and Growth in the Face. Development 2003, 130, 1749–1758. [Google Scholar] [CrossRef] [PubMed]
- Abzhanov, A.; Tabin, C.J. Shh and Fgf8 Act Synergistically to Drive Cartilage Outgrowth during Cranial Development. Dev. Biol. 2004, 273, 134–148. [Google Scholar] [CrossRef] [PubMed]
- Hu, D.; Helms, J.A. The Role of Sonic Hedgehog in Normal and Abnormal Craniofacial Morphogenesis. Development 1999, 126, 4873–4884. [Google Scholar] [PubMed]
- Marcucio, R.; Hallgrimsson, B.; Young, N.M. Facial Morphogenesis: Physical and Molecular Interactions between the Brain and Face. Curr. Top. Dev. Biol. 2015, 115, 299–320. [Google Scholar] [CrossRef]
- Simeone, A.; Acampora, D.; Gulisano, M.; Stornaiuolo, A.; Boncinelli, E. Nested Expression Domains of Four Homeobox Genes in Developing Rostral Brain. Nature 1992, 358, 687–690. [Google Scholar] [CrossRef]
- Martinez, S.; Crossley, P.H.; Cobos, I.; Rubenstein, J.L.; Martin, G.R. FGF8 Induces Formation of an Ectopic Isthmic Organizer and Isthmocerebellar Development via a Repressive Effect on Otx2 Expression. Development 1999, 126, 1189–1200. [Google Scholar]
- Lupo, G.; Harris, W.A.; Lewis, K.E. Mechanisms of Ventral Patterning in the Vertebrate Nervous System. Nat. Rev. Neurosci. 2006, 7, 103–114. [Google Scholar] [CrossRef] [PubMed]
- Ramalho-Santos, M.; Melton, D.A.; McMahon, A.P. Hedgehog Signals Regulate Multiple Aspects of Gastrointestinal Development. Development 2000, 127, 2763–2772. [Google Scholar] [PubMed]
- Roberts, D.J.; Smith, D.M.; Goff, D.J.; Tabin, C.J. Epithelial-Mesenchymal Signaling during the Regionalization of the Chick Gut. Development 1998, 125, 2791–2801. [Google Scholar] [PubMed]
- Nagy, N.; Barad, C.; Graham, H.K.; Hotta, R.; Cheng, L.S.; Fejszak, N.; Goldstein, A.M. Sonic Hedgehog Controls Enteric Nervous System Development by Patterning the Extracellular Matrix. Development 2016, 143, 264–275. [Google Scholar] [CrossRef]
- Litingtung, Y.; Dahn, R.D.; Li, Y.; Fallon, J.F.; Chiang, C. Shh and Gli3 Are Dispensable for Limb Skeleton Formation but Regulate Digit Number and Identity. Nature 2002, 418, 979–983. [Google Scholar] [CrossRef]
- Hui, C.; Joyner, A.L. A Mouse Model of Greig Cephalo–Polysyndactyly Syndrome: The Extra–ToesJ Mutation Contains an Intragenic Deletion of the Gli3 Gene. Nat. Genet. 1993, 3, 241–246. [Google Scholar] [CrossRef]
- Mo, R.; Freer, A.M.; Zinyk, D.L.; Crackower, M.A.; Michaud, J.; Heng, H.H.; Chik, K.W.; Shi, X.M.; Tsui, L.C.; Cheng, S.H.; et al. Specific and Redundant Functions of Gli2 and Gli3 Zinc Finger Genes in Skeletal Patterning and Development. Development 1997, 124, 113–123. [Google Scholar] [PubMed]
- Butterfield, N.C.; Metzis, V.; McGlinn, E.; Bruce, S.J.; Wainwright, B.J.; Wicking, C. Patched 1 Is a Crucial Determinant of Asymmetry and Digit Number in the Vertebrate Limb. Development 2009, 136, 3515–3524. [Google Scholar] [CrossRef]
- Hildebrandt, F.; Benzing, T.; Katsanis, N. Ciliopathies. N. Engl. J. Med. 2011, 364, 1533–1543. [Google Scholar] [CrossRef]
- Bangs, F.; Anderson, K.V. Primary Cilia and Mammalian Hedgehog Signaling. Cold Spring Harb. Perspect. Biol. 2017, 9. [Google Scholar] [CrossRef]
- Yin, Y.; Bangs, F.; Paton, I.R.; Prescott, A.; James, J.; Davey, M.G.; Whitley, P.; Genikhovich, G.; Technau, U.; Burt, D.W.; et al. The Talpid3 Gene (KIAA0586) Encodes a Centrosomal Protein That Is Essential for Primary Cilia Formation. Development 2009, 136, 655–664. [Google Scholar] [CrossRef]
- Kobayashi, T.; Kim, S.; Lin, Y.-C.; Inoue, T.; Dynlacht, B.D. The CP110-Interacting Proteins Talpid3 and Cep290 Play Overlapping and Distinct Roles in Cilia Assembly. J. Cell Biol. 2014, 204, 215–229. [Google Scholar] [CrossRef] [PubMed]
- Davey, M.G.; Towers, M.; Vargesson, N.; Tickle, C. The Chick Limb: Embryology, Genetics and Teratology. Int. J. Dev. Biol. 2018, 62, 85–95. [Google Scholar] [CrossRef] [PubMed]
- Thauvin-Robinet, C.; Lee, J.S.; Lopez, E.; Herranz-Pérez, V.; Shida, T.; Franco, B.; Jego, L.; Ye, F.; Pasquier, L.; Loget, P.; et al. The Oral-Facial-Digital Syndrome Gene C2CD3 Encodes a Positive Regulator of Centriole Elongation. Nat. Genet. 2014, 46, 905–911. [Google Scholar] [CrossRef] [PubMed]
- Cortés, C.R.; McInerney-Leo, A.M.; Vogel, I.; Rondón Galeano, M.C.; Leo, P.J.; Harris, J.E.; Anderson, L.K.; Keith, P.A.; Brown, M.A.; Ramsing, M.; et al. Mutations in Human C2CD3 Cause Skeletal Dysplasia and Provide New Insights into Phenotypic and Cellular Consequences of Altered C2CD3 Function. Sci. Rep. 2016, 6, 24083. [Google Scholar] [CrossRef]
- Boczek, N.J.; Hopp, K.; Benoit, L.; Kraft, D.; Cousin, M.A.; Blackburn, P.R.; Madsen, C.D.; Oliver, G.R.; Nair, A.A.; Na, J.; et al. Characterization of Three Ciliopathy Pedigrees Expands the Phenotype Associated with Biallelic C2CD3 Variants. Eur. J. Hum. Genet. 2018, 26, 1797–1809. [Google Scholar] [CrossRef] [PubMed]
- Ede, D.A.; Kelly, W.A. Developmental Abnormalities in the Head Region of the Talpid3 Mutant of the Fowl. J. Embryol. Exp. Morphol. 1964, 12, 161–182. [Google Scholar]
- Ede, D.A.; Kelly, W.A. Developmental Abnormalities in the Trunk and Limbs of the Talpid3 Mutant of the Fowl. J. Embryol. Exp. Morphol. 1964, 12, 339–356. [Google Scholar] [PubMed]
- Bachmann-Gagescu, R.; Phelps, I.G.; Dempsey, J.C.; Sharma, V.A.; Ishak, G.E.; Boyle, E.A.; Wilson, M.; Marques Lourenço, C.; Arslan, M.; University of Washington Center for Mendelian Genomics; et al. KIAA0586 Is Mutated in Joubert Syndrome. Hum. Mutat. 2015, 36, 831–835. [Google Scholar] [CrossRef]
- Roosing, S.; Hofree, M.; Kim, S.; Scott, E.; Copeland, B.; Romani, M.; Silhavy, J.L.; Rosti, R.O.; Schroth, J.; Mazza, T.; et al. Functional Genome-Wide SiRNA Screen Identifies KIAA0586 as Mutated in Joubert Syndrome. eLife 2015, 4, e06602. [Google Scholar] [CrossRef] [PubMed]
- Stephen, L.A.; Tawamie, H.; Davis, G.M.; Tebbe, L.; Nürnberg, P.; Nürnberg, G.; Thiele, H.; Thoenes, M.; Boltshauser, E.; Uebe, S.; et al. TALPID3 Controls Centrosome and Cell Polarity and the Human Ortholog KIAA0586 Is Mutated in Joubert Syndrome (JBTS23). eLife 2015, 4. [Google Scholar] [CrossRef]
- Burns, A.J.; Bradshaw, L.; Freem, L.J.; Davey, M.G.; Thapar, N. Analysis of Talpid3 Mutant Chicken Embryos Reveals Defects in Gut and Enteric Nervous System Development; Blackwell Publishing Ltd.: London, UK, 2009; Volume 21, p. III. [Google Scholar]
- Delalande, J.; Campbell, A.; Thapar, N.; Burns, A. Defects in Gut and Enteric Nervous System Development in Talpid3 Mutant Chicken. Cilia 2012, 1, P85. [Google Scholar] [CrossRef][Green Version]
- Bangs, F.; Antonio, N.; Thongnuek, P.; Welten, M.; Davey, M.G.; Briscoe, J.; Tickle, C. Generation of Mice with Functional Inactivation of Talpid3, a Gene First Identified in Chicken. Development 2011, 138, 3261–3272. [Google Scholar] [CrossRef] [PubMed]
- Ben, J.; Elworthy, S.; Ng, A.S.M.; van Eeden, F.; Ingham, P.W. Targeted Mutation of the Talpid3 Gene in Zebrafish Reveals Its Conserved Requirement for Ciliogenesis and Hedgehog Signalling across the Vertebrates. Development 2011, 138, 4969–4978. [Google Scholar] [CrossRef] [PubMed]
- Borycki, A.G.; Brunk, B.; Tajbakhsh, S.; Buckingham, M.; Chiang, C.; Emerson, C.P. Sonic Hedgehog Controls Epaxial Muscle Determination through Myf5 Activation. Development 1999, 126, 4053–4063. [Google Scholar]
- Münsterberg, A.E.; Kitajewski, J.; Bumcrot, D.A.; McMahon, A.P.; Lassar, A.B. Combinatorial Signaling by Sonic Hedgehog and Wnt Family Members Induces Myogenic BHLH Gene Expression in the Somite. Genes Dev. 1995, 9, 2911–2922. [Google Scholar] [CrossRef]
- Yusuf, F.; Brand-Saberi, B. The Eventful Somite: Patterning, Fate Determination and Cell Division in the Somite. Anat. Embryol. 2006, 211 (Suppl. 1), 21–30. [Google Scholar] [CrossRef]
- Johnson, R.L.; Laufer, E.; Riddle, R.D.; Tabin, C. Ectopic Expression of Sonic Hedgehog Alters Dorsal-Ventral Patterning of Somites. Cell 1994, 79, 1165–1173. [Google Scholar] [CrossRef]
- Huycke, T.R.; Miller, B.M.; Gill, H.K.; Nerurkar, N.L.; Sprinzak, D.; Mahadevan, L.; Tabin, C.J. Genetic and Mechanical Regulation of Intestinal Smooth Muscle Development. Cell 2019, 179, 90–105.e21. [Google Scholar] [CrossRef] [PubMed]
- Bandyopadhyay, A.; Tsuji, K.; Cox, K.; Harfe, B.D.; Rosen, V.; Tabin, C.J. Genetic Analysis of the Roles of BMP2, BMP4, and BMP7 in Limb Patterning and Skeletogenesis. PLoS Genet. 2006, 2. [Google Scholar] [CrossRef] [PubMed]
- Timmer, J.R.; Wang, C.; Niswander, L. BMP Signaling Patterns the Dorsal and Intermediate Neural Tube via Regulation of Homeobox and Helix-Loop-Helix Transcription Factors. Development 2002, 129, 2459–2472. [Google Scholar]
- Torihashi, S.; Hattori, T.; Hasegawa, H.; Kurahashi, M.; Ogaeri, T.; Fujimoto, T. The Expression and Crucial Roles of BMP Signaling in Development of Smooth Muscle Progenitor Cells in the Mouse Embryonic Gut. Differentiation 2009, 77, 277–289. [Google Scholar] [CrossRef] [PubMed]
- Lewandoski, M.; Sun, X.; Martin, G.R. Fgf8 Signalling from the AER Is Essential for Normal Limb Development. Nat. Genet. 2000, 26, 460–463. [Google Scholar] [CrossRef]
- Szabo-Rogers, H.L.; Geetha-Loganathan, P.; Nimmagadda, S.; Fu, K.K.; Richman, J.M. FGF Signals from the Nasal Pit Are Necessary for Normal Facial Morphogenesis. Dev. Biol. 2008, 318, 289–302. [Google Scholar] [CrossRef] [PubMed]
- Megason, S.G.; McMahon, A.P. A Mitogen Gradient of Dorsal Midline Wnts Organizes Growth in the CNS. Development 2002, 129, 2087–2098. [Google Scholar] [PubMed]
- Muroyama, Y.; Fujihara, M.; Ikeya, M.; Kondoh, H.; Takada, S. Wnt Signaling Plays an Essential Role in Neuronal Specification of the Dorsal Spinal Cord. Genes Dev. 2002, 16, 548–553. [Google Scholar] [CrossRef]
- Dickinson, M.E.; Krumlauf, R.; McMahon, A.P. Evidence for a Mitogenic Effect of Wnt-1 in the Developing Mammalian Central Nervous System. Development 1994, 120, 1453–1471. [Google Scholar]


Publisher’s Note: MDPI stays neutral with regard to jurisdictional claims in published maps and institutional affiliations. |
© 2021 by the authors. Licensee MDPI, Basel, Switzerland. This article is an open access article distributed under the terms and conditions of the Creative Commons Attribution (CC BY) license (http://creativecommons.org/licenses/by/4.0/).
Share and Cite
Brooks, E.C.; Bonatto Paese, C.L.; Carroll, A.H.; Struve, J.N.; Nagy, N.; Brugmann, S.A. Mutation in the Ciliary Protein C2CD3 Reveals Organ-Specific Mechanisms of Hedgehog Signal Transduction in Avian Embryos. J. Dev. Biol. 2021, 9, 12. https://doi.org/10.3390/jdb9020012
Brooks EC, Bonatto Paese CL, Carroll AH, Struve JN, Nagy N, Brugmann SA. Mutation in the Ciliary Protein C2CD3 Reveals Organ-Specific Mechanisms of Hedgehog Signal Transduction in Avian Embryos. Journal of Developmental Biology. 2021; 9(2):12. https://doi.org/10.3390/jdb9020012
Chicago/Turabian StyleBrooks, Evan C., Christian Louis Bonatto Paese, Anne H. Carroll, Jaime N. Struve, Nandor Nagy, and Samantha A. Brugmann. 2021. "Mutation in the Ciliary Protein C2CD3 Reveals Organ-Specific Mechanisms of Hedgehog Signal Transduction in Avian Embryos" Journal of Developmental Biology 9, no. 2: 12. https://doi.org/10.3390/jdb9020012
APA StyleBrooks, E. C., Bonatto Paese, C. L., Carroll, A. H., Struve, J. N., Nagy, N., & Brugmann, S. A. (2021). Mutation in the Ciliary Protein C2CD3 Reveals Organ-Specific Mechanisms of Hedgehog Signal Transduction in Avian Embryos. Journal of Developmental Biology, 9(2), 12. https://doi.org/10.3390/jdb9020012