Abstract
The atmospheric electric field is an important physical parameter used to study the state of charge density distribution between the earth and the ionosphere, and its daily variation characteristics reflect the underlying atmospheric electrical properties in a region. In this paper, we used atmospheric electric field data from three global observation stations (the Xanthi station, the Zhuanghe station, and the University of Reading station) from January to December 2021 and then combined these data with meteorological data and geomagnetic activity data to filter the fair-day atmospheric electric field data and plot the average fair-weather atmospheric electric field curve. Then, we compared different sunrise and sunset times and PM 2.5 concentrations, analyzed the seasonal differences for each station, the differences among the three stations, and the difference between their curves and the Carnegie curve, and finally concluded that the difference among them showed positive correlations with PM 2.5 concentrations. The other possible reasons and the entire shape of the average fair-weather atmospheric electric field curve for a defined station are not affected by the season, including the location of peaks and valleys, and the overall variation have been also revealed.
1. Introduction
The atmospheric electric field (AEF) is an important physical phenomenon in the field of atmospheric physics and space physics. As the ground carries negative charges and the atmosphere contains net positive charges, there is an electric field in the atmosphere at all times, which is known as the AEF. On a global average, the AEF value is approximately 100~200 V/m on a fair day, and the direction of the AEF on a fair day is vertically downward toward the ground. A total of 1800 simultaneous thunderstorms worldwide can generate an upward current of approximately 1 A to the ionosphere, and the upward current maintains a potential difference between the ionosphere and the ground, and the ionospheric potential has daily variations [1].
The AEF has a sensitive response to changes in various meteorological elements, local geological conditions, solar activities, human activities, and so on. When there are lightning activities [2,3,4,5,6] or clouds [7,8], AEF will show values on the order of kV/m. The AEF can be easily changed by precipitation [9], air pollutants [10,11,12,13], solar activities [14,15,16], geomagnetic activities [17,18], and so on. AEFs have been studied for many years, and researchers have summarized many methods for measuring AEFs, such as flat plate antenna measurements, sounding observations, ground-based rotating electric field meters, sphere-borne double sphere electric field meters, and microrocket electric field meters. Currently, the most popular method is an electric field mill (EFM), which provides the opportunity for faster measurements with multiple options for meteorological conditions. The EFM measures the electric field using the principle that the induced charges in the environmental electric field have been generated when a metal sheet rotates, then the AEF values can be obtained by measuring the weak electrical signals caused by the induced charges. In addition, it is installed outdoors and exposed to the atmosphere. The sensor plates are electrodes that are alternately shielded and exposed to the AEF [19].
The diurnal variation of the global ionospheric potential overhead drives a current density downward which creates the observed AEF at any location. In the absence of diurnal variation in convection over the ocean, the diurnal variation in AEF is the same as that of the ionospheric potential, with a maximum near 20 UT and a minimum near 4 UT, which is the shape of the “Carnegie curve” [20]. Shaista Afreen et al. [21] studied AEF data for the period from June 2019 to May 2020 at Gulmarg station (34°05′ N; 74°42′ E), Kashmir, a research area with high thunderstorm activity and very high radon concentrations. They plotted the fair-weather average AEF variation curve for 58 fair-weather days and compared them with other regions. Zhou et al. [22] conducted clear-sky atmospheric electric field observations on a high mountain at a distance of 170 m from the Gaisburg Tower in Austria, and the observations were analyzed comparatively for different terrains. The correction factors due to topographic factors were discussed. Wu et al. [9] discussed and analyzed the characteristics of near-surface AEFs under different weather conditions using the data observed on the roof of the Physics Building of Peking University from August 2004 to November 2005. They surmised that the fair-weather average AEF variation curves under fair-weather conditions in Beijing were “double peaks, double valleys”, with valleys occurring at 05:00 and 12:00 (BJT, UT + 8) and peaks at 07:00 and 23:00 (BJT, UT + 8). Similarly, Burns et al. [23] conducted a long-term observational study of the AEF at Vostok, Antarctica (78.5° S, 107° E), selecting 720 days of AEF data collected under clear-sky conditions during 1998–2002 and analyzing the daily, seasonal, and annual characteristics of the clear-sky AEF in this region in detail.
A comparison of the characteristics of AEFs in several regions under fair-weather conditions can help researchers analyze different local effects and the distribution of space charges, which is important in near-surface environment exploration. In this paper, AEF observations from three different global stations and their fair-weather average AEF variation curves are compared, and their relationship with PM 2.5 concentrations and other possible physical reasons for the different results are also discussed, as these results are important for atmospheric electrostatic environment detection.
2. Definition of Fair Weather
To study the benchmark curve of fair-weather AEFs, it is necessary to clearly define fair days, incorporating clear quantitative criteria to uniquely determine and classify fair days. However, this definition varies among different research situations. For example, Zhang et al. [24] defined fair weather as the absence of precipitation, the absence of low clouds, an average wind speed of less than 4 m/s, and less than 3/8 cumulus clouds in the sky. The fair-weather criteria are also given in detail by Harrison and Nicoll [25] based on atmospheric conditions: (1) the visual range should be 2 to 5 km or greater, and the relative humidity should be less than 95%; (2) there should be no low stratus clouds and negligible cumuliform clouds; and (3) the wind speed near the surface should be between 1–7 m/s. In addition, Israelsson et al. [26] considered weather conditions with electric field values between 0 and 250 V/m as fair weather due to the lack of corresponding meteorological data in their atmospheric electrical observation experiments at the Marsta Observatory in Sweden. Referring to the definition of fair weather above, we use the following criteria in this paper: (1) no precipitation; (2) the maximum value in the hourly average of relative humidity cannot exceed 95%; (3) the maximum value in the hourly average of wind speed cannot exceed 7 m/s; and (4) the value of AEF is between 0 and 1 kV/m.
3. Method
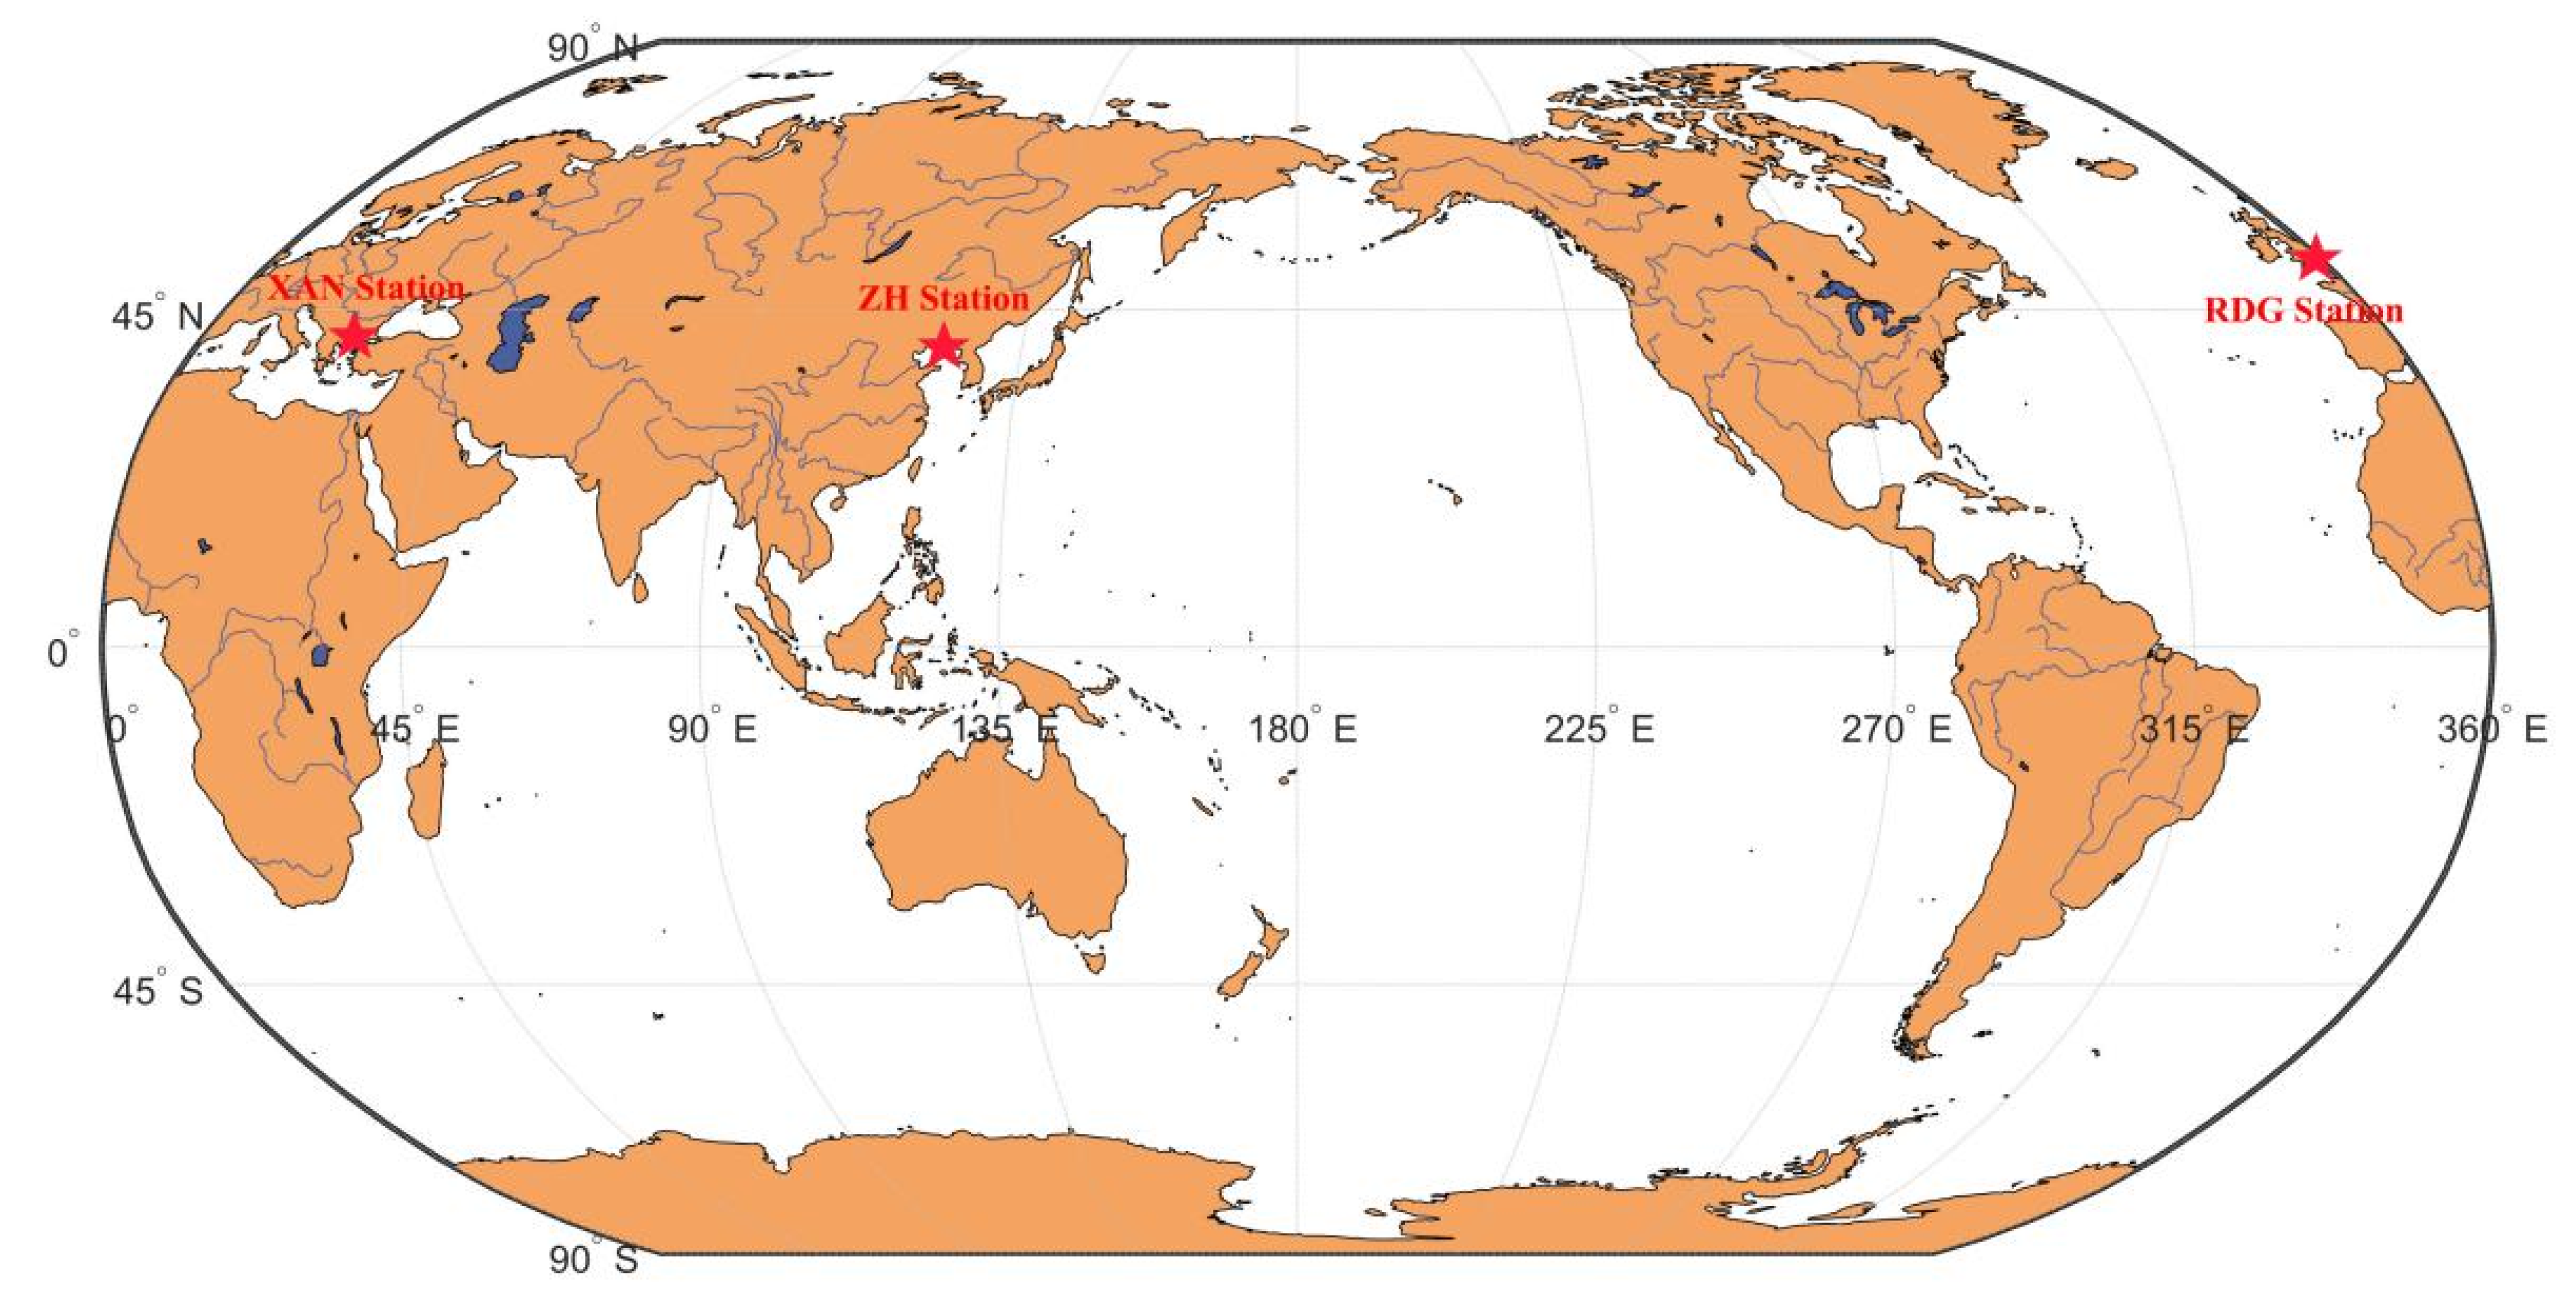
To compare the fair-weather average AEF variation curves of different regions worldwide and the electric field meters of different organizations, we chose three AEF stations: the Xanthi station (XAN), the Zhuanghe station (ZH), and the University of Reading station (RDG). The geographical locations of these three stations are shown in Figure 1, and the red pentagons represent the locations of stations XAN, ZH, and RDG, which are located in Europe and Asia. More detailed station information is shown in Table 1. They belong to different organizations, different countries, and different observatories with different electric field meters, but they are all located at mid-latitudes, and their altitudes are between 0 and 100 m. In addition, the longitudes of these three stations are different and far away from each other, and in terms of latitudes, the ZH Station and the XAN station have basically the same latitudes, while the RDG station differs greatly from these two.
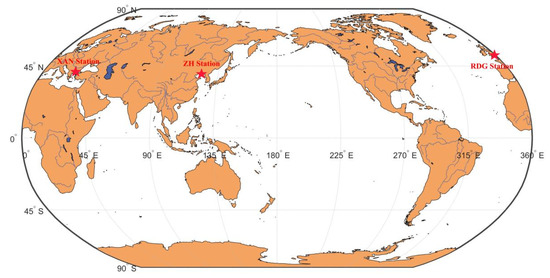
Figure 1.
Map of the global locations of the RDG station, the XAN station, and the ZH station (the three red stars indicate the stations.).

Table 1.
Basic information and locations of the instruments at the three stations.
The electric field instruments used at these three stations vary. The JCI 131 Chilworth instrument used at the RDG station has high precision (<1.5%), low noise, and a stable zero, and its accuracy is within ±1.5% full-scale deflection (FSD). For a measurement range of 0–21,000 V/m of the Campbell CS110 used at the XAN station, the resolution is 3 V/m, the sensitivity is 12 μV/m, and the noise is 4 V/m. For the measurement range of 21,000–212,000 V/m of Campbell CS110, the resolution is 30 V/m, the sensitivity is 118 μV/m, and the noise is 18 V/m. The accuracy of the Campbell CS110 is ±1% of the reading. Unlike these instruments, the ZH station used the EFM 100 with a measurement range of ±50 kV/m, measurement accuracy < 5%, response time < 1 s, linearity < 1%, and resolution of 10 V/m. By comparing the AEF data from these three stations, it is clear that the JCI 131 and CS 110 instruments are more accurate and responsive than the EFM 100, but in weather with abundant lightning activity, the AEF values measured by the JCI 131 and CS 110 instruments are smoother, while the EFM 100 instrument is more responsive and sensitive than they are.
It is well known that aerosol concentration is important for AEF values [27,28] and that its daily variation is influenced by sunrise and sunset times. The average sunrise time (SRT) and sunset time (SST) in January–March, April–June, July–September, and October–December for these three stations are shown in Table 2. In January–March, SRT (RDG) = SRT (ZH) + 7.9 h = SRT (XAN) + 2.6 h, SST (RDG) = SST (ZH) + 7.1 h = SST (XAN) + 2 h. In April–June, SRT (RDG) = SRT (ZH) + 6.9 h = SRT (XAN) + 2.8 h, SST (RDG) = SST (ZH) + 7.9 h = SST (XAN) + 3.8 h. In July–September, SRT (RDG) = SRT (ZH) + 7.1 h = SRT (XAN) + 2.9 h, SST (RDG) = SST (ZH) + 7.9 h = SST (XAN) + 3.6 h. In October–December, SRT (RDG) = SRT (ZH) + 7.7 h = SRT (XAN) + 2.7 h, SST (RDG) = SST (ZH) + 7 h = SST (XAN) + 2.1 h. On average, SRT (RDG) = SRT (ZH) + 7.4 h = SRT (XAN) + 2.7 h, SST (RDG) = SST (ZH) + 7.5 h = SST (XAN) + 2.9 h. In terms of daytime duration, the RDG station has the longest daytime, followed by the XAN station and finally the ZH station, and their differences are minimal. Then, the duration of daytime in April–June and July–September is 3.2–5.9 h longer than that in other seasons.

Table 2.
Sunrise and sunset times in different seasons in 2021 for the three stations.
Data from January to December 2021 for the three stations were counted. The data from the RDG and XAN stations are one data point per minute, and the data from the ZH station are one data point per second. To perform a comparative study, we divided this time period into four parts: January–March, April–June, July–September, and October–December. According to the definition of fair-weather conditions above and the validity of the data, the statistical results are shown in Table 3. An effective day is a day in which there is no data loss for more than 1 h in a continuous period. For these three stations, the XAN station had more data loss, and the ZH station had the least loss. At the RDG station, the highest number of fair-weather days occurred during April–June, which was 49 days, accounting for 53.8% of the effective days. For the ZH station, the greatest number of fair days was during July–September, which was 50 days, accounting for 64.1%. The largest percentage of fair days at the XAN station was July–September, with 16 fair days accounting for 42.1% of the effective days.

Table 3.
Statistics of effective days and fair-weather days at the three stations.
4. Results
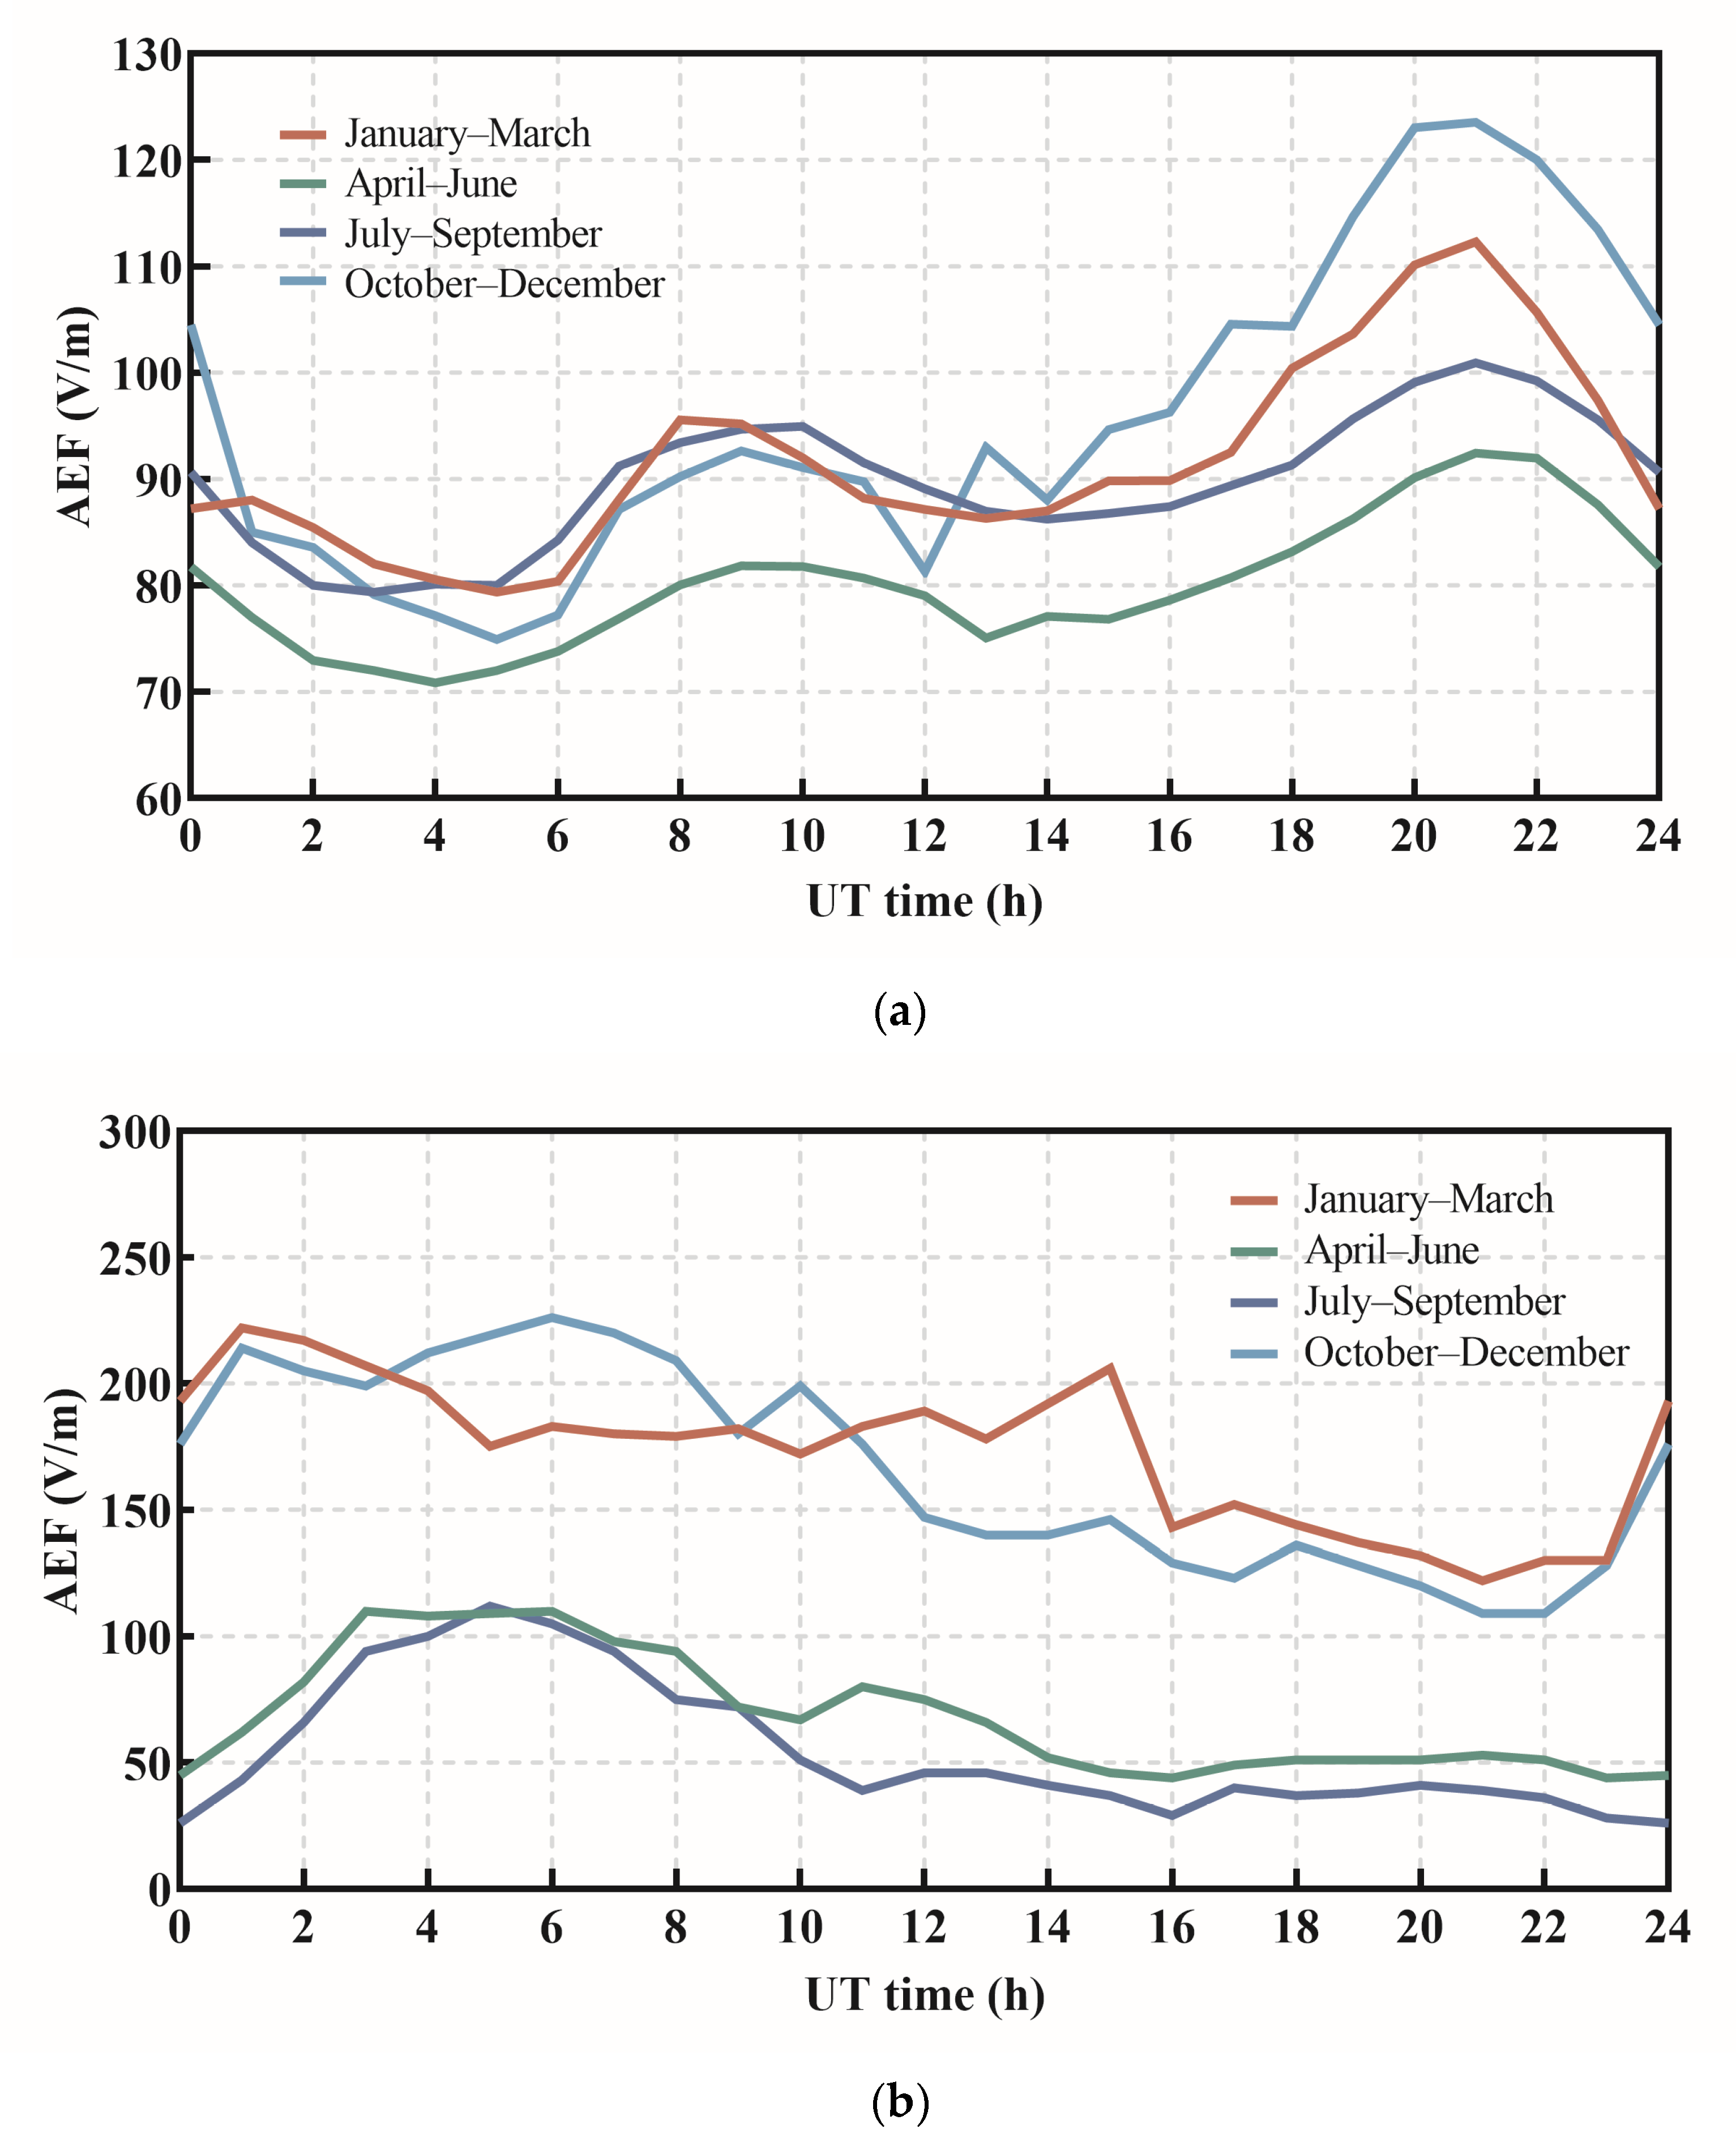
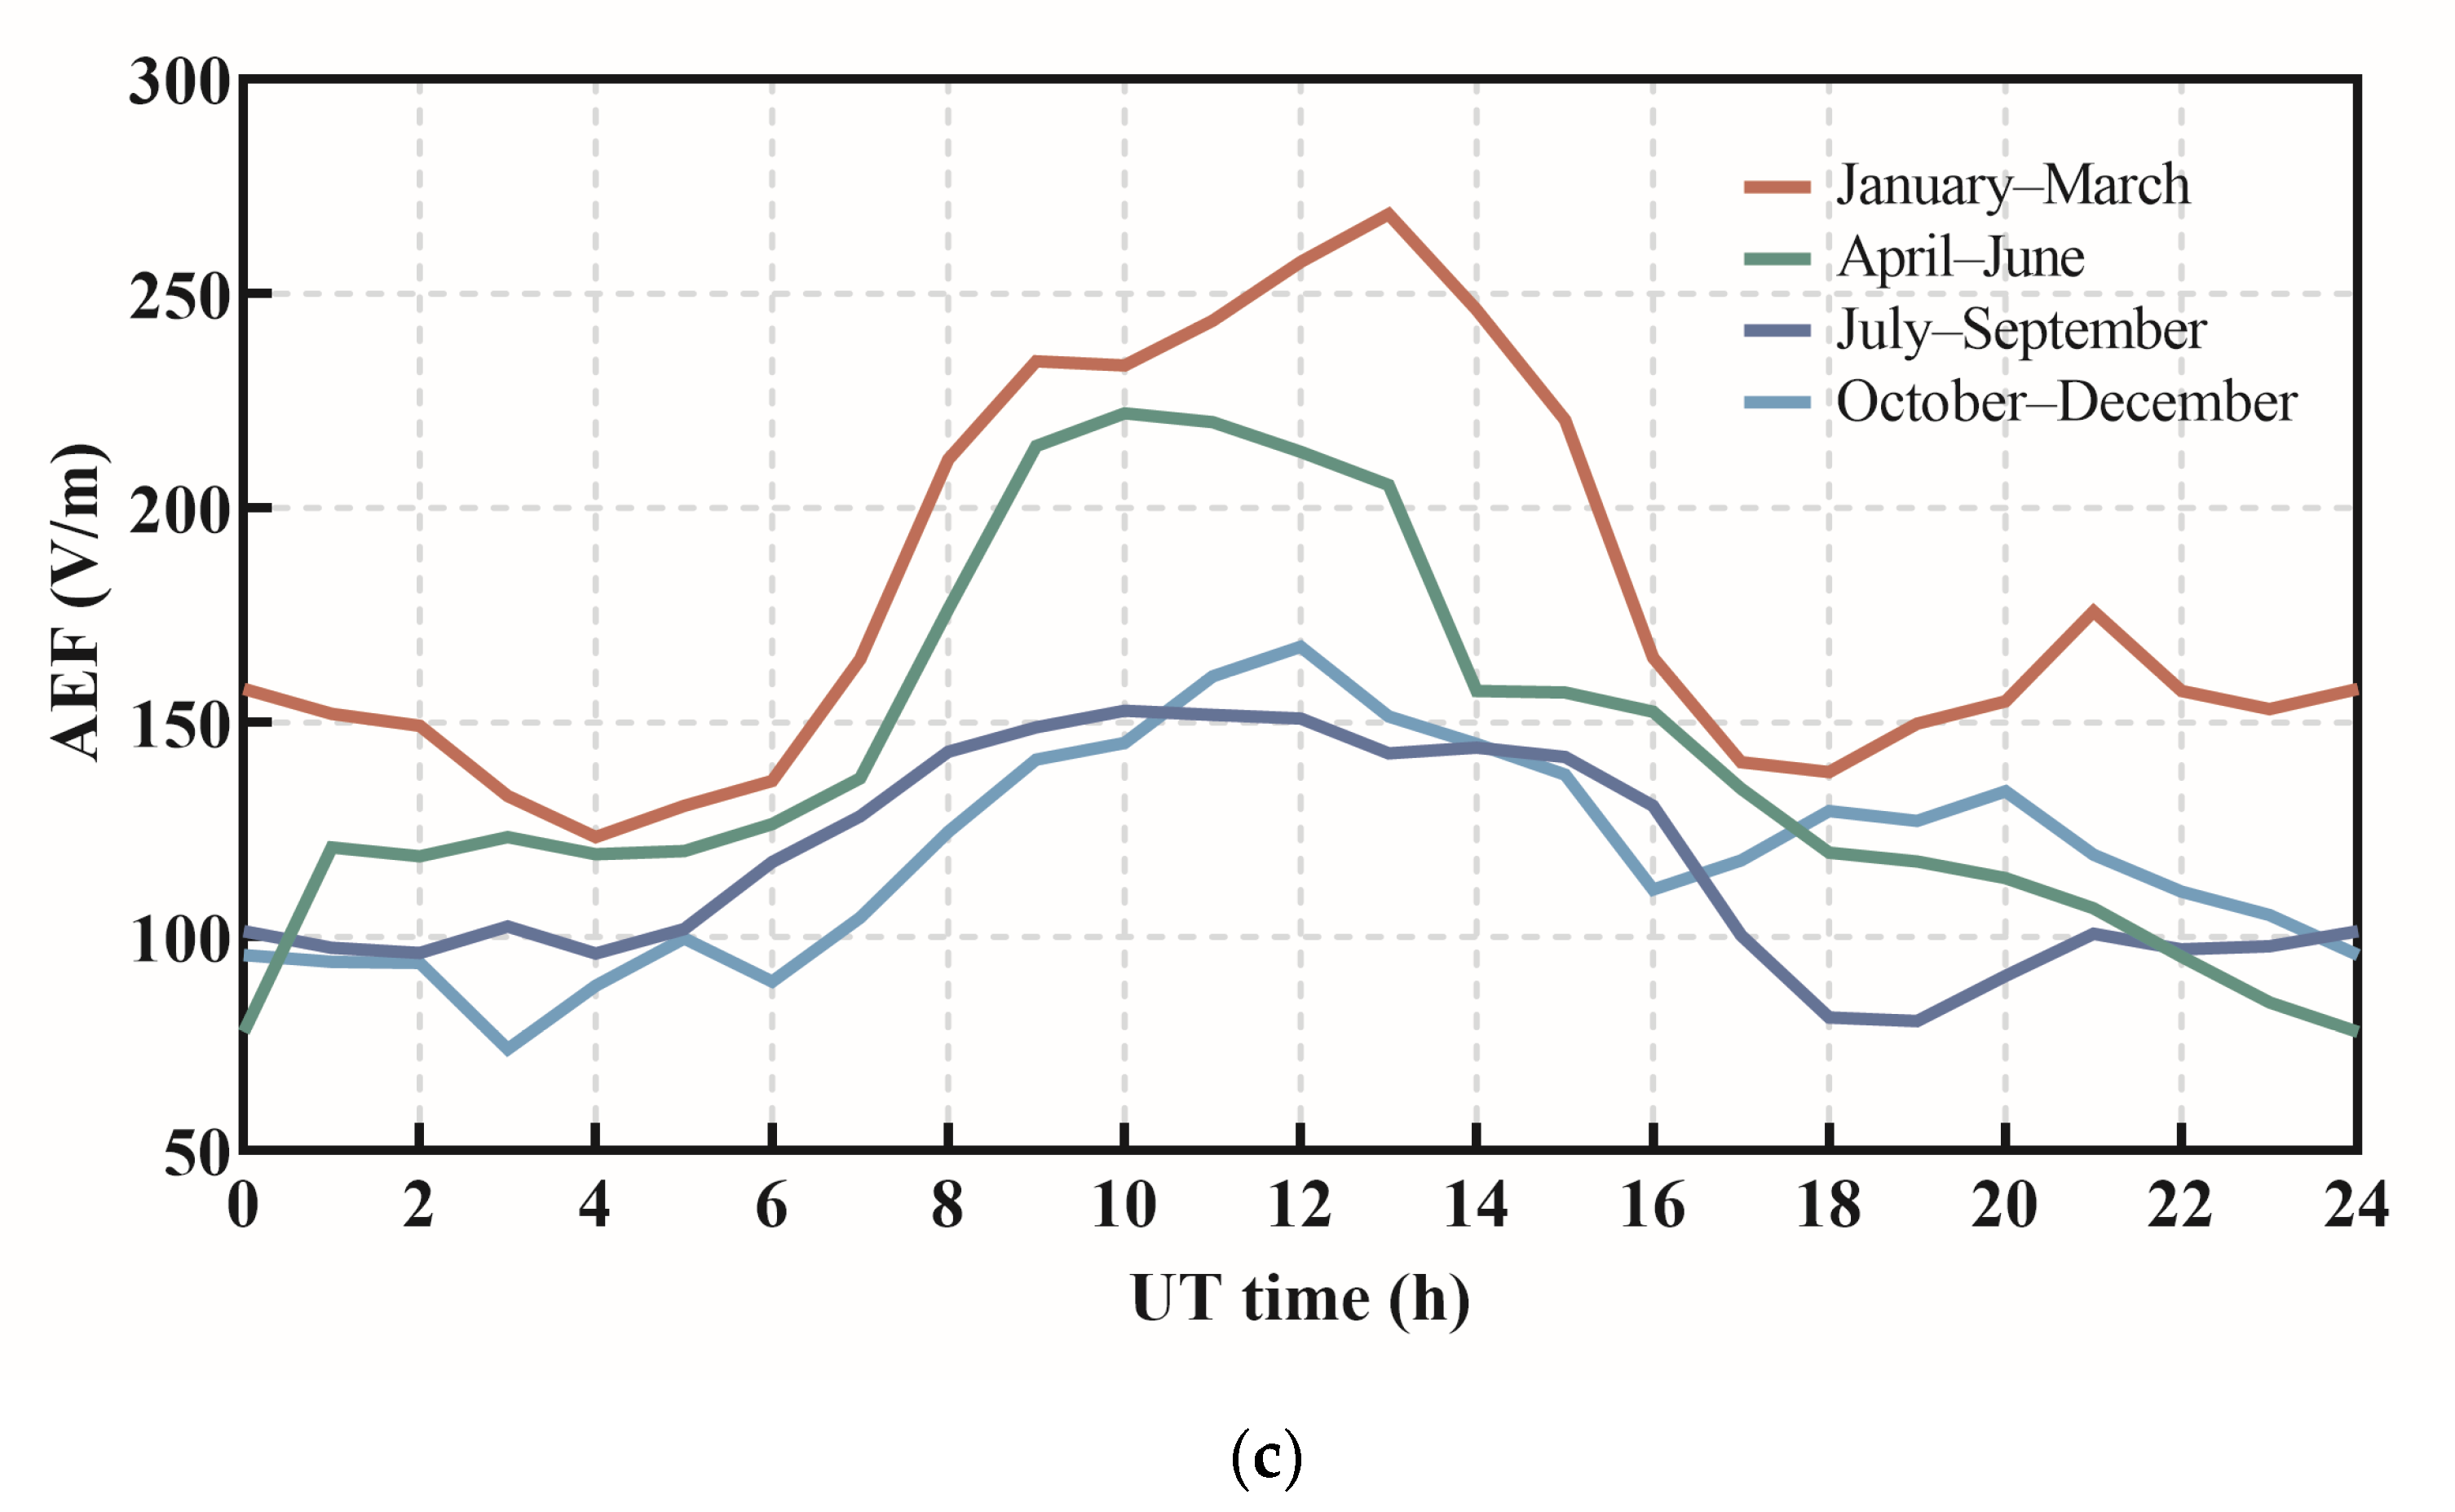
The data from these three stations from January to December 2021, excluding data anomalies and non-clear days, will be plotted as a fair-weather average AEF variation curve for each three-month average of clear days for these three stations, as shown in Figure 2. Figure 2a–c corresponds to the RDG station, ZH station, and XAN station, respectively. The vertical coordinate corresponds to the value of the AEF, and the horizontal coordinate indicates UT time, with red indicating January–March, green representing April–June, dark blue being July–September, and light blue indicating October–December.
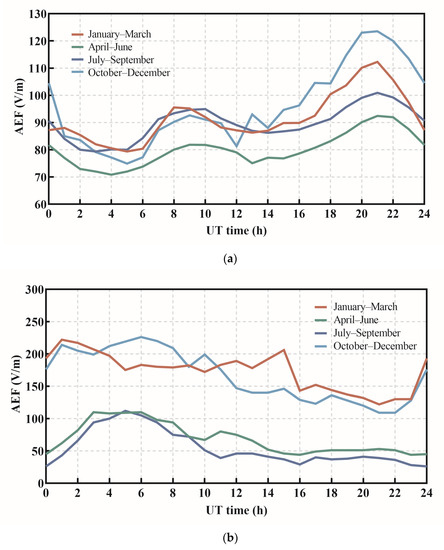
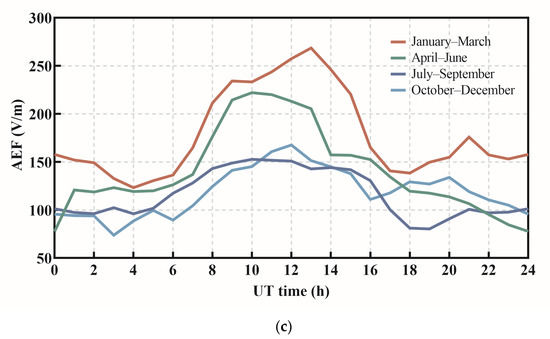
Figure 2.
The daily variation curves of the average fair-weather AEF in different seasons for the RDG station, the ZH station, and the XAN station in 2021 ((a–c) correspond to the RDG station, the ZH station, and the XAN station, respectively. The red curve indicates January–March, the green curve represents April–June, the dark blue curve is July–September, and the light blue curve indicates October–December.).
In Figure 2a, signifying strong convection at 8 UT to 20 UT, and the four different colored curves are all characterized by “double peaks, double valleys”, with the January–March, October–December, and July–September curves being nearly identical, and they are higher than the April–June curve before 12 UT. Between 12 UT and 24 UT, the October–December curve is the highest, followed by the January–March curve, the July–September curve, and the April–June curve. In Figure 2b, the values in Jan.-Mar. and October–December are much higher than expected from the Carnegie curve, while the other two curves’ values are similar to the Carnegie curve, signifying strong convection at 5 UT, and the four different colored curves are all characterized by a “single peak, single valley”. At most moments, similar to those between 12 UT and 24 UT in Figure 2a, the January–March and October–December curves are the highest. A submaximal value appears at 15 UT of the January–March curve, which may be caused by artificial aerosols. While Figure 2c is quite different from Figure 2a,b, the four different colored curves are different: the January–March and July–September curves are “double peaks, double valleys”, while the April–June and October–December curves are a “single peak, single valley”. The January–March curve is the highest, followed by the April–June curve, and the July–September curve is nearly the same as the October–December curve. By comparing their curves with the meteorological conditions, for the RDG station, the results of the ranking of the percentage of fair days are April–June > July–September > January–March > October–December, which is the opposite trend from that shown in Figure 2a. For the ZH station, the ranking of the percentage of fair days is October–December > January–March > July–September > April–June, and this is the same as the results in Figure 2b. For the XAN station, there is signifying strong convection from 8 UT to 14 UT, again in the middle of the day local time. In addition, the ranking of the percentage of fair days is July–September > January–March > October–December > April–June, which is different from the results in Figure 2c. In Figure 2a, the January–March, April–June, July–September, and October–December peaks and valleys are consistent with each other. The same is true for Figure 2b,c except for some minor differences due to unavoidable systematic errors. The measurement data will be jittered with large values for a short time sometimes, caused by the measurement instrument; this can lead to minor errors in the results. Therefore, it can be concluded that the fair-weather average AEF variation curves for different regions on Earth vary, their annual variation characteristics vary, and the relationship between annual variation and meteorological conditions also varies. For a certain region, the AEF values vary for different seasons, but their curves are the same shape.
By comparing Figure 2a and Table 2, the peaks of the January–March, April–June, July–September, and October–December curves all correspond to 8 UT and 20 UT, and their valleys correspond to 4 UT and 12 UT, which have little correlation with the sunrise and sunset times of the RDG station, as do the results of the other two stations for comparison. This finding indicates that the shape of the fair-weather average AEF variation curves (including peak and valley corresponding times and values) in a defined area is not entirely determined by sunrise and sunset times but by local content and varied compositions of underground radioactive matter.
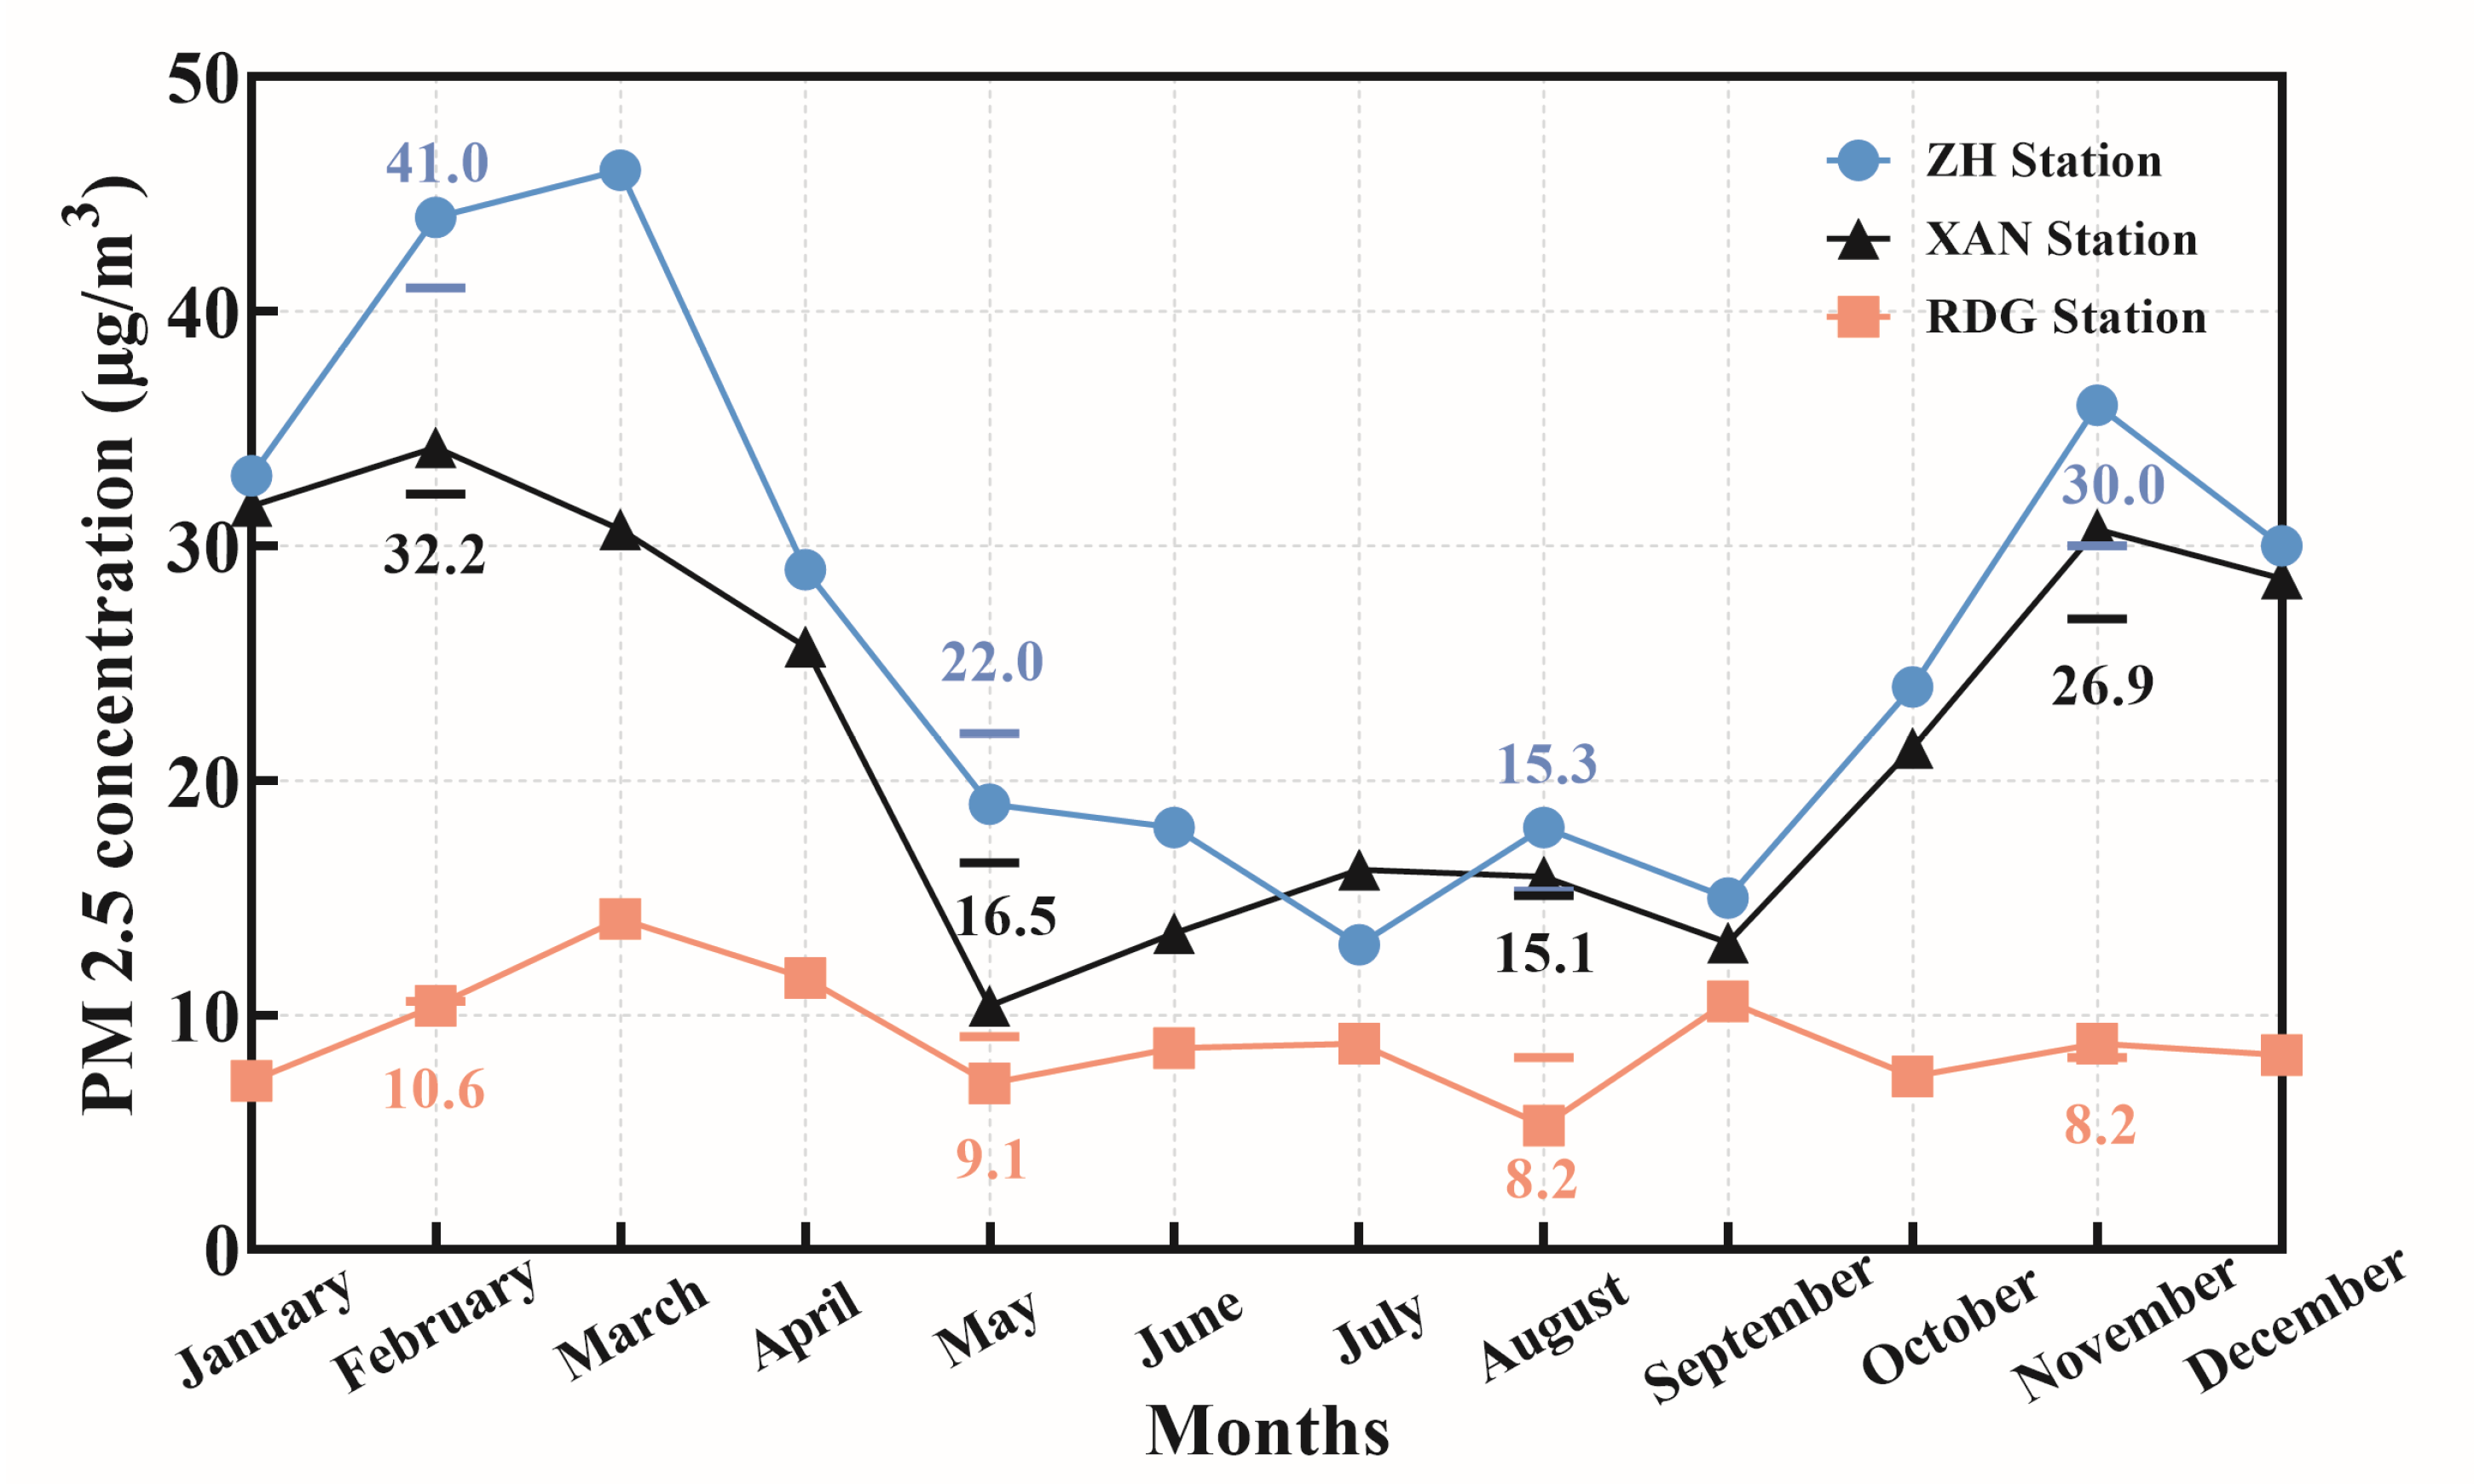
To reveal the reason for the differences in the average fair-weather AEF daily variation for various seasons and various locations, the average PM 2.5 concentration for every month has been counted and plotted, as shown in Figure 3. In Figure 3, the average concentrations for different seasons have been shown as the short horizontal lines and digits beside them. Based on Figure 3, it can be clearly seen that the variability of PM 2.5 concentration in different seasons for the RDG station was only 2.4 μg/m3, which was stable compared to that for the other two stations. In addition, the variability of fair-weather AEF in different seasons in Figure 2a was no more than 32 V/m, which was also stable. For the average PM 2.5 concentration at the ZH Station, the ranking was January–March > October–December > April–June > July–September, which was consistent with the fair-weather AEF diurnal variation curves of ZH station. For the XAN station, the highest AEF Jan.-Mar. curve corresponded the maximum PM 2.5 concentration with 32.2 μg/m3. Although April–June curve and July–September curve were close with their close PM 2.5 concentrations, which made a significant difference for the October–December curve and April–June curve. Only at 18 UT–21 UT were the AEF curves of different seasons at the XAN station consistent with the curves of PM 2.5 concentration. This discrepancy can be attributed to a data error, which was caused by the less sunny days at the XAN station.
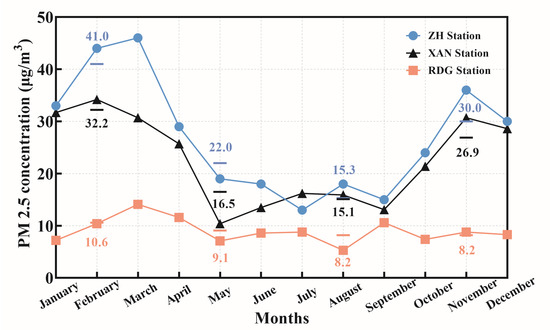
Figure 3.
Mean monthly PM 2.5 concentrations at the ZH station, the XAN station, and the RDG station in 2021 (the short horizontal lines and digits beside them are the average concentrations corresponding to different seasons.).
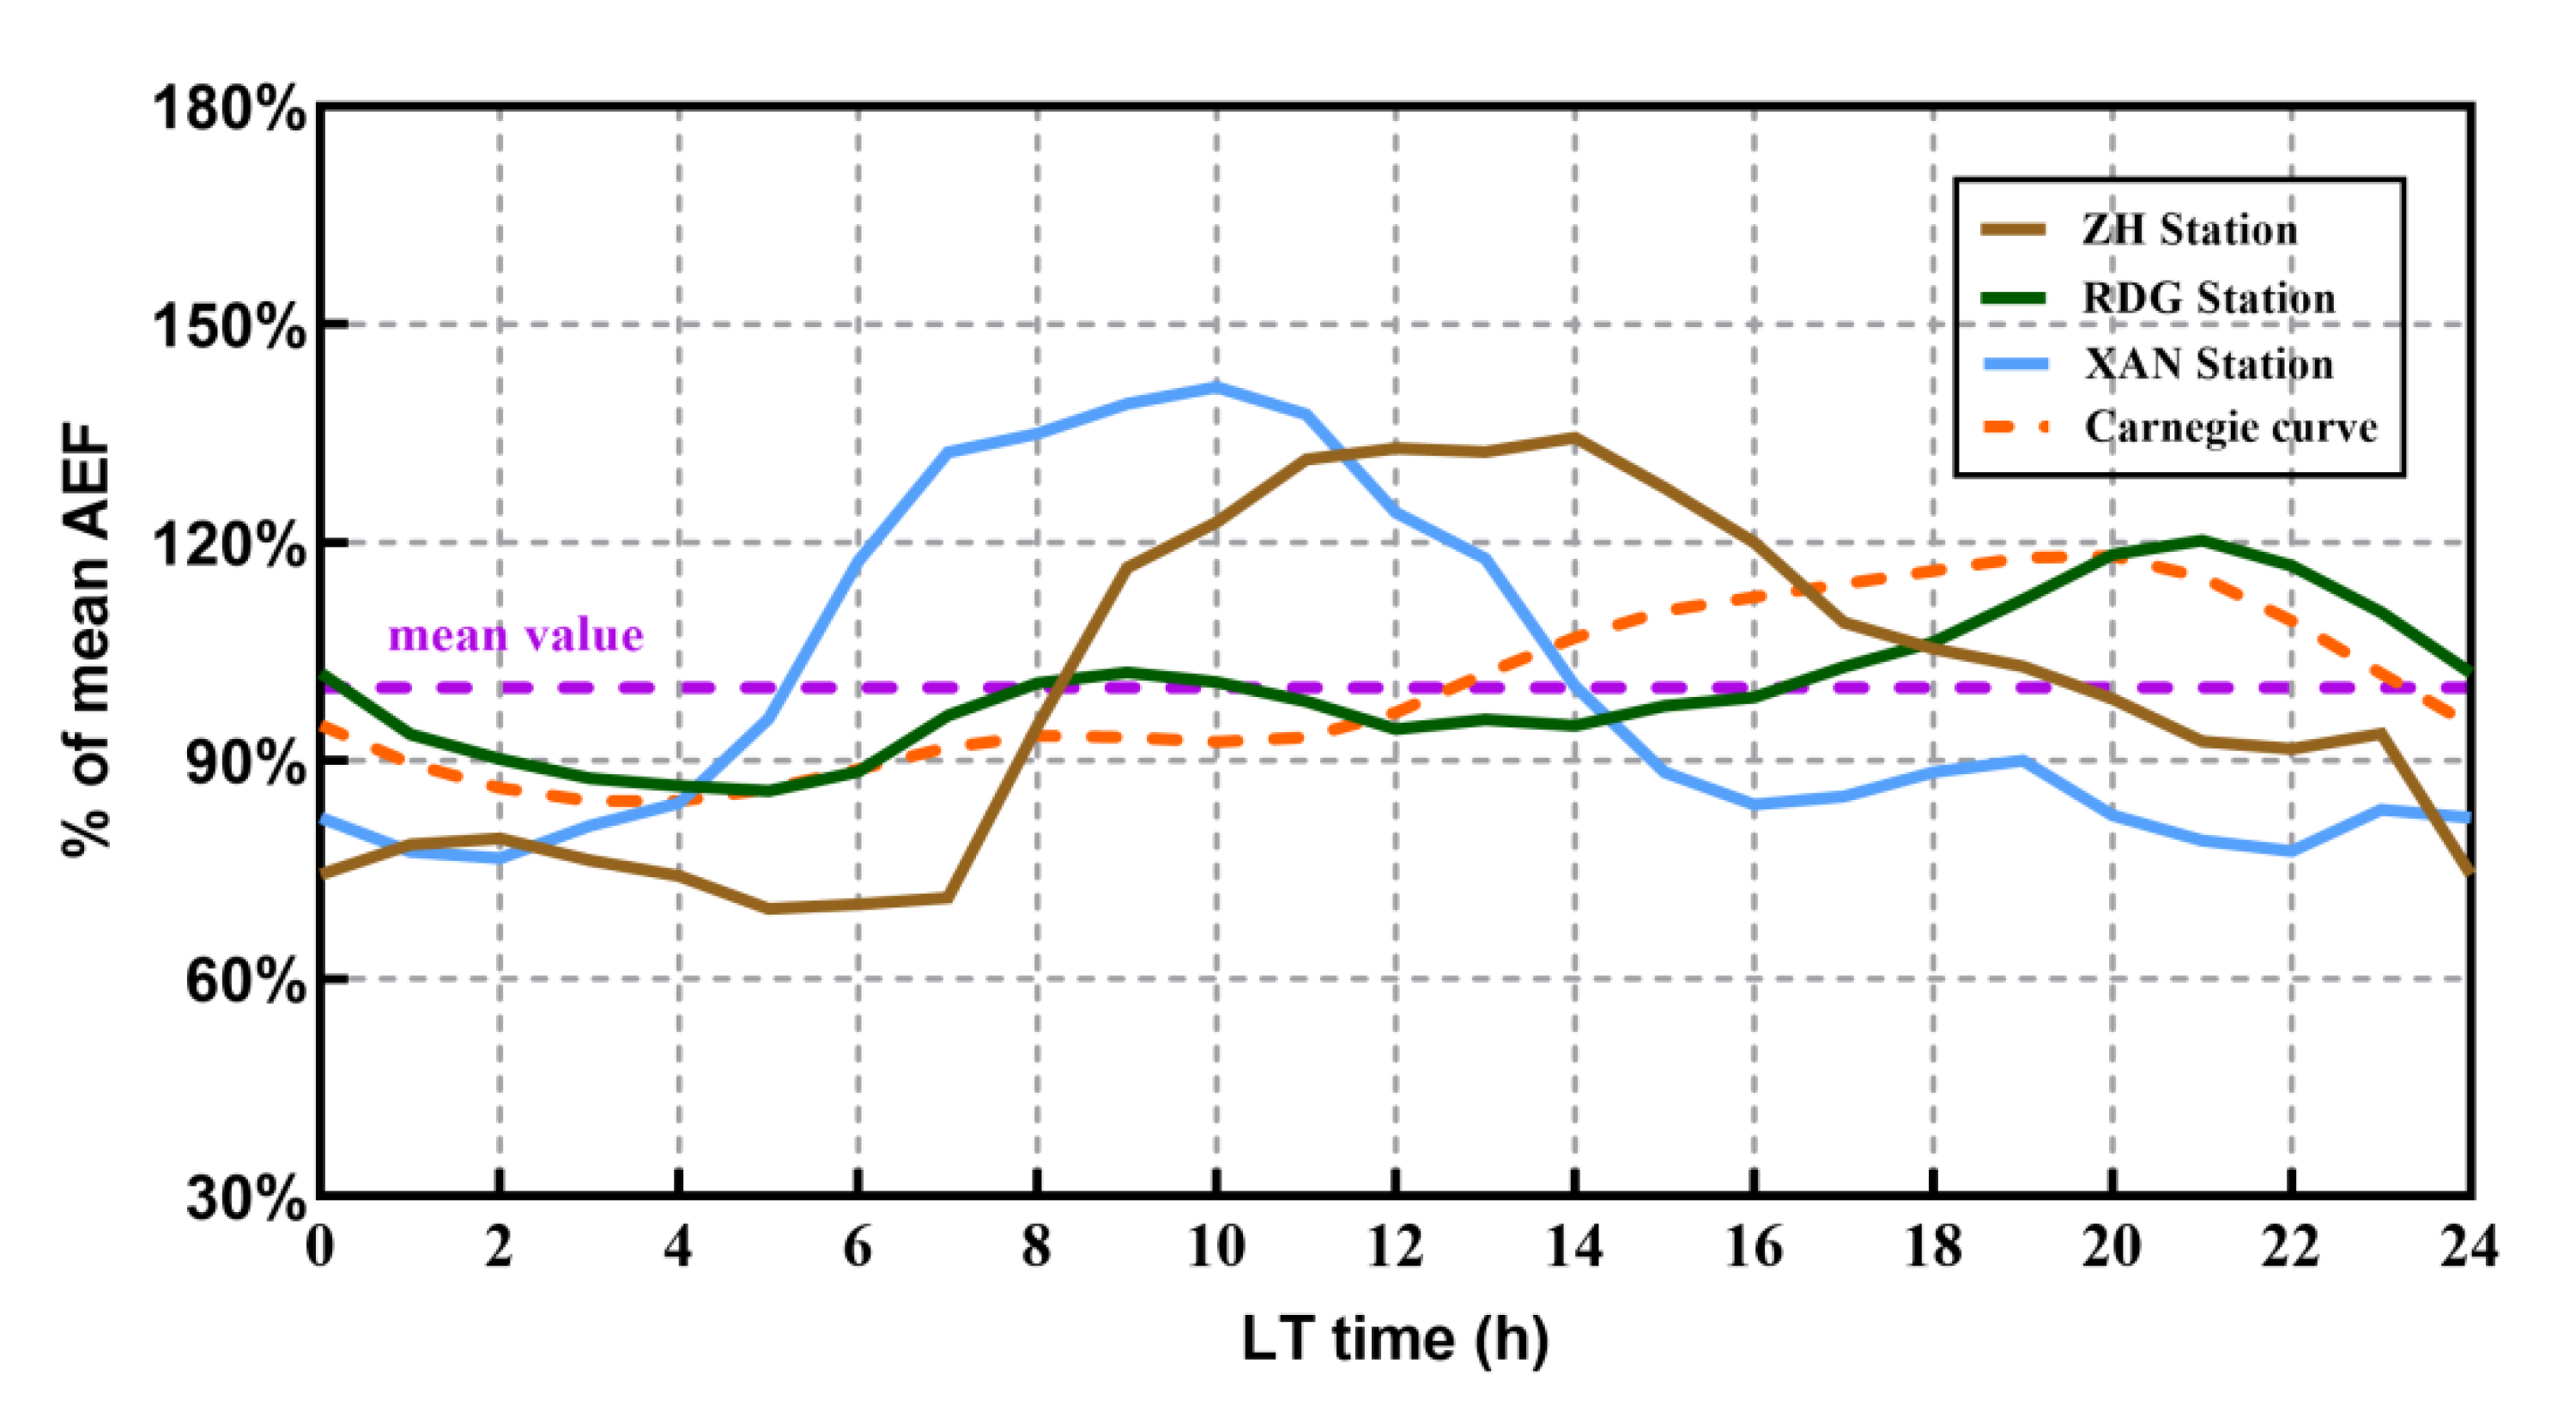
The daily variations at the RDG, ZH, and XAN stations were averaged to obtain the total fair-weather average AEF variation curve, which makes the mean value of the AEF 100% for the three stations, as shown in Figure 4. In Figure 4, the horizontal axis represents the LT time, and the vertical axis represents the percentage of atmospheric electric field/mean atmospheric electric field. The brown curve represents the percentage curve of average fair-weather AEF daily variation of the ZH station, the blue curve represents the curve of the XAN station, and the green curve represents the curve of RDG station, and the purple dashed line indicates the mean value (100%).
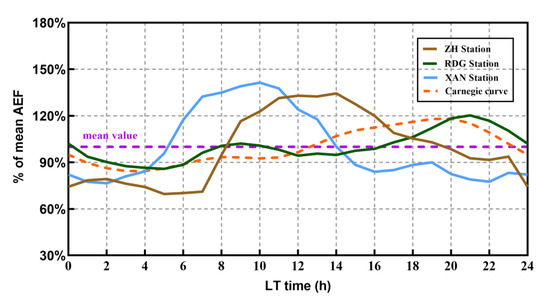
Figure 4.
Average AEF daily variation on fair days at the RDG station, the ZH station, and the XAN station from 1 January to 31 December 2021 (the vertical coordinate is the percentage of atmospheric electric field/mean atmospheric electric field, and the brown curve indicates the percentage curve of average fair-weather AEF daily variation for the ZH station, the blue curve represents the XAN station, the green curve is the curve for the RDG station, and the orange curve is the Carnegie curve.).
First, these three curves have different characteristics: the curve of the ZH station is a “single peak, single valley”, the curve of the RDG station is “double peaks, double valleys”, and the fair-weather average AEF variation curve of XAN station is between them; it resembles both a “single peak, single valley” curve and a “double peaks, double valleys” curve. Then, the values of these three curves are quite different; the maximum average AEF from January to December 2021 was at the XAN station, which was 139.5 V/m. The average AEF at the ZH station was 116.0 V/m and that at the RDG station was 89.2 V/m. Comparing it with the results in Figure 3, the researchers can find that the average PM 2.5 concentrations were 9 μg/m3, 27 μg/m3, 22.7 μg/m3 for the RDG, ZH, and XAN stations, respectively. The average PM 2.5 concentration at the RDG station was less than that at the other two stations, and the PM 2.5 concentration at the ZH station was close to the XAN station. This was consistent with the difference in the average fair-weather AEF values. Third, the fair-weather average AEF variation curve at the RDG station is smooth, with small fluctuations, but the curves for the ZH station and the XAN station fluctuate widely. In Figure 4, considering the mean value of the AEF as 100% for the three stations, the variation amount at the ZH station and the XAN station were the same with 64.8% of the mean AEF, which was only 34.4% for the RDG station. The ZH and XAN stations had a large range of variation and strong fluctuations; however, the RDG station has the weakest fluctuations. Similarly, it can be compared with Figure 3 and it can be found that the average PM 2.5 concentrations were also consistent with the fluctuations in the fair-weather AEF diurnal variation.
For the ZH station, from 0 LT to 14 LT in the morning, the AEF values increased to the peak value at 14 UT in the noon with 156.0 V/m with the increased aerosol concentration. Then, from 14 LT to 24 LT in the evening, the atmosphere stabilized, the aerosols gathered near the ground, the aerosol concentration increased, and the AEF increased. Then, for the XAN station, its curve characteristics were similar to the ZH station, from 2 LT to 10 LT and the AEF increased to the peak value of 197.3 V/m at 10 LT as the aerosol concentration increased. Because of active thermal convection and turbulent vertical transport from 10 LT to 22 LT, the near-surface aerosol concentration decreased, and the AEF decreased to the valley value of 108.2 V/m. Between 22 LT and 2 LT the next morning, the atmosphere stabilized, and the AEF stabilized and slowly decreased. At the RDG station, from 4 LT to 8 LT, the aerosols gathered near the ground. Additionally, the aerosol concentration and AEF increased, with the maximum peak of 91.1 V/m appearing at approximately 8 LT. From 8 LT to 13 LT, due to strong radiation from the sun, the vertical transport of thermal convection and turbulence was active, aerosols were continuously transported upward from near the ground, the near-surface aerosol concentration continuously decreased, and the near-surface AEF reached the minimum valley of 84.6 V/m at 13 LT. Then, from 13 LT to 20 LT, the upper aerosol concentration was greater than that near the ground. Due to atmospheric pressure, aerosols were vertically transported, and the aerosol concentration near the ground again increased. Then, the AEF also increased, reaching another peak at 20 LT. From 20 LT to 4 LT the following day, the atmosphere gradually stabilized, and the aerosol concentration decreased. In addition, the AEF decreased to another valley at 4 LT.
5. Discussion
Comparing the fair-weather average AEF variation curves for the RDG station, the XAN station, the ZH station, and the Carnegie curve observed over the global oceans [20], the curve at the RDG station is similar to the Carnegie curves because much more stringent criteria were used with the RDG data to eliminate local convective effects. The diurnal AEF variation at the XAN and RDG stations were more drastic than the Carnegie curve, but their mean electric field values were all in the range of 100–150 V/m. The violent fluctuations were the result of the influence of charged particles carried by artificial aerosols and dust. Moreover, their peaks correspond to different LT times presumably related to convective processes arising due to sunrise and sunset.
For the curves observed from the Vostok and Concordia Antarctic stations [29,30], they had a valley value in the morning and a peak value in the evening for UTC time, which were consistent with the curves of the RDG station and Carnegie curve. They all have an average daily variation in the atmospheric electric field in the range of 100–200 V/m, which is agree with the curves at the XAN and ZH stations, except for peak and valley times. It is worth noting that the Vostok and Concordia stations at high altitudes on an ice sheet have negligible aerosol concentrations, no radon, and no convection except for a few hours around noon in midsummer. The Vostok and Concordia curves agree in diurnal variation with the RDG station and would be even better than the RDG and Carnegie curves to use as a clean, fair-weather reference for the basic diurnal variations due to the global ionospheric potential.
6. Conclusions
By comparing the different curves in Figure 2, Figure 3 and Figure 4 the conclusion can be summarized as follows. (1) The fair-weather average AEF variation curves annual variation characteristics for the RDG station, the XAN station, and the ZH station are diverse, and for the three global stations, the relationship between annual variation and meteorological conditions is also varied. The ZH and XAN stations have strong fluctuations, while the RDG station has the weakest fluctuations. Then, their curves are represented by two different types: the curves at the ZH station and the XAN station are a “single peak, single valley”, while the curve at the RDG station is “double peaks, double valleys,” and the differences in these curves showed an approximate positive correlation with PM 2.5 concentrations. Their different average AEF values are not only determined mainly by the local PM 2.5 concentration but are also affected by the local content and varied compositions of underground radioactive matter, such as radon gas. For a certain region, radon nuclei decay to emit alpha particles which ionize the local atmosphere and positively and negatively charged particles are injected close to the surface. This process changes the distribution of spatial charge density and disturbs the AEF value. (2) In different seasons at a certain station, the AEF fair-weather average AEF variation curves have the same shape even for different sunrise and sunset times. This finding means that the shapes of different fair-weather average AEF variation curves in different seasons in a certain area depend on local PM 2.5 concentration and the varied content and the compositions of underground radioactive matter, including the peak and valley corresponding times and values. (3) The AEF peak and valley values of the mean fair-weather AEF variation curves for the three stations correspond to significantly different times, which is partly due to the differences in sunrise and sunset times caused by different latitudes and longitudes and partly due to the pollution sources and artificial aerosols around the stations, which have an impact on the changes in PM 2.5 concentrations and thus on the daily changes in the AEF. (4) The lowest average value of the AEF is 89.2 V/m for the RDG station, followed by 116.0 V/m for the ZH station, and the maximum average value of the AEF is 139.5 V/m for the XAN station. In addition to the apparent positive correlation with PM 2.5, it can be also affected as follows: i. because of the latitudinal difference among the RDG, ZH, and XAN stations, there is a certain horizontal potential difference between the bottom of the ionosphere at different latitudes; ii. these three stations are in different countries and different regions, and their compositions and contents of radioactive substances underground differ significantly, which leads to differences in the ionization degree in the atmosphere; in turn, this affects the charge density distribution and AEF values; and iii. the current density is given by Ohm’s Law, Jz = Vi/R, where R is the whole column resistance from the surface to the ionosphere at that location and time. The conduction current (Jz) in the atmosphere is approximately constant in altitude at a particular time and location but varies with time during each day, as the overhead ionospheric potential (Vi) varies. There are also differences in the ionospheric potential over these three stations, which can affect the average values of their AEFs.
To summarize, to study the atmospheric electrostatic features in different regions worldwide, researchers collected AEF data, instrument data, meteorological data, geomagnetic data, PM 2.5 data, and sunrise and sunset times from three stations (the RDG station, the XAN station, and the ZH station) worldwide for 2021, filtered the AEF data based on the criteria of clear days and magnetic storms, and finally obtained their average daily variation in clear days in different seasonal curves. The differences in these curves were compared with meteorological characteristics, sunrise and sunset time differences, and PM 2.5 concentration, the differences in the mean fair-weather AEF curves of these three stations and the difference between their curves and Carnegie curve were summarized, and the reasons were discussed. Furthermore, for a given station, the shapes of the Carnegie curves in different seasons were almost the same, and only the peak and trough values differed. In the future, the researchers will study the relationship between the electrical properties of the atmosphere and space weather activity in more depth, including the correlation between changes in high-energy particle precipitation during magnetic storms and changes in the AEF.
Author Contributions
T.C. conceptualized the study. L.L. processed and analyzed the data. T.C. and L.L. prepared the original draft with contributions from all authors. J.S., S.T., S.W., C.C., W.L. and J.L. were responsible for the discussions. All authors have read and agreed to the published version of the manuscript.
Funding
This research was funded by the Strategic Priority Research Program of the Chinese Academy of Sciences, Grant No. XDA17010301, XDA15052500, and XDA15350201, and by the National Natural Science Foundation of China, Grant No. 41874175 and 41931073. The authors thank the Chinese Meridian Project, Ground-Based Space Environment Monitoring Network (Meridian Project II), the Specialized Research Fund for State Key Laboratories and Pandeng Program of NSSC, and the International Partnership Program of the Chinese Academy of Sciences (Grant No. 183311KYSB20200003).
Data Availability Statement
All data used during the study are available online in accordance with funder data retention policies (https://doi.org/10.57760/sciencedb.o00009.00179 (accessed on 8 September 2022)).
Acknowledgments
We appreciate the National Centre for Atmospheric Science and National Centre for Earth Observation (https://catalog.ceda.ac.uk) for providing atmospheric electric field and meteorological observations for the RDG station and the XAN station and the website (www.Meteomanz.com) for providing meteorological observations for the ZH station. In addition, the website (www.timeanddate.com) provided sunrise and sunset times, IQAir (www.iqair.com) and AQI Study (https://www.aqistudy.cn) provided average PM2.5 concentrations, and the Geomagnetic Data Service (https://wdc.kugi.kyoto-u.ac.jp/index.html) provided the Dst data.
Conflicts of Interest
The authors declare that they have no competing interests.
References
- Qie, X.S.; Zhang, Q.L.; Yuan, T. Lightning Physics, 1st ed.; Science Press: Beijing, China, 2013. [Google Scholar]
- Mach, D.M.; Blakeslee, R.J.; Bateman, M.G. Global electric circuit implications of combined aircraft storm electric current measurements and satellite-based diurnal lightning statistics. J. Geophys. Res. Atmos. 2011, 116. [Google Scholar] [CrossRef]
- Blakeslee, R.J.; Mach, D.M.; Bateman, M.G.; Bailey, J.C. Seasonal variations in the lightning diurnal cycle and implications for the global electric circuit. Atmos. Res. 2014, 135–136, 228–243. [Google Scholar] [CrossRef]
- Zhang, J.; Zhang, Y.; Liu, C. Atmospheric electric field characteristics of lightning activity in complex terrain areas of Sichuan Province. Highl. Mt. Meteorol. Res. 2021, 41, 5. [Google Scholar]
- Qiang, Y.; Yang, L.; Jiang, Y. Characterization of atmospheric electric field in different weather processes in Lishui. Meteorol. Hydrol. Oceanogr. Instrum. 2021, 38, 4. [Google Scholar]
- Huang, H.; Yuan, C.; Ma, X. Spatial and temporal distribution of atmospheric electric field in Anshun City and its characteristics under different weather conditions. Power Data 2021, 24, 10. [Google Scholar]
- Tinsley, B.A.; Burns, G.; Zhou, L. The role of the global electric circuit in solar and internal forcing of clouds and climate. Adv. Space Res. 2007, 40, 1126–1139. [Google Scholar] [CrossRef]
- Nicoll, K.A.; Harrison, R.G. Stratiform cloud electrification: Comparison of theory with multiple in-cloud measurements. Q. J. R. Meteorol. Soc. 2016, 142, 2679–2691. [Google Scholar] [CrossRef]
- Wu, T.; Lv, W.T.; Liu, X.Y. Characteristics of Near-Ground Atmospheric Electric Fields under Different Weather Conditions in Beijing. J. Appl. Meteorol. Sci. 2009, 20, 394–401. [Google Scholar]
- Zhang, H.M.; Zhang, Y.J.; Yang, S.G. Atmospheric electric field and its relationship with air pollutants in Taiyuan area. J. Environ. Sci. 2013, 36, 95. [Google Scholar]
- Li, J.; Chen, X.; Cheng, Y.; Li, R.; Dong, F. Preliminary Study on the Relationship between Atmospheric Electric Field and Air Pollutants in Beijing. Plateau Weather 2020, 1–10. [Google Scholar] [CrossRef]
- Bennett, A.J.; Harrison, R.G. Variability in surface atmospheric electric field measurements. J. Phys. Conf. Ser. 2008, 142, 012046. [Google Scholar] [CrossRef]
- De, S.; Paul, S.; Barui, S.; Pal, P.; Bandyopadhyay, B.; Kala, D.; Ghosh, A. Studies on the seasonal variation of atmospheric electricity parameters at a tropical station in Kolkata, India. J. Atmos. Sol. Terr. Phys. 2013, 105, 135–141. [Google Scholar] [CrossRef]
- Shumilov, O.I.; Kasatkina, E.A.; Frank-Kamenetsky, A.V. Effects of extraordinary solar cosmic ray events on variations in the atmospheric electric field at high latitudes. Geomagn. Aeron. 2015, 55, 650–657. [Google Scholar] [CrossRef]
- Li, R.; Chen, T.; Luo, J.; Zhou, L.; He, X.; Wang, C.; Sun, Y. Enhancement of High Energy Electron Fluxes and Variation of Atmospheric Electric Field in the Antarctic Region. Chin. J. Space Sci. 2016, 36, 40–48. [Google Scholar] [CrossRef]
- Tacza, J.; Raulin, J.P.; Mendonça, R.; Makhmutov, V.; Marun, A.; Fernández, G. Solar Effects on the Atmospheric Electric Field During 2010–2015 at Low Latitudes. J. Geophys. Res. Atmos. 2018, 123, 11–970. [Google Scholar] [CrossRef]
- Anisimov, S.V.; Shikhova, N.M.; Kleimenova, N.G. Response of a Magnetospheric Storm in the Atmospheric Electric Field of the Midlatitudes. Geomagn. Aeron. 2021, 61, 180–190. [Google Scholar] [CrossRef]
- Mikhailovaa, G.A.; Kapustinaa, O.V.; Smirnovb, S.E. Effects of Solar and Geomagnetic Activities in Variations of Power Spectra of Electrical and Meteorological Variables in the Near Surface Atmosphere in Kamchatka during October 2003 Solar Events. Geomagn. Aeron. 2014, 54, 645–654. [Google Scholar] [CrossRef]
- Luo, F.; He, Y.; Zhang, J.; Guo, H.; Chen, D. The new inverted electric field mill. Chin. J. Space Sci. 2004, 470–474. [Google Scholar]
- Harrison, R.G. The Carnegie Curve. Surv. Geophys. 2013, 34, 209–232. [Google Scholar] [CrossRef]
- Afreen, S.; Victor, J.; Nazir, S.; Bashir, G.; Ahmad, N.; Ahmad, S.; Singh, R. Fair-weather atmospheric electric field measurements at Gulmarg, India. J. Earth Syst. Sci. 2022, 131, 1–19. [Google Scholar] [CrossRef]
- Zhou, H.; Diendorfer, G.; Thottappillil, R.; Pichler, H. Fair-weather atmospheric electric field measurements at the Gaisberg Mountain in Austria. In Proceedings of the Electromagnetics Research Symposium Proceedings, Marrakesh, Morocco, 20–23 March 2011; p. 1303. [Google Scholar]
- Burns, G.B.; Frank-Kamenetsky, A.V.; Troshichev, O.A.; Bering, E.A.; Reddell, B.D. Interannual consistency of bi-monthly differences in diurnal variations of the ground-level vertical electric field. J. Geophys. Res. Atmos. 2005, 110. [Google Scholar] [CrossRef]
- Zhang, Y.; Zhang, W.; Wang, Z. Analysis of fair-weather atmospheric electric field over Eurasian Continent. Trans. Atmos. Sci. 2015, 38, 703–709. [Google Scholar]
- Harrison, R.G.; Nicoll, K.A. Fair weather criteria for atmospheric electricity measurements. J. Atmos. Sol. Terr. Phys. 2018, 179, 239–250. [Google Scholar] [CrossRef]
- Israelsson, S.; Tammet, H. Variation of fair weather atmospheric electricity at Marsta Observatory, Sweden, 1993–1998. J. Atmos. Sol. Terr. Phys. 2001, 63, 1693–1703. [Google Scholar] [CrossRef]
- Kubicki, M.; Odzimek, A.; Neska, M. Relationship of ground-level aerosol concentration and atmospheric electric field at three observation sites in the Arctic, Antarctic and Europe. Atmos. Res. 2016, 178, 329–346. [Google Scholar] [CrossRef]
- Sun, J. Basics of Atmospheric Electricity; Meteorological Press: Beijing, China, 1987. [Google Scholar]
- Burns, G.B.; Tinsley, B.A.; Frank Kamenetsky, A.V.; French, W.J.R.; Klekocuik, A.R. Monthly global circuit estimates derived from Vostok electric field measurements adjusted for local meteorological and solar wind influences. J. Atmos. Sci. 2012, 69, 2061–2082. [Google Scholar] [CrossRef]
- Burns, G.B.; Frank Kamenetsky, A.V.; Tinsley, B.A.; French, W.J.R.; Grigioni, P.; Camporeale, G.; Bering, E.A. Atmospheric global circuit variations from Vostok and Concordia Electric field measurements. J. Atmos. Sci. 2017, 74, 783–800. [Google Scholar] [CrossRef]
Disclaimer/Publisher’s Note: The statements, opinions and data contained in all publications are solely those of the individual author(s) and contributor(s) and not of MDPI and/or the editor(s). MDPI and/or the editor(s) disclaim responsibility for any injury to people or property resulting from any ideas, methods, instructions or products referred to in the content. |
© 2023 by the authors. Licensee MDPI, Basel, Switzerland. This article is an open access article distributed under the terms and conditions of the Creative Commons Attribution (CC BY) license (https://creativecommons.org/licenses/by/4.0/).

