Article

Isopimaric Acid Derivatives as Potential Dual PPARα/γ Agonists in the Treatment of Metabolic Syndrome

by
Mikhail E. Blokhin
1,*,
Sergey A. Borisov
1,
Mariia A. Gromova
1,
Yulia V. Meshkova
1,
Nataliya A. Zhukova
1,
Sophia V. Nikonova
2,
Igor P. Zhurakovsky
3,
Olga A. Luzina
1,
Mikhail V. Khvostov
1,2,
Dmitry A. Kudlay
4,5,6 and
Nariman F. Salakhutdinov
1
1
N. N. Vorozhtsov Novosibirsk Institute of Organic Chemistry, Siberian Branch of the Russian Academy of Sciences, Akademika Lavrentieva Ave. 9, 630090 Novosibirsk, Russia
2
V. Zelman Faculty for the Medicine and Psychology, Novosibirsk State University, Pirogova Str. 1, 630090 Novosibirsk, Russia
3
Department of Pathological Physiology and Clinical Pathophysiology, Faculty of Medicine, Novosibirsk State Medical University, Krasny pr-t. 52, 630091 Novosibirsk, Russia
4
University Administration, Novosibirsk State University, Pirogova Str. 1, 630090 Novosibirsk, Russia
5
Institute of Pharmacy, I. M. Sechenov First Moscow State Medical University, St. Trubetskaya 8/2, 119991 Moscow, Russia
6
Faculty of Bioengineering and Bioinformatics, Lomonosov Moscow State University, Leninskie Gory 1/73, 119234 Moscow, Russia
*
Author to whom correspondence should be addressed.
Sci. Pharm. 2025, 93(3), 44; https://doi.org/10.3390/scipharm93030044 (registering DOI)
Submission received: 21 July 2025 / Revised: 3 September 2025 / Accepted: 4 September 2025 / Published: 5 September 2025

Abstract

Metabolic syndrome is characterized by a group of metabolic disorders that can lead to the development of cardiovascular diseases, obesity and type 2 diabetes mellitus (T2DM). Nowadays, there are several groups of drugs for the treatment of T2DM, but there is no one that would not have significant side effects and suitable for most patients. In our previous study, it was shown that the (S)-2-ethoxy-3-phenylpropanoic acid derivative containing isopimaric acid moiety exhibited pronounced antidiabetic activity. In the present study, a series of (S)-2-ethoxy-3-phenylpropanoic acid derivatives containing an isopimaric acid moiety with various aromatic substituents at position 16 were synthesized. The synthesized compounds were tested for their ability to improve glycemic control and to counter lipid abnormalities in C57BL/6Ay mice placed on a high-fat/high-cholesterol diet. Of all tested compounds, the 2-NO2-phenyl derivative (16d) had the most pronounced effect in decreasing blood glucose and serum triglyceride levels. All the compounds displayed a relatively safe profile in the animal studies carried out in this work. Therefore, it can be concluded that chemical modification of isopimaric acid may enhance its efficacy as an antidiabetic agent as part of the potential glitazar.

1. Introduction

Metabolic syndrome (MS) is defined as a group of metabolic disorders represented by a number of risk factors for cardiovascular disease, obesity and type 2 diabetes mellitus (T2DM) [1]. Abdominal fat deposition, arterial hypertension, disorders of carbohydrate metabolism, and dyslipidemia are also MS-related factors [2]. The relationship between MS and the development of many chronic diseases (cardiovascular disease, non-alcoholic fatty liver disease (NAFLD), arthritis, chronic kidney disease, schizophrenia) as well as some types of cancer (endometrial cancer, prostate cancer, colorectal cancer and breast cancer) has been reported for many decades [3,4,5,6].
The global prevalence of MS is rapidly increasing and depends on many factors, which explains the complexity of diagnosis and approaches to prevention and treatment of this pathology. Age, lifestyle, socioeconomic status, insulin resistance (IR), dyslipidemia, obesity and genetic predisposition are factors affecting the risk of MS development and progression. Specific features of adipose tissue distribution and its dysfunction are important factors in the development of IR with obesity, as well as the risk of cardiometabolic diseases and MS.
However, a major factor in the development of MS is insulin resistance. Insulin is the main regulator of glucose metabolism, a pancreatic hormone that causes the body’s cells to take excess glucose from the blood. Normally, after a meal, there is a significant release of insulin into the bloodstream, so that cells have sources of energy for current needs and storage (in the liver, muscles, and adipose tissue). If insulin is not produced or for some reason the cells are not receptive to its action, diabetes mellitus develops.
There are two main types of diabetes mellitus. The first type is associated with the destruction of the pancreatic cells that secrete insulin due to abnormalities of the immune system, and usually develops in children. Type two diabetes mellitus is mainly attributed to metabolic abnormalities leading to impaired cell interaction with insulin in adulthood [7]. Generally, the development of insulin resistance precedes the onset of type 2 diabetes mellitus [8]. Typically, resistance is formed when there is a significant excess of calories in the diet—fat cells and skeletal muscle fibers are “choked” by excess fat and glucose and attempt to reduce glucose influx by decreasing their sensitivity to insulin. As a result, they reduce the number of insulin receptors on their cytoplasmic membrane, or their activity is reduced through many possible pathways (e.g., activation of intracellular signaling cascades associated with cytoplasmic receptors—sensors of metabolism). Excess glucose is either absorbed by cells not intended for its storage or continues to circulate in the blood [9].
Currently, there are several groups of drugs for the treatment of T2DM, differing in mechanisms of action and properties, but among them there is no one that would not have significant side effects and be suitable for most patients. The most frequently used drug is metformin, which belongs to the group of agents affecting insulin resistance [10]. Metformin represents the “gold standard” as a means of pathogenetic therapy, but the frequent occurrence of gastrointestinal side effects significantly limits its use.
Another group of agents affecting insulin resistance are thiazolidinediones. The mechanism of their action is based on the activation of nuclear peroxisome proliferator-activated γ-receptors (PPAR-γ). The most common side effects of these drugs include weight gain and peripheral edema. The disadvantages of the use of drugs with incretin activity include their effect only on postprandial glycemia and an elevated risk of pancreatitis [11].
Agents that increase insulin secretion often lead to hypoglycemia and weight gain, and sulfonylurea derivatives are also characterized by rapid development of insulin resistance. Agents that block glucose reabsorption in the kidneys often cause urogenital infections and hypovolemia, and blockers of glucose absorption in the intestine have low efficacy and lead to gastrointestinal disorders. The use of insulins requires constant monitoring of blood glucose levels and quickly leads to an increase in insulin resistance [12]. Drug therapy of dyslipidemias is heterogeneous, but the most popular agents are still statins, which are also not devoid of undesirable side effects [13].
Recently, a new group of drugs targeting both problems—glitazars—has been successfully developed. Initially, these compounds were referred to the group of glitazones, but a different mechanism of action, which includes the activation of not only PPAR-γ, but also PPAR-α, as well as the features of their molecular structure allowed to separate them into a separate group. They effectively affect the restoration of carbohydrate and fat metabolism in patients with DM and have a favorable effect on the prevention and course of cardiovascular complications [14].
To date, more than 10 glitazars have been developed and clinically tested by various pharmaceutical companies and have shown promising results in animal studies. However, most of them have not been approved for use due to a number of side effects (Figure 1). For example, tesaglitazar was withdrawn from further development due to frequent incidences of creatinine elevation and decreased glomerular filtration rate; administration of ragaglitazar led to weight gain, anemia, and bladder tumors in rodents. Aleglitazar therapy caused gastrointestinal bleeding, bone fragility, and heart failure. However, saroglitazar [15] and chiglitazar [16] successfully passed all phases of clinical trials and were approved for use, but only in India and China respectively.
The analysis of the structure-activity-toxicity relationship of glitazars indicates that the most selective pharmacophore fragment is (S)-2-ethoxy-3-phenylpropionic acid. Its binding to PPAR-α and γ receptors enables compounds belonging to this class to effectively regulate not only carbohydrate metabolism but also lipid metabolism. Glitazars’ molecule also contains a variable part, which often consists of various aromatic fragments. Therefore, modification of the variable region by introducing additional aromatic fragments or replacing them with other groups may represent a promising strategy for developing more effective and safer glitazars.
Natural compounds are well known to serve as platforms for the synthesis of drugs [17]. Incorporating natural pharmacophores, particularly terpenoids, can lead to significant improvements in the properties of potential therapeutic agents, due to their high safety profile, evolutionary contingent structural affinity for numerous biological receptors, and their broad spectrum of biological activity.
In our studies on [18], we synthesized a series of (S)-2-ethoxy-3-phenylpropionic acid derivatives, in which the terpenoid acid fragment is linked to the pharmacophore via an aminoethanol spacer amide bond. It was demonstrated that the type of terpenoid fragment significantly influences the hypoglycemic and hypolipidemic properties of these compounds. Additionally, using dihydrobetulonic acid amide as an example, we showed that chemical modification of the spacer [19] has a substantial impact on pharmacological effects.
Among the tested compounds with diterpene acid fragments, the derivative of isopimaric acid 6 (Figure 2) exhibited the most pronounced effect in lowering blood glucose levels and body fat mass, while also demonstrating a relatively safe toxicity profile in animal studies [20].
Based on the hypothesis that modification of the variable region’s structure can enhance hypoglycemic and hypolipidemic effects, in this study new derivatives of isopimaric acid modified at the terminal double bond were synthesized and their biological activity was evaluated in mice with obesity and symptoms of T2DM.
The modification of the double bond in isopimaric acid is an accessible and reproducible approach for the synthesis of its derivatives. However, the methods for such modifications are limited and primarily based on the preliminary isomerization of the isopimarane core to a sandaracopimarane structure, as classical techniques often require the use of strong acids and high temperatures [21].

2. Materials and Methods

2.1. Chemistry

The 1H and 13C NMR spectra for all compounds were recorded on a Bruker AV-400 spectrometer (Bruker Corporation, Billerica, MA, USA) at 400.13 and 100.61 MHz, respectively in CDCl3 solution. The signals of the solvent were used as the reference (δH 7.27, δC 77.1 for CDCl3). Chemical shifts were given in ppm and the coupling constants (J) were given in hertz (Hz). The structure of the products was determined by means of 1H and 13C NMR spectra. The mass spectra (15–500 m/z, 70 eV) were recorded on a DFS Thermo Scientific high-resolution mass spectrometer (Waltham, MA, USA). Merck silica gel (63–200 μm, Macherey-Nagel, Düren, Germany) was used for the column chromatography. Thin-layer chromatography was performed on TLC Silica gel 60F254 Merck (Darmstadt, Germany). All reagents were used as described unless otherwise noted. Reagent-grade solvents were redistilled prior to use [22]. Synthetic starting materials, reagents, and solvents were purchased from Sigma-Aldrich, Acros Organics (Shanghai, China) and Alfa Aesar (Kandel, Germany). (S)-ethyl 2-ethoxy-3-(4-hydroxyphenyl)propanoate was synthesized and provided by the Department of Preparative Synthesis of the Institute of Organic Chemistry SB RAS. All synthesis methods and their spectral data are given in the Supplementary Materials.

2.2. Biology

2.2.1. Animals

Male C57BL/6 Ay/a (AY) mice weighing 28–32 g and male C57BL/6 J mice were used. Animals source: SPF vivarium of the Institute of Cytology and Genetics SB RAS. The animals were housed with ad libitum access to water and feed. Humidity, temperature, and a 12/12 h light-and-dark cycle in vivarium were controlled. All experiments with animals were conducted in accordance with the Russian Federation’s laws, the Ministry of Health of the Russian Federation decree no. 199n of 1 April 2016; the European Parliament and European Union Council Directive 2010/63/EU of 22 September 2010 on the protection of animals used for scientific purposes. The experiment protocol was approved by the Ethics Committee of N.N. Vorozhtsov Institute of Organic Chemistry SB RAS (protocol no. P-14-2024-11-01).

2.2.2. The OGTT

Animals fasted for 12 h before the test. Mice in all groups were given oral glucose at a dose of 2.5 g/kg 30 min prior to blood glucose concentration measurement. The first OGTT in AY mice was conducted after 14 days of administration and all compounds were introduced 30 min prior to the glucose load by oral gavage. The second OGTT was performed on the 28th day of the experiment while the last compounds’ introduction was two days prior to the test. All mice blood samples were obtained from tail incision. The following time points were used: 0 (before dosing), 30, 60, 90, and 120 min after the glucose load. The ONE TOUCH Select blood glucose meter (LIFESCAN Inc., Milpitas, CA, USA) was used for blood glucose concentration measurement. Tai’s model was used to calculate the area under the glycemic curve (AUC) [23].

2.2.3. The ITT

The test was performed on all animals according to the AY mice experiment design after 4 h of fasting. Insulin (Soluble human insulin, Medsynthesis plant, Novouralsk, Russia) was injected i.p. at a dose of 5 ED/kg. Blood samples were obtained from tail incision before the insulin injection (time 0) and at 15, 30, 45, 60, and 90 min after that. Blood glucose concentration was evaluated with a ONE TOUCH Select blood glucose meter (LIFESCAN Inc., Milpitas, CA, USA).

2.2.4. The AY Mice Experiment Design

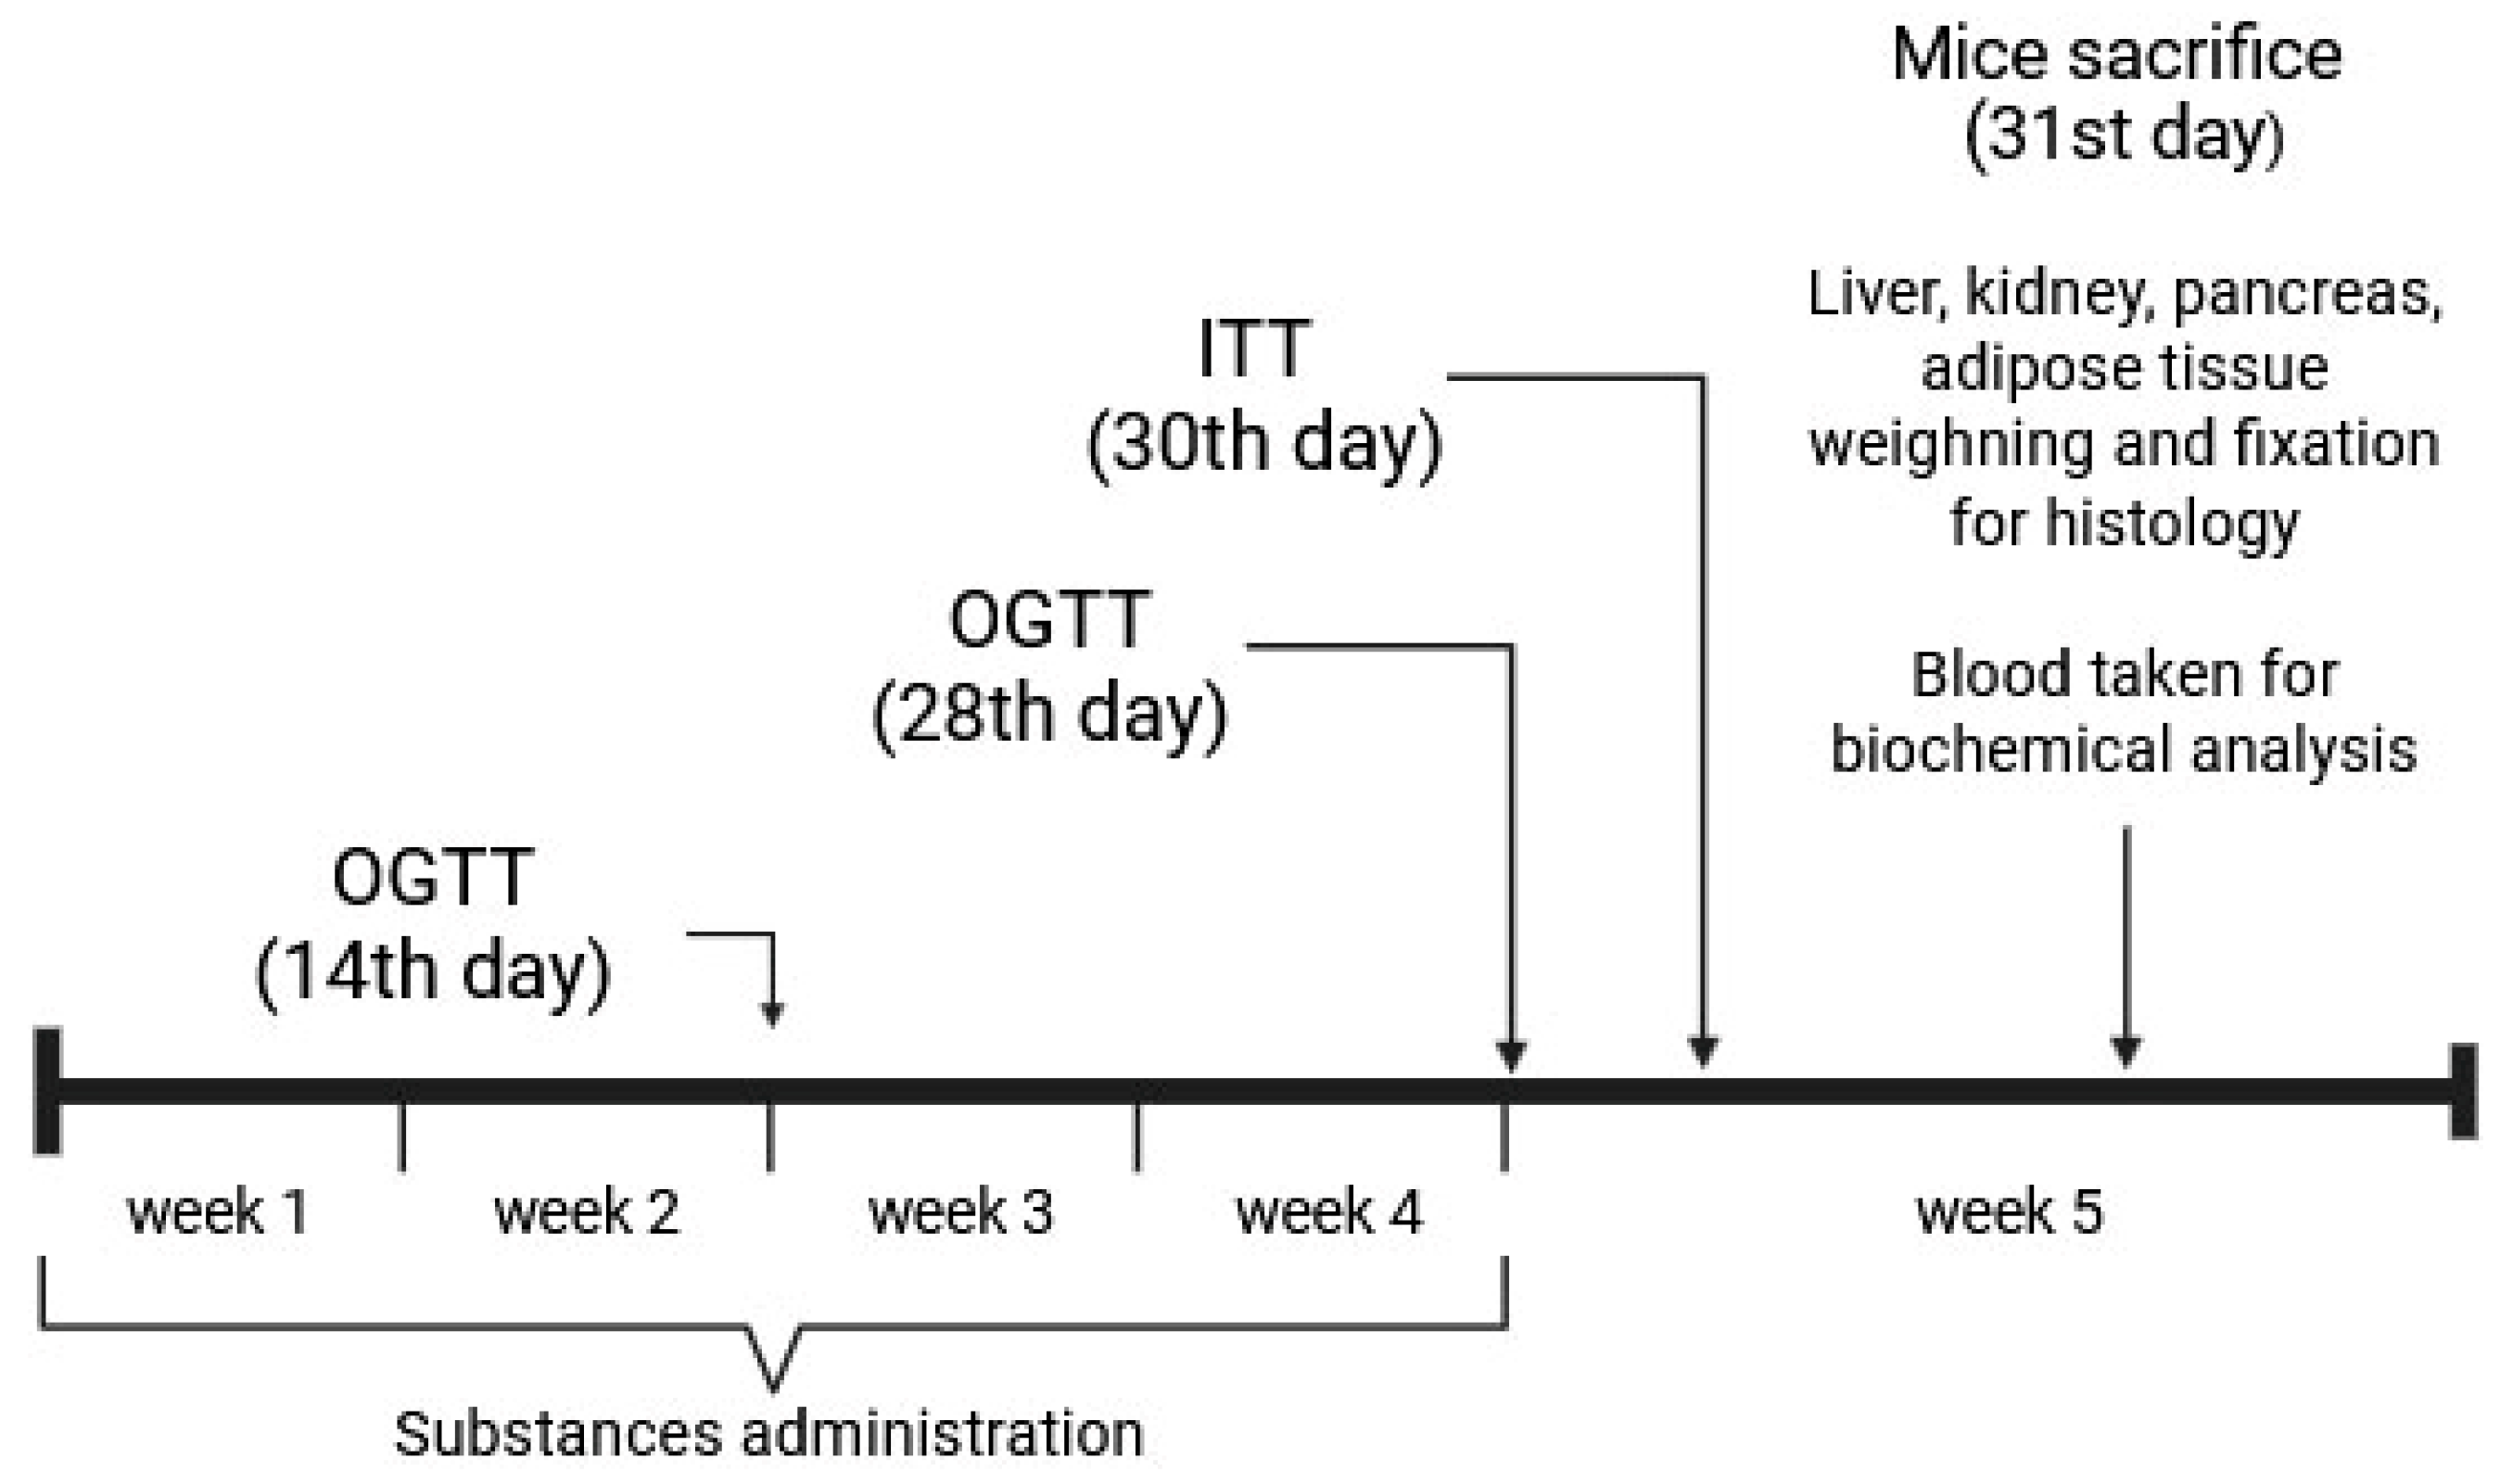
The experimental design of this study (Figure 3) was similar to the one used in our previous work [19]. Body weight gain of the C57BL/6 Ay/a was promoted by adding lard and cookies to standard chow ad libitum for 30 days. A body weight of 35 g was the minimum for the mouse to be chosen for further experiments. Selected animals were divided in the following groups (n = 7 in each, 49 total): (1) C57BL/6 mice (2) Control (vehicle (water + 2 drops of Tween 80)), (3) MF 250 mg/kg, (4–7) 16a–d 30 mg/kg. The number of animals in each group was decided according to our previous experiments [19] in order to obtain enough statistical data and mice were distributed among the groups so the mean weight value would be equal among them. During the whole experiment, the diet was the same as throughout the weight gain phase. The metformin dose was used according to the literature data [24], while the dose of potential glitazars corresponded to our previously published works with similar compounds [18,19]. Tested compounds were administered orally (by oral gavage) once a day. To assess the impact of the tested substances on the metabolic processes the following tests and methods were used. Two OGTTs were conducted on the 14th and 28th day of the experiment. Then, on the 30th day an ITT was carried out. Animals were decapitated and blood was drawn for the biochemical assay on the 31st day of the experiment. The following organs and tissues were weighted and taken for the histological examination: liver, kidney, gonadal fat, interscapular white and brown fat, pancreas. Body weight and food consumption were evaluated once a week.

2.2.5. Biochemical Assays

Serum was separated by centrifugation at 1640× g for 15 min. Standard diagnostic kits (Vector-Best, Novosibirsk, Russia) and a photometer Multiscan Ascent (Thermo Labsystems, Helsinki, Finland) were used to analyze serum total cholesterol, triglycerides and lactate concentration levels and alkaline phosphatase, alanine aminotransferase and aspartate aminotransferase activity levels.

2.2.6. Histological Examination

Excised tissues (liver, kidney, interscapular white and brown fat, pancreas) were fixed in 10% neutral buffered formalin for 7 days, then they were subjected to the standard dehydration in ascending ethanol concentrations and xylene. Tissue samples were embedded in paraffin on an AP 280 workstation using Histoplast (Thermo Fisher Scientific, Waltham, MA, USA, melting point of 58 °C). Slices with a thickness of 4.5 μm were obtained on a rotational microtome NM 335E with disposable interchangeable blades. Hematoxylin and eosin staining were used. Sample’s examination was performed under a light microscope at a magnification of ×100–400.

2.2.7. Statistical Analysis

Statistical analysis was performed by the Mann–Whitney U test and one-way ANOVA followed by the Dunnett’s multiple comparisons test. Data are shown as mean ± SEM. Data with p < 0.05 were considered statistically significant.

3. Results

3.1. Chemistry

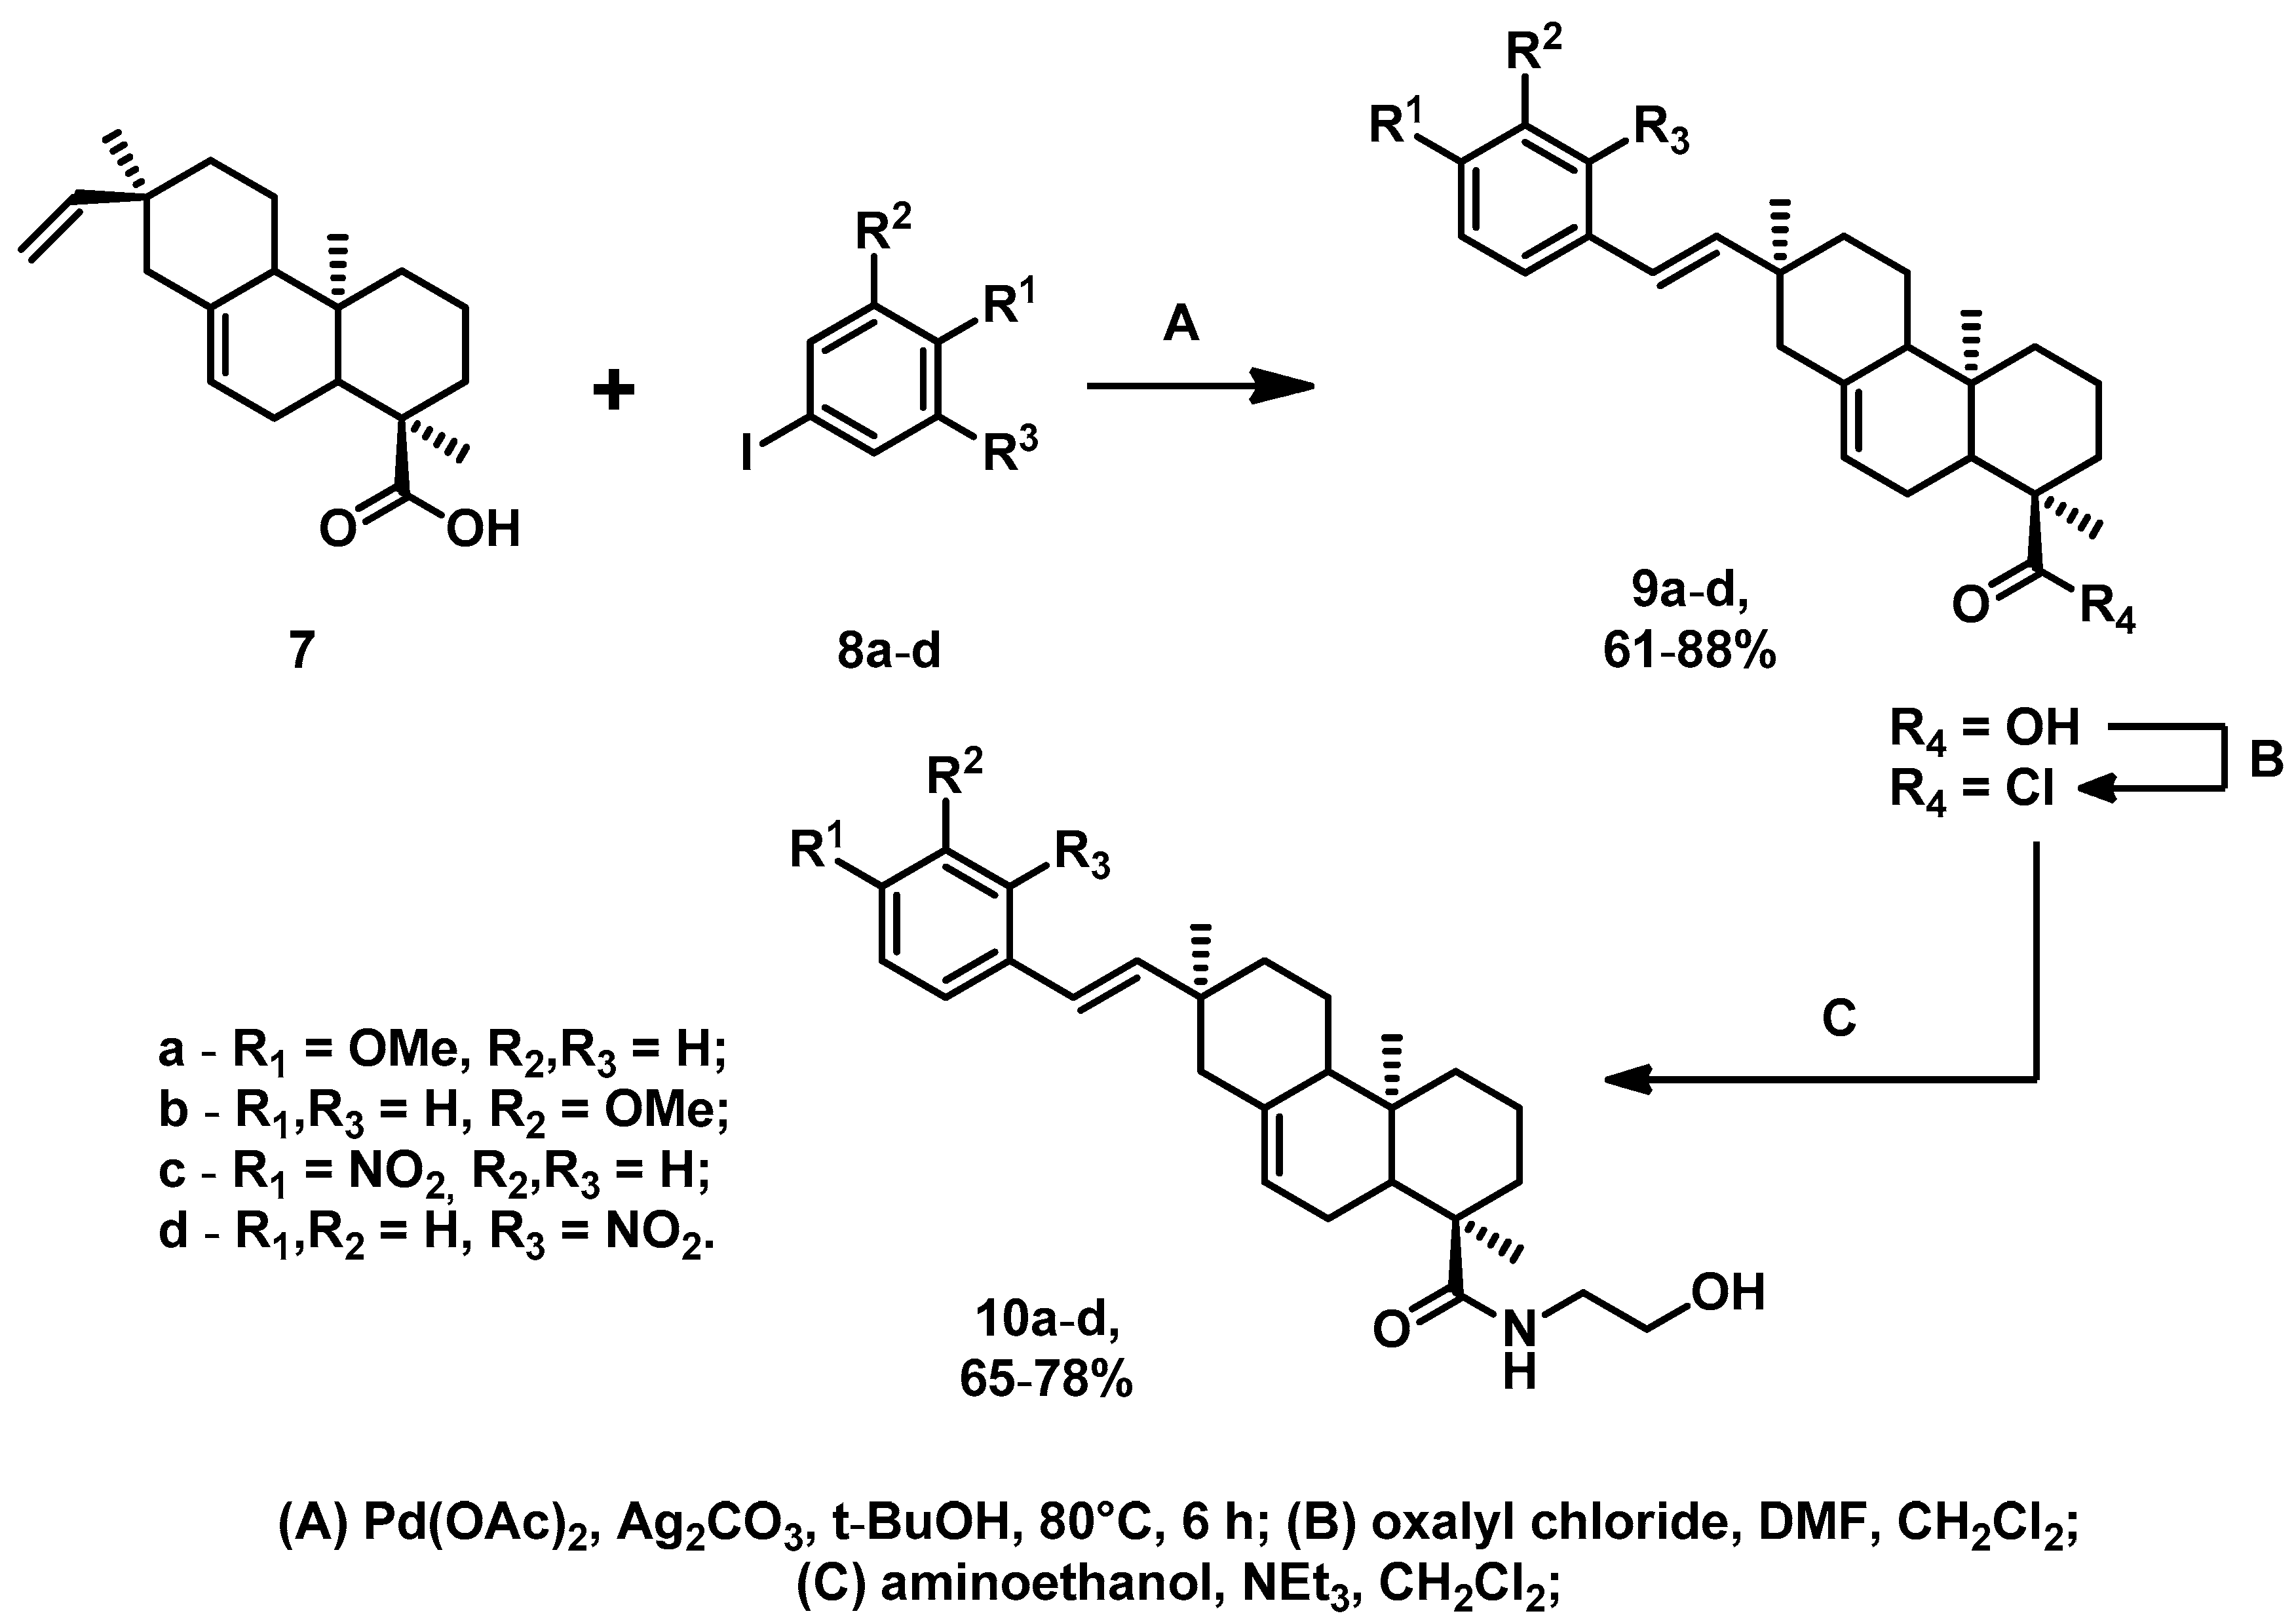
Aromatic derivatives of isopimaric acid (compounds 9a–d) were synthesized according to the technique described in an earlier work (Scheme 1) [25]. The synthesis involved the reaction of isopimaric acid 7 with substituted aryl iodides 8a–d in the presence of lead acetate and silver carbonate in tert-butanol, heated at 80 °C for 6 h. Subsequently, derivatives 9a–d were converted to their corresponding acyl chlorides via reaction with oxalyl chloride in chloromethane in the presence of catalytic amounts of DMF. The compounds 10a–d were obtained by reacting the acyl chlorides with aminoethanol in the presence of NEt3, and purification was carried out using column chromatography.
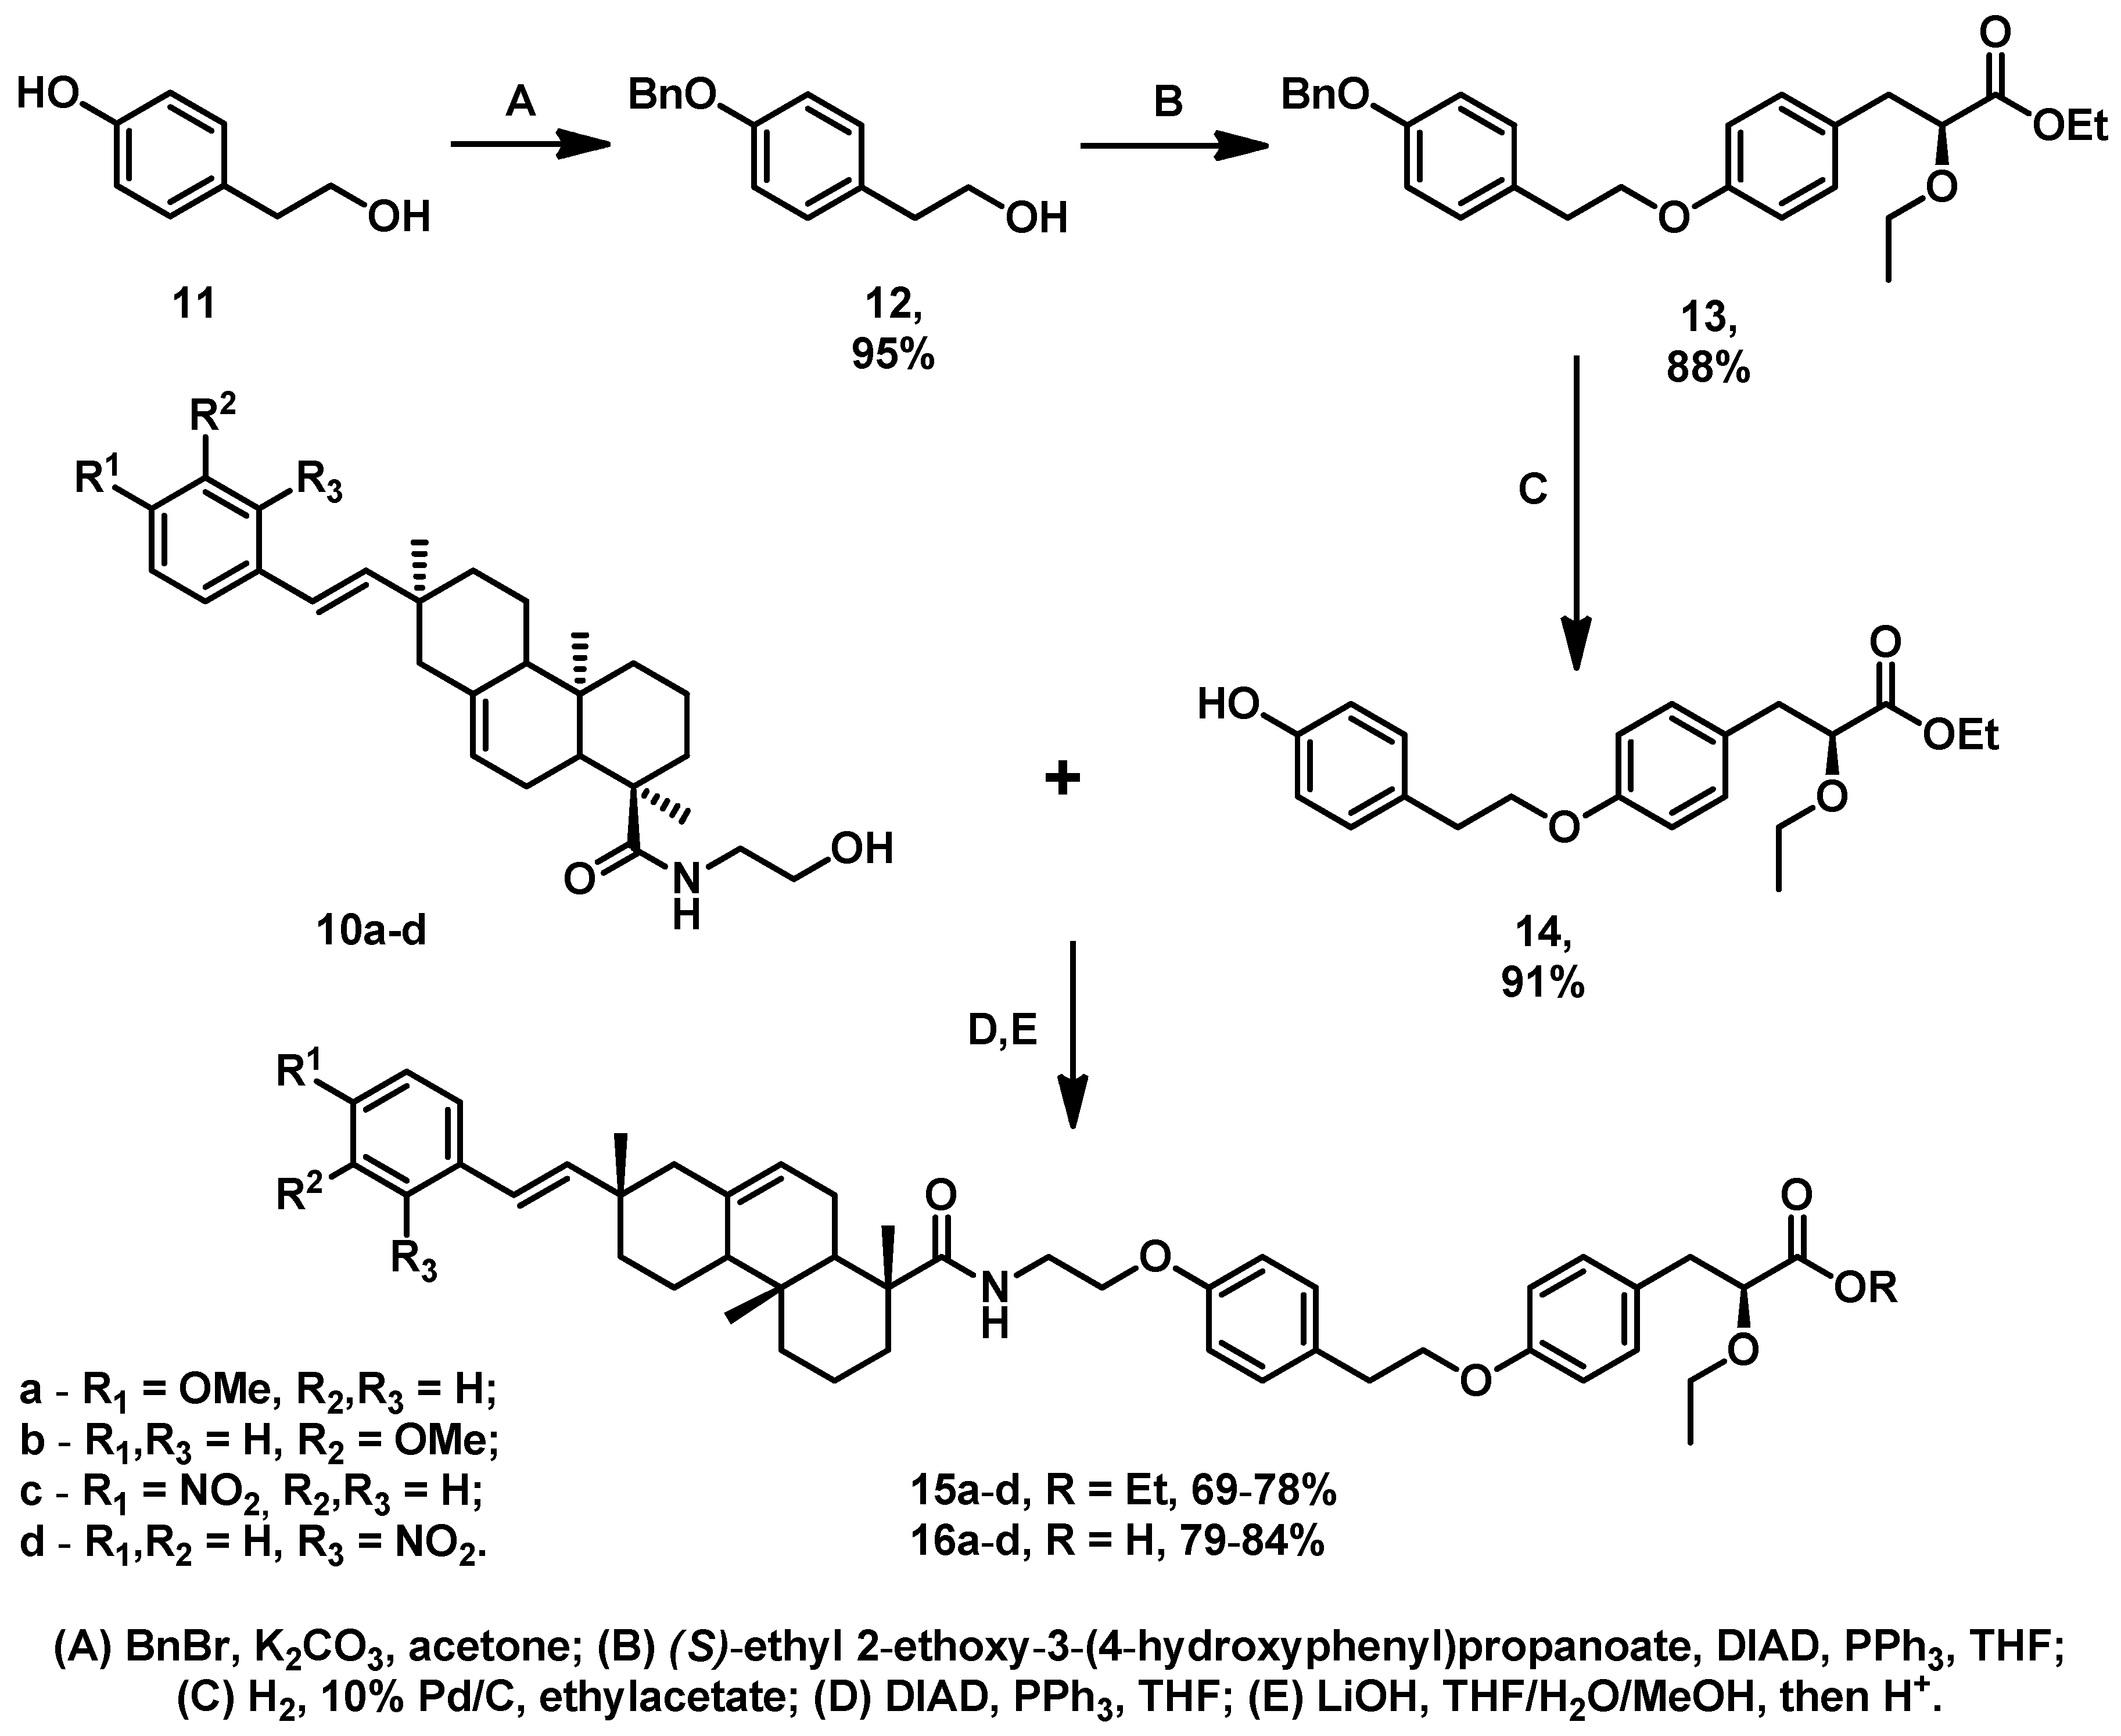
To synthesize the key fragment, common to most PPAR agonists, we employed a methodology described in [19], where tyrosol was used as the starting compound. The reaction of tyrosol 11 with a slight excess of benzyl bromide in acetone in the presence of potassium carbonate yielded the corresponding benzyl ester 12. The interaction of alcohol 12 with ethyl (S)-2-ethoxy-3-(4-hydroxyphenyl)propanoate under Mitsunobu conditions, using PPh3 and DIAD in THF, followed by debenzylation of ester 13, afforded the corresponding phenol 14. Condensation of phenol 14 with alcohols 10a–d under Mitsunobu conditions resulted in the formation of new esters 15a–d with yields ranging from 69% to 78% under mild conditions. Hydrolysis of the ester group was performed using lithium hydroxide in a THF/MeOH/H2O system, followed by evaporation and acidification to produce acids 16a–d with yields of 79% to 84%. This is a flexible approach that allows the synthesis of potential glitazars by varying both the terpenoid acid and the linker connecting it to the pharmacophore fragment. To ensure the purity required for biological testing, the compounds were purified by column chromatography. Purity was monitored by HPLC and NMR spectroscopy and was at least 95%.

3.2. Biology

3.2.1. Body Weight and Food Consumption Dynamics

In all experimental groups containing C57BL/6 Ay/a mice, body weight and food intake were recorded weekly throughout the entire treatment period. Based on the obtained data, it was found that in the groups receiving compounds 16a,b,d and the reference drug metformin, there was no significant effect on body weight, as this parameter remained approximately at the same level over the four-week period (Figure 4a). However, administration of compound 16c resulted in a slight decrease in body weight throughout the experiment. The results of food intake measurements for compounds 16a–d also indicated no significant changes in this parameter during the entire treatment period (Figure 4b).

3.2.2. OGTT After Two Weeks of Substance Administration

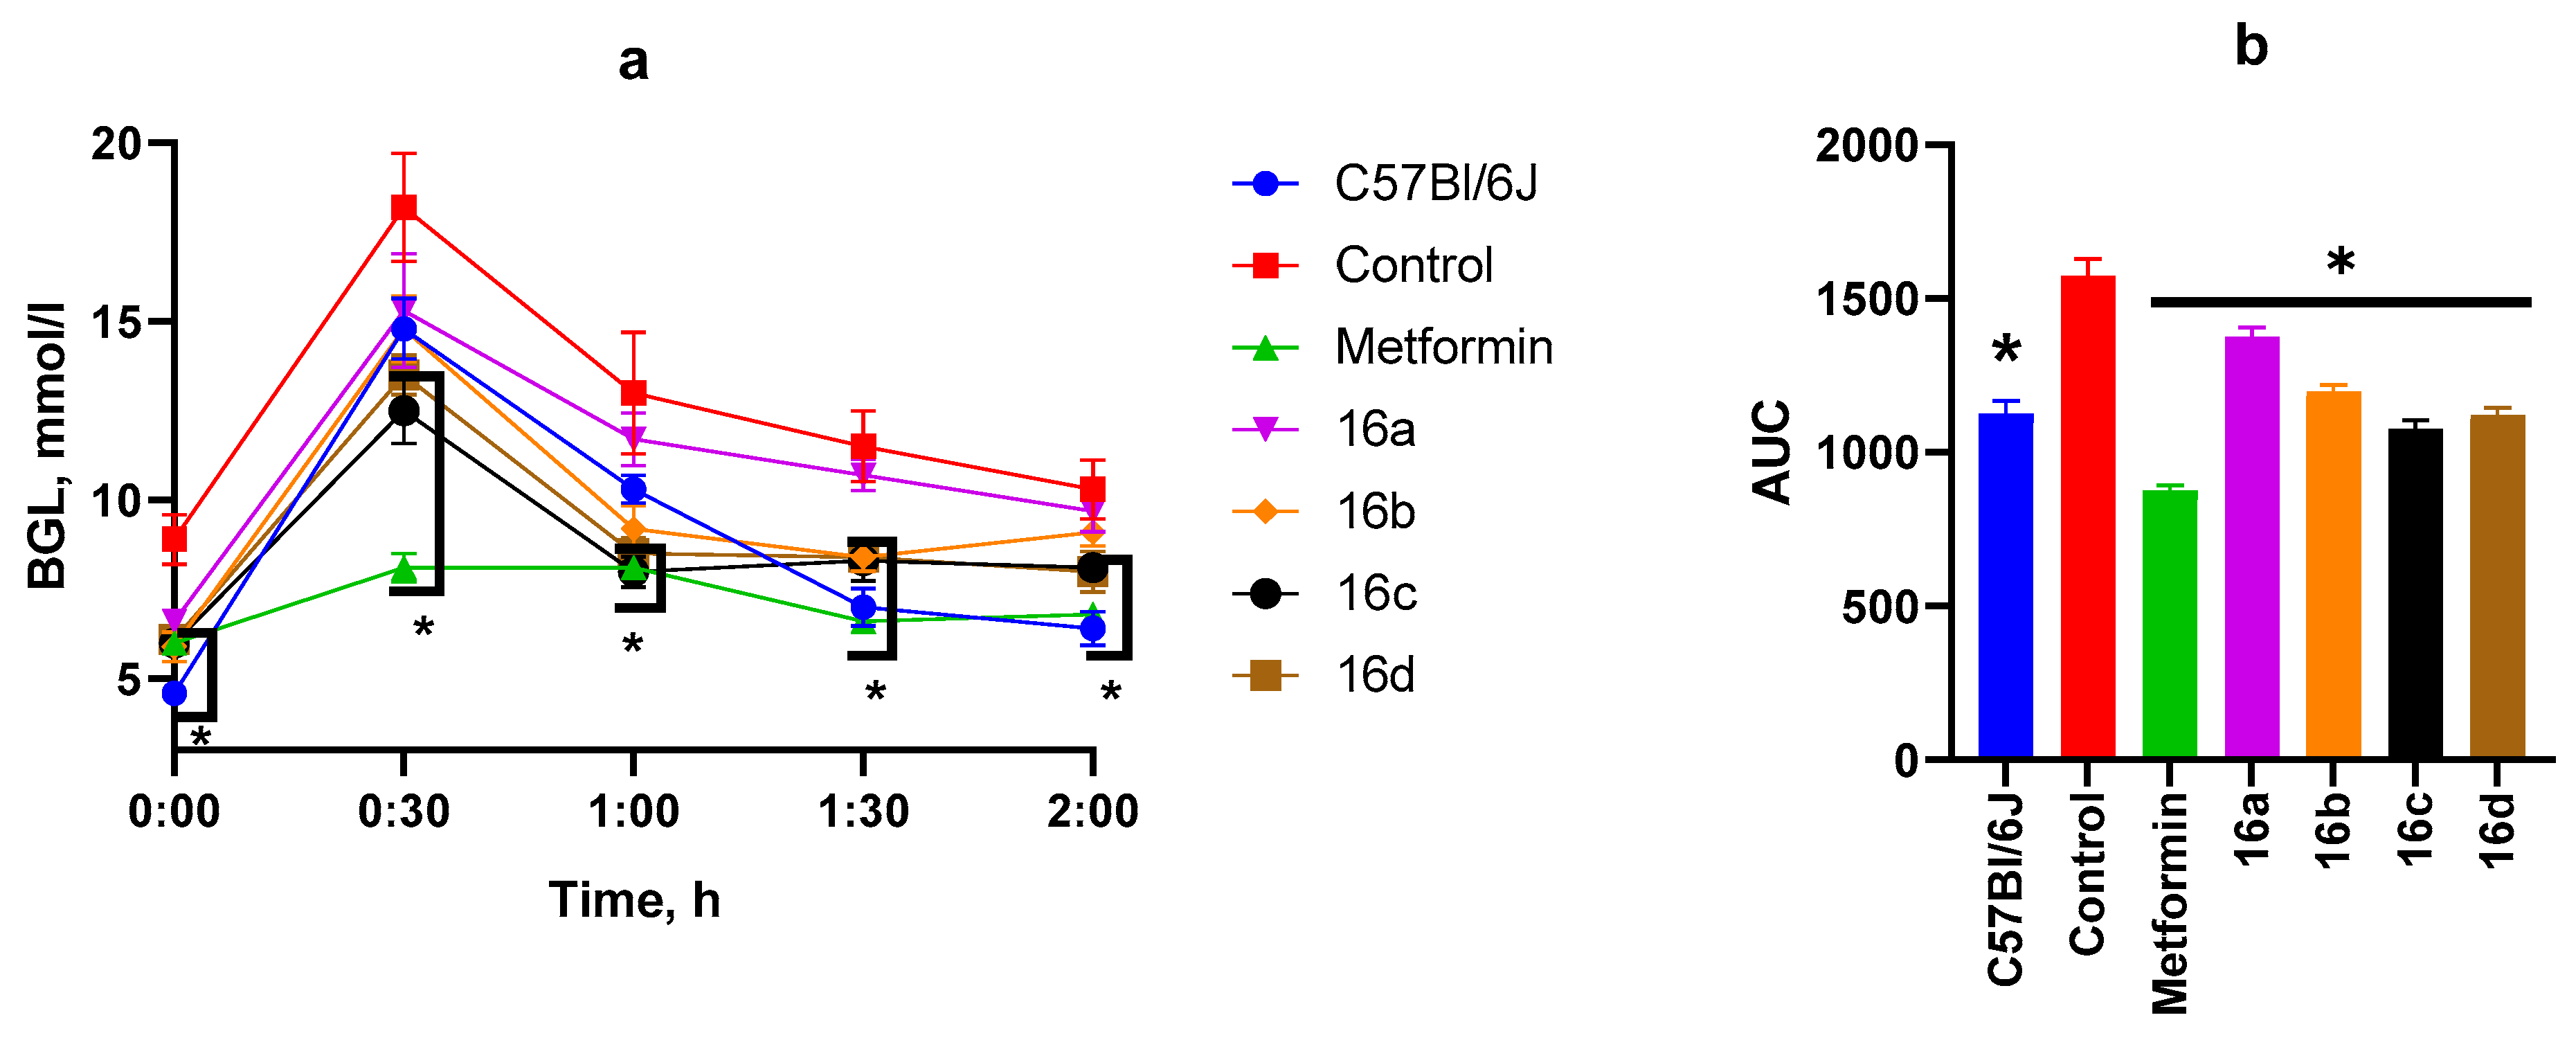
As a result of the oral glucose tolerance test (OGTT), conducted after two weeks of substance administration and following their preliminary administration 30 min prior to the glucose load, mean glycemic curves were plotted for each experimental group (Figure 5a). Based on these curves, the corresponding areas under the curve (AUC) were calculated. The AUC data (Figure 5b) indicate that all experimental compounds (16a–d) demonstrated a statistically significant hypoglycemic effect compared to the control group.
The glycemic parameters of mice administered compounds 16b–d closely resembled those observed in the intact control group (C57BL/6J). Meanwhile, the reference drug metformin exhibited the most pronounced hypoglycemic activity overall, primarily due to a significantly lower blood glucose level at 30 min post-glucose administration relative to the other groups.

3.2.3. OGTT After Four Weeks of Substance Administration

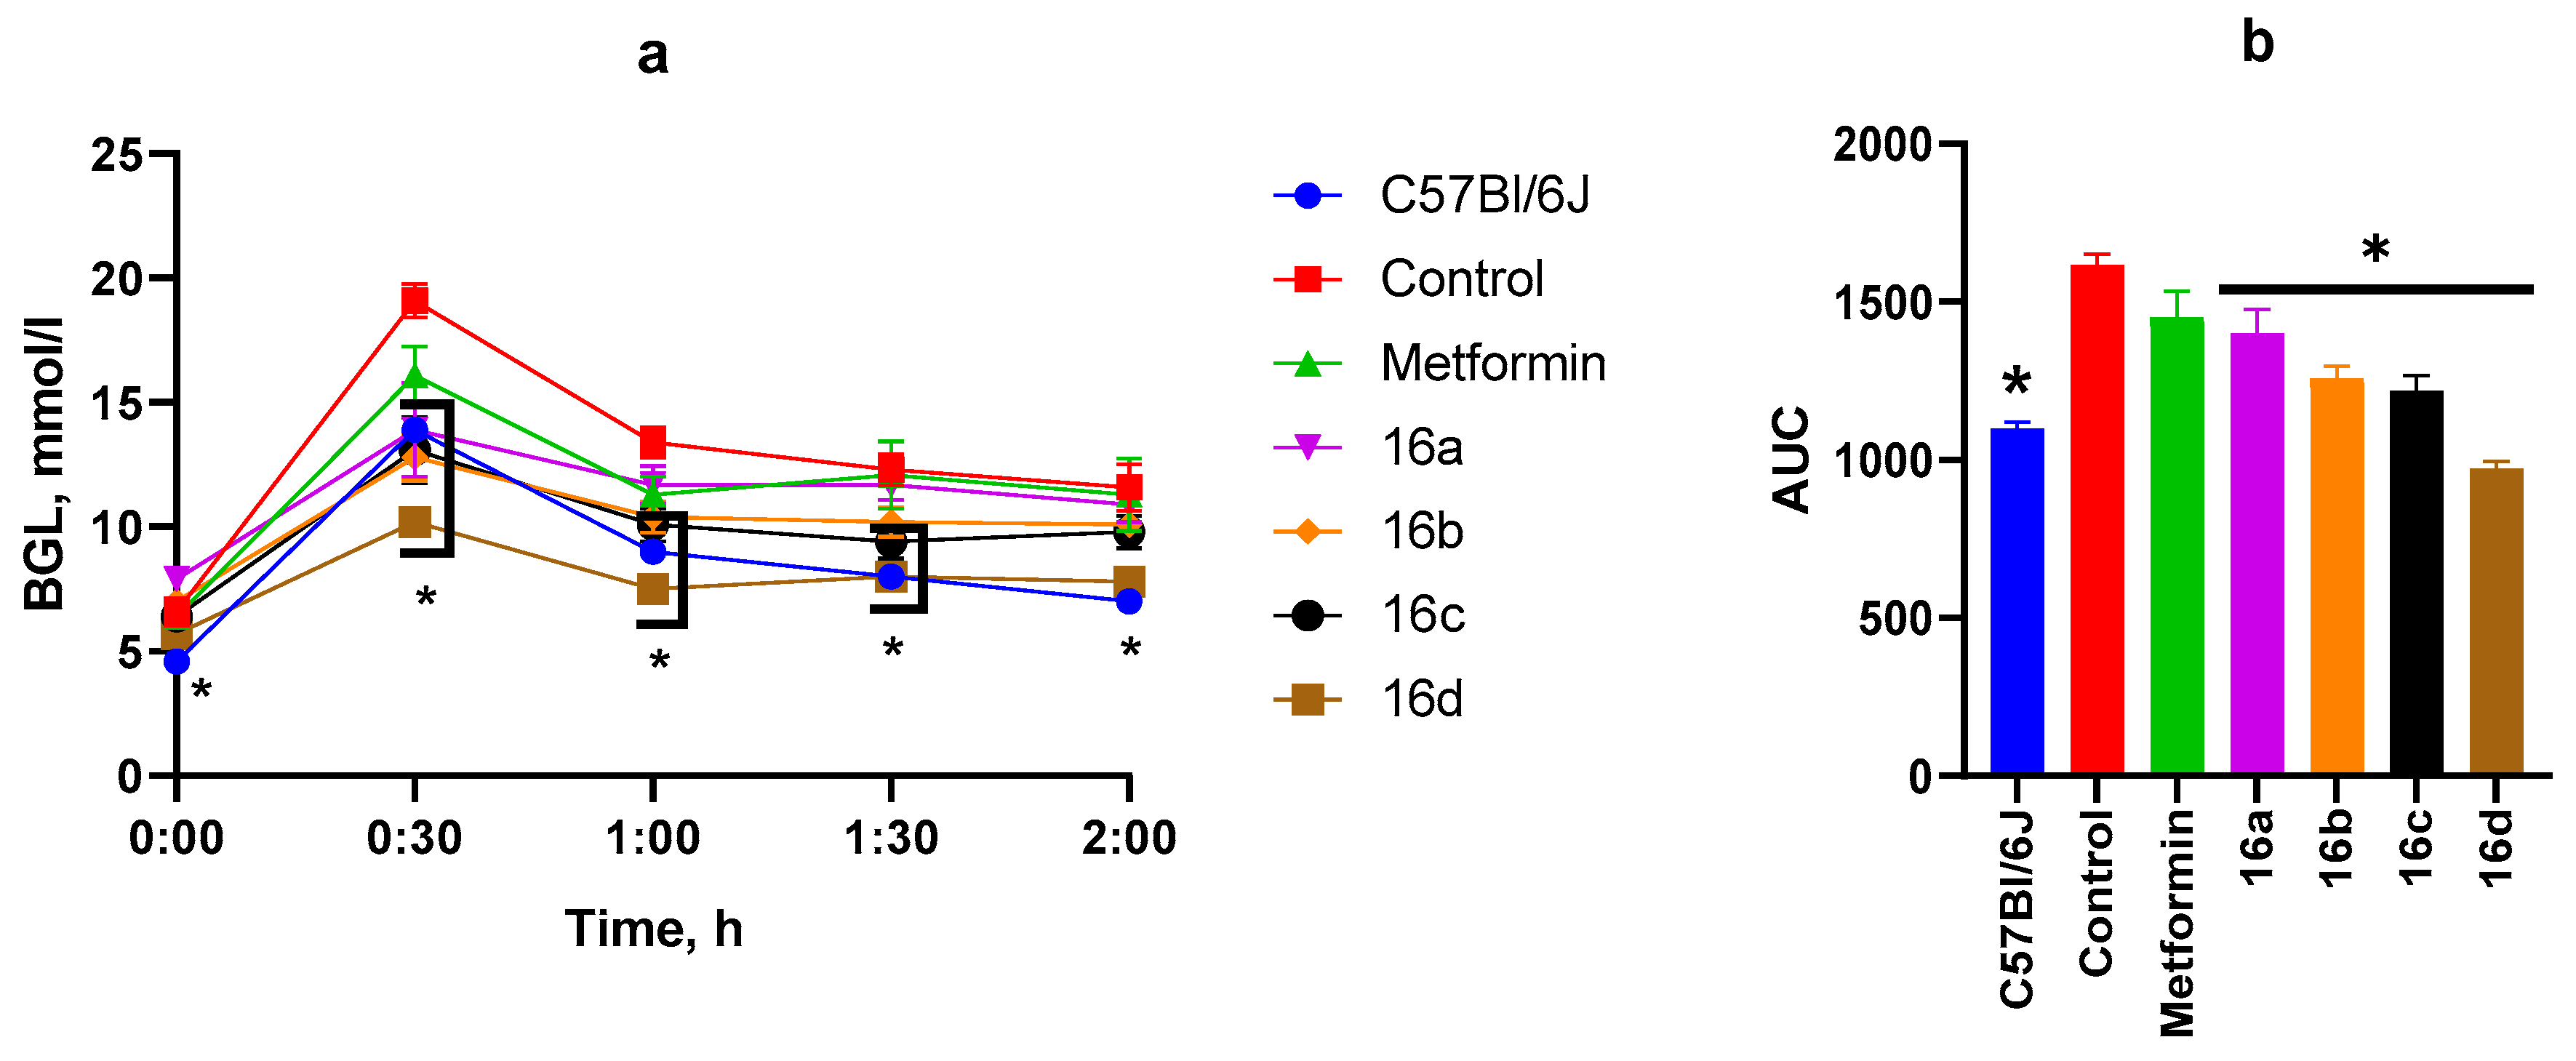
During the oral glucose tolerance test (OGTT) conducted one day after the complete cessation of four weeks of substance administration, similar results to the initial OGTT performed after two weeks of treatment were observed. All experimental compounds demonstrated a statistically significant hypoglycemic effect compared to the control group, with the lowest blood glucose levels recorded in the group receiving compound 16d (Figure 6a,b).
However, unlike the first OGTT, no significant differences from the control group were observed in the metformin-treated group, indicating an absence of accumulation effect for this reference drug.

3.2.4. ITT

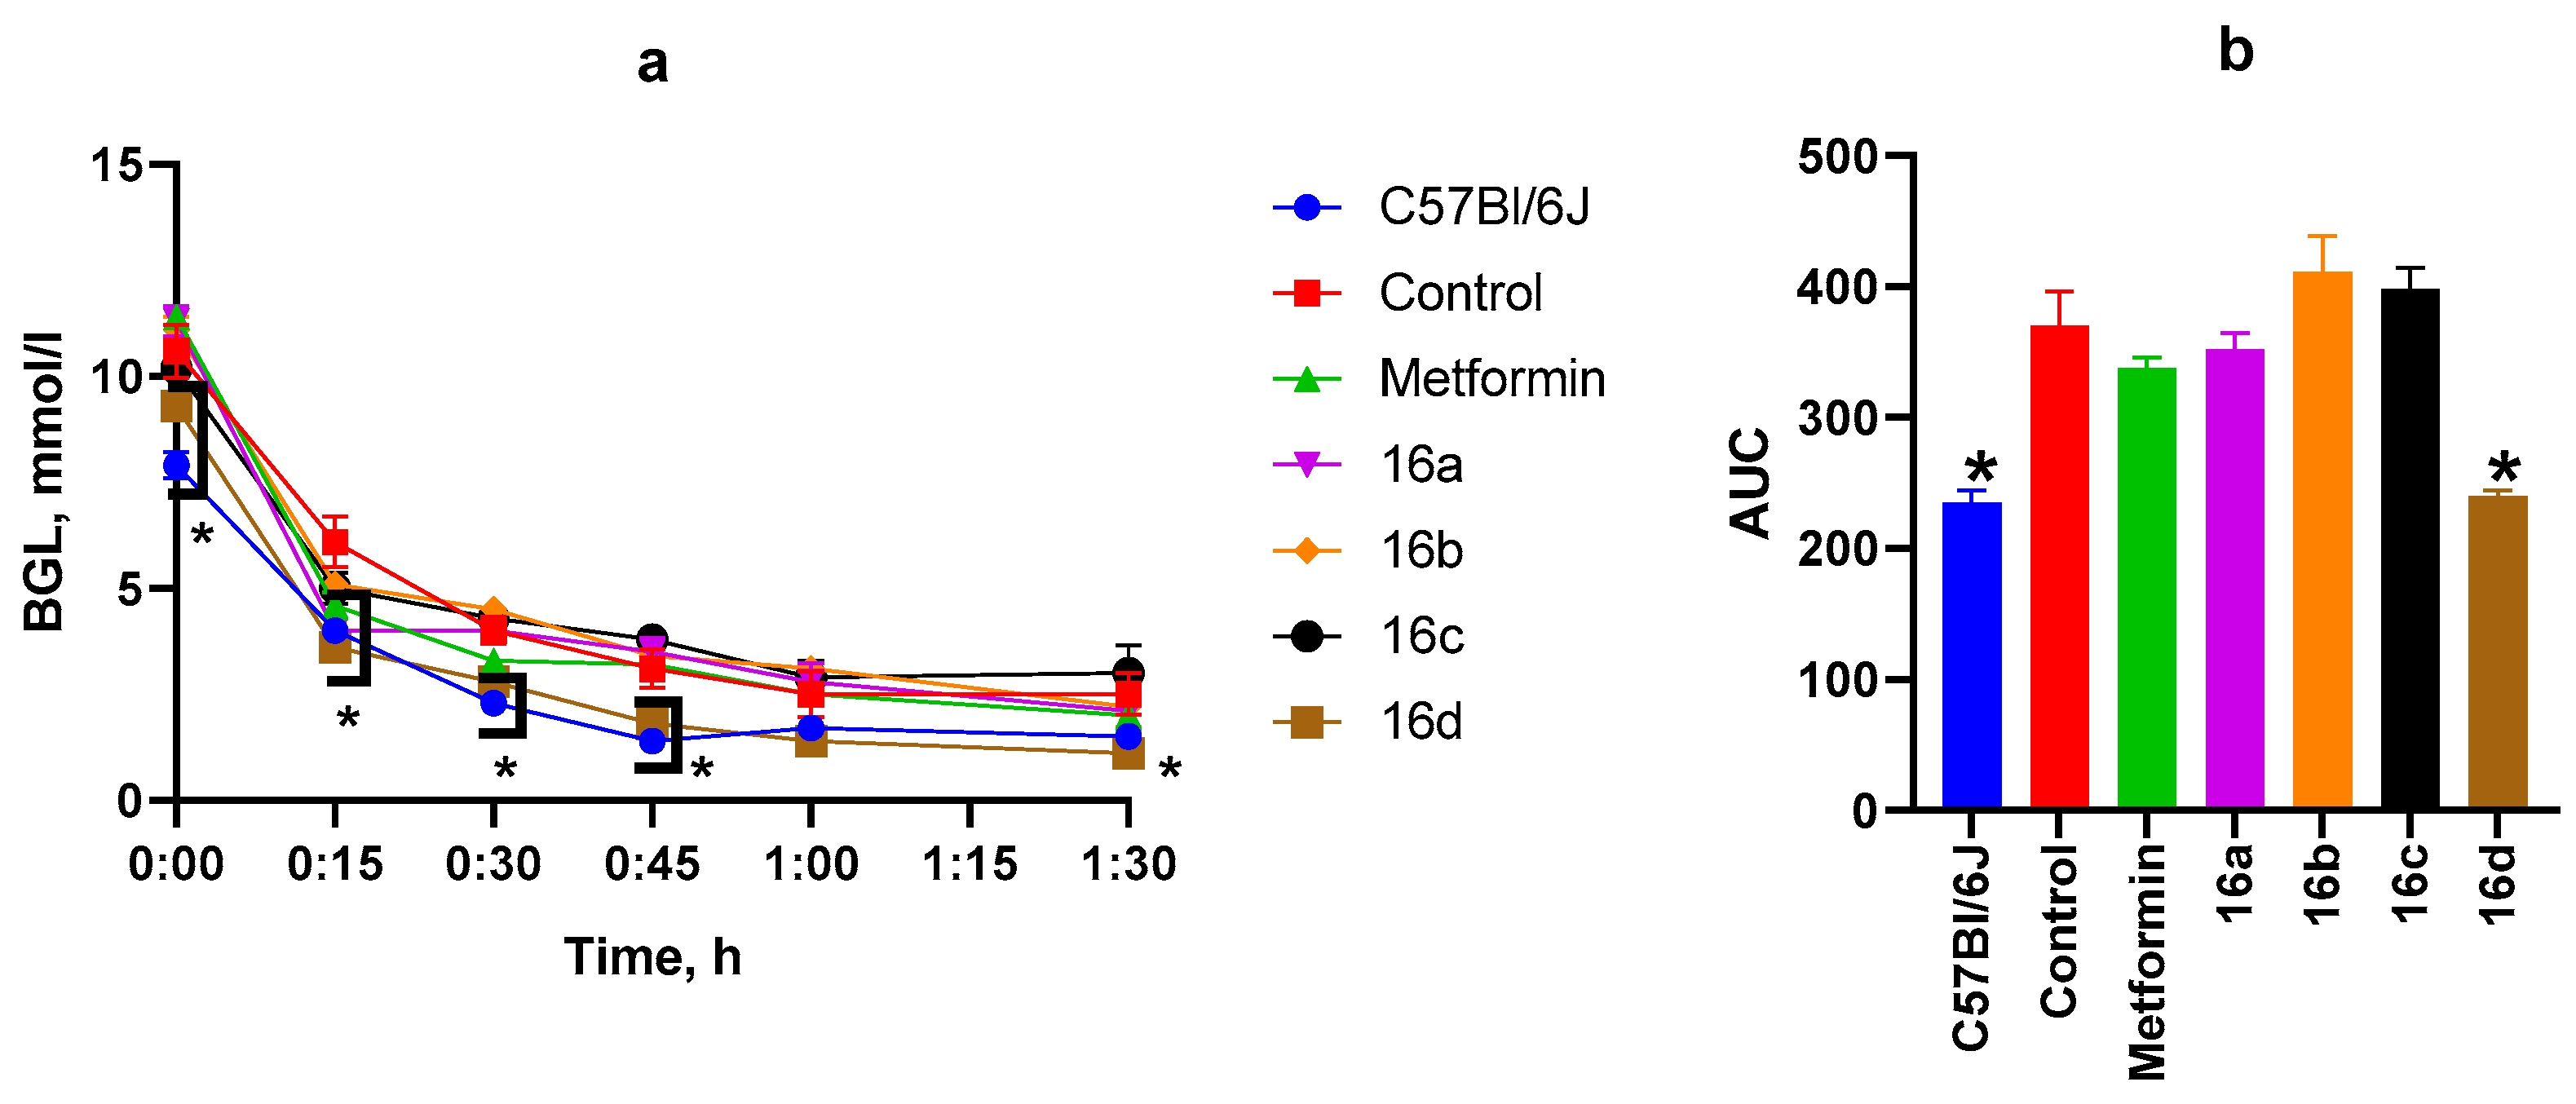
Based on the data obtained from the insulin tolerance test (ITT) conducted two days after the end of substance administration, it was established that the only compound that significantly reduced blood glucose levels in mice compared to the control group was 16d. As shown in the presented diagrams (Figure 7a,b), the glycemic curve and the area under the curve for the 16d group closely resembled those of the intact control group.
Thus, it can be concluded that compound 16d contributed to an increase in insulin sensitivity in mice with T2DM to a level comparable to animals without metabolic disturbances.

3.2.5. Biochemical Blood Analysis

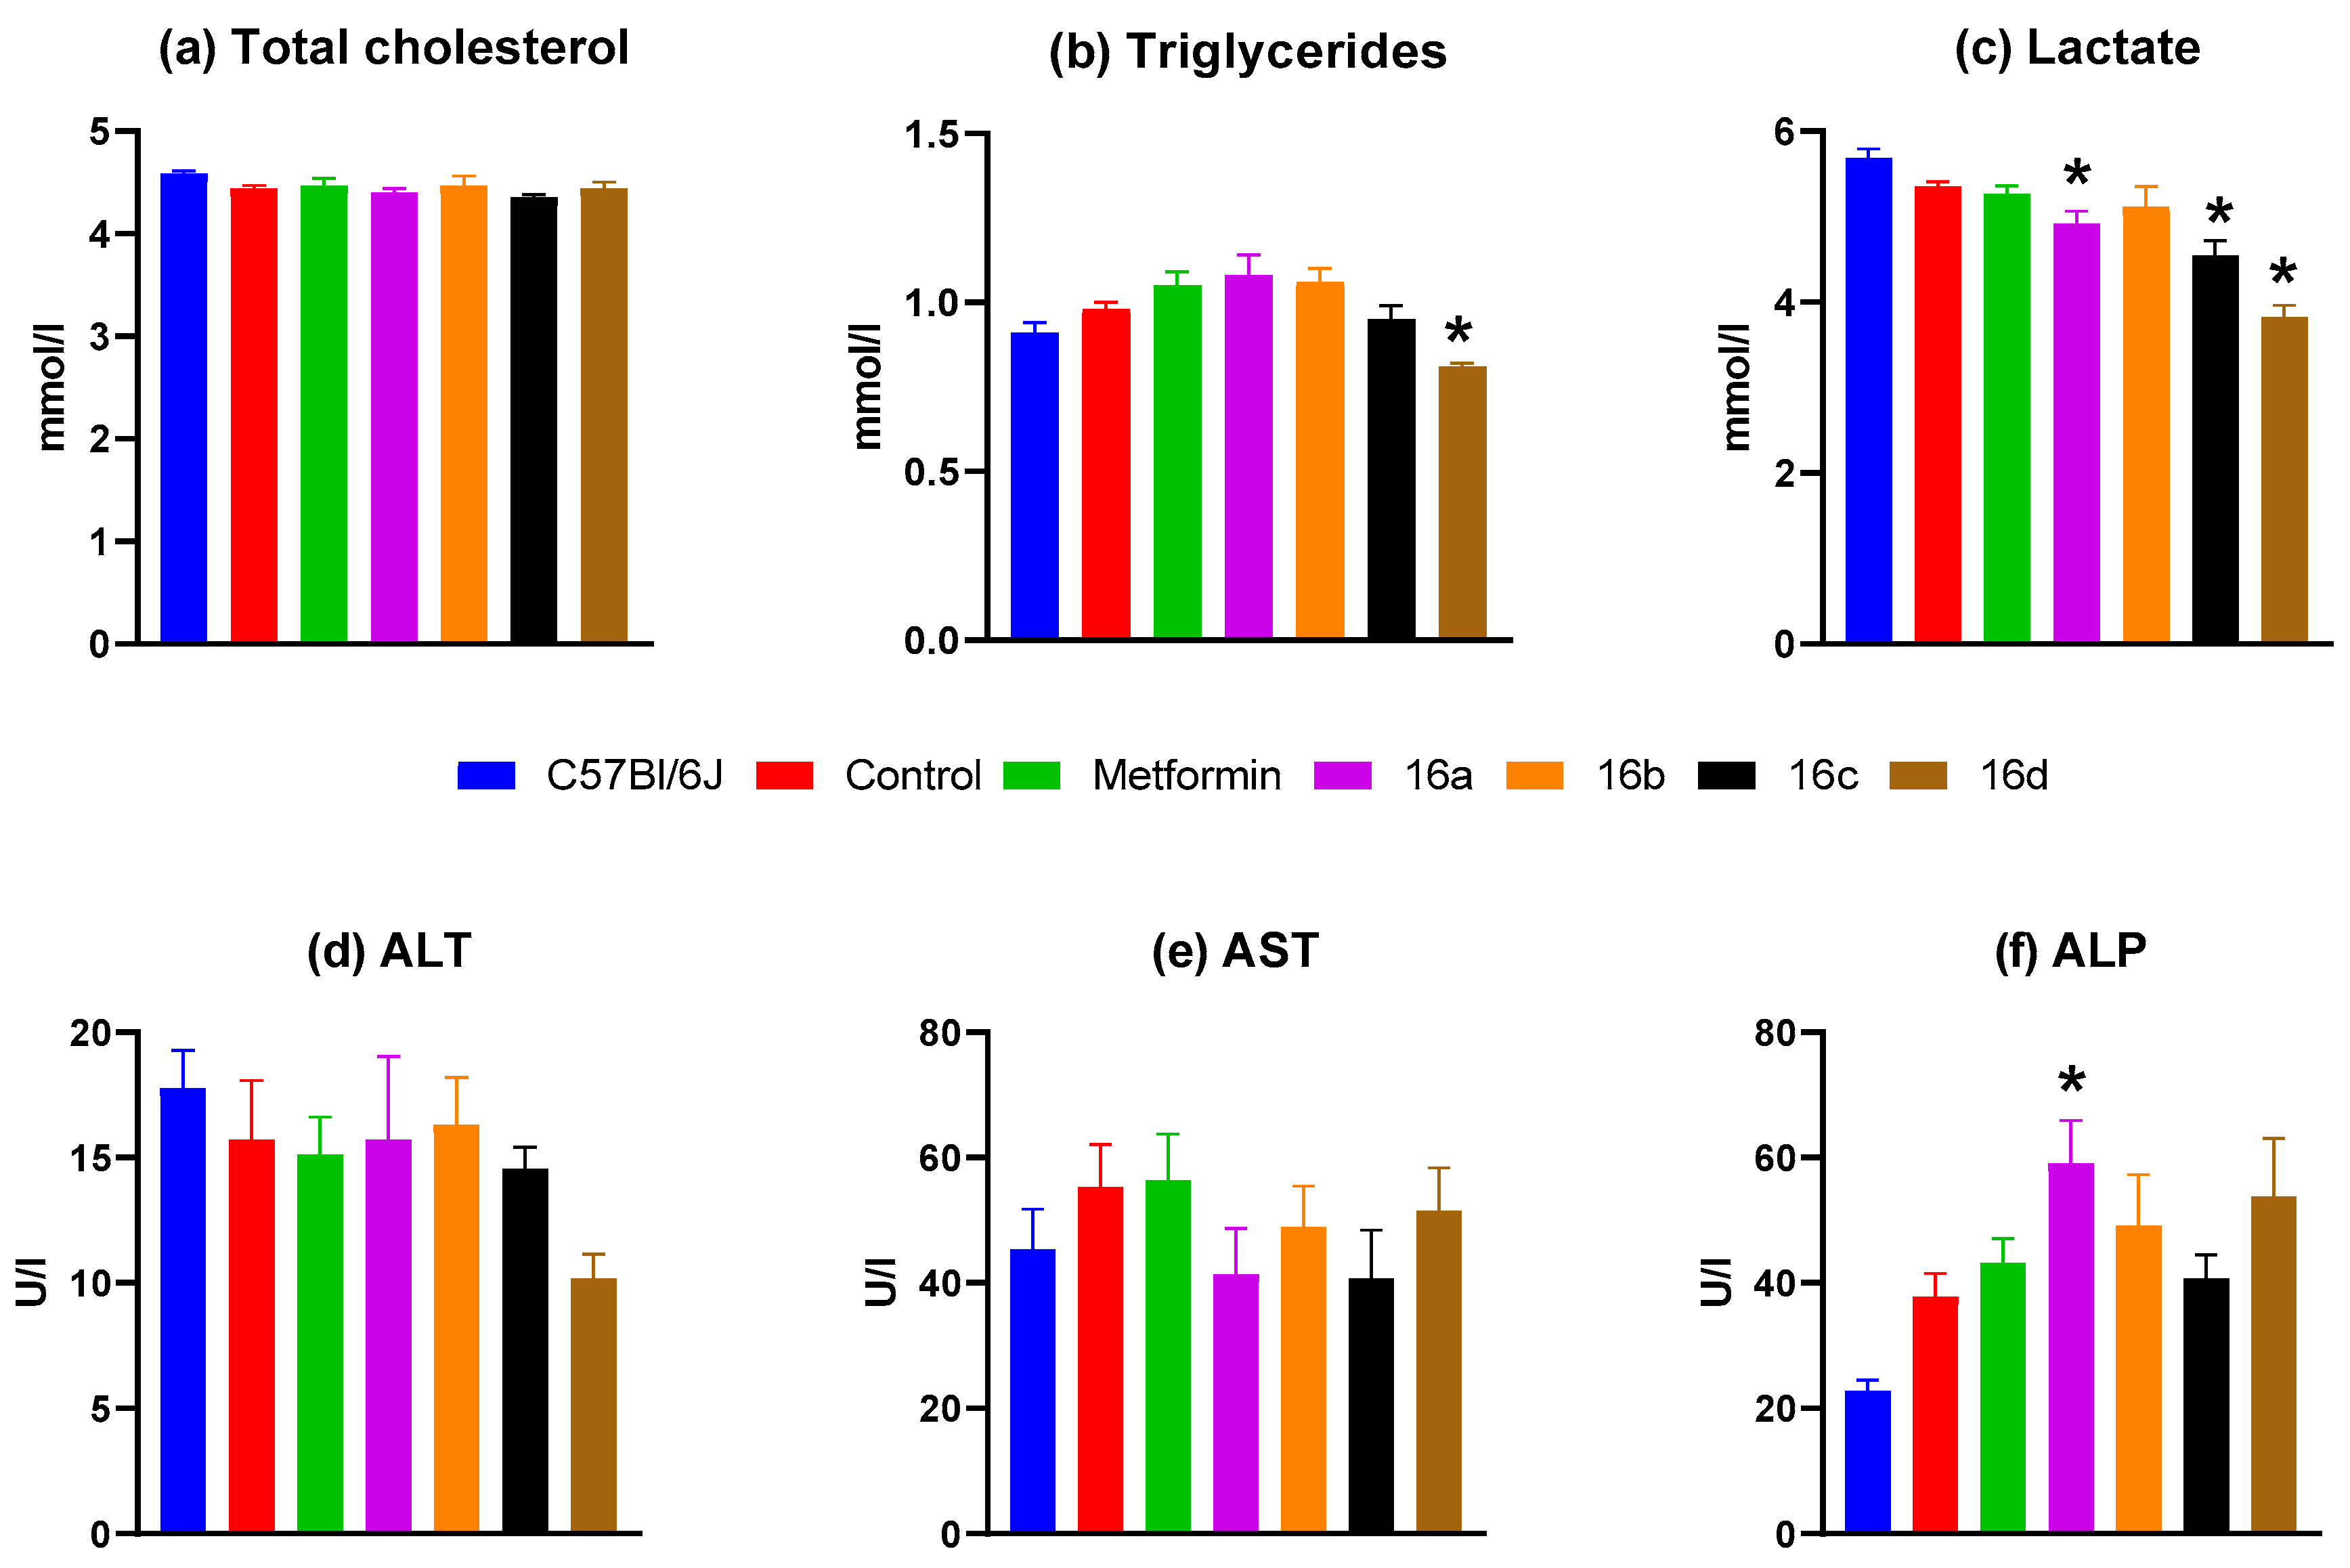
As a result of the conducted biochemical analysis, the levels of several parameters associated with lipid metabolism (total cholesterol and triglycerides in blood), carbohydrate metabolism (lactate), and the activity of certain hepatic enzymes in blood (ALT, AST, ALP) were evaluated. It was found that the only compound demonstrating a hypolipidemic effect was 16d, which significantly reduced blood triglyceride levels compared to the control group (Figure 8b). No significant differences in total cholesterol levels were observed between the groups (Figure 8a). The lactate level was significantly decreased relative to the control group in mice treated with compounds 16a,c,d (Figure 8c).
Changes in the activity of all examined hepatic enzymes across the experimental groups were variable and generally modest (Figure 8d–f). The only statistically significant result was an increase in alkaline phosphatase (ALP) activity observed in the 16a group.

3.2.6. Mass of Animal Organs and Tissues

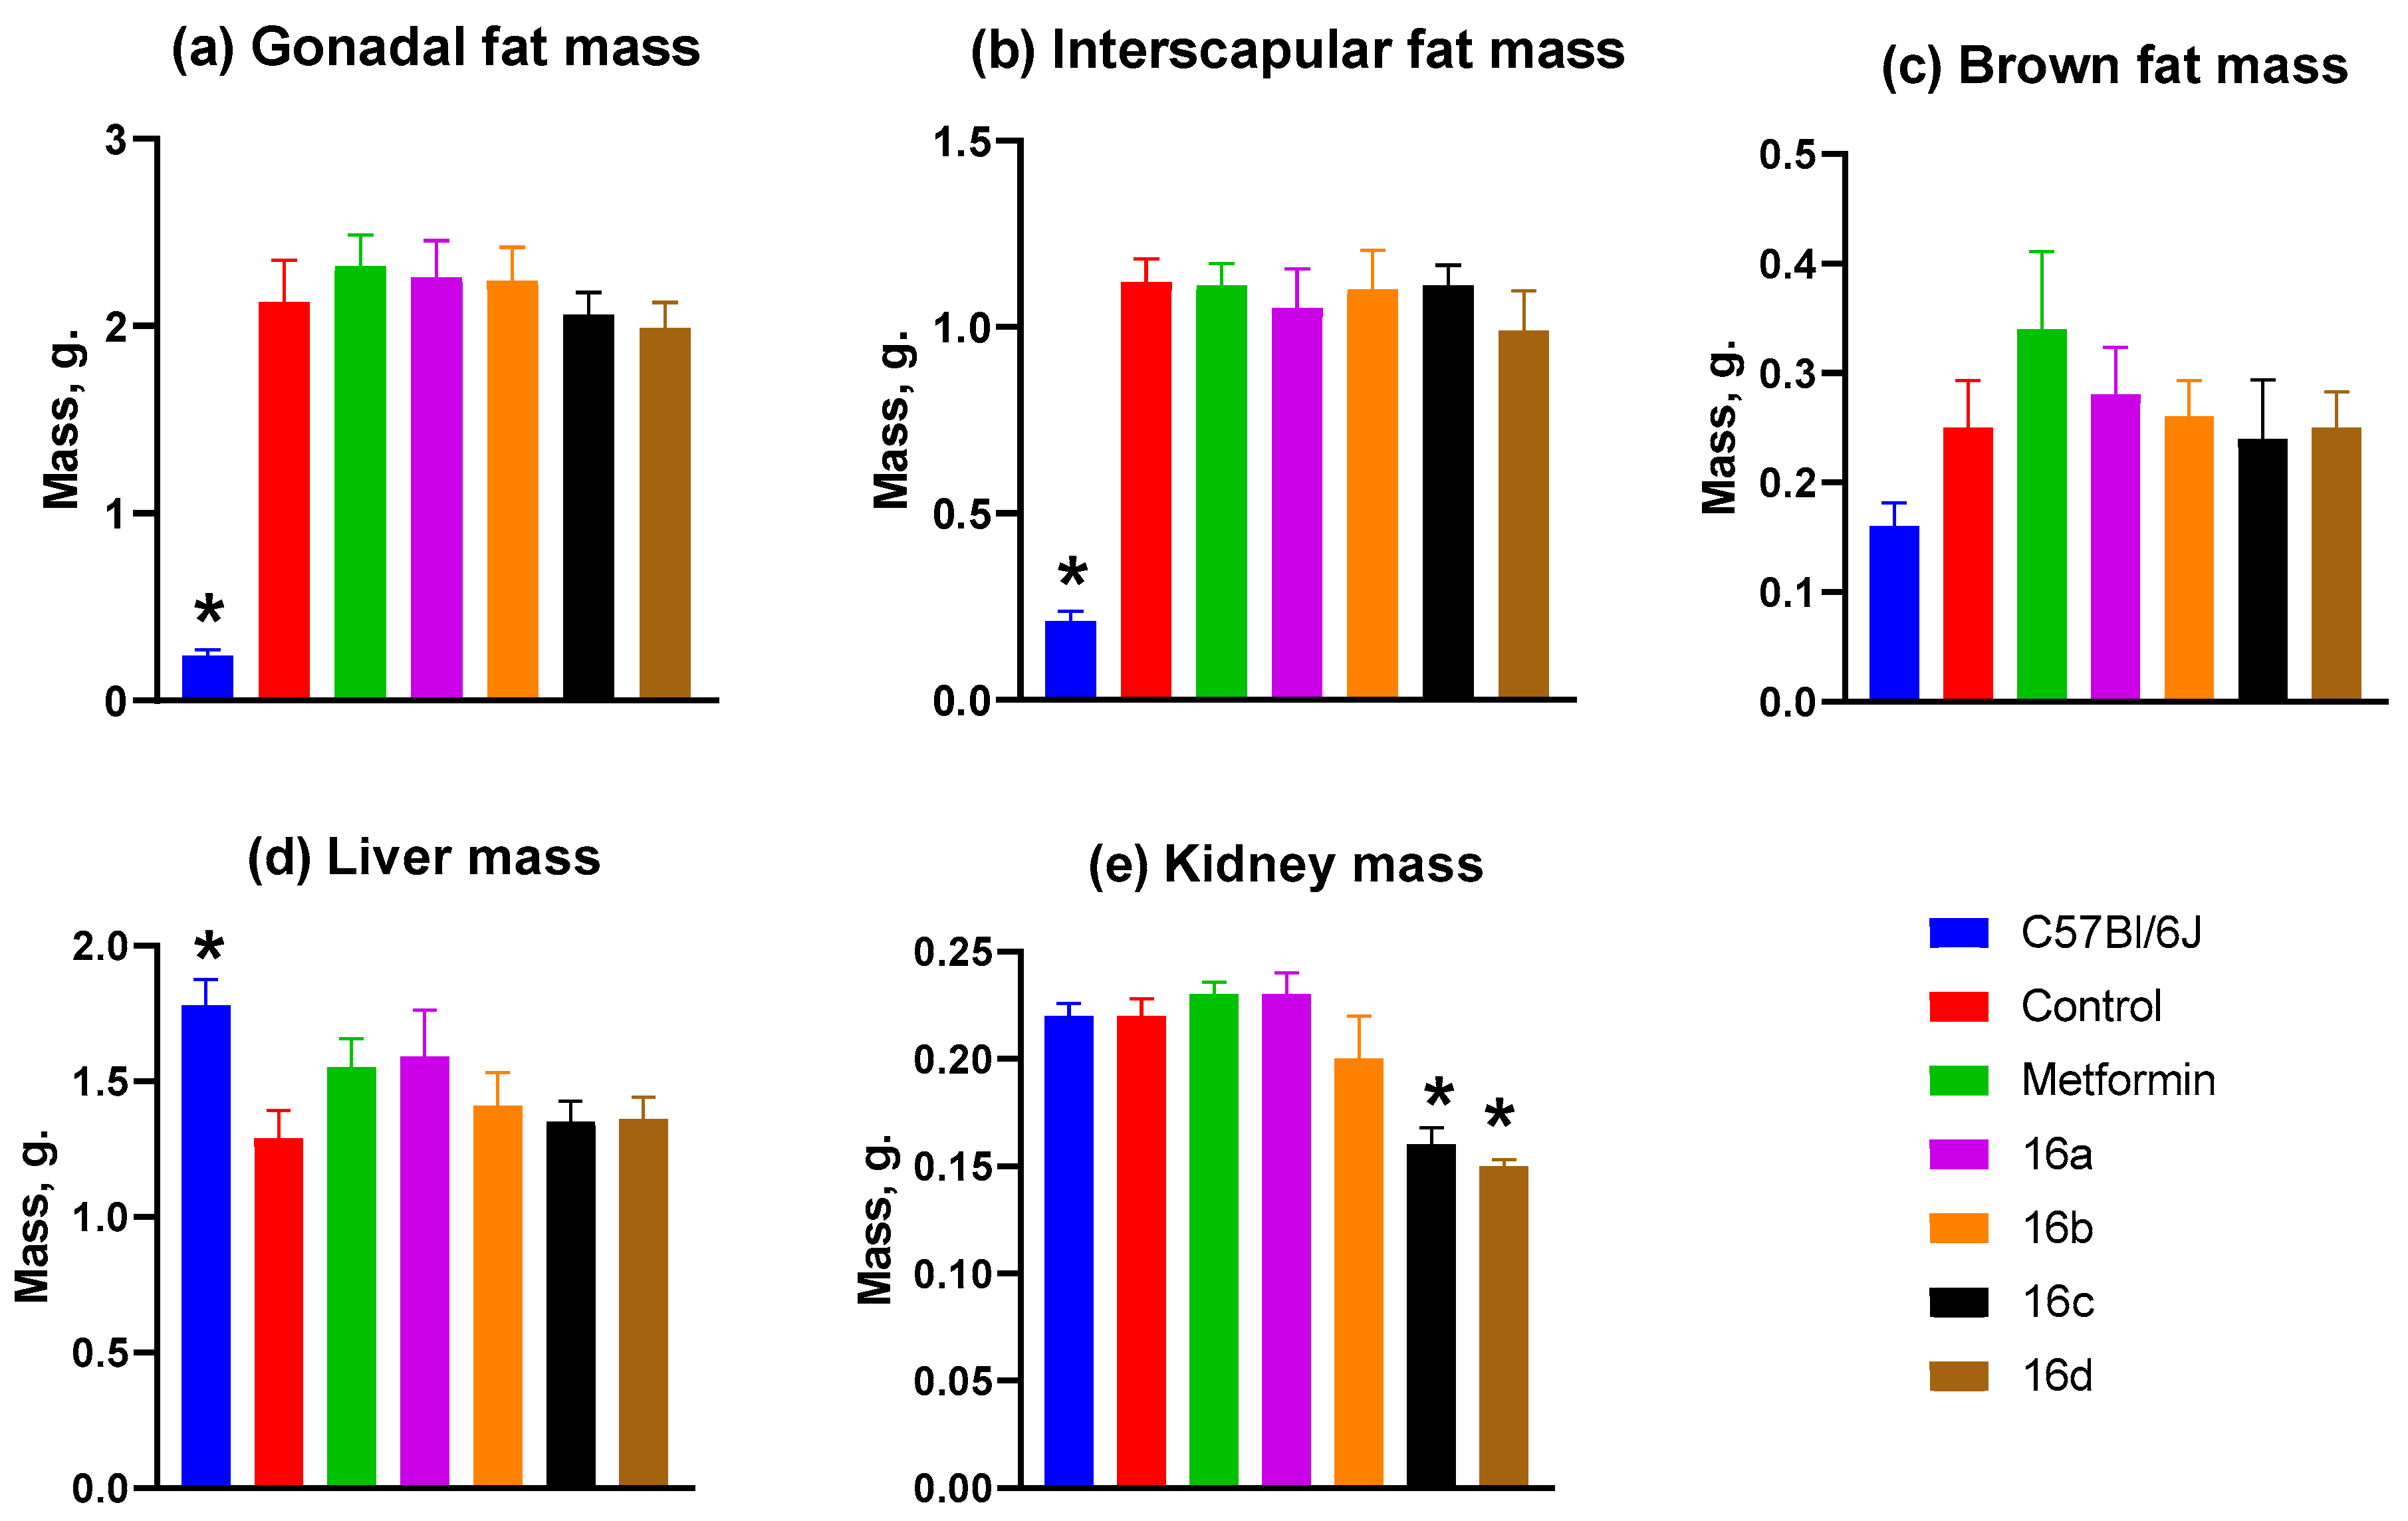
Following the euthanasia of the animals at the end of the experiment, the weights of their liver, kidneys, and adipose tissues (gonadal, interscapular white, and brown fat) were measured. It was found that none of the experimental compounds exerted a significant effect on the mass of adipose tissue (Figure 9a–c). Additionally, liver weight across all experimental groups, except for the intact control group (C57BL/6J), was roughly similar (Figure 9d), which is consistent with the biochemical analysis data.
Furthermore, a statistically significant reduction in kidney weight (Figure 9e) was observed in animals treated with compounds 16c,d.

3.2.7. Histology

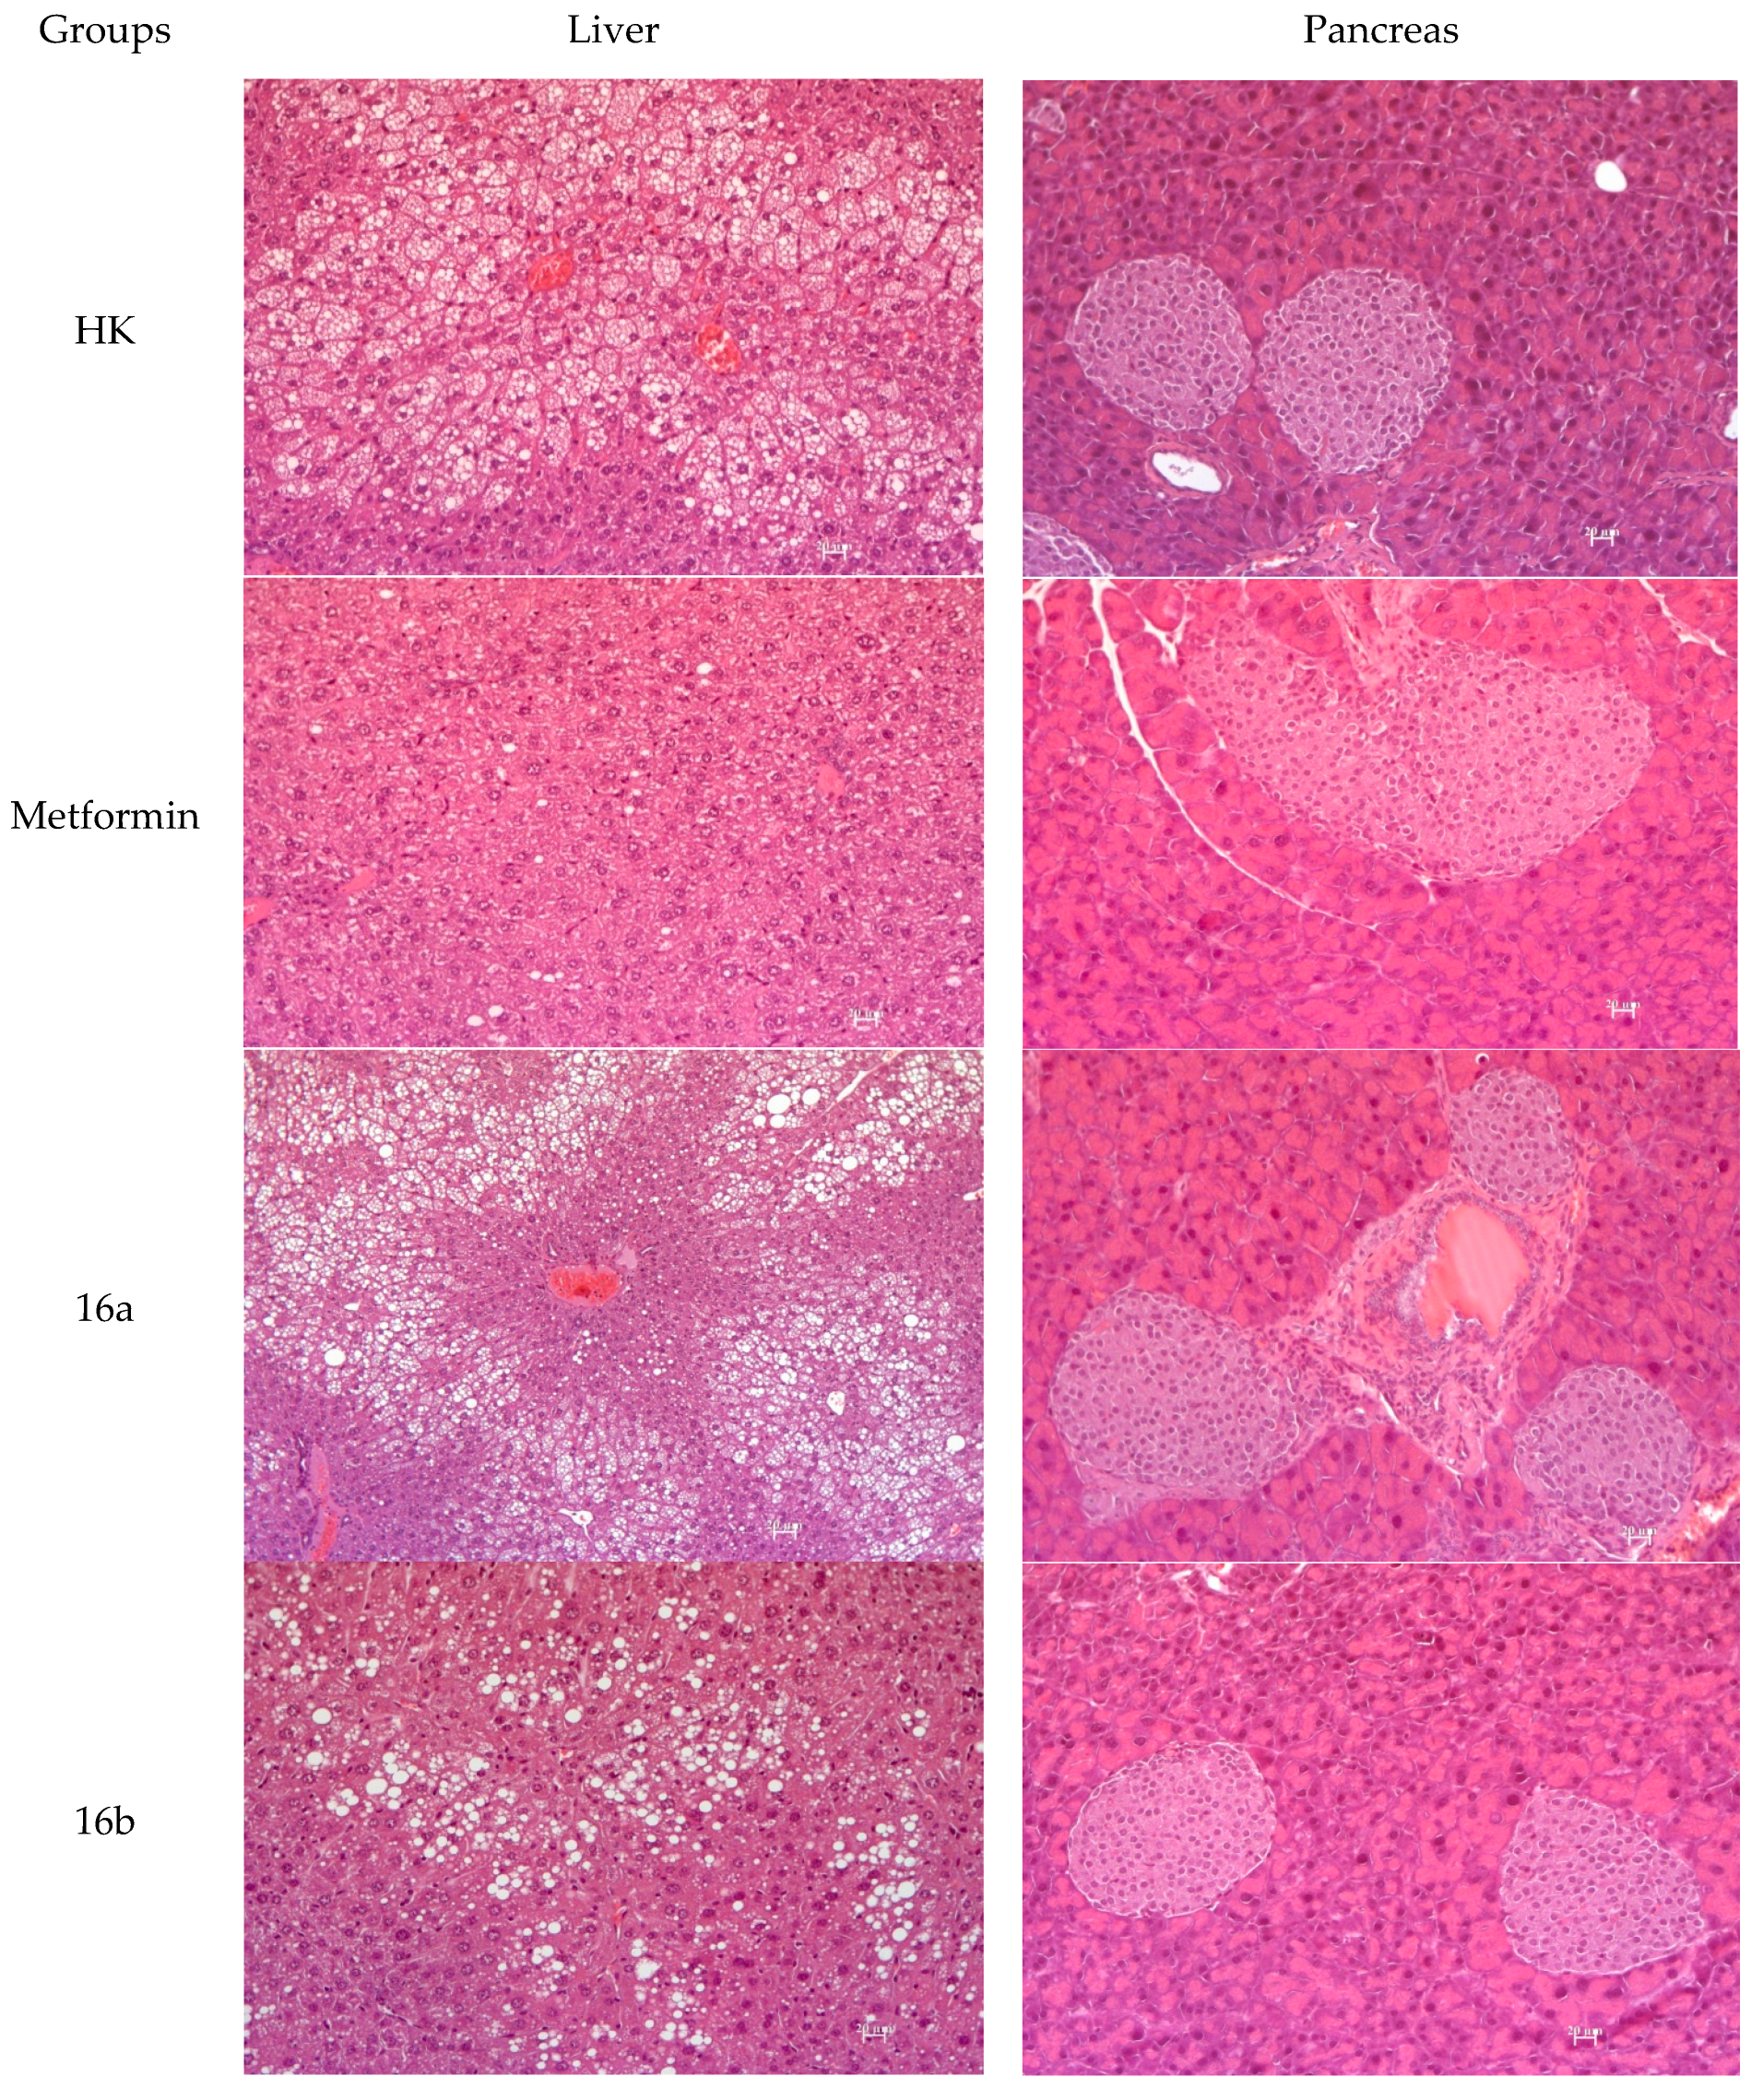
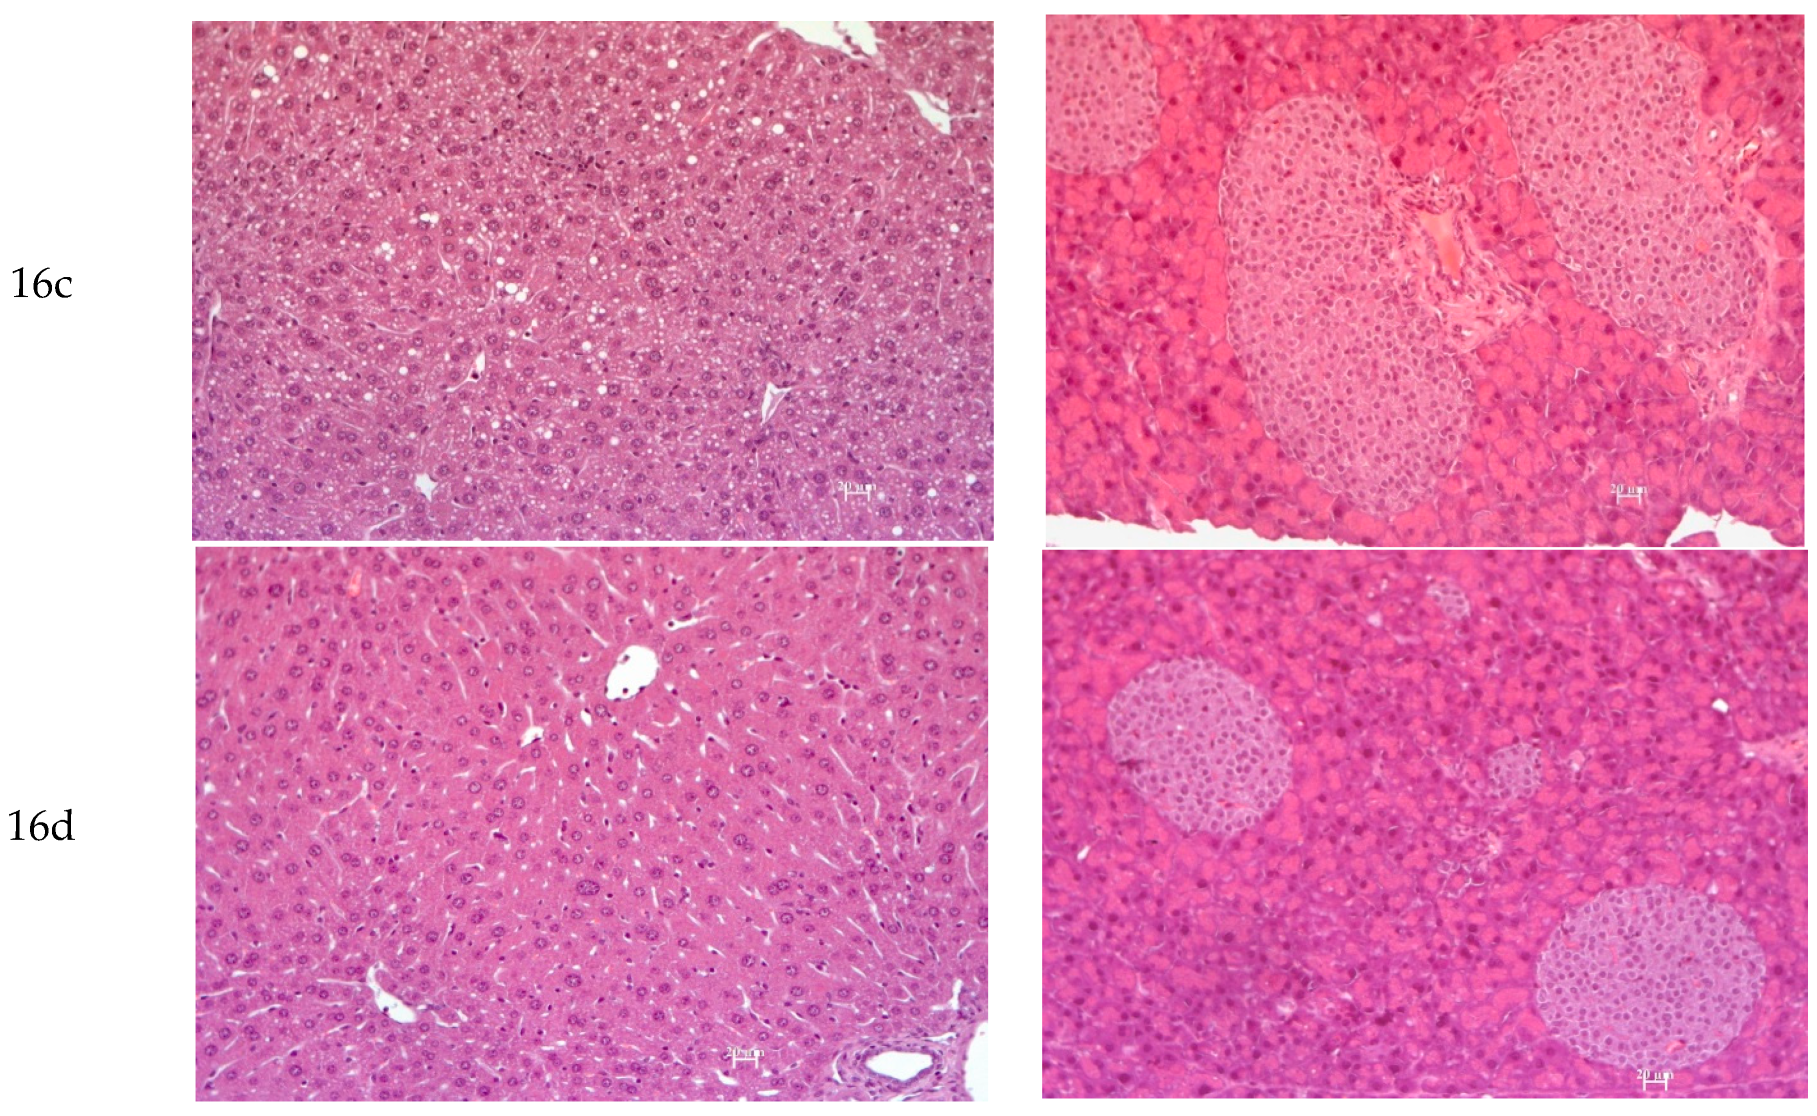
The histological examination of organ and tissue sections from animals at the end of the experiment revealed that control (AY) animals exhibited pronounced signs of T2DM. In their livers, fatty degeneration, hepatocyte necrosis, and vascular disturbances were observed. In the pancreas significant hypertrophy of the islets of Langerhans was noted. The kidneys displayed moderate vascular congestion in the interstitial tissue and vacuolar degeneration of the epithelial cells of the distal tubules. In brown adipose tissue, fat cysts formed by the fusion of large lipid droplets were noted (Figure 10).
In mice treated with the reference drug metformin, a slight positive trend was observed, characterized by a modest reduction in degenerative changes in the liver, a decrease in the size of Langerhans islets in the pancreas, and fewer lipid droplets in adipocytes of brown fat tissue (Figure 10).
In the liver and pancreas of animals receiving test compounds 16c,d varying degrees of improvement in pathological processes were observed. The most effective compound in this series was 16d. In four out of six animals in this group, positive effects on metabolic processes in the liver were noted: only mild hepatocyte dystrophy was present periportally; sinusoid walls remained unchanged; and numerous Kupffer cells and monocytes were seen within their lumens. The pancreas showed a reduction in Langerhans islet size. Compounds 16b,c demonstrated partial positive effects in only two and one animals, respectively. Administration of 16a did not produce any beneficial effects on metabolic dynamics in the liver or pancreas; this group exhibited changes similar to those seen in the negative control group (Figure 10).
In the kidneys and brown adipose tissue across all groups receiving compounds 16a–d, no significant changes compared to the corresponding organs in the negative control group (AY) were observed.

4. Discussion

4.1. Chemistry

In this study, based on the previously developed methodology [19], a series of isopimaric acid amides linked to the fragment (S)-2-ethoxy-3-phenylpropanoic acid (16a–d) was synthesized, differing in the substituent at position 16 of the phenyl ring. The synthetic route used to obtain these new compounds is depicted in Scheme 2.
The synthesis of isopimaric acid derivatives, modified at its terminal double, was carried out under oxidative Heck reaction conditions [25]. The selection of substituents in the isopimaric acid core for the palladium-catalyzed cross-coupling reaction was based on the hypothesis that aromatic structural motifs within the molecule of the glitazar could enhance its antidiabetic activity [26].
The presence of electron-withdrawing groups (such as 2-NO2 or 4-NO2) on the phenyl ring can lead to increased lipophilicity, which may improve membrane permeability [27], as well as create localized electron-deficient regions within the molecules capable of interacting with biological nucleophiles such as proteins, amino acids, nucleic acids, and enzymes [28]. The introduction of 3-OMe and 4-OMe groups increases the electron density of the aromatic ring: this enhances interactions with hydrophobic regions of receptors and stabilizes binding through cation–π interactions (e.g., with positively charged residues of lysine or arginine) [29].
This technique allows a flexible approach to the synthesis of (S)-2-ethoxy-3-phenylpropanoic acid derivatives with terpene acid fragments, since the addition of such a fragment occurs at the last stage, which allows it to be easily varied, as well as the linker connecting the terpene and pharmacophoric fragments.

4.2. Biology

To evaluate the pharmacological activity of the studied compounds 16a–d, C57Bl/6 Ay/a mice were used. Due to a mutation in the agouti gene (Ay/a), these mice exhibit antagonism towards melanocortin receptors, leading to hyperinsulinemia and obesity. As a result, over time, they tend to develop T2DM, making them a suitable model for studying the antidiabetic effects of new therapeutic agents [30]. In this experiment, T2DM was induced in C57Bl/6 Ay/a mice via a high-calorie diet, which consisted of standard pelleted feed supplemented with fat and cookies. The studied compounds were administered at doses determined based on previous experiments with similar substances [19,20]. According to the weekly measurements of body weight and food intake, it was established that these parameters remained approximately constant across all groups throughout the experiment, similarly to the negative control group (AY). This was in accord with the measurements of adipose tissue mass, which showed no significant differences between groups except for the intact control group (C57BL/6J). Additionally, biochemical analysis revealed that only compound 16d influenced lipid metabolism by reducing serum triglyceride levels, while no significant differences from the control group were observed for compounds 16a–c. Therefore, it can be inferred that only compound 16d exhibits weak hypolipidemic activity.
OGTTs conducted two weeks after initiation and after the end of compound administration demonstrated that all tested compounds (16a–d) exhibited statistically significant hypoglycemic activity. In contrast to the reference drug metformin, which reduced blood glucose levels only during the first OGTT with prior compound administration, these compounds showed a more moderate but sustained effect over time. This suggests that the tested compounds have a significantly different mechanism of action compared to metformin: while metformin’s hypoglycemic effect is rapid and pronounced but diminishes within 24 h [31], compounds 16a–d demonstrated a more gradual glucose-lowering activity with signs of accumulation upon repeated dosing.
The insulin tolerance test (ITT) that was carried out after the end of the substances’ administration revealed that only compound 16d enhanced tissue sensitivity to insulin. This indicates that among the studied substances, increased insulin sensitivity was the dominant part of the hypoglycemic action mechanism only for compound 16d. Biochemical and histological analyses supported this conclusion: in the 16d group the most pronounced reduction in blood lactate levels and decreased Langerhans islet size in the pancreas were observed. Based on its structure, it can be hypothesized that increased insulin sensitivity results from the interaction with PPAR-γ receptors, a characteristic feature of such compounds [32].
In a previous study [20], the hypoglycemic activity of a structurally similar compound was investigated, wherein isopimaric acid, which derivatives are incorporated into the compounds examined in this work (16a–d), served as the variable part of the potential glitazar. Overall, it can be noted that the results obtained for the isopimaric acid containing compound are comparable to those observed for 16d. Both demonstrate pronounced hypoglycemic effects, which, according to the ITT data and biochemical analysis, are attributable to increased tissue sensitivity to insulin resulting from PPAR-γ activation. Furthermore, as demonstrated in this study, compound 16d significantly reduced blood triglyceride levels, indicating additional hypolipidemic activity—a property not observed in the case of the isopimaric acid containing compound. Therefore, it can be concluded that chemical modification of isopimaric acid may enhance its efficacy as an antidiabetic agent as part of the potential glitazar. The presence of a nitro group in the ortho position of the aromatic ring (compound 16d) appears to be critical on the hypoglycemic and hypolipidemic activities of the molecule. To establish clear correlations between structure and activity, it seems necessary to synthesize new derivatives with a variation of substituents in the ortho position and test its pharmacological properties in vivo.

5. Conclusions

In the present study, four potential dual agonists of PPAR-α and PPAR-γ were synthesized, in which derivatives of isopimaric acid were attached to the pharmacophore fragment. The conducted OGTTs revealed that all investigated compounds exhibited pronounced hypoglycemic activity, with the effect persisting even after the end of administration. However, the subsequently performed ITT demonstrated that only compound 16d reduced blood glucose levels primarily through the increase in tissue sensitivity to insulin, a characteristic feature of PPAR-γ agonists. Biochemical analyses indicated that notable hypolipidemic activity was observed exclusively for compound 16d, which decreased triglyceride levels in the blood. Additionally, assessments of adipose tissue weights showed no significant differences between experimental groups. Histological examinations of tissues and organs further indicated that the least pronounced signs of metabolic disturbances in the liver and pancreas were observed in the group of animals treated with compound 16d.
Thus, among the synthesized derivatives based on isopimaric acid, compound 16d appears to be the most promising as a potential glitazar candidate, demonstrating both hypoglycemic and hypolipidemic activities while exhibiting minimal side effects.

Supplementary Materials

The following supporting information can be downloaded at: https://www.mdpi.com/article/10.3390/scipharm93030044/s1, Figures S1–S24: 1H and 13C-NMR spectra of compound 10,15,16a–d, Figures S25–S28: HPLC spectra of compound 16a–d.

Author Contributions

Chemistry investigation: M.E.B. and M.A.G.; in vivo investigation: S.A.B., M.V.K., Y.V.M., I.P.Z., S.V.N. and N.A.Z.; project administration and supervision: O.A.L., M.V.K. and N.F.S.; writing: M.E.B. and S.A.B.; data curation: D.A.K.; writing—review and editing: O.A.L. and M.V.K. All authors have read and agreed to the published version of the manuscript.

Funding

This research was funded by the Russian Scientific Foundation project No. 24-25-00120.

Institutional Review Board Statement

The experiment protocol was approved by the Ethics Committee of N.N. Vorozhtsov Institute of Organic Chemistry SB RAS (protocol no. P-01-01.2024-14).

Informed Consent Statement

Not applicable.

Data Availability Statement

No new data were created or analyzed in this study. Data sharing is not applicable to this article.

Acknowledgments

The authors would like to acknowledge the Multi-Access Chemical Research Center SB RAS for spectral and analytical measurements. The authors would like to thank Vladislav Fomenko for providing (S)-ethyl 2-ethoxy-3-(4-hydroxyphenyl)propanoate.

Conflicts of Interest

The authors declare no conflicts of interest.

Abbreviations

The following abbreviations are used in this manuscript:
NAFLDNon-Alcoholic Fatty Liver Disease
T2DMType 2 Diabetes Mellitus
MSMetabolic Syndrome
PPARPeroxisome Proliferator-Activated Receptors
DIADDiisopropyl Azodicarboxylate
THFTetrahydrofuran
HPLCHigh-Performance Liquid Chromatography
NMRNuclear magnetic resonance
OGTTOral Glucose Tolerance Test
AUCAreas Under the Curve
ITTInsulin Tolerance Test
ALTAlanine Aminotransferase
ASTAspartate Aminotransferase
ALPAlkaline Phosphatase

References

  1. Mohamed, S.; Shalaby, M.A.; El-Shiekh, R.A.; Emam, S.R.; Bakr, A.F. Metabolic syndrome: Risk factors, diagnosis, pathogenesis, and management with natural approaches. Food Chem. Adv. 2023, 3, 100335. [Google Scholar] [CrossRef]
  2. Kuschnir, M.C.; Bloch, K.V.; Szklo, M.; Klein, C.H.; Barufaldi, L.A.; Abreu Gde, A.; Schaan, A.; da Veiga, G.V.; da Silva, T.L.N.; de Vasconcellos, M.T.L.; et al. ERICA: Prevalence of metabolic syndrome in Brazilian adolescents. Rev. Saude Publica 2016, 50 (Suppl. 1), 11s. [Google Scholar] [CrossRef]
  3. Xiang, Y.; Zhou, W.; Duan, X.; Fan, Z.; Wang, S.; Liu, S.; Liu, L.; Wang, F.; Yu, L.; Zhou, F.; et al. Metabolic syndrome, and particularly the hypertriglyceridemic-waist phenotype, increases breast cancer risk, and adiponectin is a potential mechanism: A case–control study in chinese women. Front. Endocrinol. 2020, 10, 905. [Google Scholar] [CrossRef]
  4. Lee, J.; Lee, K.S.; Kim, H.; Jeong, H.; Choi, M.J.; Yoo, H.W.; Han, T.-H.; Lee, H. The relationship between metabolic syndrome and the incidence of colorectal cancer. Environ. Health Prev. Med. 2020, 25, 6. [Google Scholar] [CrossRef] [PubMed]
  5. Grgurevic, I.; Podrug, K.; Mikolasevic, I.; Kukla, M.; Madir, A.; Tsochatzis, E.A. Natural history of nonalcoholic fatty liver disease: Implications for clinical practice and an individualized approach. Can. J. Gastroenterol. Hepatol. 2020, 2020, 9181368. [Google Scholar] [CrossRef] [PubMed]
  6. Wang, Y.; Tu, R.; Yuan, H.; Shen, L.; Hou, J.; Liu, X.; Niu, M.; Zhai, Z.; Pan, M.; Wang, C. Associations of unhealthy lifestyles with metabolic syndrome in Chinese rural aged females. Sci. Rep. 2020, 10, 2718. [Google Scholar] [CrossRef]
  7. American Diabetes Association. 2. Classification and Diagnosis of Diabetes. Diabetes Care 2017, 40 (Suppl. 1), S11–S24. [Google Scholar] [CrossRef]
  8. Yazıcı, D.; Sezer, H. Insulin Resistance, Obesity and Lipotoxicity. Adv. Exp. Med. Biol. 2017, 960, 277–304. [Google Scholar] [CrossRef]
  9. Erion, D.M.; Park, H.J.; Lee, H.Y. The role of lipids in the pathogenesis and treatment of type 2 diabetes and associated co-morbidities. BMB Rep. 2016, 49, 139–148. [Google Scholar] [CrossRef]
  10. Dutta, S.; Shah, R.B.; Singhal, S.; Dutta, S.B.; Bansal, S.; Sinha, S.; Haque, M. Metformin: A review of potential mechanism and therapeutic utility beyond diabetes. Drug Des. Dev. Ther. 2023, 17, 1907–1932. [Google Scholar] [CrossRef]
  11. Meier, J.J.; Nauck, M.A. Risk of pancreatitis in patients treated with incretin-based therapies. Diabetologia 2014, 57, 1320–1324. [Google Scholar] [CrossRef] [PubMed]
  12. Wilcox, G. Insulin and insulin resistance. Clin. Biochem. Rev. 2005, 26, 19–39. [Google Scholar] [PubMed]
  13. Ruscica, M.; Ferri, N.; Banach, M.; Sirtori, C.R.; Corsini, A. Side effects of statins: From pathophysiology and epidemiology to diagnostic and therapeutic implications. Cardiovasc. Res. 2023, 118, 3288–3304. [Google Scholar] [CrossRef] [PubMed]
  14. Zadelaar, A.S.; Boesten, L.S.; Jukema, J.W.; van Vlijmen, B.J.; Kooistra, T.; Emeis, J.J.; Lundholm, E.; Camejo, G.; Havekes, L.M. Dual PPARalpha/gamma agonist tesaglitazar reduces atherosclerosis in insulin-resistant and hypercholesterolemic ApoE*3Leiden mice. Arterioscler. Thromb. Vasc. Biol. 2006, 26, 2560–2566. [Google Scholar] [CrossRef]
  15. Agrawal, R. The first approved agent in the Glitazar’s Class: Saroglitazar. Curr. Drug Targets 2014, 15, 151–155. [Google Scholar] [CrossRef]
  16. Li, P.P.; Shan, S.; Chen, Y.T.; Ning, Z.Q.; Sun, S.J.; Liu, Q.; Lu, X.; Xie, M.; Shen, Z. The PPARalpha/gamma dual agonist chiglitazar improves insulin resistance and dyslipidemia in MSG obese rats. Br. J. Pharmacol. 2006, 148, 610–618. [Google Scholar] [CrossRef]
  17. Newman, D.J.; Cragg, G.M. Natural products as sources of new drugs from 1981 to 2014. J. Nat. Prod. 2016, 79, 629–661. [Google Scholar] [CrossRef]
  18. Fomenko, V.; Blokhin, M.; Kuranov, S.; Khvostov, M.; Baev, D.; Borisova, M.S.; Luzina, O.; Tolstikova, T.G.; Salakhutdinov, N.F. Triterpenic acid amides as a promising agent for treatment of metabolic syndrome. Sci. Pharm. 2021, 89, 4. [Google Scholar] [CrossRef]
  19. Khvostov, M.V.; Blokhin, M.E.; Borisov, S.A.; Fomenko, V.V.; Meshkova, Y.V.; Zhukova, N.A.; Nikonova, S.V.; Pavlova, S.V.; Pogosova, M.A.; Medvedev, S.P.; et al. Antidiabetic effect of dihydrobetulonic acid derivatives as PPARα/γ agonists. Sci. Pharm. 2024, 92, 65. [Google Scholar] [CrossRef]
  20. Blokhin, M.E.; Kuranov, S.O.; Khvostov, M.V.; Fomenko, V.V.; Luzina, O.A.; Zhukova, N.A.; Elhajjar, C.; Tolstikova, T.G.; Salakhutdinov, N.F. Terpene-containing analogues of glitazars as potential therapeutic agents for metabolic syndrome. Curr. Issues Mol. Biol. 2023, 45, 2230–2247. [Google Scholar] [CrossRef]
  21. San Feliciano, A.; Medarde, M.; Cabellero, E.; Tome, F.; Hebrero, B. β-Stereospecific hydroboration of 13-epi-pimar-8(14)-enes. J. Chem. Soc. Perkin Trans. 1 1992, Issue 13, 1665–1669. [Google Scholar] [CrossRef]
  22. Riddick, J.A.; Bunger, W.B.; Sakano, T.K. Organic Solvents: Physical Properties and Methods of Purification, 4th ed.; Wiley-Blackwell: Hoboken, NJ, USA, 1986; ISBN 9780471084679. [Google Scholar]
  23. Tai, M.M. A mathematical model for the determination of total area under glucose tolerance and other metabolic curves. Diabetes Care 1994, 17, 152–154. [Google Scholar] [CrossRef]
  24. Bohnert, T.; Prakash, C. ADME profiling in drug discovery and development: An overview. In Encyclopedia of Drug Metabolism and Interactions; Lyubimov, A.V., Ed.; Wiley: Hoboken, NJ, USA, 2012; pp. 1–42. [Google Scholar] [CrossRef]
  25. Gromova, M.A.; Kharitonov, Y.V.; Rybalova, T.V.; Shults, E.E. Synthetic studies on tricyclic diterpenoids: Convenient synthesis of 16-arylisopimaranes. Monatshefte Chem. 2020, 151, 1817–1827. [Google Scholar] [CrossRef]
  26. Kalantri, S.; Thakkar, A.; Vora, A.; Alavala, R.R. Towards a mechanistic understanding of atherosclerosis drug design. In Applications of Computational Tools in Drug Design and Development; Rao, G.S.K., Alavala, R.R., Eds.; Springer: Singapore, 2025; pp. 801–857. [Google Scholar] [CrossRef]
  27. Wu, M.C.; Ye, W.R.; Zheng, Y.J.; Zhang, S.S. Oxamate enhances the anti-inflammatory and insulin-sensitizing effects of metformin in diabetic mice. Pharmacology 2017, 100, 218–228. [Google Scholar] [CrossRef] [PubMed]
  28. Nepali, K.; Lee, H.Y.; Liou, J.P. Nitro-Group-Containing Drugs. J. Med. Chem. 2019, 62, 2851–2893. [Google Scholar] [CrossRef] [PubMed]
  29. Chiodi, D.; Ishihara, Y. Methoxy group: A non-lipophilic “scout” for protein pocket finding. Future Med. Chem. 2025, 17, 983–985. [Google Scholar] [CrossRef] [PubMed]
  30. Kumar, S.; Singh, R.; Vasudeva, N.; Sharma, S. Acute and chronic animal models for the evaluation of anti-diabetic agents. Cardiovasc. Diabetol. 2012, 11, 9. [Google Scholar] [CrossRef]
  31. Foretz, M.; Guigas, B.; Viollet, B. Metformin: Update on mechanisms of action and repurposing potential. Nat. Rev. Endocrinol. 2023, 19, 460–476. [Google Scholar] [CrossRef]
  32. Mirza, A.Z.; Althagafi, I.I.; Shamshad, H. Role of PPAR receptor in different diseases and their ligands: Physiological importance and clinical implications. Eur. J. Med. Chem. 2019, 166, 502–513. [Google Scholar] [CrossRef]
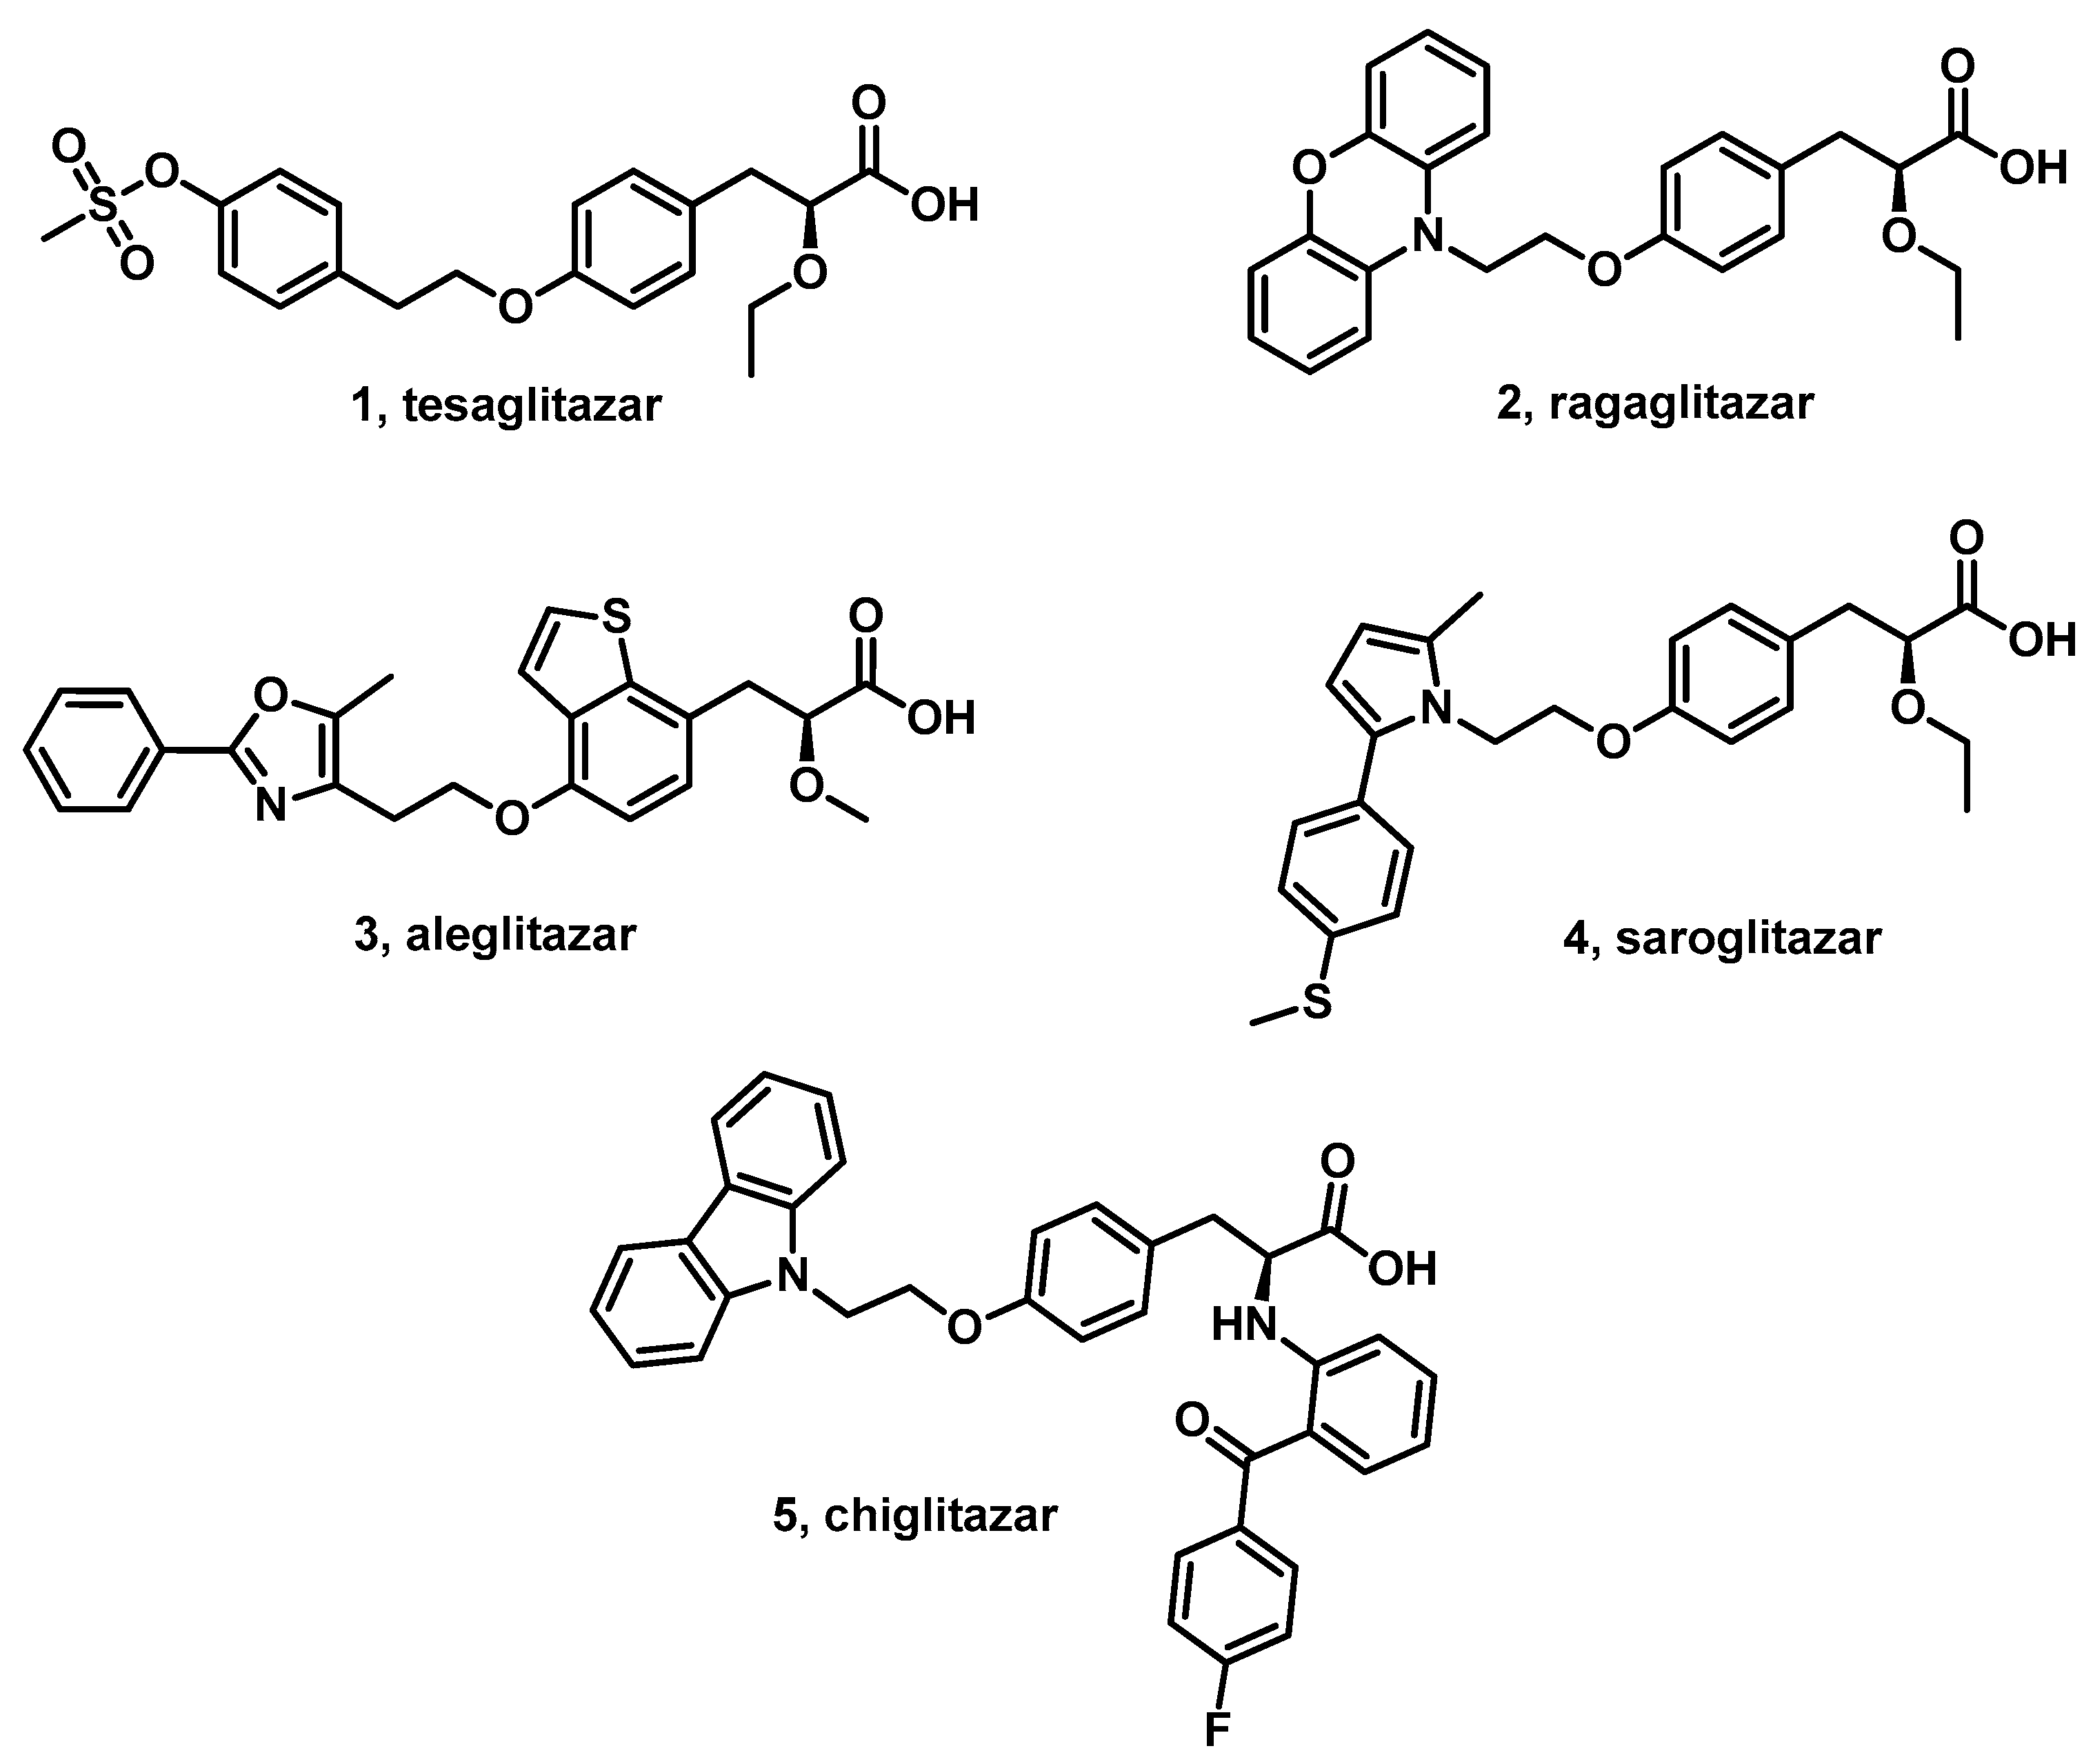
Figure 1. The chemical structures of some glitazars.
Scipharm 93 00044 g001
Figure 2. Isopimaric acid derivative.
Scipharm 93 00044 g002
Figure 3. Experiment design.
Scipharm 93 00044 g003
Scheme 1. Synthesis of N-(2-hydroxyethyl)isopimaranamides 10a–d.
Scipharm 93 00044 sch001
Figure 4. Dynamics of changes in body weight (a) and food consumption (b) in mice during the experiment. Group size n = 7. Statistical analysis was performed by one-way ANOVA followed by the Dunnett’s multiple comparisons test.
Scipharm 93 00044 g004
Figure 5. OGTT Results after two weeks of the experiment. All test substances were administered 30 min before the glucose load. (a) Glycemic curves, (b) Area under glycemic curves (AUC). BGL—blood glucose level. Group size n = 7. * p ≤ 0.05 compared to the control group. Statistical analysis was performed by one-way ANOVA followed by the Dunnett’s multiple comparisons test.
Scipharm 93 00044 g005
Figure 6. OGTT results two days after cancelation of a four-week administration of substances. (a) Glycemic curves, (b) Area under glycemic curves (AUC). Group size n = 7. * p ≤ 0.05 compared to the AY group. Statistical analysis was performed by one-way ANOVA followed by the Dunnett’s multiple comparisons test.
Scipharm 93 00044 g006
Figure 7. ITT results. The test was carried out 3 days after 4 weeks of daily substance administration. (a) Glycemic curves, (b) Area under glycemic curves (AUC). Group size n = 7. * p ≤ 0.05 compared to the control group. Statistical analysis was performed by one-way ANOVA followed by the Dunnett’s multiple comparisons test.
Scipharm 93 00044 g007
Figure 8. Results of biochemical studies after completion of substance administration. (a) Total cholesterol, (b) Triglycerides, (c) Lactate, (d) alanine aminotransferase (ALT), (e) aspartate aminotransferase (AST), (f) alkaline phosphatase (ALP). Group size n = 7. * p ≤ 0.05 compared to the control group. Statistical analysis was performed by one-way ANOVA followed by the Dunnett’s multiple comparisons test.
Scipharm 93 00044 g008
Figure 9. Liver, kidney and adipose tissue weight of animals (a) liver weight, (b) gonadal fat weight, (c) interscapular fat weight, (d) brown fat weight, (e) kidney weight. Group size n = 7. * p ≤ 0.05 compared to the control group. Statistical analysis was performed by one-way ANOVA followed by the Dunnett’s multiple comparisons test.
Scipharm 93 00044 g009
Figure 10. Histological evaluation of liver and pancreas in mice after 4 weeks of the experiment. Hematoxylin and eosin staining. ×200. The presented images are representative for n = 3 repeats of the histological analysis for each organ of each animal.
Scipharm 93 00044 g010aScipharm 93 00044 g010b
Scheme 2. Synthesis of new isopimaric acid derivatives 16a–d.
Scipharm 93 00044 sch002
Disclaimer/Publisher’s Note: The statements, opinions and data contained in all publications are solely those of the individual author(s) and contributor(s) and not of MDPI and/or the editor(s). MDPI and/or the editor(s) disclaim responsibility for any injury to people or property resulting from any ideas, methods, instructions or products referred to in the content.