Article

Application of Lactose Co-Processed Excipients as an Alternative for Bridging Pharmaceutical Unit Operations: Manufacturing an Omeprazole Tablet Prototype via Direct Compression

by
Raymar Andreina Lara Garcia
1,*,†,
Jesús Alberto Afonso Urich
1,2,*,†,
Andreina Isabel Afonso Urich
1,
Dalibor Jeremic
3 and
Johannes Khinast
1,2
1
Research Center Pharmaceutical Engineering GmbH, Inffeldgasse 13, 8010 Graz, Austria
2
Institute of Process and Particle Engineering, Graz University of Technology, Inffeldgasse 13, 8010 Graz, Austria
3
Department of Health Studies—Biomedical Science, FH JOANNEUM, Alte Poststrasse 149, 8020 Graz, Austria
*
Authors to whom correspondence should be addressed.
These authors contributed equally to this work.
Sci. Pharm. 2025, 93(2), 24; https://doi.org/10.3390/scipharm93020024
Submission received: 26 February 2025 / Revised: 20 May 2025 / Accepted: 22 May 2025 / Published: 28 May 2025

Abstract

:
Improving the manufacturability of drug formulations via direct compression has been of great interest for the pharmaceutical industry. Selecting excipients plays a vital role in obtaining a high-quality product without the wet granulation processing step. In particular, for diluents which are usually present in a larger amount in a formulation, choosing the correct one is of utmost importance in the production of tablets via any method. In this work, we assessed the possibility of manufacturing a small-molecule drug product, omeprazole, which has been historically manufactured via a multi-step processes such as wet granulation and multiple-unit pellet system (MUPS). For this purpose, four prototypes were developed using several diluents: a co-processed excipient (Microcelac®), two granulated forms of alpha-lactose monohydrate (Tablettose® 70 and Tabletose® 100), and a preparation of microcrystalline cellulose (Avicel® PH102) and lactose (DuraLac® H), both of which are common excipients without any enhancement. The tablets were produced using a single punch tablet press and thoroughly characterized physically and chemically in order to assess their functionality and adherence to drug product specifications. The direct compression process was used for the manufacturing of all proposed formulations, and the prototype formulated using Microcelac® showed the best results and performance during the compression process. In addition, it remained stable over twelve months under 25 °C/60% RH conditions.

Graphical Abstract

1. Introduction

In pharmaceutical manufacturing, specifically in tablet production, various processes routes can be applied, e.g., direct compression, wet granulation, and dry granulation. Direct compression involves the mixing and processing of a tablet’s formulation ingredients, followed by compression to directly produce tablets from powdered excipients and active pharmaceutical ingredients (APIs) [1]. This tablet manufacturing method has several benefits: it is cost-effective since it requires fewer unit operations than wet granulation or any other multistep manufacturing approach. It is more suitable for moisture- and heat-sensitive APIs, and it yields better stability [2]. Additionally, changes in the drug dissolution profile during storage are uncommon [3,4]. Direct compression tablets disintegrate into API particles instead of granules; this accelerates the dissolution process and facilitates absorption for tablets containing APIs with low solubility [1,5,6]. Lastly, the use of solvents and the need for drying energy of wet granules is eliminated, making it a greener and more sustainable route of production.
However, direct compression has some drawbacks. One key limitation is that it requires careful evaluation of the drug’s physical properties, such as flowability and compressibility, as well as those of the excipients used in the formulation. These are critical factors that require precise control [4,5]. In direct compression, characteristics of the drug substance, such as the particle size, flowability, and compressibility, play a crucial role in the final product’s quality and performance. Any variations or inconsistencies in these properties can significantly impact the tablet’s assay, integrity, dissolution, and overall effectiveness. Similarly, the physical properties of excipients used in direct compression, such as their particle size, compressibility, and lubrication capacity, must be carefully evaluated. The choice and quality of excipients can influence the flowability of the powder blend and the tablet’s hardness, disintegration, and content uniformity. Therefore, to ensure the success of direct compression, manufacturers must meticulously assess and control the physical characteristics of both the drug substance and the excipients. This involves rigorous testing, monitoring, and adjustment of the formulation and process parameters to achieve the desired tablet quality, stability, and performance [2].
Selecting a suitable filler–binder component is of utmost importance when formulating directly compressed tablets. This excipient plays a pivotal role in determining the success or failure of the formulation. It is essential for the diluent to have both compressibility and flowability, which often makes it a specialized ingredient provided by a limited number of suppliers. In addition, the diluent’s required physicochemical properties cannot be provided by only one excipient and it often necessary to use a combination of materials [2]. This underscores the significance of carefully considering the filler–binder for ensuring optimal performance and quality in direct-compression tablet formulations. In this context, the use and evaluation of co-processed excipients have been on the rise recently. Co-processed excipients are solid particulate mixtures of organic or inorganic substances, i.e., a combination of compounds, produced via specialized manufacturing methods, which have improved physicochemical properties compared to simple physical mixtures of components [7,8,9]. Some of their advantages include a uniform particle size and shape distribution, an increased density, a higher sphericity and a greater porosity, resulting in improved flow and compression properties [4]. Moreover, any danger of segregation is eliminated.
Omeprazole belongs to the class of substituted benzimidazoles, which suppress gastric acid secretion by inhibiting the H+/K+-ATPase enzyme system on the secretory surface of gastric parietal cells. It acts as a proton pump inhibitor and is indicated for the treatment of acid reflux and heartburn [10]. Omeprazole is known for its sensitivity to acidic environments, moisture, heat, and certain solvents. It readily degrades in aqueous solutions at low pH, which necessitates protective formulation strategies. To ensure drug stability and targeted release, omeprazole oral dosage forms are typically enteric-coated, allowing for release in the duodenum (pH > 5) or terminal ileum (pH ~ 6.8–7.5) [10,11,12] However, many enteric coating polymers possess acidic functional groups that can interact unfavorably with omeprazole. To prevent this degradation pathway, a stabilizing sub-coating layer is often applied between the drug-containing core and the enteric coating, effectively serving as a barrier to protect the active ingredient [12]. Omeprazole as well as its stereoisomers belong to class II of the Biopharmaceutical Classification System, due to their poor solubility in water and high permeability through cell membranes [13]. Listed by the World Health Organization (WHO) as an essential medicine, since its introduction, omeprazole has been widely available on the market in the forms of tablets and other oral formulations. It is sold as a non-prescription medicine and over-the-counter medication (OTC) in some countries with different dosages of 10 mg, 20 mg, and 40 mg [14,15,16,17,18,19,20,21]. Historically, omeprazole was manufactured using a wet granulation technology, e.g., via low-shear granulation [18,21,22,23]. Currently, the dosage forms are manufactured using a multiple-unit pellet system (MUPS), in which enteric-coated pellets are either compressed into a tablet coated with an immediate-release polymer or directly filled into a hard gelatin capsule [13,17,24].
This study was based on the hypothesis that a directly compressible omeprazole tablet formulation can be developed by selecting appropriate excipients and formulation strategies that protect the drug’s stability while maintaining pharmaceutical equivalence, with the subsequent goal of streamlining the conventional manufacturing process by minimizing intermediate unit operations, thereby enhancing production efficiency, reducing processing time, and maintaining product quality and stability.
The suitability of the proposed formulation was evaluated based on the degree of compliance using the Quality Target Product Profile (QTPP) (See Supplementary Materials Table S1) of the reference-listed drug Prilosec® OTC 20 mg delayed-release tablets (AstraZeneca Pharmaceuticals LP distributed by Procter & Gamble) (Cincinnati, OH, USA). While we acknowledge that Prilosec® utilizes a multi-unit pellet system and our formulation is a single-unit tablet, the comparison remains relevant from a regulatory standpoint, as both are classified as delayed-release tablet dosage forms. Our intention is to demonstrate compliance with the desired release characteristics defined for this category.

2. Materials and Methods

2.1. Materials

2.1.1. Reagents and Chemicals

The solvents utilized in this study were acetonitrile (ACS grade, ≥99.5% purity) from VWR Chemicals BDH® (Radnor, IN, USA) and HPLC-grade methanol (≥99.9% purity) from Fisher Chemical™ (Delphi, India). Buffer solutions for the mobile phase were prepared using ammonium bicarbonate (Bio Ultra, ≥99.5% purity) adjusted with 25% ammonia solution, both sourced from Sigma-Aldrich (St. Louis, MO, USA). Additional used reagents were glycine (99.7–101% purity, Ph. Eur.), sodium phosphate tribasic dodecahydrate (ACS grade, ≥98% purity), and sodium hydroxide (Dri™, ≥97% purity), both from Sigma-Aldrich (St. Louis, MO, USA). A 0.1 N solution of hydrochloric acid (37%) from Sigma-Aldrich (St. Louis, MO, USA) was prepared as the dissolution medium. Purified water, obtained from TKA Germany (Niederelbert, Germany), was used in all analyses and sample preparations. To ensure sample filtration, nylon syringe filters for HPLC (0.22 μm) from YETI Merz Brothers GmbH (Haid, Austria) were employed.

2.1.2. Standards, Samples, and Excipients

Omeprazole powder was procured from Shenzhen Nexconn Pharmatechs Ltd., (Shenzhen, China) (100.0%). MicroceLac® (75% alpha-lactose monohydrate and 25% microcrystalline cellulose), Tabletosse® (agglomerated lactose), and DuraLac® H (anhydrous beta-lactose and alpha-lactose) were supplied by MEGGLE GmBH & Co. (Wasserburg, Germany). EXPLOTAB®, Type A (Sodium Starch Glycolate), and PRUV® (Sodium Stearyl Fumarate) were purchased from JRS Pharma (Polanco, Spain). Avicel® PH102 (microcrystalline cellulose, MCC) was supplied by Dupont—Pharma (Wilmington, NC, USA). As a sub-coat, Opadry® II clear polyvinyl alcohol (PVA) film coating from Colorcon (Harleysville, PA, USA) was utilized, and the enteric coating was applied via the Aquarius™ Control ENA film coating system from Ashland (Wilmington, NC, USA). The commercial omeprazole 20 mg delayed-release tablets are listed as Prilosec® OTC from Procter & Gamble Distributing (Cincinnati, OH, USA).

2.2. Methods

2.2.1. Powder Physical Characterization

Particle Size Distribution

The size of particles and the shape distribution of samples as a volume-based particle size Q3 (D10, D50 and D90) were evaluated using a HELOS (H2395) dynamic picture analyzer from Sympatec GmbH (Clausthal-Zellerfeld, Germany) based on the following parameters: dispersing method—pressure of 1 bar and vacuum of 70 mbar; feed rate (Vibri)—50%. Samples were analyzed in triplicate (n = 3).

Microscopy

Images of individual particles of all powder blend formulations were captured using an Olympus BX51M with Infinity 1 CCD-Camera and M Plan N Objectives, operated with a Senterra Raman microscope from Bruker (Billerica, MA, USA).

Powder Rheology

An FT4 powder rheometer by Freeman Technologies (Gloucestershire, UK) was used to evaluate the flowability by determining the flow function (FF), cohesion (C), unconfined yield strength (UYS), and angle of internal friction (AIF). The measurements were conducted in a 50 mm cylindrical vessel. After conditioning, the samples were consolidated using a vented piston and sheared at a pre-shear normal stress of 3 kPa until the steady state was reached. Next, the samples were sheared off at a decreasing initial consolidation stress of 2 kPa to 1 kPa (five points). Flow parameters were determined from averaged shear stresses at incipient flow and steady state (during pre-shear) to improve robustness, especially for the free-flowing and comparability of the data. Samples were analyzed in triplicate (n = 3).

Specific Surface Area—Brunauer–Emmett–Teller (BET)

The BET surface area analysis was assessed via a TriStar II 3020 system from Micromeritics Instrument Corporation (Norcross, GA, USA), based on nitrogen gas adsorption measurements. The specific surface area (SSA) was determined applying the Brunauer–Emmett–Teller (BET) theory, according to which the pore size distribution was determined using the Barrett–Joyner–Halenda (BJH) method within a size range of 1.7–300 nm. The equilibration interval we used was 10 s and the analysis bath temperature was 77.350 K. Samples were analyzed in triplicate (n = 3).

2.2.2. Tablet Production

Blending

All materials were sieved through an 800 µm mesh prior to blending. Blends for small-scale (500 g) and scale-up (5 kg) trials were prepared using 2 L and 30 L containers, respectively, maintaining a ~60% fill level to ensure efficient mixing. Materials were added in layers to promote uniform API distribution and minimize segregation. Small-scale blends were mixed in a Turbula® mixer T2F provided by WAG Group, (Nidderau-Heldenbergen, Germany) at 75 rpm for 20 min, followed by a 1.5 min blend with lubricant.
For all formulations, the same procedure was applied. The proposed formulations are presented in Table 1. A presentation of the qualitative–quantitative formulations is included in Tables S2 and S3 from the Supplementary Materials.
Once the characterization of the tablets was performed, the selected formulation was scaled up. Scale-up trials used a Rhönrad Drum Hoop Mixer by J. Engelsmann AG (Ludwigshafen, Germany) at 28 rpm for 15 min, with lubricant added and mixed for an additional 2 min.

Tableting

A high-speed rotary press simulator, model Stylcam 200R by Medelpharm (Beynost, France), was used for tableting small batches in order to compare the different formulations and tableting settings in a pre-test using an 8 mm concave punch provided by Adamus S.A. (Szczecin, Poland). For the selected scale-up batch, we used a rotary tablet press, model Fette 102i, by Fette Compacting GmbH (Schwarzenbek, Germany), using, in this case, eight sets of punches with the same characteristics as the one used in the Stylcam pre-test. All formulations were compressed using the same procedure. The performance during compression was a target as well: stable weight variation and stable compression force in the table press for measuring processability.

Coating and Final Packaging

Tablet coating was performed using a Solidlab 1 system by Syntegon Technology GmbH (Waiblingen, Germany) equipped with a 951 Form 7-1 S24 ABC spray gun from Düsen-Schlick GmbH (Untersiemau, Germany) for 400 g batches. Coating suspensions were prepared per supplier guidelines and mixed using an IKA® Ministar 20 stirrer by IKA-Works Inc. (Wilmington, NC, USA). The details on the coating suspension preparation and in-process coating parameters are provided in Supplementary Tables S4 and S5.
The tablets were enteric-coated until a 10% weight gain was achieved. Lastly, the tablets were packed into a 20 cm × 25 cm aluminium reclosable bag from Mylar (Sheffield, UK).

2.2.3. Tablet Physical Characterization (Hardness, Friability, Disintegration, and Thickness)

All produced batches were physically characterized, including weight control, size measurements (diameter, thickness, and band thickness), hardness, friability, and disintegration. To measure the thickness and band thickness, a digital caliper provided by Workzone (Vienna, Austria) was used. The hardness and diameter measurements were performed according to Chapter 1217 of the U.S. Pharmacopeia (USP), using a hardness tester PharmaTest PTB from PharmaTest (Hainburg, Germany). The friability test followed USP chapter 1216 [25] using a friability tester PTF 20E from PharmaTest (Hainburg, Germany). The disintegration test was performed according to USP chapter 701 [26] using a PTZ-S disintegration tester from PharmaTest (Hainburg, Germany). The specific methodology details are found in the Supplementary Materials in Section S1.2.

2.2.4. Analytical Tablet Characterization (Content Uniformity, Assay, Impurities, and Dissolution)

HPLC-RP analysis was performed using Acquity UPLC H-Class® system with a PDA detector, operated with Empower 3 chromatographic software (Version 7.50.00.00) from Waters Corp. (Milford, CT, USA). The dissolution of omeprazole tablets was performed in the Agilent 708-DS dissolution apparatus II (paddle) by Agilent Technologies (Santa Clara, CA, USA) at 100 rpm. The chromatographic columns were from Waters Corp. (Milford, CT, USA): XBridge BEH C18 XP 130A (4.6 × 50 mm; 2.5 µm) for the omeprazole content determination and an XBridge C8 Column, 5 µm, 4.6 mm × 150 mm, for the omeprazole impurities determination. The pH measurements were performed using a pH-meter FiveEasy from Mettler Toledo (Columbus, OH, USA). The analytical methods [27] were verified according to USP Chapter 1226 [28] and validated according to the ICH Q2 (R2) [29] and USP Chapter 1225 [30]. The chromatographic conditions are shown on Table 2.
For assay and impurity determinations, 20 tablets were milled to obtain a homogeneous powder, from which a 200 mg portion was accurately weighed for analysis. For uniformity of dosage units, individual intact tablets were analyzed without milling. Both the intact tablets and the milled powder were extracted in 100 mL of an 80:20 mixture of 10 mM ammonium phosphate buffer (pH 8.75) and acetonitrile for one hour to achieve a final concentration of 200 µg/mL. The omeprazole dissolutions (acid and buffer stage) were performed following to the FDA dissolution database methods [31]. The coated tablets were pre-exposed to 750 mL of 0.1 M HCl for 2 h (acid stage), and then 250 mL of 0.2 M Na3PO4 was added to the medium to give 1000 mL with pH 6.8 (buffer stage). The sample was collected after 45 min of dissolution. All samples and standards were filtered through a 0.22 µm nylon filter.
Storage of the tablets for stability determination purposes was performed according to ICH Q1A [32] for 12 months at 25 °C ± 2 °C/60% RH ± 5% RH in a stability chamber 9020-0324 from Binder GmbH (Tuttlingen, Germany). The stability testing scheme was performed as shown in Table 3.

2.2.5. Statistical Analysis

All statistical evaluations were performed using the IBM® SPSS® Statistics version 27 from IBM (Armonk, NY, USA) and RStudio 2023.06.0 Build 421 software from Posit PBC (Boston, MA, USA).

3. Results and Discussion

3.1. Formulation Definition

The excipient selection was based on the materials declared by the innovator product Prilosec® (see Supplementary Materials Section S2) and the available literature [33,34]. The aim was to compare the performance of excipients that were not co-processed as diluents with that of co-processed excipients (Microcelac®) for direct compression. Moreover, we aimed to achieve a robust formulation capable of being directly compressed in a rotary tablet press and equivalent to the reference-listed drug product. The four formulations were designed with equal drug content, disintegrant (sodium starch glycolate), and lubricant (sodium stearyl fumarate) for a total tablet weight of 200 mg. The diluents used for the comparisons were as follows. Formulation 1 contained a co-processed excipient, Microcelac®, which is a spray-dried mixture of 25% MCC and 75% α-lactose monohydrate with a median particle size of ~150 µm intended for direct compression [7]. Formulations 2 and 3 contained a granulated form of alpha-lactose monohydrate, specifically Tablettose® 70 and Tabletose® 100, respectively. Tablettose® 70 has fewer fines, with a narrow particle size distribution due to fewer particles below 63 um in size. Tablettose® 100 is produced from a smaller starting particle size than Tablettose® 70, resulting in a higher dilution potential that can effectively carry or dilute a larger proportion of API while still maintaining good tablet compressibility [35]. Both excipients were used, considering that excessive presence of fine particles is one of the problems in formulations requiring wet granulation [36,37]. Finally, a “normal” preparation was made using both MCC (Avicel PH102) and lactose (DuraLac® H), which are both commonly used in solid dosage formulation.

3.2. Particle Size Distribution

The particle density size distribution (q3) and cumulative curve (Q3) for the four formulation candidates are displayed in Figure 1. Prototype F1, which includes the co-processed material Microcelac®, had a tighter distribution of the particle size ranging from 6.26 ± 0.11 to 247.26 ± 1.39 (from D10 to D90). The others had a wider range (Table 4). All curves demonstrate a slight increase of around 3 μm associated with the drug substance particle size, as seen in Table 4. However, this effect is more subtle in prototype F1 and more pronounced in F4, the latter also having a higher number of fine particles.
Particle size distribution is one of the main attributes of the material and blend that has an impact on the final tablet quality. Especially in direct compression manufacturing, this parameter is associated with difficulties, e.g., in terms of flowability, blending ability, mechanical properties, and stability [38].

3.3. Microscope Picture Analysis

The blends were evaluated under the microscope. The results are depicted in Figure 2. Notably, fines were distinctly present in prototype F4, as confirmed by the PSD results. These are likely attributable to the API, which may cause segregation in the hopper of the tableting machine, potentially leading to inconsistent dosage units. This finding highlights the challenges in achieving a uniform content distribution during a manufacturing process, especially when fines are present.
In contrast, the microscopic examination showed that formulations F1, F2, and F3 had significantly fewer fines. This could indicate that the API particles adhered to the microstructures of the material more effectively and occupied less apparent volume, which reduces the risk of segregation during tableting by promoting more uniform distribution within the blend. Notably, in formulation F1 that contained the material with an open and void microsphere structure [39], this architectural feature likely facilitated a better encapsulation of the API particles. Such microstructural encapsulation can enhance the flow properties and the compressibility of the blend, improving the uniformity and stability of the final tablet form.
This difference in the microstructural characteristics between the formulations suggests that the physical form of the excipient can significantly influence the handling, distribution, and integration of the API during processing.

3.4. Powder Rheology

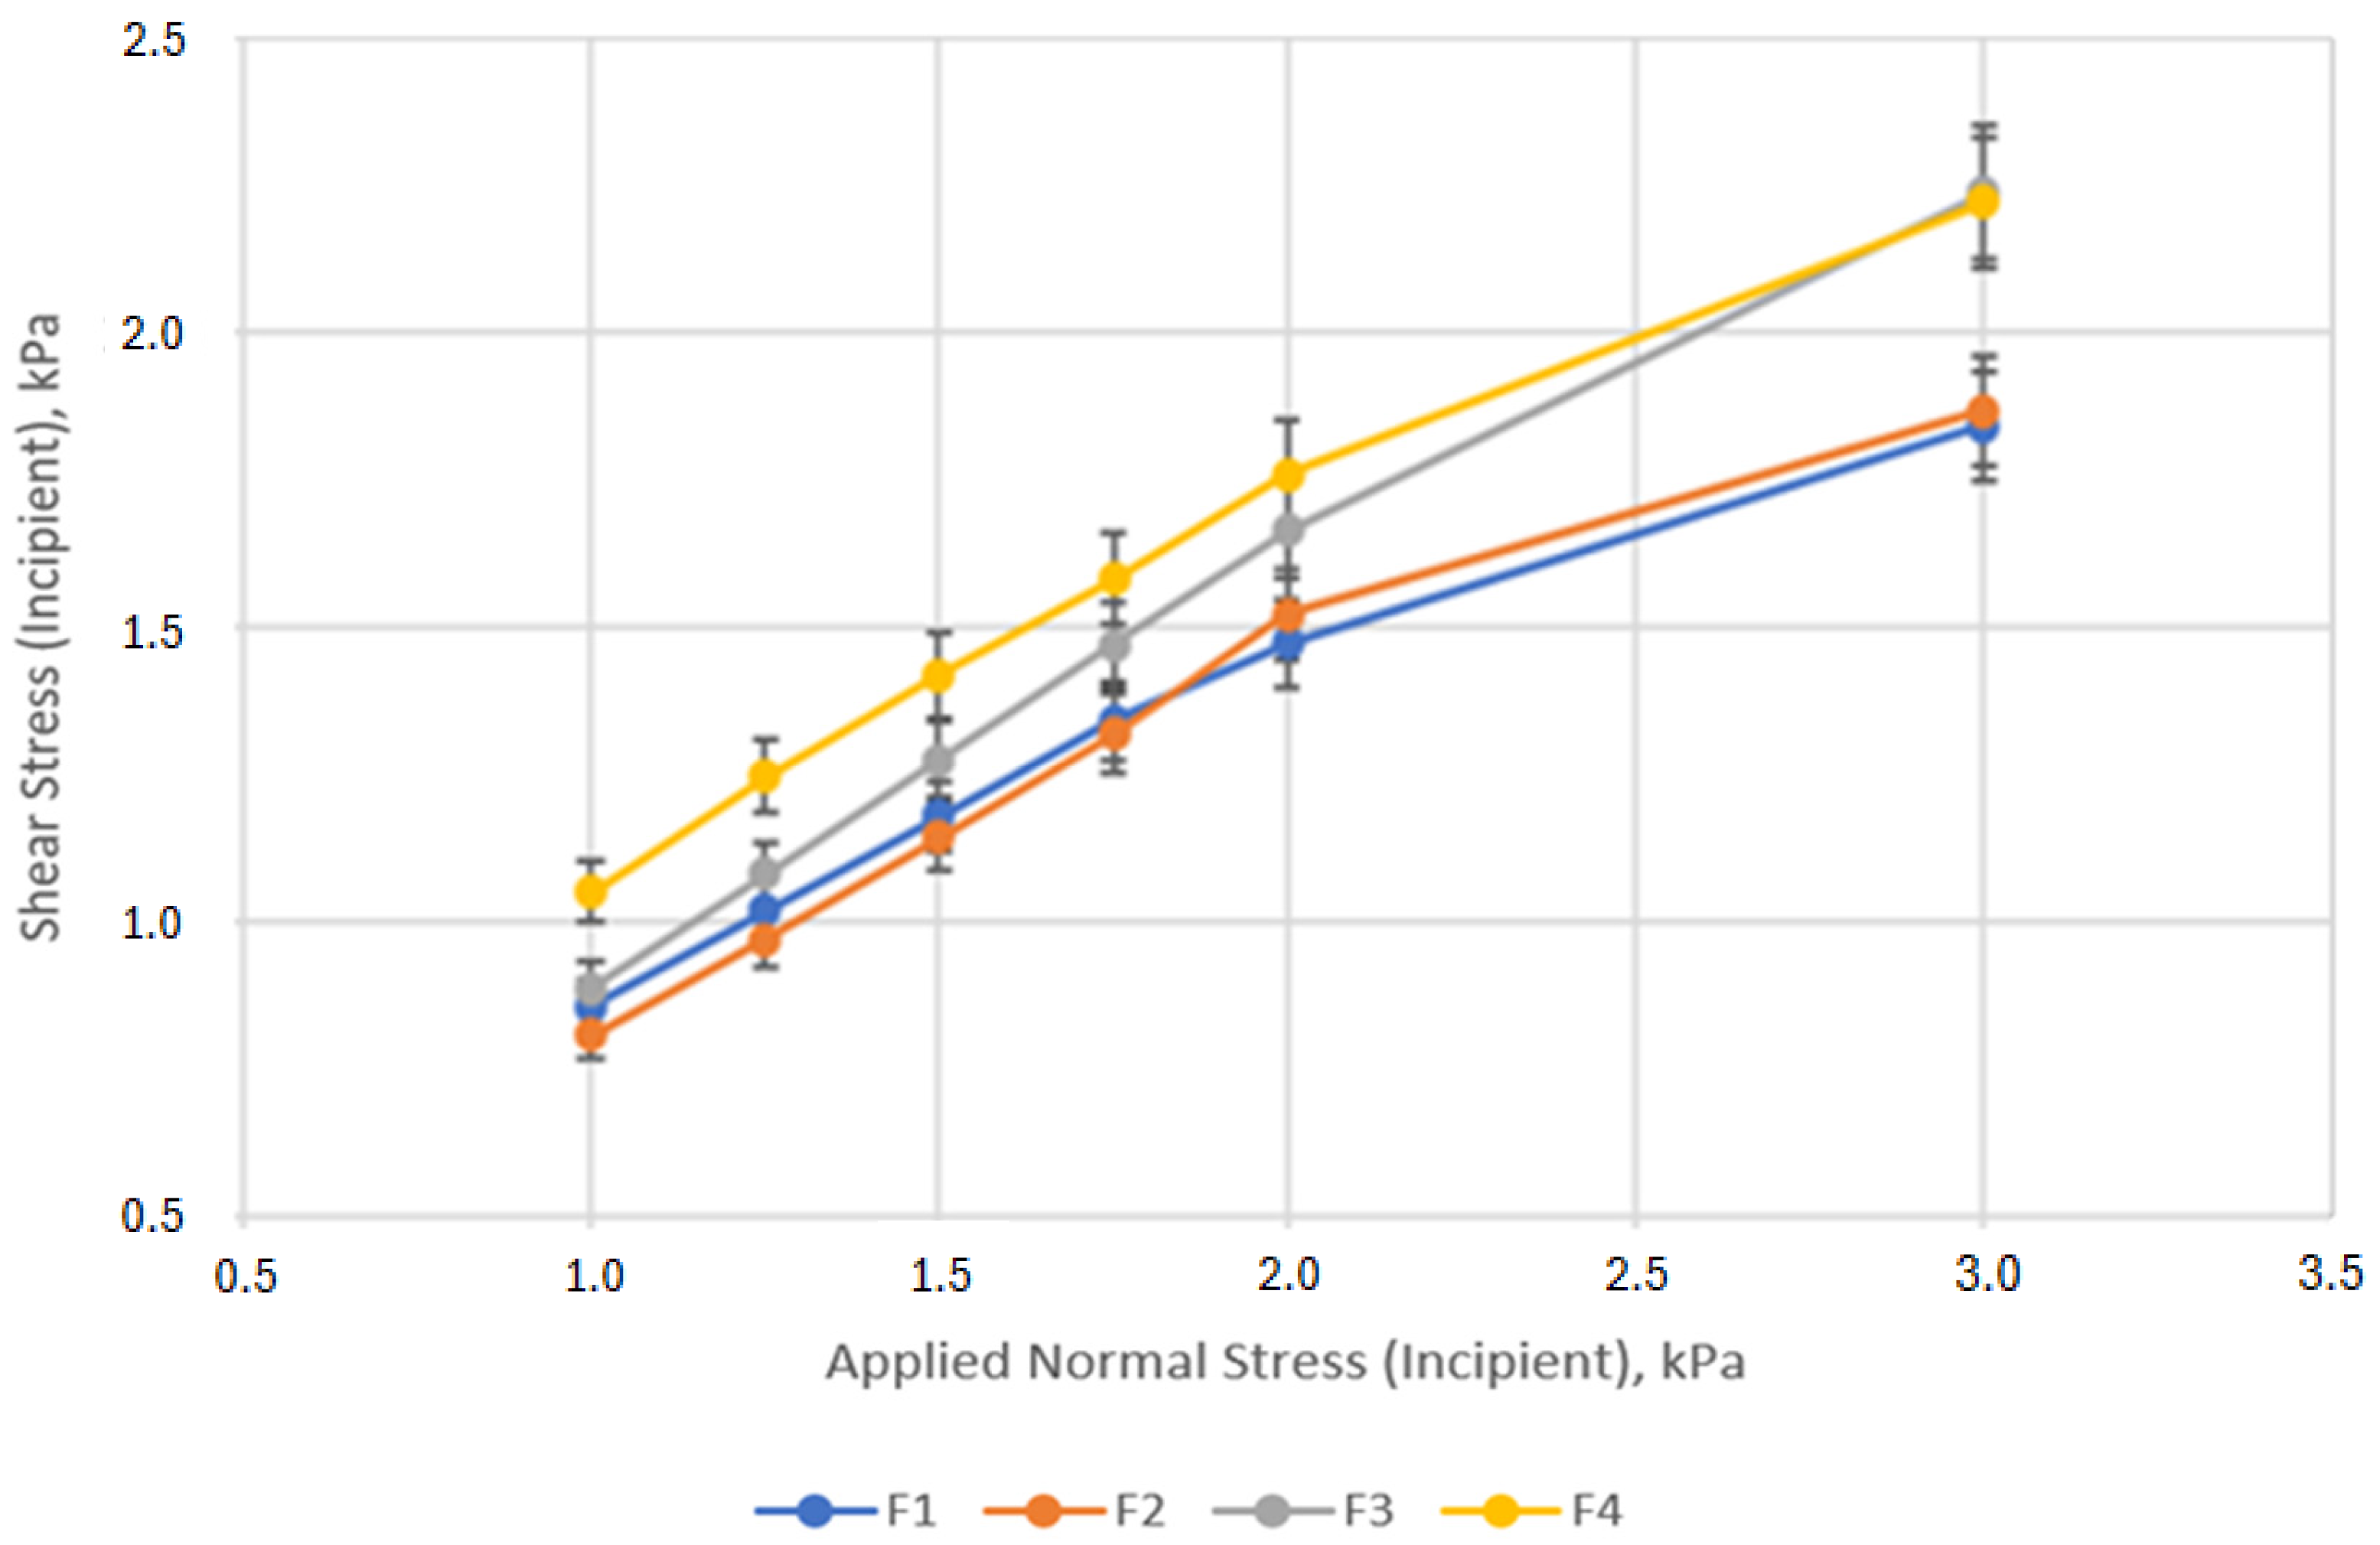
Shear stress (kPa) at yielding of the four studied blends is shown as a function of applied normal stress (kPa) in Figure 3. The respective values for the flow function (FF), cohesion (C), unconfined yield strength (UYS), and angle of internal friction (AIF) are shown in Table 5.
High shear strength is associated with cohesive powders while low ones indicate free-flowing powders [40]. As shown in Figure 3, the curves of formulations 3 and 4 depict higher shear stress per normal pressure than that of formulations 1 and 2. In addition, F1 and F2 showed higher values of applied normal pressure than the corresponding shear strength. For formulation F3 and F4, the same values of applied normal pressure resulted in higher shear stress. Higher shear stress values are expected from cohesive powders, possibly because powders composed of large, spherical particles tend to behave more like a fluid under pressure, distributing stress uniformly in all directions, such as the co-processed material and the spray dried lactose with larger particle size, in contrast to the fine particle found in agglomerated cohesive powders, like the blend of non-enhanced excipients (F4). Values of cohesion and UYS are slightly higher for formulation 4 than the rest of the blends. Higher UYS values are linked to cohesive powders as the inter-particular forces are stronger then in less cohesive powers were the tensile forces are weaker, leading to lower UYS values [41]. While flowability was better in formulations 2 and 3 based on the cohesion and UYS values, the standard deviation was higher, indicating a higher variability in those blends.
Flow function measurements, which are a ratio of major principal stress to unconfined yield stress, are used as the main descriptor of flowability of bulk solids. Nevertheless, it is known that powder with low cohesion impairs the precision of FF measurement, which could be the reason why a high amount of variability is observed in the analyzed formulations [42].

3.5. Specific Surface Area (BET)

The behavior of powders and porous solids is affected by the specific surface area (SSA). The specific surface area is comprised of the external surface and internal porous interior. For porous materials, the internal part usually dominates, while for non-porous particles, the external surface area is relevant, which is a function of size (not so for porous particles). A larger specific surface area is associated with smaller particles sizes and increased porosity of the particles. Although favorable to improve dissolution behavior with a larger SSA and smaller PSD, for some APIs, there is no improvement below a critical value. The SSA values of the four prototype formulations are shown in Table 6 and Table S6 in the Supplementary Materials. All results indicate that the SSAs are quite low, indicating rather non-porous materials. F1 and F4 had high values, with F4 having the highest ones. F4 had the highest amount of fine particles in its blend, as indicated by the PSD results, and the highest value of SSA is congruent with this finding. Although favorable for achieving better dissolution, the processability of a blend via direct compression is greatly affected by fine particles, as was the case with F4.

3.6. Statistical Evaluation

Testing of the four formulations was performed in triplicates, resulting in a total of twelve data points. The following variables were acquired: the particle size distribution (PSD) parameters, the powder rheology parameters at different pressure levels, the pore volume characteristics, and the pore size parameters. All data were standardized using z-scores prior to the statistical analysis. All details are provided in the Supplementary Materials.
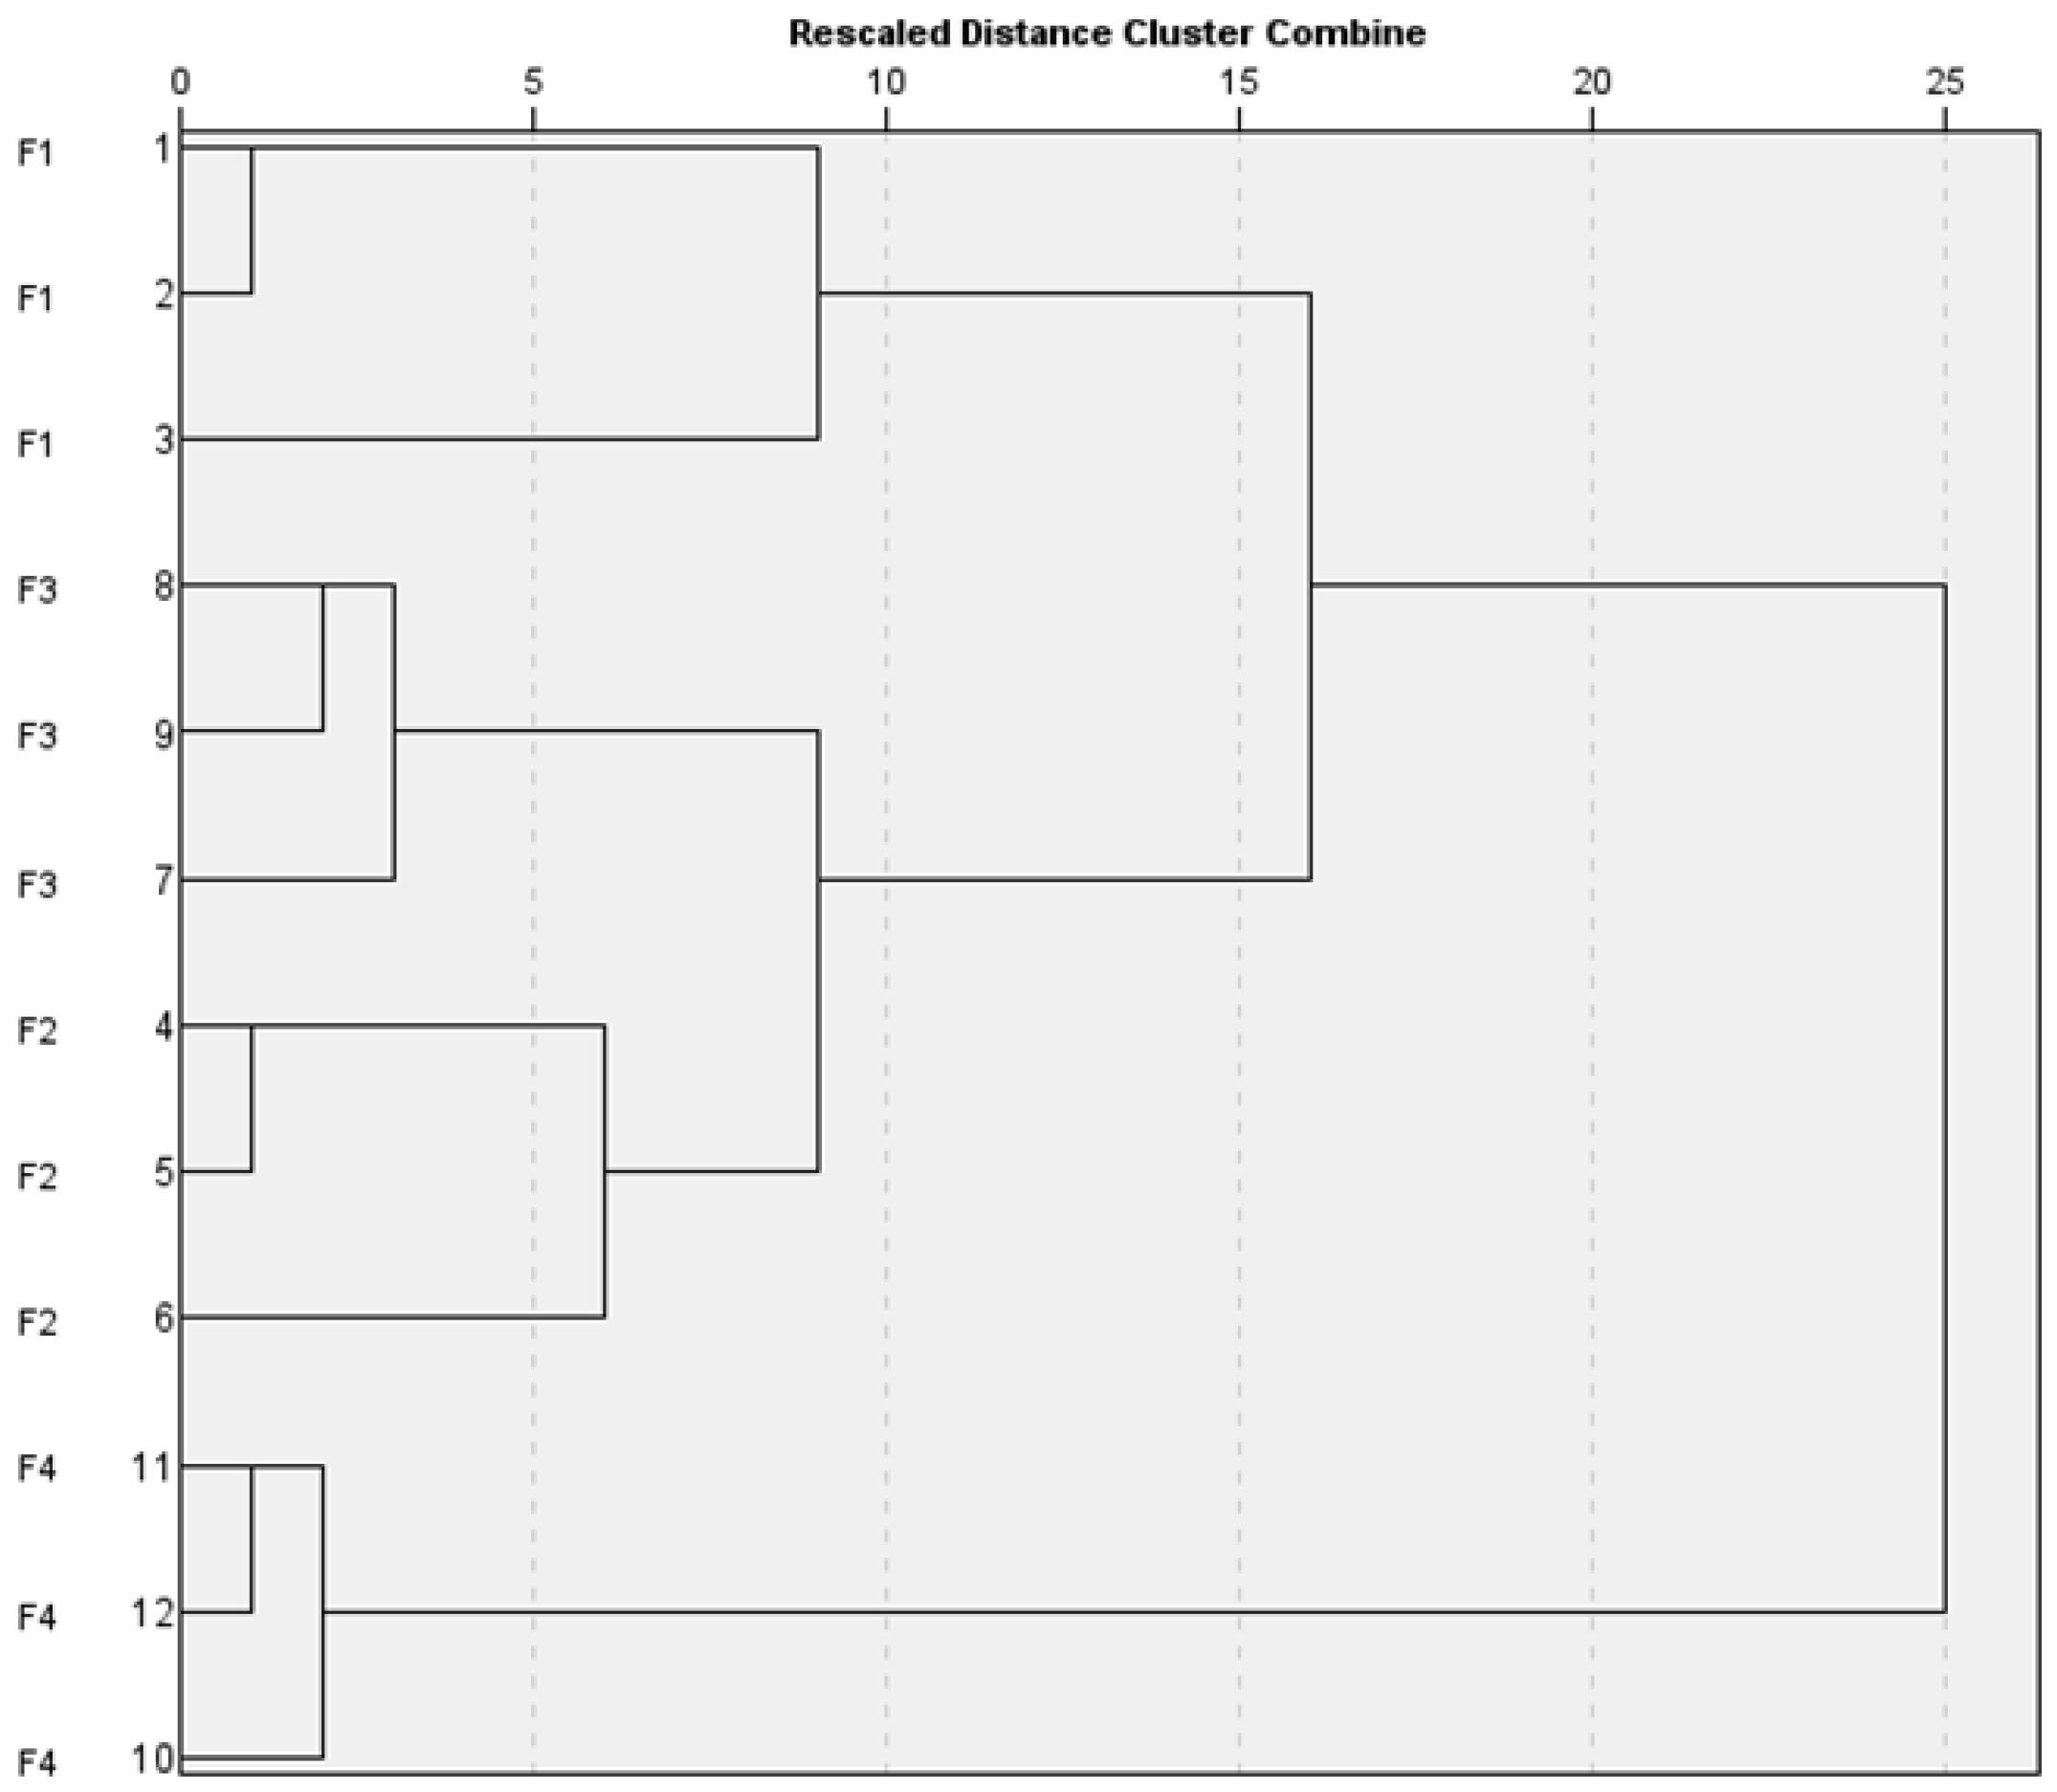
As an initial exploratory step, an unsupervised divisive hierarchical clustering method was employed to group the data points based on their similarity or dissimilarity. In order to evaluate if the obtained results indicate that each formulation prototype is clearly a unique group, a cluster analysis was performed. The aim was to investigate whether the data points clustered into the four known formulation groups and to examine the characteristics of each cluster. Various dendrograms were constructed using several clustering methods, i.e., the within-group linkage with Euclidean distance, the between-group linkage with squared Euclidean distance, and the Ward method with squared Euclidean distance. All methods consistently suggested the presence of three to four clusters that aligned with the labeled formulations. Figure 4 illustrates the dendrogram obtained using the within-group linkage clustering method with squared Euclidean distance, and the corresponding distances for each case are presented in the proximity matrix (see Supplementary Materials Tables S7 and S8). The x-axis holds the rescaled distance from the cluster showing the dissimilarity while the y-axis has the labels of each case: 1–3 is F1, 4–6 is F2, 7–9 is F3, and 10–12 is F4.
To corroborate the results of hierarchical clustering, the k-means clustering method was employed. Determining the optimal number of clusters for a given dataset is a challenge in the k-means clustering. While the hierarchical clustering results suggested three clusters, additional methods (i.e., the elbow method, gap statistics, and the silhouette method) were utilized to confirm the number of clusters. The elbow method plots the sum of squared distances of each point to its cluster center as a function of the number of clusters and identifies the point where the curve bends sharply, indicating a good trade-off between the number of clusters and the within-cluster variation. Gap statistics compares the within-cluster variation for different values of k with their expected values under a null reference distribution of the data and selects the k that maximizes the gap statistics. The silhouette method measures the similarity of each point to its own cluster compared to other clusters and chooses the k that yields the highest average silhouette score. All three methods consistently suggested three clusters, confirming the assumption based on the hierarchical clustering analysis.
Figure 5 illustrates the cluster plot with the formulations distinctly grouped, indicating clear differences between the three formulations. The x-axis is the first dimension that explains about 55% of the variance. Y-axis is the second dimension that explains about 25.4% of the variance.
The dendrogram in Figure 5 shows a wide range of possible cut-off points (approximately 10 to 15 on the vertical axis) for determining the number of groups based on similarities. The clusters align with the formulation labels, indicating that the four formulations are distinct from one another. Based on the hierarchical analysis, both groupings (F1, F2, F3, F4 and F1, F2 + F3, F4) are reasonable. However, further analysis of the optimal number of clusters using the elbow method, the silhouette method and the gap statistics consistently suggested three clusters. Consequently, the subsequent k-means clustering method was applied with k = 3. The cluster plot in Figure 4 aligns well with the hierarchical clustering method and confirms the differences in formulations F1 and F4 on the first dimension while clustering formulations F2 and F3 together. Both methods suggest greater similarities between F2 and F3 while clearly separating F1 and F4. Though limited by the sample size, the assessed prototypes created were different from one another. This means that the improved results for the prototype with co-processed material (Microcelac®) were not attributable to random variation.

3.7. Tablet Manufacturing

Figure 6 shows variations in the applied compression force for all formulations during the tableting process. Tablet presses have a force control system. Taking the nominal force as a reference point, if average force deviates, the machine will make corrections to the dosing cam. However, there are mechanical factors and material properties in the system that can create a fluctuation in the compression force. Inconsistent powder properties can result in uneven die filling, leading to variable tablet weights and adjustments needs of compression force. Tableting speed may also affect the die filling, reflected in compression force variation as well [43].
The observed rheological properties of the formulations directly influenced their behavior during the tableting process. For instance, formulations F1 and F2, which showed higher flow function values and lower cohesion/UYS, also demonstrated more stable compression force profiles and lower weight variability, suggesting efficient and uniform die filling. In contrast, F4, characterized by higher cohesion and lower flow function values, exhibited poor flowability, which likely contributed to its compression force fluctuations and higher tablet weight variation. These findings support the well-established link between powder flow properties and manufacturability, highlighting the importance of rheological evaluation in predicting tableting performance. Additionally, the co-processed excipient in F1 improved both flow and compressibility, resulting in tablets with higher mechanical strength and lower friability under equivalent compaction conditions.
All formulations were adjusted to a nominal compression force of 8 KN, which was achieved for all formulations except F4. The latter proved harder to stabilize, requiring several adjustments to reduce variations in this parameter. The initial spike observed in F4 could be indicative of calibration issues or anomalies in the tableting process. Such spikes could affect the uniformity and critical quality attributes (CQAs) of the first few tablets produced. F1 and F2 are notable for their stability and consistency with respect to the applied compression force, which is crucial for ensuring uniform tablet weight and hardness. F3 shows a stable performance, although with slightly higher variability than F1 and F2. In general, consistency is a prerequisite for producing dosage forms of consistent quality [43,44].
Furthermore, the tablets were characterized in terms of average weight variation, hardness, friability, and disintegration time (Table 7). F1, F2, and F3 had a lower weight variability compared to F4. The larger number of fines observed in both the PSD results and the microscope images of F4, as well as lower FF values and higher UYS, could be responsible for a higher variation in weight during the process. F1 showed a significantly higher hardness than the rest of prototypes. The combination of plastic (MCC) and brittle (lactose) deforming materials in Microcelac® 100 results in higher compressibility among the diluents [4], which is directly connected to the potential hardness achieved [45,46,47] at the same compression force. The hardness of Prilosec® is mainly driven by the manufacturing procedure, with compressed and coated spherical pellets [15].
The friability results for the omeprazole prototypes are presented in Table 7 as well. Typically, a friability value below 1% is considered acceptable for tablet formulations [25] since it indicates a product capable of withstanding subsequent processes, such as coating, transportation, storage, and handling [47]. The tablets produced with some degree of MCC within their compositions (F1 and F4) showed consistently lower friability values compared to those made solely with lactose (F2 and F3). However, all the formulations met the desired friability criterion of less than 1%, even under the same compression forces. This suggests that including even small amounts of MCC significantly enhances tablet durability by reducing the friability, as previously reported [47].
Incorporating MCC not only lowers the tablets’ friability but also enhances their overall manufacturability, defined as the ease and reliability with which the formulation can be processed into tablets using standard manufacturing equipment. This improvement is primarily due to the high plasticity of MCC, which contributes to the overall tablet structural integrity [4,47]. However, the interaction between the MCC and lactose particles also plays a critical role in improving the tablet characteristics. In the case of formulation F4, MCC was added as an individual material and mixed in the blend, whereas in F1, both components were combined via a spray drying process as part of creating a co-processed material. As can be seen, co-processing notably enhances the material’s suitability for direct compression by improving the flowability and compressibility [4,39].
Regarding the disintegration results in Table 7, as expected, the formulations with only lactose in their composition (F2 and F3) have a shorter disintegration time since lactose dissolves and leaves behind pores that are filled with water. In comparison, F4 disintegration is slightly slower. This is due to the slower dissolution rate of lactose monohydrate compared to the anhydrous one [48,49,50] present in DuraLac® H, in addition to the presence of MCC in the formulation. The disintegration time for F1 falls in between the fastest (F2 and F3) and the slowest (F4) ones due to several factors, i.e., the presence of MCC within the particle matrix and the manufacturing of the co-processed material via spray drier. Spray-dried formulations are known to form a certain degree of amorphous content that indeed has a faster dissolution rate [49,50]. The disintegration time of Prilosec® is the highest, being a coated tablet. Moreover, the core matrix encompasses the compressed coated granules as well, which are reported to be susceptible to the shielding effect due to filler non-disintegration, slowing disintegration time [51].

3.8. Analytical Characterization

Analytical characterization of all formulation prototypes entailed assessing the uniformity of dosage units, dissolution, assay, and impurities. With the exception of uniformity of dosage units, all parameters were further evaluated for long-term stability during storage for twelve months at 25 °C/60%RH of a selected formulation prototype as a coated form (F1). These evaluations were conducted according to the proposed specifications in Table 8.

3.8.1. Preliminary Analytical Assessment

In this study, using ten units, the uniformity of dosage units for four experimental formulations (F1, F2, F3, and F4) and the commercial product Prilosec® film-coated tablets were assessed. The results are shown in Table 9. All formulation prototypes and the commercial tablets met the level 1 (L1) acceptance criteria as specified in USP [52], according to which the acceptance value (AV) for ten tested units must not exceed 15.0.
F1 yielded outstanding uniformity, with an average content of 100.6% and a low standard deviation (SD) of 1.4, resulting in an AV of 3.0, showing the closest to the nominal content. F2 and F3, incorporating lactose Tablettose® for direct compression, had a superior dose uniformity, as attested by the low standard deviations (0.8 and 1.0). This indicates a significant enhancement in the consistency of dosage units [39,55,56].
In contrast, F4 had considerable variability with an SD of 3.0 and an AV of 7.3, suggesting poorer uniformity than the other formulations. This performance was expected, given the results of weight variation and compression force and the instability observed during the tablet manufacturing process. Commercial Prilosec® mirrored the performance of F4 with an SD of 3.0 and an AV of 7.5, suggesting a comparable level of dose inconsistency.
The assay was determined in triplicate for all omeprazole prototypes. The results are shown in Table 9. All prototypes were within the specification. F1 yielded the optimal assay results. F2 and F3 had a slightly lower active ingredient content. F4 had the lowest assay value with the highest dispersion within the measurement. This outcome aligns with the previously discussed uniformity of dosage units finding.
For all formulation prototypes, dissolution was performed on the cores only in the buffer stage to verify that the proposed specifications were met. The dissolution results are shown Table 9. Most formulations had high dissolution rates within 45 min both nominal and normalized, indicating effective release profiles. There were notable differences in the consistency of the releases.
The F1 prototype exhibited the highest drug release with minimal variability, which may be attributed to the properties of the co-processed excipient. Specifically, the API embedded within the porous microstructures of Microcelac® may have experienced enhanced wetting and dispersion, facilitating a more consistent and gradual dissolution profile [39]. As the co-processed material dissolved, the microstructures collapsed, promoting the dispersibility effect [57] and a higher rate of dissolution, allowing the liquid to permeate into the tablet core more quickly. This is especially useful in the production of immediate-release formulations.

3.8.2. Long-Term Stability Results

After the preliminary analytical evaluation, formulation prototype F1 was selected for scale in a rotary press and the coating process. Tablets from this batch were characterized in terms of average weight variation, hardness, friability, and disintegration time (Table 10). Additionally, tests for impurities and stored to assess its long-term stability were performed.
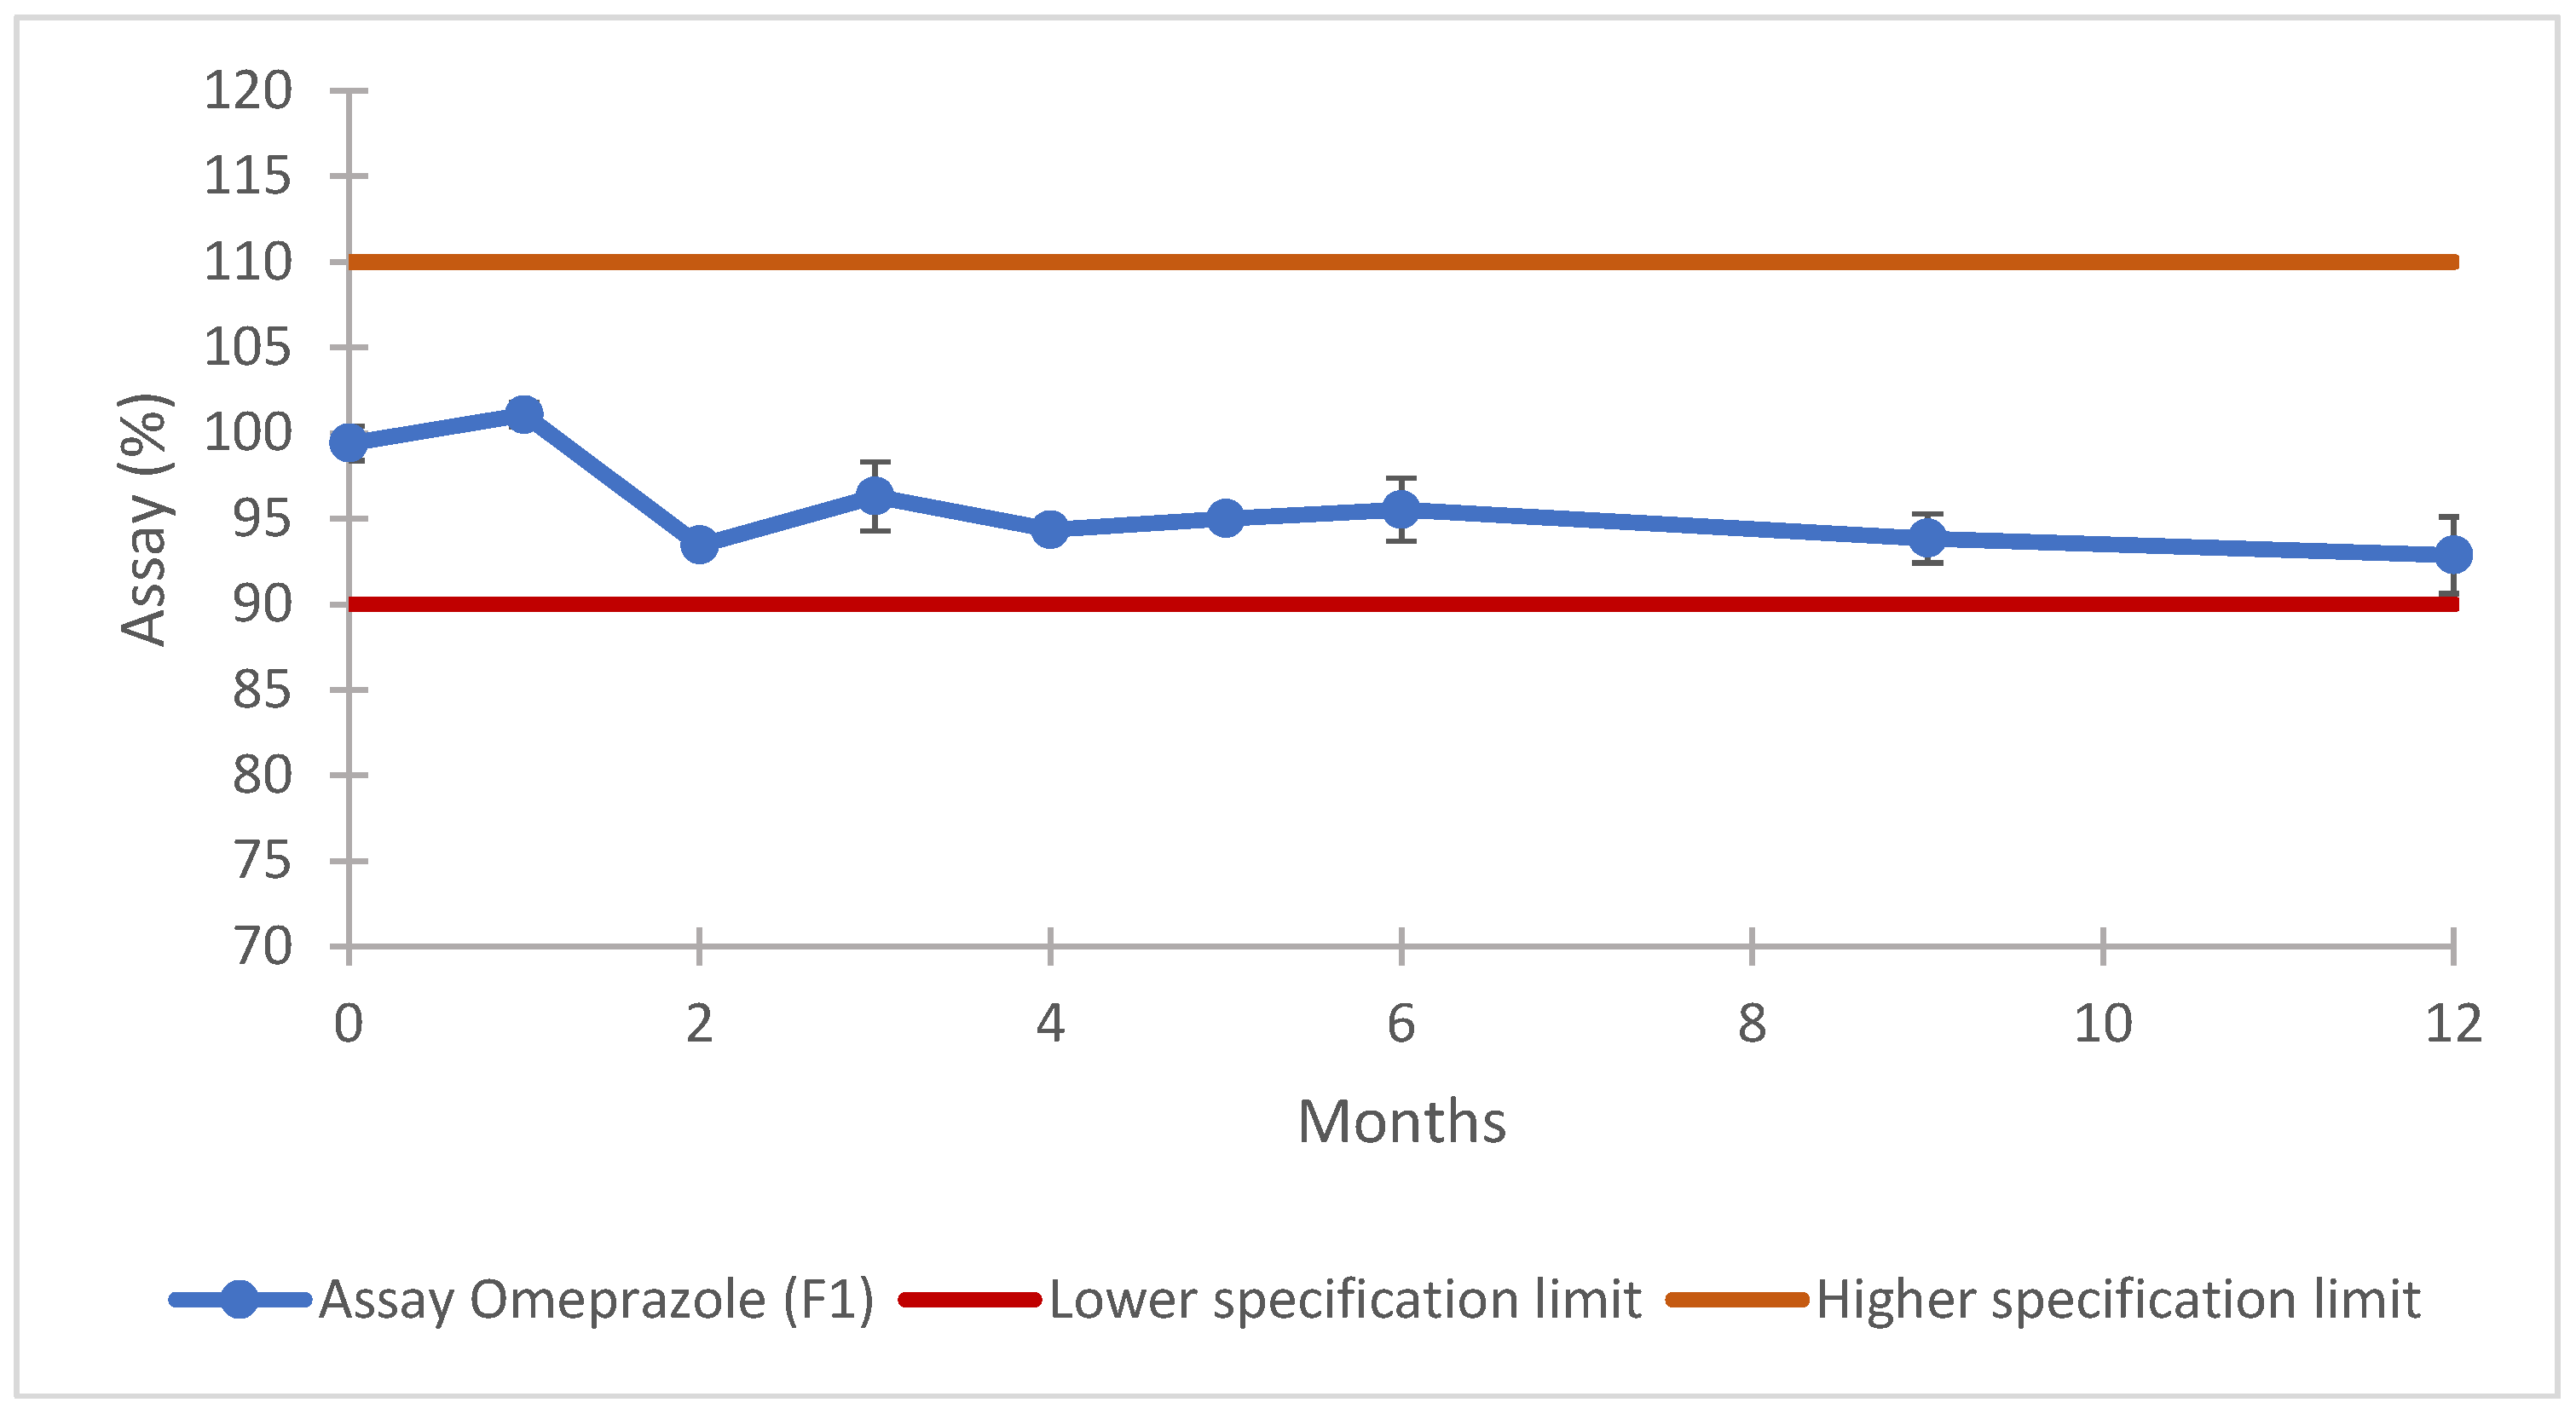
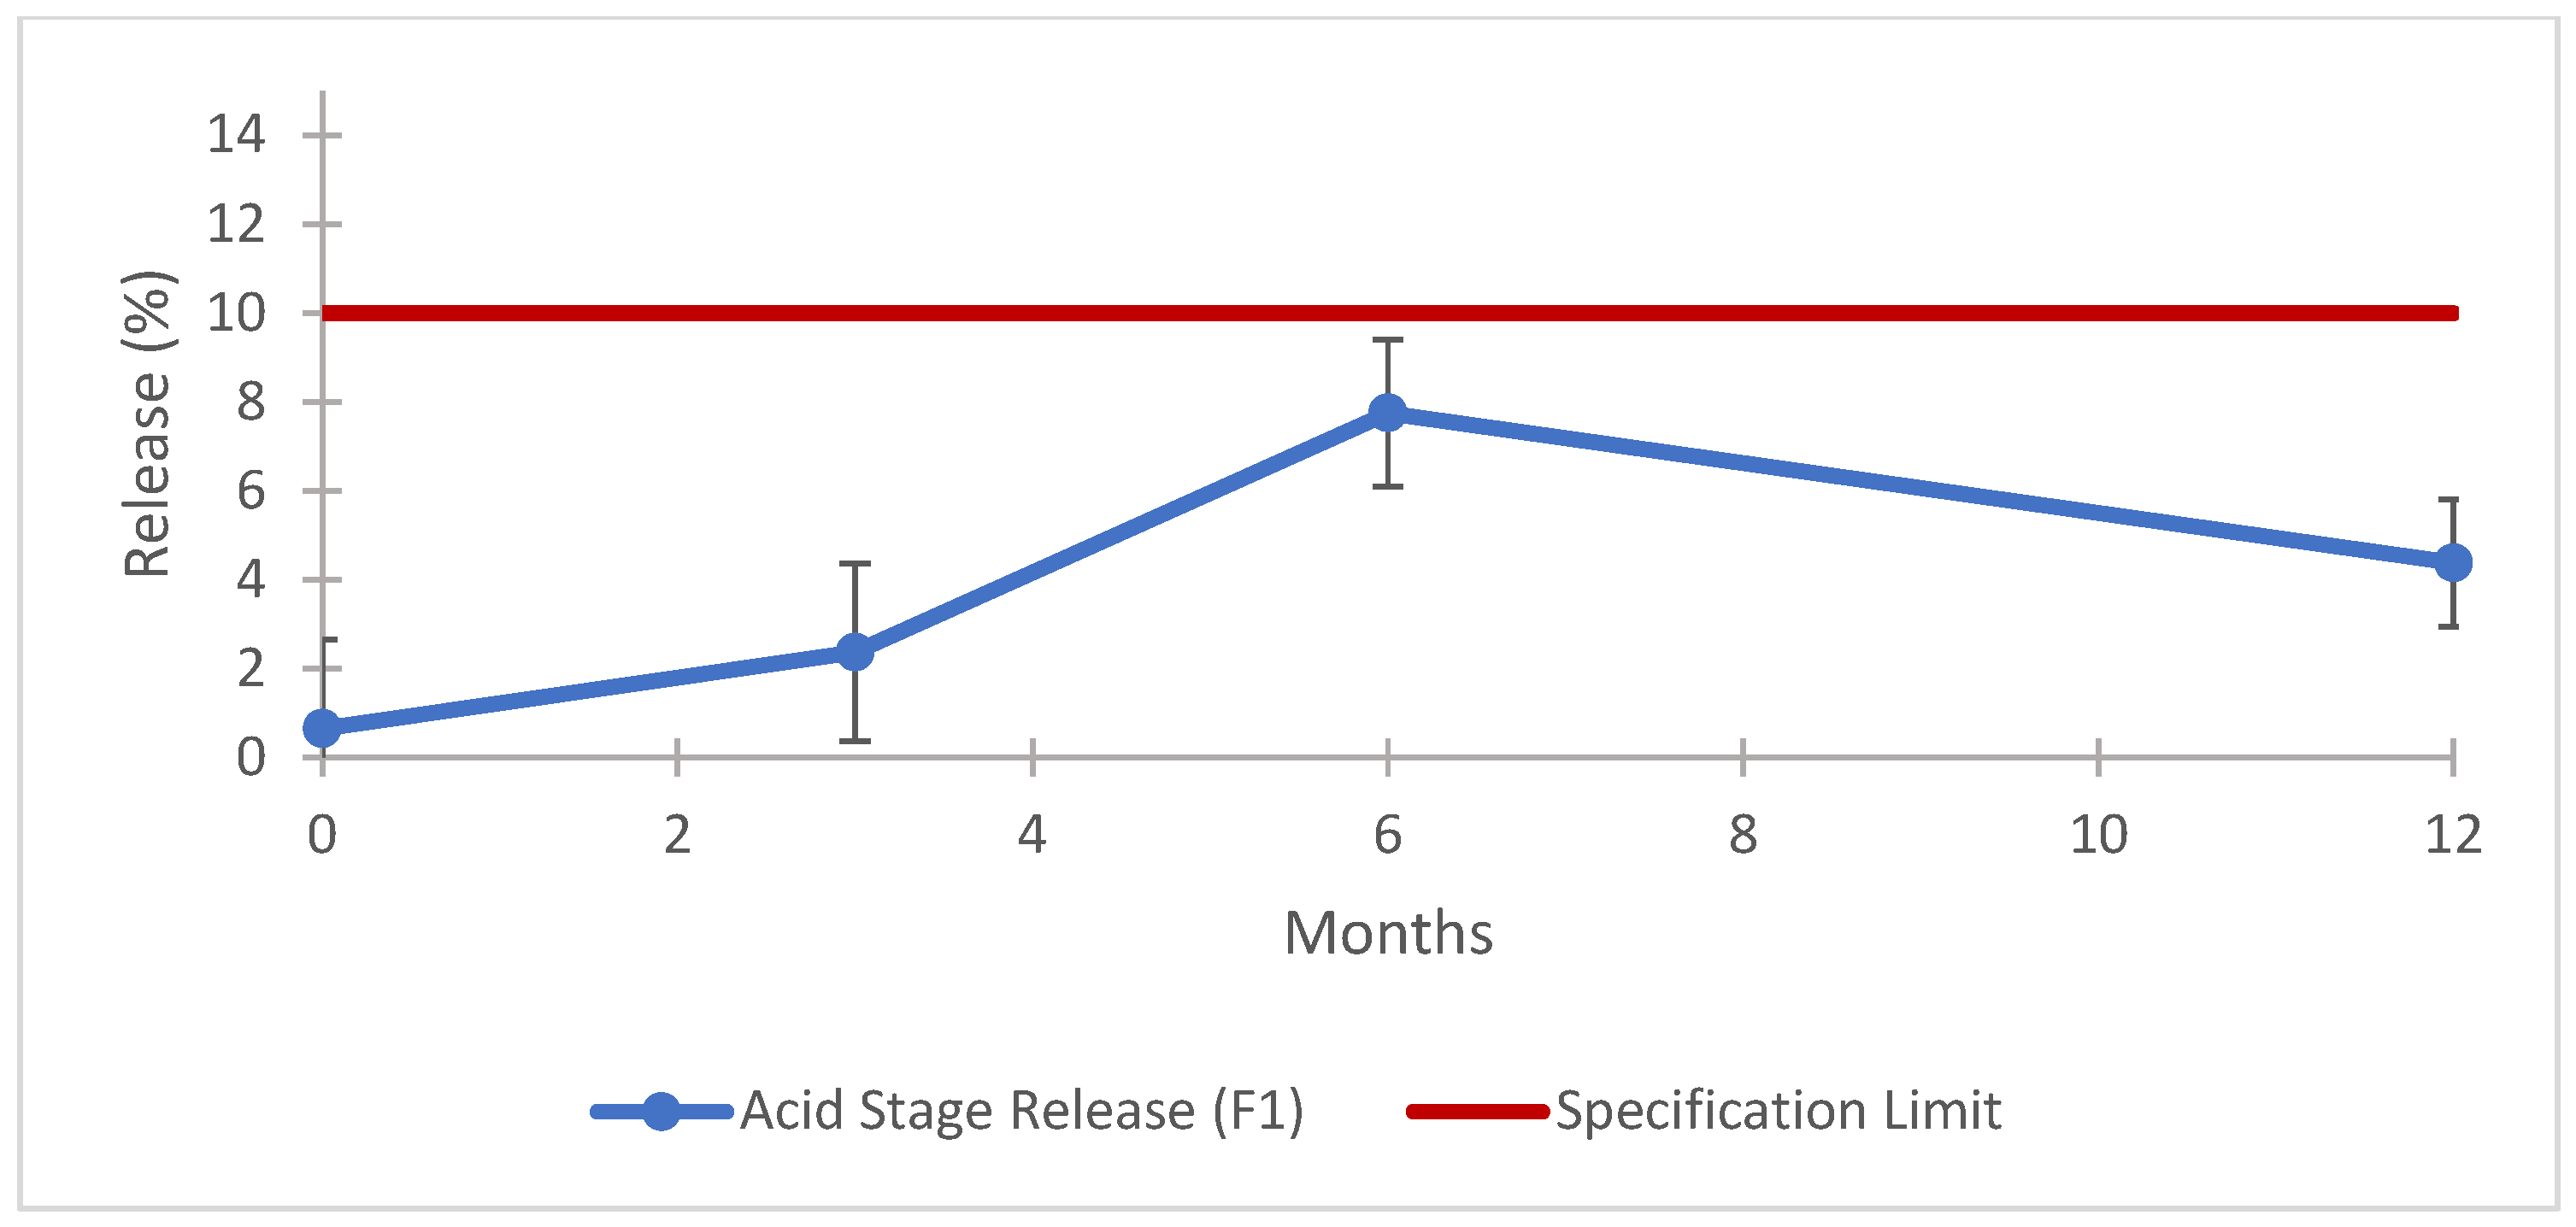
The data obtained for this batch physical characterization are in line with the expected results, when compared with the outcome of the previous phase. The result for the uniformity of dosage unit was 100.1 ± 1.9% with a AV of 4.6, and the assay (Figure 7), dissolution in the buffer stage (Figure 8), dissolution in the acid stage (Figure 9), and impurities (Table 11) demonstrate that the prototype formulated with co-processed materials meets the established compendial specifications. These findings underscore the efficacy of co-processed excipients in achieving the desired product performance and stability. The evaluation provides strong evidence that such formulations are highly effective, making them excellent candidates for potential product submissions [58]. Using co-processed excipients enhanced the uniformity and consistency of the product, contributing to improved manufacturability and potentially reducing the time and costs associated with the drug development process.

3.9. Regulatory Limitations

Using co-processed material in direct compression definitely offers an advantage as a manufacturing method for oral solid dosage forms in comparison to traditional granulation methods. However, some regulatory hurdles to its total adoption within the pharmaceutical sector still exist. Unlike traditional excipients, which are well established and described in specific pharmacopoeia monographs, co-processed excipients are often treated as novel by regulatory authorities if not previously used in approved drug products. This regulatory perspective introduces uncertainty since these excipients can typically only be introduced through a new drug application, increasing the effort and risk for pharmaceutical companies [58]. In this context, co-processed excipients, which combine multiple existing excipients to create a product with an enhanced functionality, are a promising avenue. These are generally viewed as less risky in terms of regulatory approval compared to entirely new chemical entities since they do not entail significant chemical changes [59].

4. Conclusions

This study set out to test the hypothesis that a stable and effective omeprazole formulation suitable for direct compression could be developed by employing appropriate excipients, specifically co-processed materials.
The findings confirmed that the use of a co-processed excipient Microcelac® as a functional diluent enabled the successful direct compression of omeprazole. Fulfilling all the specifications and physical characteristics necessary to be further processed during the coating, packaging, and storage steps, the manufactured product proved to be stable for up to twelve months under 25 °C/60% RH conditions.
Despite the limitations imposed by the sample size, the statistical analysis confirmed significant differences among the evaluated prototypes. Consequently, the enhanced performance observed in the prototype utilizing co-processed material (Microcelac®) cannot be attributed to random variation.
The obtained findings position co-processed excipient-based formulations as a promising approach in pharmaceutical development of direct compression processes, aligned with the regulatory standards and market expectations.

Supplementary Materials

The following supporting information can be downloaded at: https://www.mdpi.com/article/10.3390/scipharm93020024/s1, Table S1: Quality Target Product Profile (QTPP) for omeprazole film-coated tablets; Table S2: Proposed Formula quali-quantitative omeprazole delayed-release tablets (F1, F2); Table S3: Proposed Formula quali-quantitative omeprazole delayed-release tablets (F3, F4); Table S4: Preparation parameters of applied coating suspensions; Table S5: Summary of applied in-process coating parameters; Table S6: Extended results of specific surface area for the omeprazole formulation prototypes; Table S7: Descriptive statistics of each analyzed variable; Table S8: Proximity Matrix, the Euclidean distance for each case is given. The smaller the value, the closer and more similar the cases are to each other.

Author Contributions

Conceptualization, R.A.L.G. and J.A.A.U.; Data curation, J.A.A.U., R.A.L.G. and A.I.A.U.; Formal analysis, J.A.A.U., R.A.L.G. and D.J.; Funding acquisition, J.K.; Investigation, J.A.A.U. and R.A.L.G.; Methodology, J.A.A.U. and R.A.L.G.; Project administration, R.A.L.G.; Resources, R.A.L.G. and J.K.; Supervision, R.A.L.G.; Validation, J.A.A.U. and A.I.A.U.; Visualization, J.A.A.U. and R.A.L.G.; Writing—original draft, J.A.A.U. and R.A.L.G.; Writing—review and editing, A.I.A.U., D.J., and J.K. All authors have read and agreed to the published version of the manuscript.

Funding

This research was funded within the framework of COMET—Competence Centers for Excellent Technologies by BMK, BMAW, Land Steiermark, and SFG. The COMET program is managed by the FFG. This was supported by TU Graz Open Access Publishing.

Institutional Review Board Statement

Not applicable.

Informed Consent Statement

Not applicable.

Data Availability Statement

All data and materials are present in the manuscript and Supplementary Materials.

Acknowledgments

We extend our gratitude to Heli West, Anna Fedorko, Michael Piller, and Theresa Hörmann-Kincses for their contributions to the data evaluations, material characterization, and analytical testing of the omeprazole formulation prototypes in this investigation. Open Access Funding by the Graz University of Technology.

Conflicts of Interest

Raymar Andreina Lara Garcia, Jesús Alberto Afonso Urich, Andreina Isabel Afonso Urich, and Johannes Khinast are employees from Research Center Pharmaceutical Engineering GmbH, Inffeldgasse 13, 8010 Graz, Austria. The authors declare no conflicts of interest.

Abbreviations

The following abbreviations are used in this manuscript:
°CDegree Celsius
µgMicrogram
µmMicrometre
ACSAcetonitrile
AIFAngle of internal friction
AIFeEffective angle of internal friction
APIActive pharmaceutical ingredients
AVAcceptance value
BETBrunauer–Emmett–Teller
BJHBarrett–Joyner–Halenda
CCohesion
CmCentimetre
CPECo-processed excipients
FFormulation
FDAFood and Drug Administration
FfcFlow function coefficient
GGram
GmbHGesellschaft mit beschränkter Haftung
HClHydrochloric acid
HPLCHigh-performance liquid chromatography
HPLC-RPHigh-performance liquid chromatography—reverse phase
IBMInternational Business Machines Corporation
ICHInternational Council for Harmonisation
kPaKilo pascal
LTDLimited company
MCCMicrocrystalline cellulose
mgMilligram
MinMinute
mLMilliliter
MUPSMultiple-unit pellet system
NNormality
NmNanometre
OMZOmeprazole
OTCOver-the-counter medication
Ph. EurEuropean Pharmacopoeia
PhPotential of hydrogen
PSDParticle size distribution
PVAPolyvinyl alcohol
QQuality guideline
QTPPQuality Target Product Profile
RHRelative humidity
RLDReference Listed drug
SDStandard deviation
SSASpecific surface area
UKUnited Kingdom
UPLCUltra-high-performance liquid chromatography
USAUnited States of America
USPUnited States Pharmacopoeia
UYSUnconfined yield strength
WHOWorld Health Organization

References

  1. Suzuki, Y.; Sugiyama, H.; Kano, M.; Shimono, R.; Shimada, G.; Furukawa, R.; Mano, E.; Motoyama, K.; Koide, T.; Matsui, Y.; et al. Control strategy and methods for continuous direct compression processes. Asian J. Pharm. Sci. 2021, 16, 253–262. [Google Scholar] [CrossRef] [PubMed]
  2. Shangraw, R.F. Compressed Tablets by Direct Compression; The University of Maryland School of Pharmacy: Baltimore, MD, USA, 1989; ISBN 2013206534. [Google Scholar]
  3. Chowdary, K.P.R. A comparative evaluation of direct compression and wet granulation methods for formulation of stavudine tabletsTS. J. Glob. Trends Pharm. Sci. 2014, 5, 2000–2003. [Google Scholar]
  4. Dominik, M.; Vraníková, B.; Svačinová, P.; Elbl, J.; Pavloková, S.; Prudilová, B.B.; Šklubalová, Z.; Franc, A. Comparison of Flow and Compression Properties of Four Lactose-Based Co-Processed Excipients: Cellactose® 80, CombiLac®, MicroceLac® 100, and StarLac®. Pharmaceutics 2021, 13, 1486. [Google Scholar] [CrossRef]
  5. Kása, P.; Bajdik, J.; Zsigmond, Z.; Pintye-Hódi, K. Study of the compaction behaviour and compressibility of binary mixtures of some pharmaceutical excipients during direct compression. Chem. Eng. Process. Process. Intensif. 2009, 48, 859–863. [Google Scholar] [CrossRef]
  6. Onofre, F.; O’Donnell, K. Leveraging Direct Compression Technology to Improve Tableting Efficiency|American Pharmaceutical Review—The Review of American Pharmaceutical Business & Technology. Available online: https://www.americanpharmaceuticalreview.com/Featured-Articles/581695-Leveraging-Direct-Compression-Technology-to-Improve-Tableting-Efficiency/ (accessed on 22 June 2023).
  7. Rojas, J.; Buckner, I.; Kumar, V. Co-proccessed excipients with enhanced direct compression functionality for improved tableting performance. Drug Dev. Ind. Pharm. 2012, 38, 1159–1170. [Google Scholar] [CrossRef]
  8. Saha, S.; Shahiwala, A.F. Multifunctional coprocessed excipients for improved tabletting performance. Expert Opin. Drug Deliv. 2009, 6, 197–208. [Google Scholar] [CrossRef]
  9. Bhatia, V.; Dhingra, A.; Chopra, B.; Guarve, K. Co-processed excipients: Recent advances and future perspective. J. Drug Deliv. Sci. Technol. 2022, 71, 103316. [Google Scholar] [CrossRef]
  10. Rahman, M.S.; Yoshida, N.; Tsuboi, H.; Keila, T.; Sovannarith, T.; Kiet, H.B.; Dararth, E.; Zin, T.; Tanimoto, T.; Kimura, K. Erroneous formulation of delayed-release omeprazole capsules: Alert for importing countries. BMC Pharmacol. Toxicol. 2017, 18, 31. [Google Scholar] [CrossRef]
  11. Mansuri, N.S.; Parejiya, P.B.; Soniwala, M.M. Research Article Exploring use of quality by design (QbD) principles for development of modified release omeprazole pellets. J. Chem. Pharm. Res. 2015, 7, 630–639. [Google Scholar]
  12. Mohylyuk, V.; Yerkhova, A.; Katynska, M.; Sirko, V.; Patel, K. Effect of Elevated pH on the Commercial Enteric-Coated Omeprazole Pellets Resistance: Patent Review and Multisource Generics Comparison. AAPS PharmSciTech 2021, 22, 188. [Google Scholar] [CrossRef]
  13. Srebro, J.; Brniak, W.; Mendyk, A. Formulation of Dosage Forms with Proton Pump Inhibitors: State of the Art, Challenges and Future Perspectives. Pharmaceutics 2022, 14, 2043. [Google Scholar] [CrossRef] [PubMed]
  14. World Health Organization WHO Model List of Essential Medicines—22nd List; Technical Document; WHO: Geneva, Switzerland, 2021.
  15. Aubert, J.; Mulder, C.J.; Schrör, K.; Vavricka, S.R. Omeprazole MUPS®: An advanced formulation offering flexibility and predictability for self medication. Selfcare 2011, 2, 1–14. [Google Scholar]
  16. Chih-Ming Chen, D.; Joseph Chou, M.; Unchalee, K. Omeprazole Formulation. U.S. Patent US20040131684A1, 15 February 2004. [Google Scholar]
  17. Chih-Ming Chen, D.; Chou, J.C.H.; Weng, T. Omeprazole Formulation. U.S. Patent US6096340A, 1 August 2000. [Google Scholar]
  18. Palomo Coll, A. Oral Pharmaceutical Preparation Containing Omeprazole. U.S. Patent US5232706A, 3 August 1993. [Google Scholar]
  19. Bengtsson, I.S.; Lövgren, I. Pharmaceutical Formulation of Omeprazole. U.S. Patent US5690960A, 25 November 1997. [Google Scholar]
  20. Chauhan, I.; Nutalapati, S.R.K. Multilayer Omeprazole Tablets. U.S. Patent US20090280173A1, 12 November 2009. [Google Scholar]
  21. Lovgren, K.I.; Pilbrant, A.G.; Yasumura, M.; Morigaki, S.; Oda, M.; Ohishi, N. Coated Omeprazole Tablets. UK Patent GB2189698A, 4 November 1987. [Google Scholar]
  22. Bergstrand, P.J.A.; Lövgren, K.I. Multiple Unit Tableted Dosage Form of Omeprazole. U.S. Patent US5817338A, 16 October 1998. [Google Scholar]
  23. Dietrich, R.; Ney, H. Pharmaceutical Preparation in Tablet or Pellet Form for Pantoprazole and Omeprazole. German Patent DE19752843A1, 9 January 2003. [Google Scholar]
  24. Capua, S.D.; Shterman, N.; Pardo, L.A.; Itach, E. A Stable Pharmaceutical Composition Comprising an Acid Labile. Drug. Patent WO2005092297A2, 6 October 2005. [Google Scholar]
  25. 〈1216〉 Tablet Friability; USP43-NF38; United States Pharmacopeia: Rockville, MD, USA, 2022. [CrossRef]
  26. 〈701〉 Disintegration; USP43-NF38; United States Pharmacopeia: Rockville, MD, USA, 2008. [CrossRef]
  27. Omeprazole Delayed-Release Capsules; USP43-NF38; United States Pharmacopeia: Rockville, MD, USA, 2006. [CrossRef]
  28. 〈1226〉 Verification of Compendial Procedures; USP43-NF38; United States Pharmacopeia: Rockville, MD, USA, 2019. [CrossRef]
  29. International Council for Harmonisation Guideline Q2 (R2) Validation of Analytical Procedures. Available online: https://www.ema.europa.eu/en/documents/scientific-guideline/ich-guideline-q2r2-validation-analytical-procedures-step-2b_en.pdf (accessed on 25 October 2022).
  30. 〈1225〉 Validation of Compendial Procedures; USP43-NF38; United States Pharmacopeia: Rockville, MD, USA, 2016. [CrossRef]
  31. FDA Office of Regulatory Affairs Dissolution Methods (Omeprazole). Available online: https://www.accessdata.fda.gov/scripts/cder/dissolution/dsp_SearchResults.cfm (accessed on 26 June 2023).
  32. International Council of Harmonization Q1A (R2) Stability Testing of New Drug Substances and Products. Available online: https://database.ich.org/sites/default/files/Q1A%28R2%29 Guideline.pdf (accessed on 10 May 2023).
  33. Procter & Gamble Prilosec OTC Authorized Package Label. Available online: https://www.accessdata.fda.gov/drugsatfda_docs/label/2007/021229s006lbl.pdf (accessed on 23 April 2023).
  34. Niazi, S.K. Handbook of Pharmaceutical Manufacturing Formulations: Compressed Solid Products; CRC Press: Boca Raton, FL, USA, 2016; ISBN 9781420081176. [Google Scholar]
  35. MEGGLE GmbH & Co. KG. Excipients Brochure; MEGGLE GmbH &, Co. KG: Wasserburg am Inn, Germany, 2023. [Google Scholar]
  36. Thapa, P.; Choi, D.H.; Kim, M.S.; Jeong, S.H. Effects of granulation process variables on the physical properties of dosage forms by combination of experimental design and principal component analysis. Asian J. Pharm. Sci. 2019, 14, 287–304. [Google Scholar] [CrossRef]
  37. Kotamarthy, L.; Metta, N.; Ramachandran, R. Understanding the Effect of Granulation and Milling Process Parameters on the Quality Attributes of Milled Granules. Processes 2020, 8, 683. [Google Scholar] [CrossRef]
  38. Miinea, L.; Mehta, R.; Kallam, M.; Farina, J.; Deorkar, N. Evaluation and Characteristics of a New Direct Compression Performance Excipient. Available online: https://www.pharmtech.com/view/evaluation-and-characteristics-new-direct-compression-performance-excipient (accessed on 25 June 2024).
  39. MEGGLE Pharma—Excipients & Technology MicroceLac® 100 Product Detail. Available online: https://www.meggle-pharma.com/en/lactose/13-microcelac-100.html (accessed on 24 April 2024).
  40. Freeman, R. Measuring the flow properties of consolidated, conditioned and aerated powders—A comparative study using a powder rheometer and a rotational shear cell. Powder Technol. 2007, 174, 25–33. [Google Scholar] [CrossRef]
  41. Busignies, V.; Leclerc, B.; Truchon, S.; Tchoreloff, P. Changes in the specific surface area of tablets composed of pharmaceutical materials with various deformation behaviors. Drug Dev. Ind. Pharm. 2011, 37, 225–233. [Google Scholar] [CrossRef]
  42. Leung, L.Y.; Mao, C.; Chen, L.P.; Yang, C.-Y. Precision of pharmaceutical powder flow measurement using ring shear tester: High variability is inherent to powders with low cohesion. Powder Technol. 2016, 301, 920–926. [Google Scholar] [CrossRef]
  43. Manley, L.; Hilden, J.; Valero, P.; Kramer, T. Tablet Compression Force as a Process Analytical Technology (PAT): 100% Inspection and Control of Tablet Weight Uniformity. J. Pharm. Sci. 2019, 108, 485–493. [Google Scholar] [CrossRef]
  44. Manley, L.; Shi, Z. Characterizing drug product continuous manufacturing residence time distributions of major/minor excipient step changes using near infrared spectroscopy and process parameters. Int. J. Pharm. 2018, 551, 60–66. [Google Scholar] [CrossRef]
  45. Juban, A.; Nouguier-Lehon, C.; Briancon, S.; Hoc, T.; Puel, F. Predictive model for tensile strength of pharmaceutical tablets based on local hardness measurements. Int. J. Pharm. 2015, 490, 438–445. [Google Scholar] [CrossRef]
  46. Jarosz, P.J.; Parrott, E.L. Tensile Strengths and Hardness. J. Pharm. Sci. 1982, 71, 705–707. [Google Scholar] [CrossRef] [PubMed]
  47. Zhao, H.; Shi, C.; Zhao, L.; Wang, Y.; Shen, L. Influences of different microcrystalline cellulose (MCC) grades on tablet quality and compression behavior of MCC-lactose binary mixtures. J. Drug Deliv. Sci. Technol. 2022, 77, 103893. [Google Scholar] [CrossRef]
  48. Janssen, P.H.M.; Berardi, A.; Kok, J.H.; Thornton, A.W.; Dickhoff, B.H.J. The impact of lactose type on disintegration: An integral study on porosity and polymorphism. Eur. J. Pharm. Biopharm. 2022, 180, 251–259. [Google Scholar] [CrossRef]
  49. van Kamp, H.V.; Bolhuis, G.K.; Kussendrager, K.D.; Lerk, C.F. Studies on tableting properties of lactose. IV. Dissolution and disintegration properties of different types of crystalline lactose. Int. J. Pharm. 1986, 28, 229–238. [Google Scholar] [CrossRef]
  50. Ziffels, S.; Steckel, H. Influence of amorphous content on compaction behaviour of anhydrous α-lactose. Int. J. Pharm. 2010, 387, 71–78. [Google Scholar] [CrossRef]
  51. Thio, D.R.; Heng, P.W.S.; Chan, L.W. MUPS Tableting—Comparison between Crospovidone and Microcrystalline Cellulose Core Pellets. Pharmaceutics 2022, 14, 2812. [Google Scholar] [CrossRef]
  52. 〈905〉 Uniformity of Dosage Units; USP42-NF37; United States Pharmacopeia: Rockville, MD, USA, 2022. [CrossRef]
  53. 〈2〉 Oral Drug Products—Product Quality Tests; USP43-NF38; United States Pharmacopeia: Rockville, MD, USA, 2024. [CrossRef]
  54. 〈711〉 Dissolution; USP42-NF37; United States Pharmacopeia: Rockville, MD, USA, 2023. [CrossRef]
  55. MEGGLE Pharma—Excipients & Technology Tablettose® 100 Product Detail. Available online: https://www.meggle-pharma.com/en/lactose/8-tablettose-100.html (accessed on 24 April 2024).
  56. MEGGLE Pharma—Excipients & Technology Tablettose® 70 Product Detail. Available online: https://www.meggle-pharma.com/en/lactose/6-tablettose-70.html (accessed on 24 April 2024).
  57. Bowles, B.J.; Dziemidowicz, K.; Lopez, F.L.; Orlu, M.; Tuleu, C.; Edwards, A.J.; Ernest, T.B. Co-Processed Excipients for Dispersible Tablets–Part 1: Manufacturability. AAPS PharmSciTech 2018, 19, 2598–2609. [Google Scholar] [CrossRef]
  58. Challener, C.A. Formulating with Coprocessed Excipients: Current Trends. Pharm. Technol. 2023, 47, 18–21. [Google Scholar]
  59. Guy, T. Challenges Facing Pharmaceutical Excipients|American Pharmaceutical Review—The Review of American Pharmaceutical Business & Technology. Available online: https://www.americanpharmaceuticalreview.com/Featured-Articles/177716-Challenges-Facing-Pharmaceutical-Excipients/ (accessed on 17 May 2024).
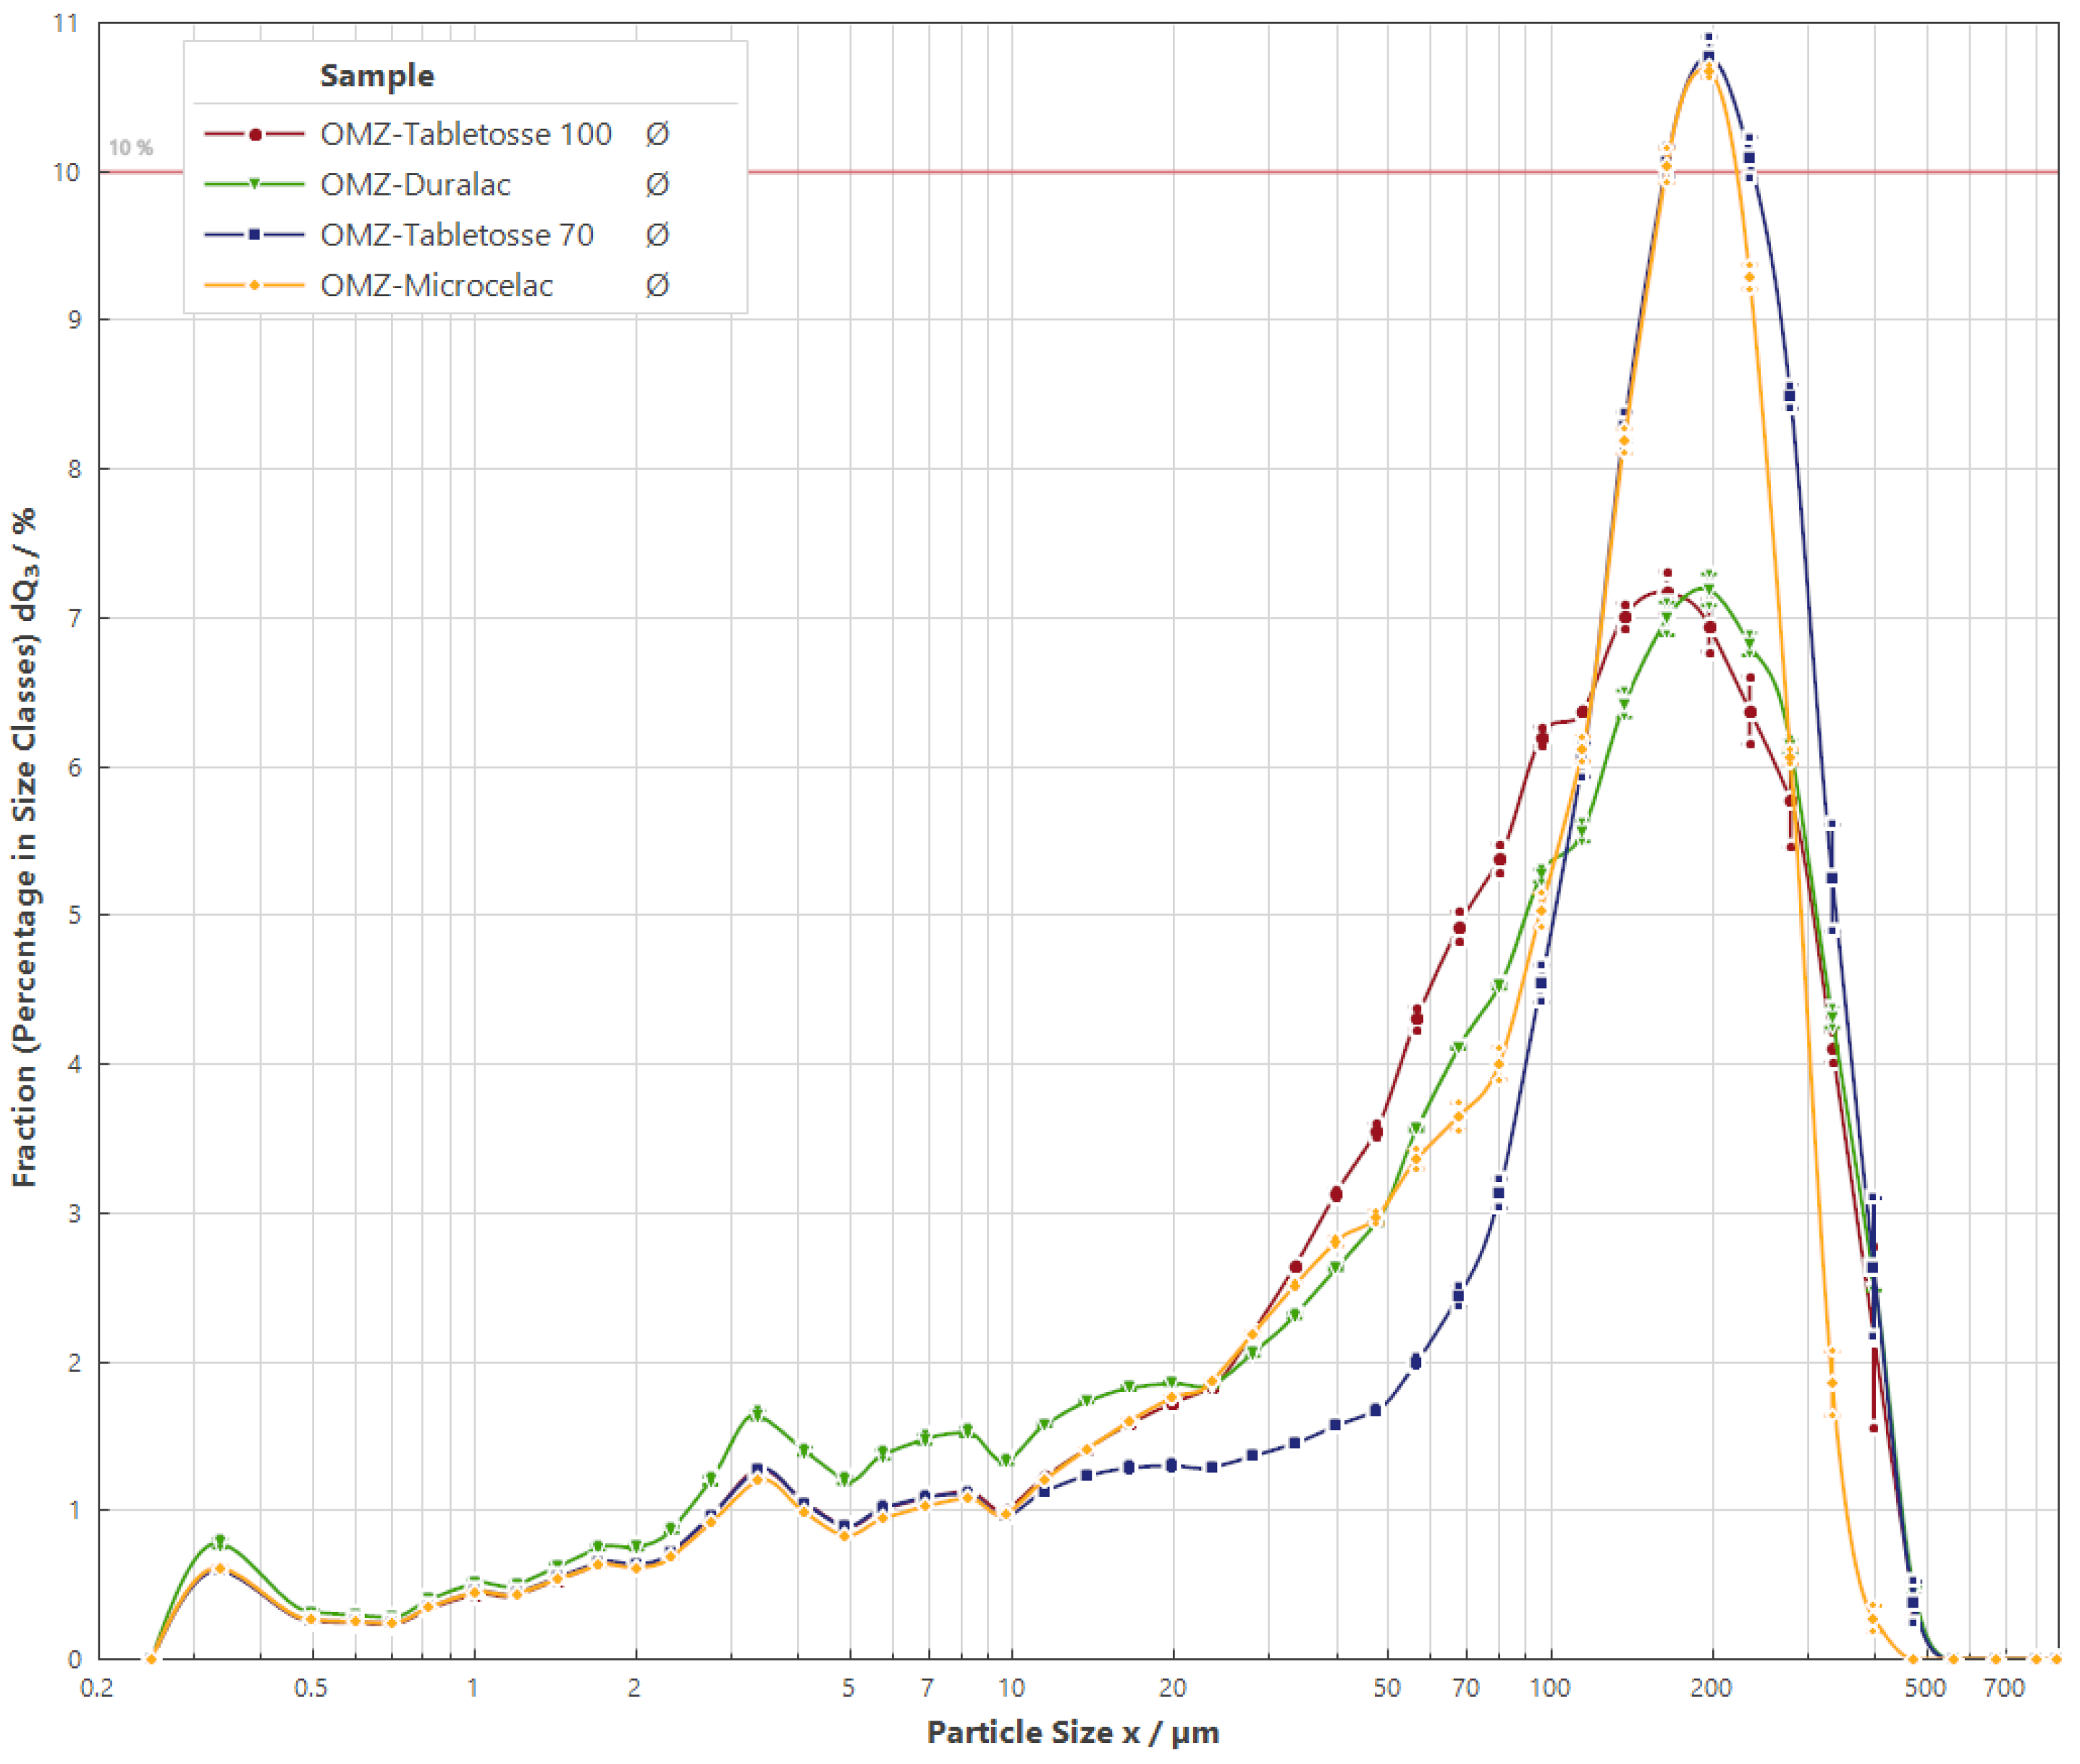
Figure 1. Particle size distribution in the proposed formulation prototypes: F1, F2, F3, and F4.
Scipharm 93 00024 g001
Figure 2. Representative microscope images of the four omeprazole formulation prototype blends (F1F4). Each panel shows a micrograph of one blend, illustrating the particle morphology and distribution of components within the formulation.
Scipharm 93 00024 g002
Figure 3. Shear stress at yielding as a function of applied normal stress for the omeprazole formulations. Error bars represent the standard deviation.
Scipharm 93 00024 g003
Figure 4. A dendrogram of hierarchical clustering (between groups with squared Euclidean distance).
Scipharm 93 00024 g004
Figure 5. Dendrogram for formulation prototypes. K-means clustering (k = 3) groups the cases into 3 formulation groups.
Scipharm 93 00024 g005
Figure 6. Main compression force graph across tableting trials for the omeprazole prototypes. Error bars represent the standard deviation across batches.
Scipharm 93 00024 g006
Figure 7. F1 formulation prototype: assay results for long-term stability. Error bars represent the standard deviation.
Scipharm 93 00024 g007
Figure 8. F1 formulation prototype: dissolution results for long-term stability (buffer stage). Error bars represent the standard deviation.
Scipharm 93 00024 g008
Figure 9. F1 formulation prototype: dissolution results for long term stability (acid stage). Error bars represent the standard deviation.
Scipharm 93 00024 g009
Table 1. Proposed formulation composition for omeprazole delayed-release tablets.
mg/Tablet
OMZMicrocelac® 100Tabletosse® 70Tabletosse® 100Avicel
PH102
DuraLac® HExplotab®Pruv®Total
F120.0170.0----8.02.0200.0
F220.0-170.0---8.02.0200.0
F320.0--170.0--8.02.0200.0
F420.0---42.5127.58.02.0200.0
Table 2. Chromatographic methodology conditions for the omeprazole content uniformity, assay, dissolution and impurities determination.
Chromatographic FeatureContent Uniformity, Assay and DissolutionImpurities
Mobile phasesA: 10 mM ammonium bicarbonate buffer pH 8.75 B: AcetonitrileA: Glycine 3 g/L adjusted to pH 9.0
B: Acetonitrile
Gradient program%A0min = 90, %A3min = 90, %A10min = 40, %A11min = 90 and %A15min = 90%A0min = 88, %A20min = 40, %A21min = 88 and %A25min = 88
Flow1.9 mL/min1.2 mL/min
Injection volume5 µL (content uniformity, assay) and 40 µL (dissolution)10 µL
Time per injection15 min25 min
Column temperature35 °C20 °C
Sample temperature20 °C20 °C
Wavelength305 nm305 nm
Table 3. Proposed stability testing scheme for omeprazole delayed-release coated tablets.
Stability Test Timepoint (Months)
Initial123456912
AssayXXXXXXXXX
DissolutionX X X X
ImpuritiesX X X X
Table 4. Particle size distribution results for the proposed formulation prototypes and omeprazole (API).
OMZF1F2F3F4
D10 [μm]0.79 ± 0.026.26 ± 0.115.87±0.085.99 ± 0.104.31 ± 0.14
D50 [μm]3.71 ± 0.02113.23 ± 1.37143.06 ± 1.9094.79 ± 1.1093.30 ± 1.53
D90 [μm]13.82 ± 2.93247.26 ± 1.39294.80 ± 5.73276.66 ± 3.94283.35 ± 1.45
Table 5. Results of powder rheology for the omeprazole formulations.
Cohesion, kPaUYS, kPaFFAIF, °
F10.25 ± 0.020.89 ± 0.065.57 ± 0.2731.68 ± 0.51
F20.09 ± 0.060.34 ± 0.2118.51 ± 10.7135.30 ± 1.35
F30.21 ± 0.090.78 ± 0.317.35 ± 3.1134.75 ± 2.17
F40.36 ± 0.021.38 ± 0.064.11 ± 0.1835.03 ± 0.89
Unconfined yield strength (UYS), flow function (FF), and angle of internal friction (AIF).
Table 6. Results of specific surface area for the omeprazole formulation prototypes.
FormulationSSA (m2/g)
F10.6708
F20.5906
F30.6174
F40.7023
Table 7. Physical characterization of uncoated omeprazole tablet prototypes and commercial product Prilosec® coated tablets.
FormulationAverage Weight Variation (mg)Average Hardness (N) Friability (%)Disintegration (min)
F1198.9 ± 1.578.1 ± 7.40.10.8
F2204.9 ± 0.446.9 ± 7.40.20.5
F3200.1 ± 2.845.8 ± 7.90.20.5
F4192.7 ± 7.443.8 ± 11.40.11.0
Prilosec®333.5 ± 3.8154.0 ± 14.6n.a.7.5
Table 8. Proposed analytical specifications for omeprazole film-coated tablet prototypes.
TestAcceptance CriteriaJustification
Uniformity of dosage unitsAcceptance value (AV) < 15.0USP <905> [52]
Assay90.0–110.0%USP <2> [53]
Impurities
Omeprazole-related compounds F and G
5-Methoxy-1H-benzimidazole-2-thiol
Any other individual impurity
Total impurities
0.5%
0.5%
0.5%
2
[27]
Dissolution (Acid Stage)NMT 10% after 2 h[27,54]
Dissolution (Buffer Stage)NLT 75% (Q) at 45 min[27]
Table 9. Uniformity of dosage units, assay, and dissolution results for omeprazole prototypes and Prilosec®.
FormulationUniformity of Dosage UnitsAssay (%)Dissolved at 45 Minutes (%)
Mean of Individuals (%)AVNominalNormalized per Assay
F1100.6 ± 1.43.099.4 ± 1.095 ± 296 ± 2
F298.9 ± 0.82.096.7 ± 1.090 ± 193 ± 1
F396.3 ± 1.05.096.2 ± 0.689 ± 293 ± 2
F498.3 ± 3.07.396.0 ± 2.891 ± 195 ± 3
Prilosec®98.2 ± 3.07.598.2 ± 2.6 *92 ± 494 ± 5
* Assay estimated based on a theoretical tablet weight of 336.59 mg, using 10 individually weighed units.
Table 10. Physical characterization of scaled-up uncoated omeprazole tablet prototype using formulation 1.
FormulationAverage Weight Variation (mg)Average Hardness (N)Friability (%)Disintegration (min)
F1-Scale up Batch200.8 ± 1.5102.1 ± 6.50.091.5
Table 11. F1 formulation prototype: impurity results for long-term stability.
ImpurityAcceptance Criteria (%)Timepoint (Months)
Initial6912
Omeprazole related compounds F and G0.50.0 ± 0.00.3 ± 0.00.2 ± 0.00.2 ± 0.0
5-Methoxy-1H-benzimidazole-2-thiol0.50.0 ± 0.00.0 ± 0.00.0 ± 0.00.0 ± 0.0
Any other individual impurity0.50.2 ± 0.00.3 ± 0.10.4 ± 0.00.4 ± 0.0
Total impurities20.6 ± 0.10.9 ± 0.11.2 ± 0.11.4 ± 0.1
Disclaimer/Publisher’s Note: The statements, opinions and data contained in all publications are solely those of the individual author(s) and contributor(s) and not of MDPI and/or the editor(s). MDPI and/or the editor(s) disclaim responsibility for any injury to people or property resulting from any ideas, methods, instructions or products referred to in the content.