Article

Antidiabetic Effect of Dihydrobetulonic Acid Derivatives as Pparα/γ Agonists

by
Mikhail V. Khvostov
1,*,
Mikhail E. Blokhin
1,
Sergey A. Borisov
1,
Vladislav V. Fomenko
1,
Yulia V. Meshkova
1,
Natalia A. Zhukova
1,
Sophia V. Nikonova
2,
Sophia V. Pavlova
3,
Maria A. Pogosova
3,
Sergey P. Medvedev
3,
Olga A. Luzina
1 and
Nariman F. Salakhutdinov
1
1
N. N. Vorozhtsov Novosibirsk Institute of Organic Chemistry, Siberian Branch of the Russian Academy of Sciences, Akademika Lavrentieva Ave., 9, 630090 Novosibirsk, Russia
2
V. Zelman Faculty for the Medicine and Psychology, Novosibirsk State University, Pirogova Str. 1, 630090 Novosibirsk, Russia
3
Institute of Cytology and Genetics, Siberian Branch of Russian Academy of Sciences, Akademika Lavrentieva Ave., 10, 630090 Novosibirsk, Russia
*
Author to whom correspondence should be addressed.
Sci. Pharm. 2024, 92(4), 65; https://doi.org/10.3390/scipharm92040065
Submission received: 7 October 2024 / Revised: 26 November 2024 / Accepted: 2 December 2024 / Published: 5 December 2024

Abstract

:
Dual PPARα/γ agonists can normalize both glucose and lipid metabolism in patients with type 2 diabetes mellitus. The development of such drugs faced the detection of various toxic effects in phase III clinical trials. However, two drugs of this class managed to pass all stages of clinical trials, which makes the search for new dual PPARα/γ agonists promising. In the present study, a series of dihydrobetulonic acid amides differing in the length of the amino-alcohol linker and incorporating a pharmacophore fragment of (S)-2-ethoxy-3-phenylpropanoic acid were synthesized. The in vitro study showed that the length of the aminoalcohol linker dramatically affects the level of activation of PPAR-α and γ receptors. The synthesized compounds were tested for their ability to improve glycemic control and to counter lipid abnormalities in C57Bl/6 Ay/a mice at a dose of 30 mg/kg. Of all the compounds tested, the dihydrobetulonic acid derivative with an aminoethanol linker (15a) had the most pronounced effect in improving insulin sensitivity and glucose tolerance, and in reducing blood triglyceride levels. In addition, 15a dramatically counteracted the pathological changes in the liver, pancreas, kidney, and brown fat tissue that are characteristic of type 2 diabetes.

1. Introduction

Diabetes mellitus (DM) is a multifactorial disease caused by elevated blood glucose levels. According to etiology, two types of diabetes have been determined: type 1 diabetes is associated with autoimmune damage to pancreatic B cells and, as a consequence, a complete lack of insulin secretion, and type 2 diabetes (T2DM), which is caused by insulin resistance and a progressive decrease in its secretion. The second type is the most common and accounts for 90–95% of all diabetes cases [1]. Concomitant with hyperglycemia is diabetic dyslipidemia, characterized by increased levels of triglycerides (TGs) and low-density lipoproteins (LDLs), as well as decreased levels of high-density lipoproteins (HDLs) [2,3].
An increase in glucose levels and a change in the lipid profile toward LDL leads to the formation of micro- and macroangiopathies, which cause diabetic nephropathy, neuropathy, retinopathy, and various cardiovascular complications (heart attacks, strokes, congestive heart failure, coronary heart disease (CHD)), respectively [4]. Thus, an effective therapeutic strategy is the simultaneous management of two main manifestations of T2DM—hyperglycemia and dyslipidemia [2].
Currently, the following classes of drugs have been used to treat T2DM: biguanides (metformin), sulfonylureas (gliquidone, glimepiride), PPARγ agonists (thiazolidinediones) and PPARα agonists (fibrates), DPP-4 inhibitors (gliptins), SGLT2 inhibitors (gliflozins), incretin mimetics (exenatide, liraglutide), insulin, α-glucosidase inhibitors (acarbose), dopaminergic agonists (bromocriptine), bile acid sequestrants (cholestyramine), meglitinides (repaglinide) and amylinomimetics (pramlintide) [1,3].
When selecting a treatment, it is often necessary to combine multiple medications. However, taking drugs in combination is correlated with low patient compliance, so the introduction of multitarget drugs acting simultaneously in several areas can solve this problem [1]. One such example is dual PPARα/γ agonists, designed to combine the beneficial effects of PPARα and PPARγ activation, as they are able to simultaneously control both carbohydrate and lipid metabolism [3].
Peroxisome proliferator-activated receptors (PPARs) are ligand-dependent transcription factors of the nuclear receptor superfamily and are involved in the expression of specific target genes involved in carbohydrate and lipid metabolism. There are several subtypes of these receptors (PPARα/δ/γ), but due to different tissue expression patterns they have distinct physiological roles. Thus, PPARα agonists (fibrates) regulate lipid metabolism and are used in the treatment of hypertriglyceridemia, PPARγ agonists (thiazolidinediones) control carbohydrate metabolism and are used for hyperglycemia, and PPARδ activators, in turn, enhance mitochondrial and energy metabolism, but they are not available for use yet [5].
Drugs with PPARα and PPARγ activators are currently used in clinical practice, for example, with metformin. But the most attractive is the use of dual PPARα/γ agonists; which combination therapy has shown sufficient control of both glucose and TG levels, and there were positive effects on the level of glycated hemoglobin (HbA1c) and insulin resistance index [6]. However, among the dual PPARα/γ agonist drugs (glitazars, Figure 1), which include muraglitazar, naveglitazar, tesaglitazar (TEZ), ragaglitazar, aleglitazar, and saroglitazar, only the latter is approved for use in the treatment of T2DM in India. The rest did not pass the safety profile tests in phase III clinical trials due to cardiotoxicity, carcinogenic effects, decreased glomerular filtration rate, and others [2,3,7]. Saroglitazar has been used successfully in people with prediabetes, resulting in lower TG and HbA1c levels, and no side effects have been reported [8]. In another study among individuals with T2DM, taking saroglitazar led to a decrease in TG and an increase in creatinine levels compared to control groups [9]. Another placebo-controlled study of the saroglitazar efficacy demonstrated a significant reduction in hypertriglyceridemia and an improvement in insulin sensitivity in patients with T2DM [10].
Another drug among the glitazars, which, according to the latest data, demonstrates a high safety profile and effectiveness, is chiglitazar [11]. In studies, which included people with metabolic syndrome and insulin resistance, the drug showed more significant effectiveness in controlling glycemia compared to sitagliptin [12].
Natural compounds are known to be a good platform for drug development [13], and the introduction of natural pharmacophore fragments can lead to an enhancement of their properties. For example, we previously obtained, described, and tested amides of triterpene acids with the (S)-2-ethoxy-3-(4-hydroxyphenyl)propanoic acid fragment, among which the most active turned out to be the derivative with a dihydrobetulonic acid fragment. Triterpene acids of the lupane series and, in particular, dihydrobetulonic acid, possess both hepatoprotective and antidiabetic properties [14,15], while having low toxicity [16].
In vivo tests on genetically modified mice with T2DM showed that oral administration of a (S)-2-ethoxy-3-(4-hydroxyphenyl)propanoic acid derivative with a dihydrobetulonic acid fragment 16 leads to a decrease in blood glucose and cholesterol levels without affecting liver enzymes: alkaline phosphatase (ALPs), alanine transaminase (ALTs), and aspartate transaminase (ASTs). These favorable characteristics can be explained by the presence of a steroid core, which is believed to play an important role in their potent hypoglycemic effect [10], and significant lipophilicity. Lipophilic fragments, in turn, are of particular interest in the case of PPARs, since PPARs are actively expressed in the liver and adipose tissue [6].
Thus, in the present study, we investigated several new substances with different aliphatic linker lengths in order to assess their effect on carbohydrate and lipid metabolism in mice with T2DM. Varying the length of the amino-alcohol linker may promote better binding of the molecule to PPAR receptors.

2. Materials and Methods

2.1. Evaluation of the Compounds Activity and Specificity In Vitro

Creation of transgenic lines based on an epithelial cell line from Chinese hamster ovary (CHO-K1), expressing the human genes hPPARα/hRXRα (CHO-PPARα) and hPPARγ/hRXRα (CHO-PPARγ).
CHO-K1 cell line was obtained from the cell culture collection at the State Research Center of Virology and Biotechnology VECTOR (Novosibirsk, Russia). DNA fragments encoding human genes hPPARγ и hRXRα were amplified from plasmids (pBabe bleo human PPARgamma2 (Addgene plasmid #11439; http://n2t.net/addgene:11439 (accessed on 4 December 2024); RRID:Addgene_11439) and pBabe hygro human RXR alpha (Addgene plasmid #11440; http://n2t.net/addgene:11440 (accessed on 4 December 2024); RRID:Addgene_11440). PPARα were obtained by PCR of cDNA from spontaneously differentiated human-induced pluripotent stem cells (iPSCs).
Into the genome of CHO-K1 cells using transposase Sleeping Beauty (pCMV/SB10 Addgene plasmid #24551; http://n2t.net/addgene:24551 (accessed on 4 December 2024); RRID:Addgene_24551)21 transposons pSB-CAG-Neo-hPPARgamma or pSB-CAG-Neo-hPPARalpha and pSB-CAG-Hygro-hRXRalpha) were introduced. The backbone of pSB-CAG-Neo и pSB-CAG-Hygro was pT2/HB (Addgene plasmid #26557; http://n2t.net/addgene:26557 (accessed on 4 December 2024); RRID:Addgene_26557), encoding Sleeping Beauty IR/DR(L) and IR/DR(R) transposon repeats, between which CAG promoter (CMV enhancer, chicken β-actin promoter, hybrid intron), SV40 poly(A) signal, cassette of resistance to geneticine (SV40p-NeoR/KanR-HSV TK poly(A)) or Hygromycine (SV40p-Hygro-HSV TK poly(A) were introduced (Supplementary Figure S1).
After transfection with the Lipofectamin 3000 (Thermo Fisher Scientific, Waltham, MA, USA), CHO-K1 cells were cultured in the presence of antibiotics G418 (geneticine) 1000 mkg/mL and Hygromycine 500 mkg/mL simultaneously for 8 days. Antibiotic-resistant cells were named CHO-PPARα and CHO-PPARγ and were further used to test compounds’ activity and specificity to PPARα/γ.

2.2. Dual-Luciferase Reporter Assay to Study the Compounds Activity and Specificity

The PPAR response element (PPRE element) and the minimal TK thymidine kinase promoter from the PPRE-X3-TK-luc (Addgene plasmid #1015; http://n2t.net/addgene:1015 (accessed on 4 December 2024); RRID:Addgene_1015) were cloned into a vector pGK4.10[Luc2] (Promega, Madison, WI, USA), encoding firefly luciferase to obtain a PPAR-response reporter construct PPRE-pGK4.10[Luc2]. CHO-K1, CHO-PPARγ/RXRα and CHO-PPARα/RXRα cells were seeded 2 × 10⁴ cells per 96-well plate with opaque walls (Greiner Bio-one, Kremsmünster, Austria, кaт.655098) in a growth medium (DMEM/F12, 10% FBS, Penicillin 10 units/mL, Streptomycin 10 mkg/mL), after 24 h reporter plasmid PPRE-pGK4.10[Luc2] and normalization plasmid pGL4.73[hRluc_SV40] (Promega, Madison, WI, USA), constitutively expressing Renila luciferase (RLuc), were introduced using Lipofectamin 3000 (Thermo Fisher Scientific, Waltham, MA, USA). After 24 h, the culture medium was changed to HBSS (Thermo Fisher Scientific, Waltham, MA, USA) and reference and experimental compounds were added in DMSO (the final concentration of DMSO was 0.1%). PPARgamma agonist Rosiglitason, PPARα agonist Fenofibrate, and dual PPARα/γ agonist Tezaglitazar (all Sigma-Aldrich, Darmstadt, Germany) were used to analyze specificity of CHO-K1, CHO-PPARγ/RXRα and CHO-PPARα/RXRα cells activate reporter construct PPRE-pGK4.10[Luc2]. As a control, 0.1% DMSO in HBSS was added to the cells. Then, 24 h after the addition of compounds, cells were lysed and luciferase activity was determined with Dual-Luciferase reporter Assay System (Promega) on the GloMax96 Microplate Luminometer with Dual injection (Promega, Madison, WI, USA) according to manufacturer’s protocol.

2.3. Testing Substances for PPARα/γ Activation

CHO-PPARg/RXR and CHO-PPARa/RXR cells were seeded 2 × 10⁴ cells per 96-well plate with opaque walls (Greiner Bio-one, cat. 655098) in a growth medium (DMEM/F12, 10% FBS, Penicillin 10 units/mL, Streptomycin 10 mkg/mL). After 24 h, a reporter plasmid was introduced using Lipofectamin 3000 (ThermoFisher)PPRE-pGK4.10[Luc2], and the normalization plasmid pGL4.73[hRluc_SV40] (Promega), constitutively expressing Renila luciferase (RLuc). After a further 24 h, the culture medium was changed to HBSS and the substances were added to DMSO (the final concentration of DMSO was 0.1%). As a control, HBSS containing 0.1% DMSO was added to the cells. Then, 24 h after the addition of substances, the cells were lysed in Lysis buffer from Dual-Luciferase reporter Assay System (Promega) and according to the manufacturer’s protocol, luciferase activity was determined using a GloMax96 Microplate Luminometer with Dual injection device (Promega).

2.4. Animals

Male C57BL/6 Ay/a (AY) mice weighing 28–32 g were used. Animals source: SPF vivarium of the Institute of Cytology and Genetics SB RAS. The animals were housed with ad libitum access to water and feed. Humidity, temperature, and a 12/12 h light-and-dark cycle in vivarium were controlled. All experiments with animals were conducted in accordance with the Russian Federation’s laws, the Ministry of Health of the Russian Federation decree no. 199n of 01/04/2016; the European Parliament and European Union Council Directive 2010/63/EU of 22/09/2010 on the protection of animals used for scientific purposes. The experiment protocol was approved by the Ethics Committee of N.N. Vorozhtsov Institute of Organic Chemistry SB RAS (protocol no. P-01-01.2024-14).

2.5. The OGTT

Animals fasted for 12 h before the test. Mice in all groups were given oral glucose at a dose of 2.5 g/kg 30 min prior to blood glucose concentration measurement. The first OGTT in AY mice was conducted after 14 days of administration and all compounds were introduced 30 min prior to the glucose load by oral gavage. The second OGTT was performed on the 28th day of the experiment while the last compounds’ introduction was a day prior to the test. All mice blood samples were obtained from tail incision. The following time points were used: 0 (before dosing), 30, 60, 90, and 120 min after the glucose load. The ONE TOUCH Select blood glucose meter (LIFESCAN Inc., Milpitas, CA, USA) was used for blood glucose concentration measurement. Tai’s model was used to calculate the area under the glycemic curve (AUC) [17].

2.6. The ITT

The test was performed on all animals according to the AY mice experiment design after 4 h of fasting. Insulin (Soluble human insulin, Medsynthesis plant, Novouralsk, Russia) was injected i.p. at a dose of 5 ED/kg. Blood samples were obtained from tail incision before the insulin injection (time 0) and at 15, 30, 45, 60, and 90 min after that. Blood glucose concentration was evaluated with a ONE TOUCH Select blood glucose meter (LIFESCAN Inc., Milpitas, CA, USA).

2.7. The AY Mice Experiment Design

Body weight gain of the C57BL/6 Ay/a was promoted by adding lard and cookies to standard chow ad libitum for 30 days. A body weight of 35 g was the minimum for the mouse to be chosen for further experiments. Selected animals were divided in the following groups (n = 7 in each): (1) vehicle (water + 2 drops of Tween 80), (2) tezaglitazar (TEZ) 30 mg/kg, 3–7) 15a–e 30 mg/kg, (8) MF 250 mg/kg, and (9) C57BL/6 mice (n = 7) + vehicle. During the whole experiment, the diet was the same as throughout the weight gain phase. The metformin dose was used according to the literature data [18], while the dose of potential glitazars and tezaglitazar corresponded to our previously published works with similar compounds [19]. Tested compounds were administered orally (by oral gavage) once a day. OGTT was conducted on the 14th and 28th day of the experiment. Animals were decapitated and blood was drawn for the biochemical assay on the 31st day of the experiment. For the histology, the following organs and tissues were taken: liver, kidney, heart, gonadal fat, interscapular white and brown fat, pancreas. Body weight and food consumption were evaluated once a week.

2.8. Biochemical Assays

Serum was separated by centrifugation at 1640× g for 15 min. Standard diagnostic kits (Vector-Best, Novosibirsk, Russia) and a photometer Multiscan Ascent (Thermo Lab-systems, Helsinki, Finland) were used to analyze serum total cholesterol, triglycerides, alkaline phosphatase, alanine aminotransferase, and lactate levels.

2.9. Histological Examination

Excised tissues (liver, kidney, interscapular white and brown fat, pancreas) were fixed in 10% neutral buffered formalin for 7 days, then they were subjected to the standard dehydration in ascending ethanol concentrations and xylene. Tissue samples were embedded in paraffin on an AP 280 workstation using Histoplast (Thermo Fisher Scientific, Waltham, MA, USA, melting point of 58 °C). Slices with a thickness of 4.5 μm were obtained on a rotational microtome NM 335E with disposable interchangeable blades. Hematoxylin and eosin staining were used. Sample’s examination was performed under a light microscope at a magnification of ×100–400.

2.10. Statistical Analysis

Statistical analysis was performed by the Mann–Whitney U test and one-way ANOVA followed by the Dunnett’s multiple comparisons test. Data are shown as mean ± SEM. Data with p < 0.05 were considered statistically significant.

3. Results

3.1. Chemistry

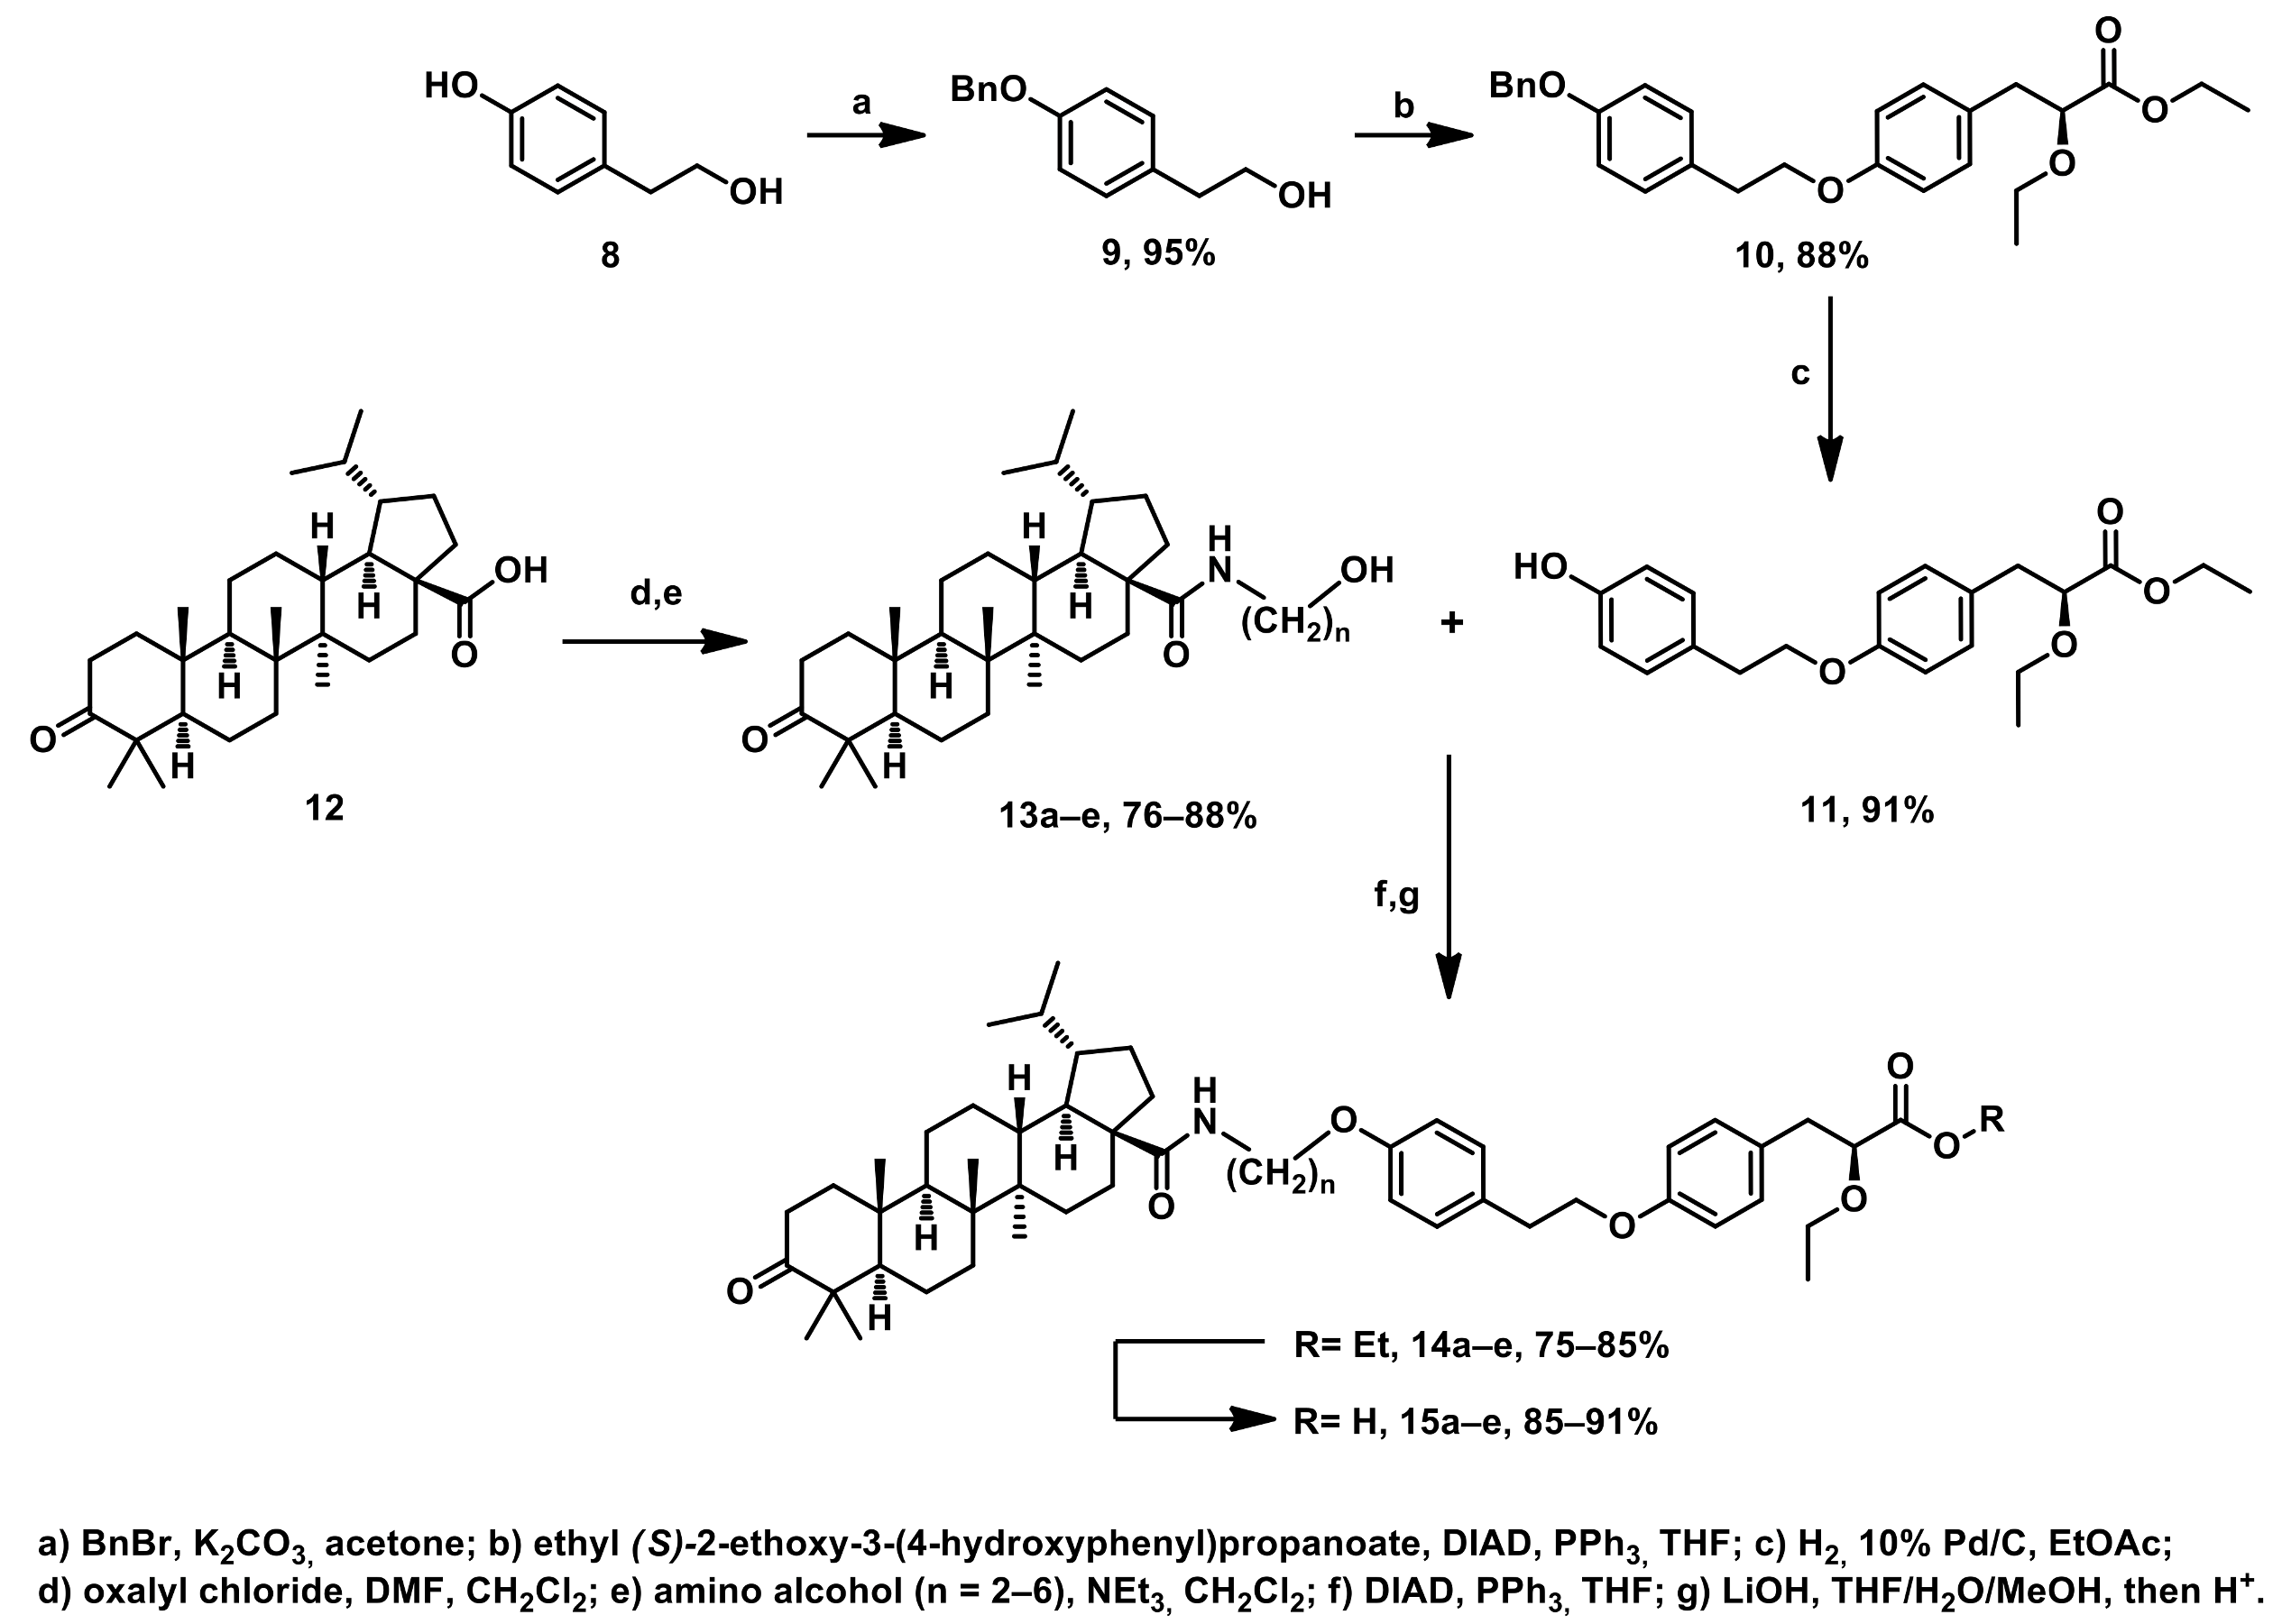
(S)-ethyl-2-ethoxy-3-(4-(4-hydroxyphenethoxy)-phenyl) propanoate 11 was obtained in 3 steps: reaction of tyrosol 8 with an excess of benzylbromide in acetone in the presence of potassium carbonate, reaction between alcohol 9 and (S)-ethyl-2-ethoxy-3-(4-hydroxyphenyl)-propanoate in Mitsunobu reaction conditions, and debenzylation of ether 10. The corresponding amidoalcohols of dihydrobetulonic acid 13a–e were obtained through the interaction of betulonic acid with various amino alcohols (from aminoethanol to aminohexanol) in the presence of NEt3. The condensation of resulting phenol 11 with alcohols 13a–e in the presence of DIAD and PPh3 led to the production of novel ethers 14a–e in yields of 75–85% under mild conditions.
The resulting compounds 14a–e were hydrolyzed with lithium hydroxide using an adapted procedure [20] and the reaction mixture was subsequently acidified, leading to the formation of acids 15a—85%, 15b—91%, 15c—89%, 15d—88%, 15e—85% yield.
To meet the purity requirements for samples sent for biological testing, the compounds were purified by column chromatography. The purity was monitored by HPLC and NMR and was at least 95%.

3.2. Biological Testing

In Vitro PPARα and PPARγ Receptors Agonist Activity Evaluation

Genes of hPPARα, hRXRa and hPPARγ, hRXRa were introduced into the CHO-K1 with the Sleeping Beauty (SB) transposon for stable expression. After selection for G418 (geneticine) 1000 mkg/mL and Hygromycine 500 mkg/mL, CHO-PPARα and CHO-PPARγ cell lines were received (Supplementary Figure S2). The specificity of receptor activation in the parental and transgenic cell lines was confirmed with fenofibrate, a selective agonist of PPARα (EC50 30 μM) and rosiglitazone, a selective PPARγ agonist (EC50 60 nM). We tested the effect of the experimental compounds on PPAR using reporter constructs expressing firefly luciferase under 3xPPRE DNA biding elements and TK minimal promoter on transgenic cells lines CHO-PPARα and CHO-PPARγ. It was shown that 15a,c were dual PPAR-α,γ agonists at 1 µM concentration (XTT-assay provided in the Supplementary Section, Figure S4), 15d,e were PPARγ agonists only, and compound 15b did not activate any of the receptors studied (Figure 2).

3.3. In Vivo Experiment

Body Weight and Food Consumption Dynamics

During the entire period of the test substances’ administration, the body weight of C57BL/6 Ay/a mice was measured weekly and the mass of food consumed per week was recorded (Figure 3). As a result of the measurements, it was found that TEZ and compound 15a significantly reduced the weight of mice compared to the control group starting from the second week of administration. In all other experimental groups and in the group of the reference drug metformin, body weight during the experiment was approximately at the same level with a slight tendency toward increase by the fourth week. The food consumption measurment data indicated that to the end of the experiment it was decreased in the TEZ group, while in all other groups this parameter remained almost at the same level.

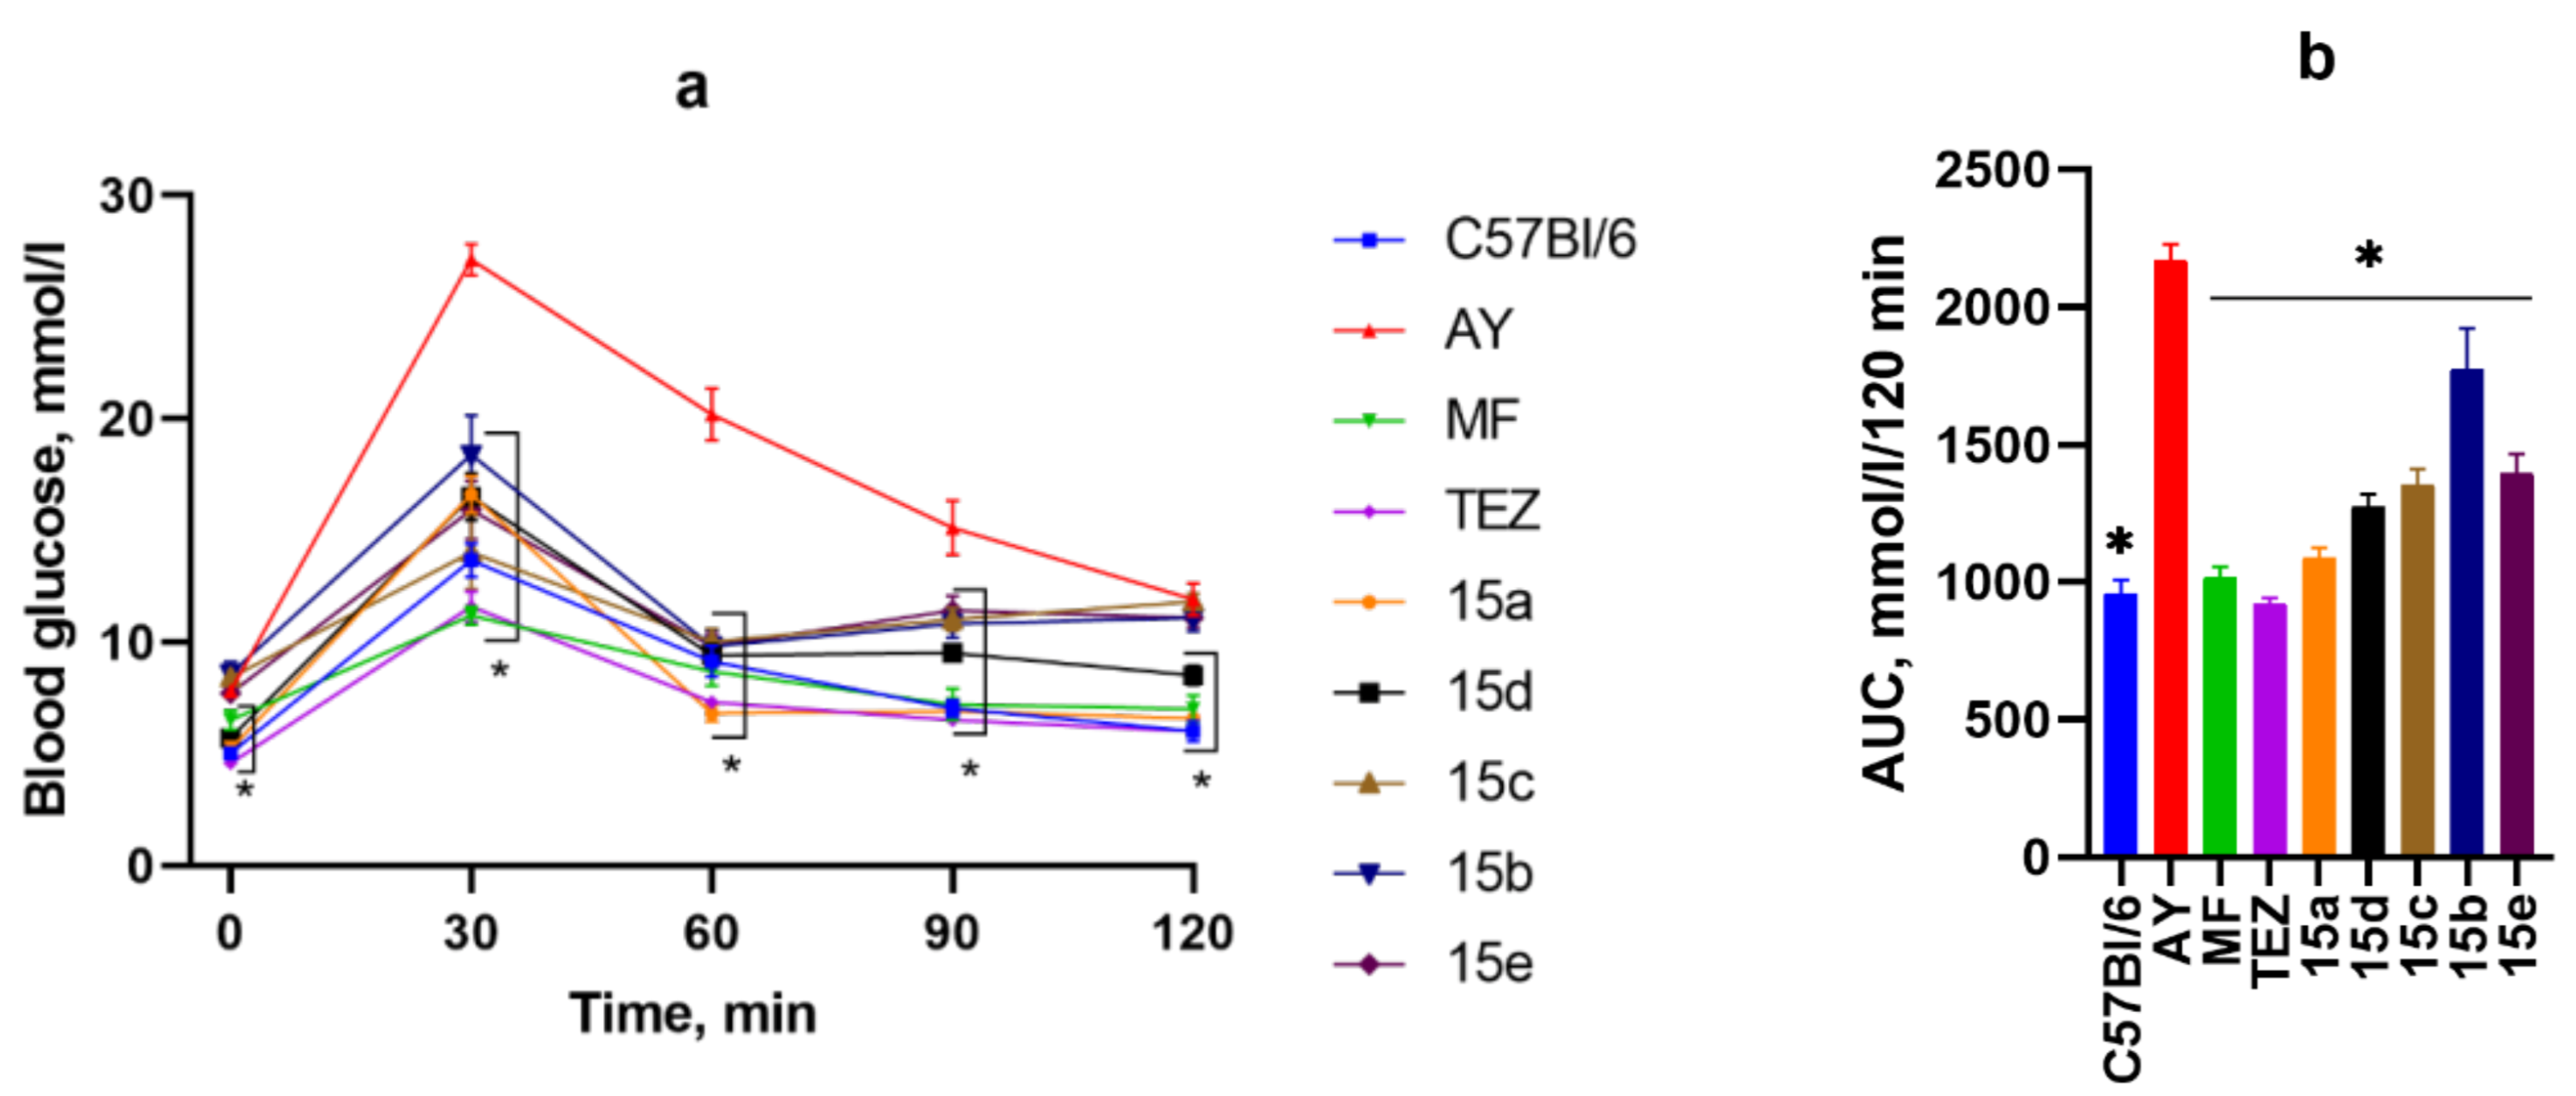
3.4. OGTT After 2 Weeks of Substance Administration

Based on the data obtained during the OGTT, with preliminary administration of substances 30 min before the glucose load, carried out after 2 weeks from the start of the experiment, glycemic curves were constructed. It was demonstrated that all the studied compounds, as well as the reference drugs metformin and TEZ, showed pronounced hypoglycemic effects. At the same time, metformin, TEZ, as well as compounds 15a and 15b had significantly lower blood glucose levels compared to the control group (AY mice) at all time points of the experiment. The area under the glycemic curve (AUC) more clearly demonstrates the difference between the hypoglycemic effects of the studied substances and it can be noted that the shortest linker of the compound 15a contributes to the manifestation of a more pronounced effect (Figure 4).

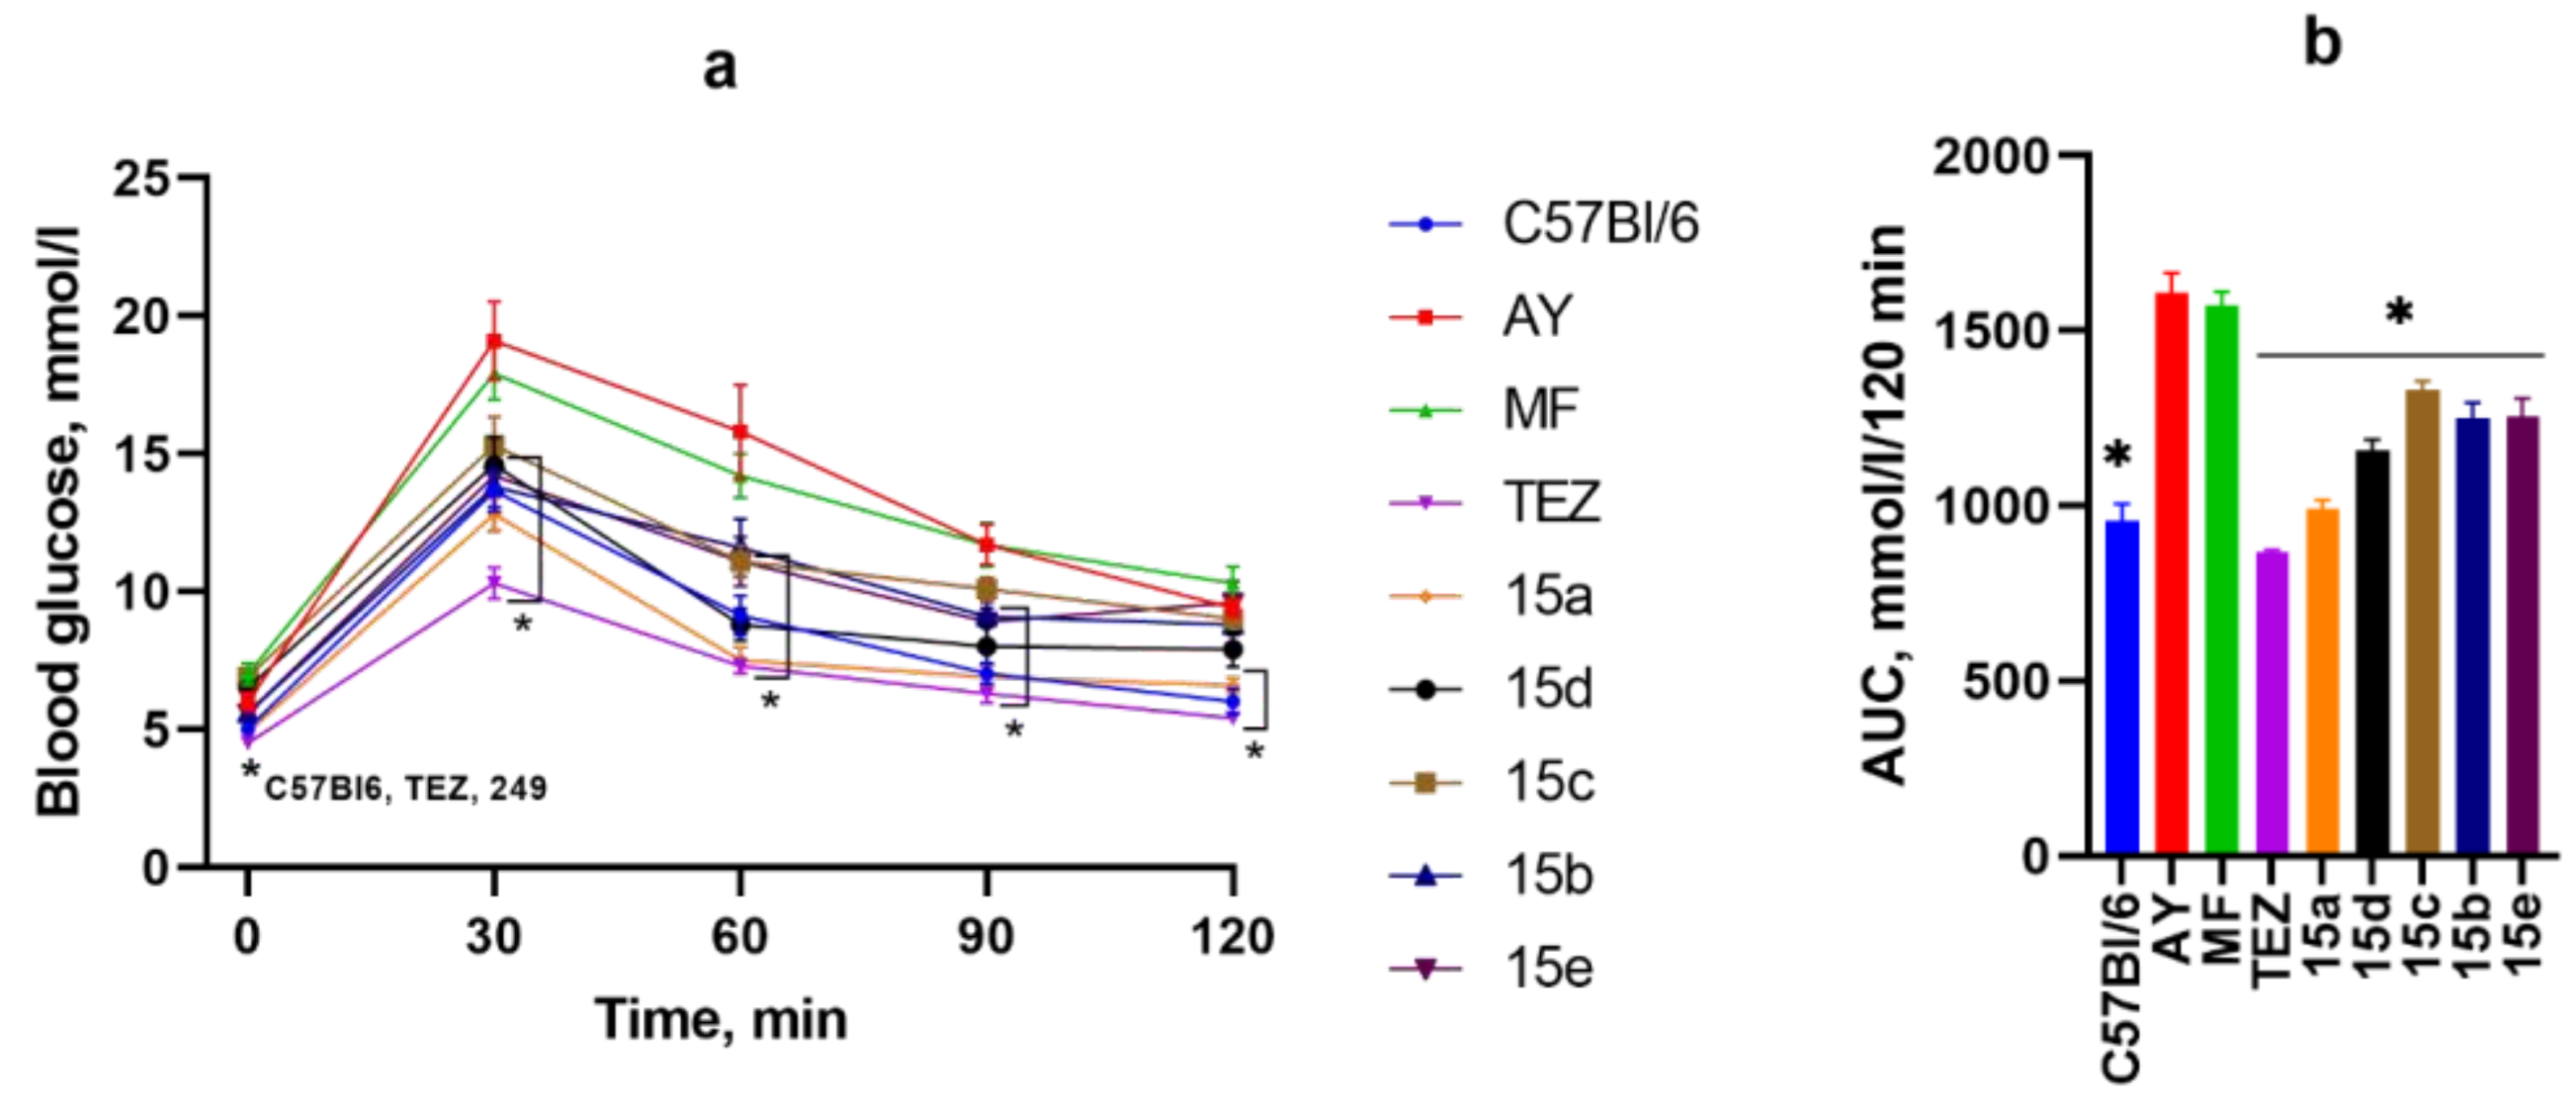
3.5. OGTT After 4 Weeks of Substance Administration

According to the results of the OGTT, carried out 2 days after the end of the substances administration, it was found that TEZ and compound 15a (with the shortest linker) possessed the most pronounced hypoglycemic effect—their blood glucose level being significantly lower than that of the control group, both before the administration of glucose and at all time points after the glucose load. For the remaining test substances, the effect was somewhat weaker, which is clearly visible from the AUC. In the reference drug group, metformin, the hypoglycemic effect was completely absent (Figure 5).

3.6. ITT

The results of the ITT, conducted to determine the ability of potential dual PPAR-α/γ agonists to increase tissue sensitivity to insulin, were generally consistent with the data obtained from both OGTTs. A pronounced insulin-sensitizing effect was observed in the TEZ and compound 15a groups, since at all time points of the experiment their blood glucose levels were significantly lower than those of the control group. In animals that were treated with metformin and all the other test substances, no increase in insulin sensitivity was observed (Figure 6).

3.7. Biochemical Blood Analysis

The analysis of the main biochemical parameters of the animals’ blood associated with lipid metabolism and liver functioning showed that the most active substances in the OGTT and ITT, TEZ and 15a had a significant decrease in the level of blood triglycerides and an increase in the alkaline phosphatase level in relation to the control group and the metformin group. Animals treated with TEZ additionally had increased levels of aspartate aminotransferase compared to the control group. Similar data on triglyceride concentration was obtained for the compound 15d, which, like TEZ, increased AST levels. In the remaining groups of studied compounds, changes in lipid metabolism and liver enzyme levels were not statistically significant (Table 1).

3.8. Mass of Animal Organs and Tissues

After sacrificing the mice at the end of the experiment, the masses of the liver, heart and adipose tissue (white gonadal fat, interscapular white and brown fat) were measured. As a result, a significant decrease in gonadal and interscapular fat mass was found only in the TEZ and 15a groups, which was consistent with a severe body weight loss in these groups. Also, these animals showed a significant increase in liver weight compared to the control group. In all other groups, there were no statistically significant differences relative to the control group in these parameters (Table 2).

3.9. Histology

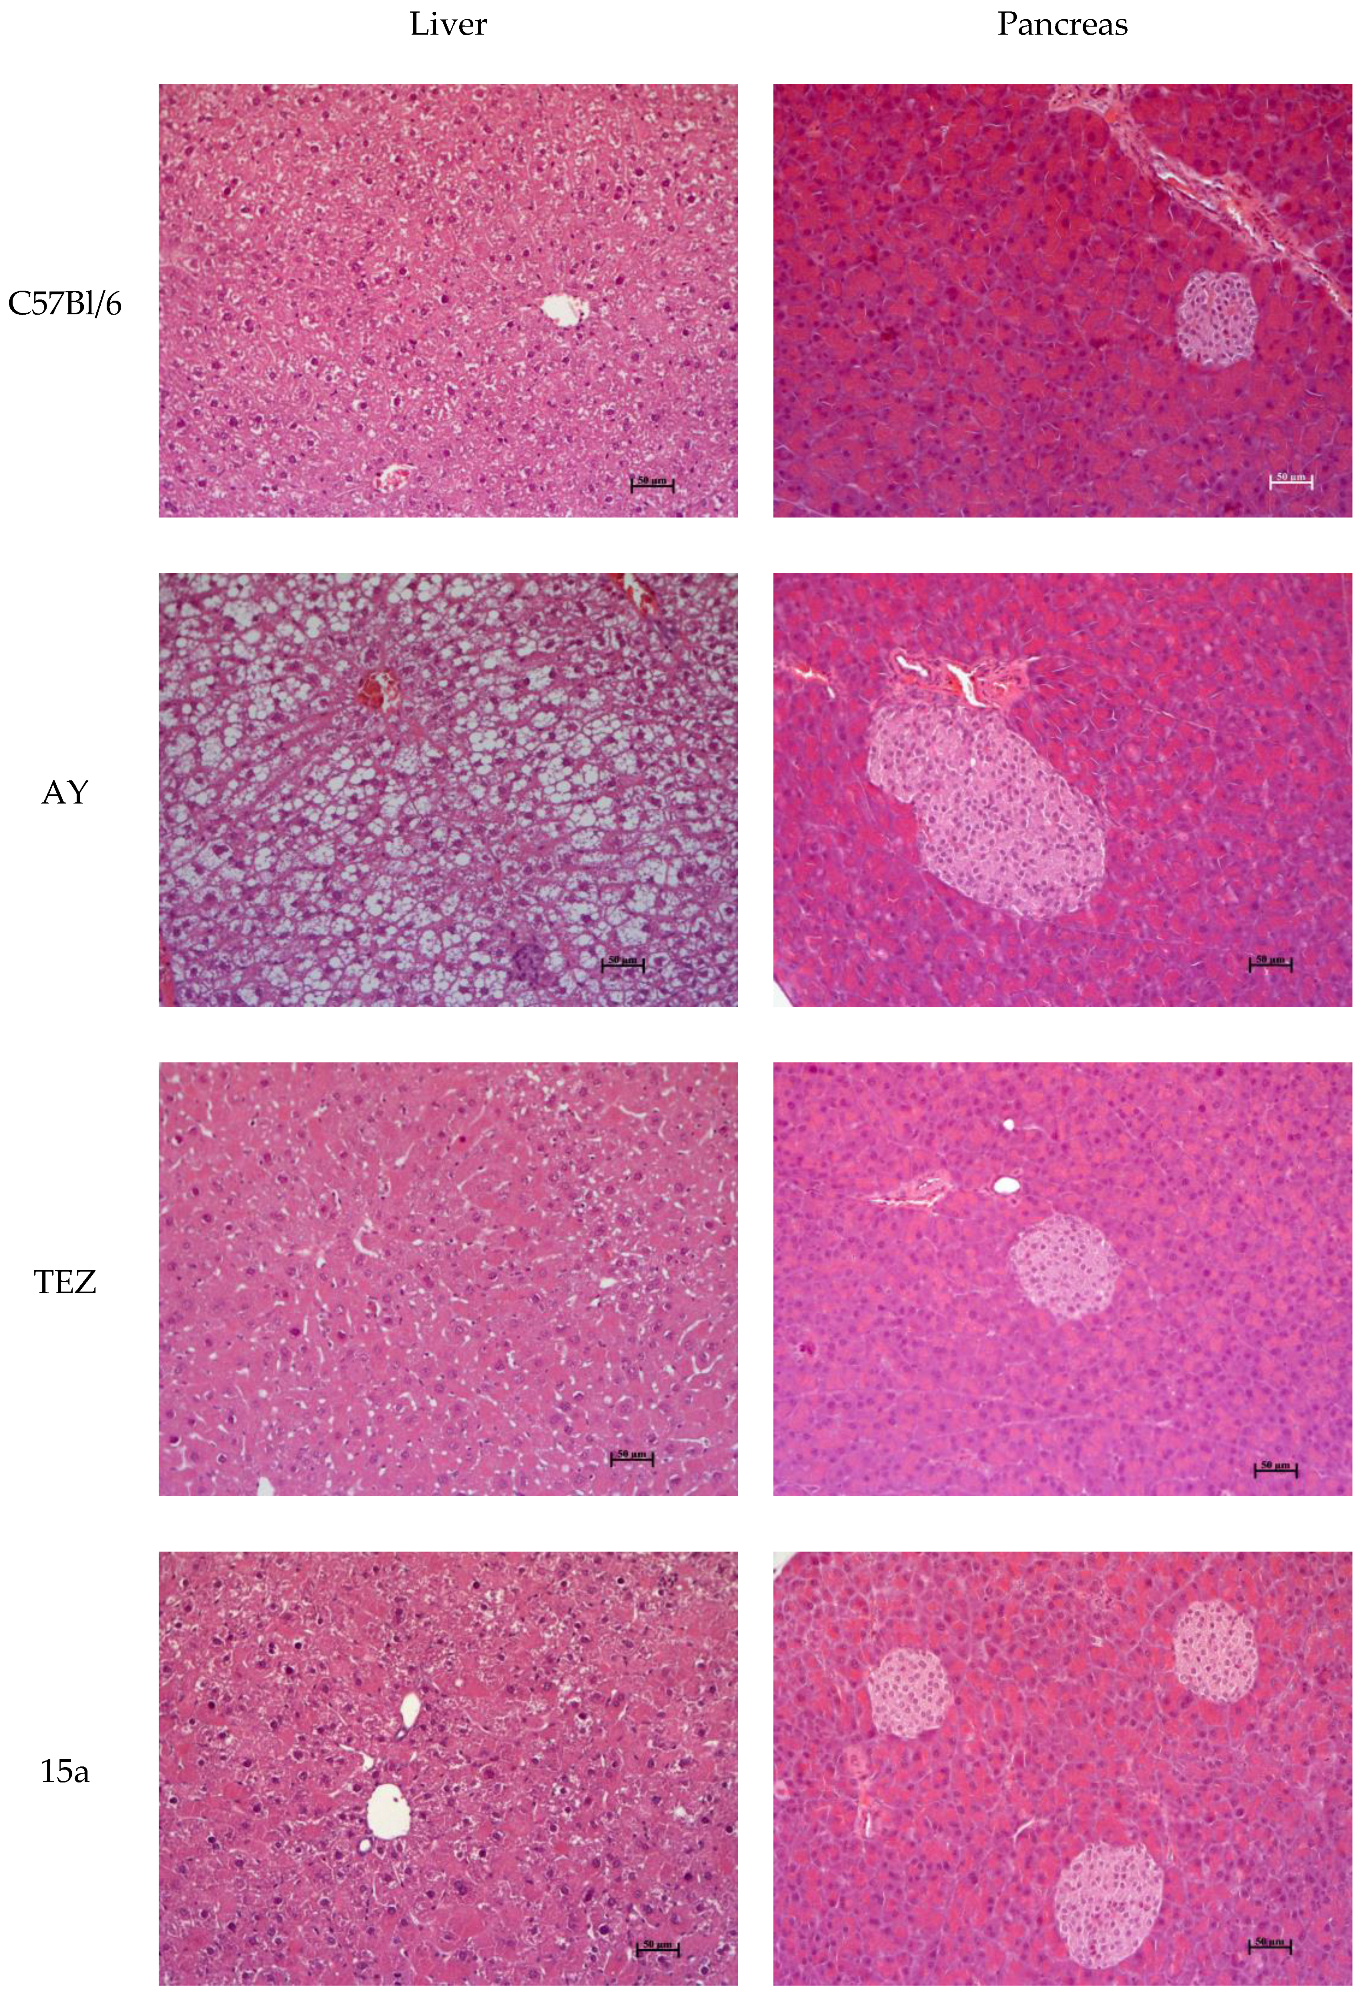
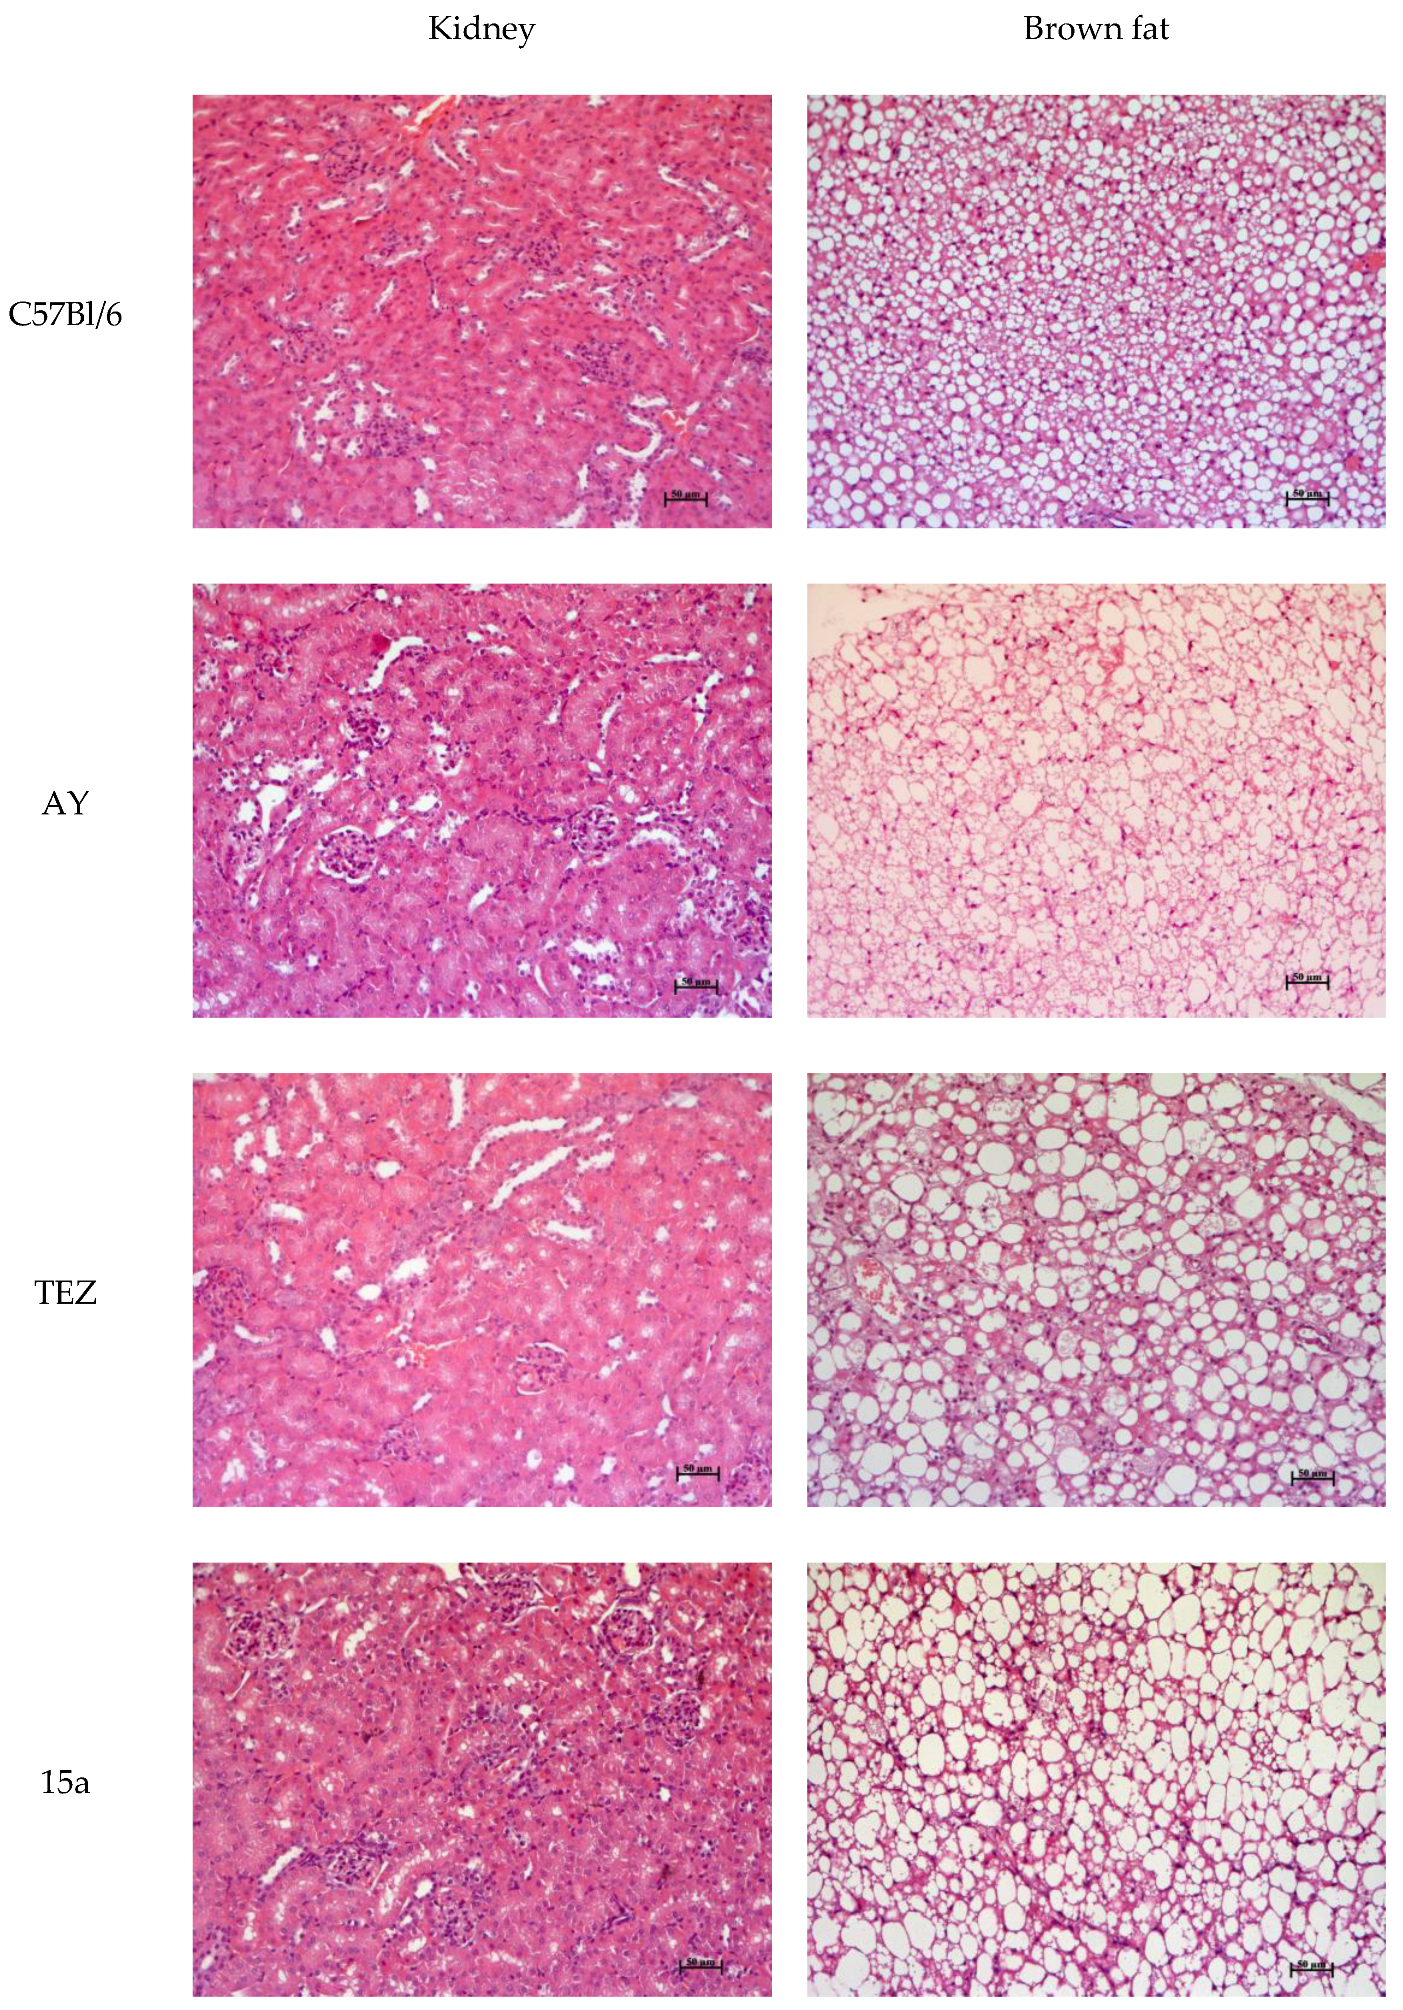
Histomorphological assessment of mouse organ sections after the end of the experiment revealed the development of fatty hepatosis in AY mice, which served as a negative control (Figure 7). Severe hyperplasia of the pancreatic islets, edema, and congestion of the interstitial tissue of the kidney were noted. Formation of fatty cysts in brown adipose tissue (Figure 8). The administration of metformin did not have a positive effect on the metabolic disorders’ dynamics in the studied organs.
Administration of TEZ significantly reduced the metabolic dysfunction in AY mice. Fatty liver degeneration was resolved, pancreatic islet hyperplasia was decreased. In adipocytes of brown adipose tissue compared to the control group, there was a decrease in the size of fat vacuoles and an increase in the area of connective tissue interlayers between cells. The lobular structure and blood flow in the adipose tissue was improved. However, in the liver and kidneys, the development of cytolytic processes characterized by necrotic and hemodynamic disorders was noted (Figure 7 and Figure 8). Changes in the studied organs in mice, receiving compound 15a, were similar to those from the TEZ group, with the exception of a better effect on the kidney—a decrease in edema and congestion of the interstitial tissue was found (Figure 7 and Figure 8). When examining sections of organs from mice from other experimental groups, it was not possible to detect differences from the control AY mice.

4. Discussion

In this work, we have developed an alternative technique and synthesized a series of dihydrobetulonic acid amides with the (S)-2-ethoxy-3-phenylpropanoic acid fragment differing in the amino-alcohol linker length. The synthetic route used for the preparation of the new dihydrobetulonic acid amides is presented in Scheme 1. The advantage of this methodology is that the addition of the aminoalcohol linker occurs at the last step, allowing both the linker and the natural fragment to be easily varied. The choice of the dihydrobetulonic fragment was based on the results obtained earlier [19].
This technique allows synthesizing in several stages a common fragment 11 for all target compounds [21,22]. The advantage of this method compared to the one described earlier in [19] is that the addition of dihydrobetulonic motive occurs at the last stage, which allows us to easily vary the length of the linker.
It was shown that the incorporation of the dihydrobetulonic acid fragment into the structure of (S)-2-ethoxy-3-(4-(4-hydroxyphenethoxy)phenyl)propanoic acid resulted in enhanced antidiabetic activity, while a decrease in the level of alkaline phosphatase, which high level is an indicator of hepatotoxicity, was also observed.
In the in vitro system, the synthesized substances activated PPARα and PPARγ receptors with varying degrees of severity. It was shown that 15b decreased luciferase activity in the case of PPARα and had no effect on PPARγ. On the contrary, 15d did not activate PPARα, but activated PPARγ. Compounds 15a and 15c activated both types of receptors, which allows them to be considered dual PPARα/γ agonists. In addition, it is worth noting that 15a and 15c, as well as tesaglitazar, had a more pronounced effect on PPARγ than on PPARα. This activity distribution is less preferable than the opposite, as it may increase the risk of unwanted side effects of the PPARγ activation [23].
After that, the pharmacological activity of the synthesized substances was studied in C57Bl/6 Ay/a mice. These mice demonstrate antagonism toward melanocortin receptors by the agouti protein, which is the result of the agouti gene (Ay/a) mutation. In mice, it causes yellow pigmentation, late-onset obesity, and hyperinsulinemia [24]. These metabolic changes make AY mice a convenient animal model for studying hypoglycemic effects and the related impact on lipid metabolism. The substances’ doses for daily administration to mice were chosen based on our previous experiments’ results [19,25]. Data obtained from measurements of food consumed by mice weekly indicate that consumption generally remained at the same level in all groups, except for the TEZ group, where a decrease in that parameter was observed. Thus, it can be stated that the decrease in weight of animals that were treated with 15a was not due to a decrease in the appetite of the animals, while such a relationship was observed in the TEZ group. A decrease in body weight in mice that received both TEZ and 15a may also occur due to PPAR-α activation, which, along with a decrease in WAT mass, was previously shown in various studies on rodents [26,27,28]. During the experiment, we performed two OGTTs and one ITT. These tests reliably showed that all synthesized substances had a hypoglycemic effect, but the most pronounced effect was observed in 15a—the substance with the shortest linker, and its effects were closest to the effect of TEZ. Thus, administration of 15a largely increased insulin sensitivity in mice, which is most likely mediated by activation of PPAR-γ, since this is the main mechanism of hypoglycemic action of PPAR-γ agonists from the Thiazolidinediones class [29]. It is worth noting that the second OGTT and ITT were carried out, respectively, 2 and 3 days after stopping the administration of the substances. So, in these tests, we assessed the cumulative effect of the test substances’ administration, since the development of the hypoglycemic effect upon activation of PPAR-α/γ requires time for transcription of multiple genes involved in lipid and glucose metabolism [29], and such an effect does not fade away quickly. Metformin has a different mechanism of action [30], and its effect can be achieved with a single dose [31], but it does not persist after its withdrawal.
At the end of the experiment, the animals’ organs and tissues weighing showed an increase in liver weight, and a decrease in the weight of all types of adipose tissue were found in mice treated with TEZ and 15a. Increased liver mass in animals, particularly rodents, and decreased fat mass are typical consequences of PPAR-α activation [32]. The activation of this nuclear receptor leads to the enhancement of peroxisomal and mitochondrial β-oxidation of fatty acids; however, the activation of mitochondrial β-oxidation plays the main role in lowering the level of free fatty acids and reducing the severity of hepatic steatosis [33]. This is also the reason for the decrease in triglyceride levels in the blood of mice. The observed increases in ALT and ALP levels in animals (most pronounced in mice from the TEZ and 15a group) are also most likely associated with the activation of metabolic pathways in the liver and a small amount of hepatocyte necrosis detected during the histomorphological examination. Such necrosis probably occurred due to liver cells being too active in the utilization of fatty acids, since AY mice had a very pronounced case of fatty hepatosis, whereas after 4 weeks of TEZ and 15a administration it almost completely disappeared. The condition of other organs in mice that are usually affected by T2DM—the pancreas and kidneys—also improved significantly after administration of TEZ and compound 15a. In the pancreas, the islets of Langerhans hypertrophy decreased, which also reflects the restoration of mouse tissue sensitivity to insulin and a decrease in its production [34], and in the kidneys, a decrease in dystrophic changes was also observed. Previously, we studied the hypoglycemic effect of 15a and its impact on the lipid profile at a similar dose in C57Bl/6 mice that were kept on a high-cholesterol diet [17]. In this work, its hypoglycemic effect was confirmed as well as its mechanism of action, and we assessed in more detail the impact of this substance on mice with T2DM. The effect on lipid metabolism turned out to be different; in the present experiment, the level of TG decreased and the level of total cholesterol in the blood did not decrease, whereas in the previous experiment it was the other way around. Most likely, the model itself plays a big role here, but it is the C57Bl/6 Ay/a mice that to a greater extent reflect the pathological changes characteristic of T2DM. It can also be concluded that the use of longer linkers reduces the antidiabetic activity of the synthesized dihydrobetulonic acid derivatives.

5. Conclusions

In order to search for new dual PPARα/γ agonists, we synthesized five compounds in which the pharmacophore part of the glitazars is connected to dihydrobetulonic acid, a well-known plant substance, through aminoalcohol linkers of different lengths—C2–C6. A study of their activity in vitro showed that two of them (15a and 15c) are dual agonists of PPARα and PPARγ at a concentration of 1 µM, two (15d and 15e) are only PPARγ agonists, and compound 15b did not activate any of the receptors studied. When conducting a study on mice with T2DM (C57Bl/6 Ay/a) for 4 weeks, the greatest antidiabetic effect was observed when 15a was administered at a dose of 30 mg/kg. In mice, carbohydrate metabolism was normalized, including insulin sensitivity, the concentration of TG in the blood decreased, and, most importantly, the damaged structure of the liver, pancreas and kidneys was restored. The introduction of substances with longer aliphatic linkers at a similar dose had a less pronounced effect on carbohydrate metabolism and did not lead to restoration of the structure of these organs. Yet, it is worth noting that compound 15a was not the most active in vitro.
The most active compound in vitro, 15d, showed a significantly less pronounced antidiabetic effect compared to 15a, which may very likely be a consequence of two factors. First, it may be due to the differences in PPARα/γ biology between rodents and humans (human PPARα/γ were used in the in vitro studies) and second, there could be some possible pharmacokinetic differences between the studied compounds. Nevertheless, all these assumptions are in need of further evaluation.

Supplementary Materials

The following supporting information can be downloaded at: https://www.mdpi.com/article/10.3390/scipharm92040065/s1, Figure S1: Maps of the plasmids with SB transposons pSB-CAG-hPPARa-neo (A); pSB-CAG-hPPARg-neo (B); pSB-CAG-hRXRa-higro. Figure S2: Transgenes hPPARA, hRXRa and hPPARG hRXRa are expressing in CHO-PPARa и CHO-PPARg cells respectively, but not in CHO-K1. OT-PCR analysis, DNA marker Step100 (100–1000 bp) (Biolabmix). Figure S3: Effect of Fenofibrat (FF, agonists PPARa) on the activity of the dual luciferase assay system (DLA) in parental CHO-K1 and transgenic CHO-PPARa (A); effect of Rosiglitasone (RG, agonist PPARg) in CHO-K1 and CHO-PPARg, Figure S4: Viability of CHO-K1 after treatment with experimental compound in 0,1 μM, 1 μM, 10 μM (0,1% DMSO, HBSS) determined by XTT-assay. Figure S5: (1S,3aS,5aR,5bR,7aR,11aR,11bR,13aR,13bR)-N-(4-hydroxybutyl)-1-isopropyl-5a,5b,8,8,11a-pentamethyl-9-oxoicosahydro-1H-cyclopenta[a]chrysene-3a-carboxamide, 13a 1H NMR spectrum. Figure S6: (1S,3aS,5aR,5bR,7aR,11aR,11bR,13aR,13bR)-N-(4-hydroxybutyl)-1-isopropyl-5a,5b,8,8,11a-pentamethyl-9-oxoicosahydro-1H-cyclopenta[a]chrysene-3a-carboxamide, 13a 13C NMR spectrum. Figure S7: (1S,3aS,5aR,5bR,7aR,11aR,11bR,13aR,13bR)-N-(3-hydroxypropyl)-1-isopropyl-5a,5b,8,8,11a-pentamethyl-9-oxoicosahydro-1H-cyclopenta[a]chrysene-3a-carboxamide, 13b 1H NMR spectrum. Figure S8: (1S,3aS,5aR,5bR,7aR,11aR,11bR,13aR,13bR)-N-(3-hydroxypropyl)-1-isopropyl-5a,5b,8,8,11a-pentamethyl-9-oxoicosahydro-1H-cyclopenta[a]chrysene-3a-carboxamide, 13b 13C NMR spectrum. Figure S9: (1S,3aS,5aR,5bR,7aR,11aR,11bR,13aR,13bR)-N-(4-hydroxybutyl)-1-isopropyl-5a,5b,8,8,11a-pentamethyl-9-oxoicosahydro-1H-cyclopenta[a]chrysene-3a-carboxamide, 13c 1H NMR spectrum. Figure S10: (1S,3aS,5aR,5bR,7aR,11aR,11bR,13aR,13bR)-N-(4-hydroxybutyl)-1-isopropyl-5a,5b,8,8,11a-pentamethyl-9-oxoicosahydro-1H-cyclopenta[a]chrysene-3a-carboxamide, 13c 1H NMR spectrum. Figure S11: (1S,3aS,5aR,5bR,7aR,11aR,11bR,13aR,13bR)-N-(5-hydroxypentyl)-1-isopropyl-5a,5b,8,8,11a-pentamethyl-9-oxoicosahydro-1H-cyclopenta[a]chrysene-3a-carboxamide, 13d 1H NMR spectrum. Figure S12: (1S,3aS,5aR,5bR,7aR,11aR,11bR,13aR,13bR)-N-(5-hydroxypentyl)-1-isopropyl-5a,5b,8,8,11a-pentamethyl-9-oxoicosahydro-1H-cyclopenta[a]chrysene-3a-carboxamide, 13d 13C NMR spectrum. Figure S13: (1S,3aS,5aR,5bR,7aR,11aR,11bR,13aR,13bR)-N-(6-hydroxyhexyl)-1-isopropyl-5a,5b,8,8,11a-pentamethyl-9-oxoicosahydro-1H-cyclopenta[a]chrysene-3a-carboxamide, 13e 1H NMR spectrum. Figure S14: (1S,3aS,5aR,5bR,7aR,11aR,11bR,13aR,13bR)-N-(6-hydroxyhexyl)-1-isopropyl-5a,5b,8,8,11a-pentamethyl-9-oxoicosahydro-1H-cyclopenta[a]chrysene-3a-carboxamide, 13e 13C NMR spectrum. Figure S15: (S)-ethyl 2-ethoxy-3-(4-(4-(3-((1S,3aS,5aR,5bR,7aR,11aR,11bR,13aR,13bR)-1-isopropyl-5a,5b,8,8,11a-pentamethyl-9-oxoicosahydro-1H-cyclopenta[a]chrysene-3a-carboxamido)propoxy)phenethoxy)phenyl)propanoate, 14b 1H NMR spectrum. Figure S16: (S)-ethyl 2-ethoxy-3-(4-(4-(3-((1S,3aS,5aR,5bR,7aR,11aR,11bR,13aR,13bR)-1-isopropyl-5a,5b,8,8,11a-pentamethyl-9-oxoicosahydro-1H-cyclopenta[a]chrysene-3a-carboxamido)propoxy)phenethoxy)phenyl)propanoate, 14b 13C NMR spectrum. Figure S17: (S)-ethyl 2-ethoxy-3-(4-(4-(4-((1S,3aS,5aR,5bR,7aR,11aR,11bR,13aR,13bR)-1-isopropyl-5a,5b,8,8,11a-pentamethyl-9-oxoicosahydro-1H-cyclopenta[a]chrysene-3a-carboxamido) butoxy)phenethoxy)phenyl)propanoate, 14c 1H NMR spectrum. Figure S18: (S)-ethyl 2-ethoxy-3-(4-(4-(4-((1S,3aS,5aR,5bR,7aR,11aR,11bR,13aR,13bR)-1-isopropyl-5a,5b,8,8,11a-pentamethyl-9-oxoicosahydro-1H-cyclopenta[a]chrysene-3a-carboxamido)butoxy)phenethoxy)phenyl)propanoate, 14c 13C NMR spectrum. Figure S19: (S)-ethyl 2-ethoxy-3-(4-(4-(5-((1S,3aS,5aR,5bR,7aR,11aR,11bR,13aR,13bR)-1-isopropyl-5a,5b,8,8,11a-pentamethyl-9-oxoicosahydro-1H-cyclopenta[a]chrysene-3a-carboxamido)pentoxy)phenethoxy)phenyl)propanoate, 14d 1H NMR spectrum. Figure S20: (S)-ethyl 2-ethoxy-3-(4-(4-(5-((1S,3aS,5aR,5bR,7aR,11aR,11bR,13aR,13bR)-1-isopropyl-5a,5b,8,8,11a-pentamethyl-9-oxoicosahydro-1H-cyclopenta[a]chrysene-3a-carboxamido)pentoxy)phenethoxy)phenyl)propanoate, 14d 13C NMR spectrum. Figure S21: (S)-ethyl 2-ethoxy-3-(4-(4-(6-((1S,3aS,5aR,5bR,7aR,11aR,11bR,13aR,13bR)-1-isopropyl-5a,5b,8,8,11a-pentamethyl-9-oxoicosahydro-1H-cyclopenta[a]chrysene-3a-carboxamido)hexoxy)phenethoxy)phenyl)propanoate, 14e 1H NMR spectrum. Figure S22: (S)-ethyl 2-ethoxy-3-(4-(4-(6-((1S,3aS,5aR,5bR,7aR,11aR,11bR,13aR,13bR)-1-isopropyl-5a,5b,8,8,11a-pentamethyl-9-oxoicosahydro-1H-cyclopenta[a]chrysene-3a-carboxamido)hexoxy)phenethoxy)phenyl)propanoate, 14e 13C NMR spectrum. Figure S23: (S)-2-ethoxy-3-(4-(4-(3-((1S,3aS,5aR,5bR,7aR,11aR,11bR,13aR,13bR)-1-isopropyl-5a,5b,8,8,11a-pentamethyl-9-oxoicosahydro-1H-cyclopenta[a]chrysene-3a-carboxamido)propoxy)phenethoxy)phenyl)propanoic acid, 15b 1H NMR spectrum. Figure S24: (S)-2-ethoxy-3-(4-(4-(3-((1S,3aS,5aR,5bR,7aR,11aR,11bR,13aR,13bR)-1-isopropyl-5a,5b,8,8,11a-pentamethyl-9-oxoicosahydro-1H-cyclopenta[a]chrysene-3a-carboxamido)propoxy)phenethoxy)phenyl)propanoic acid, 15b 13C NMR spectrum. Figure S25: (S)-2-ethoxy-3-(4-(4-(4-((1S,3aS,5aR,5bR,7aR,11aR,11bR,13aR,13bR)-1-isopropyl-5a,5b,8,8,11a-pentamethyl-9-oxoicosahydro-1H-cyclopenta[a]chrysene-3a-carboxamido)butoxy)phenethoxy)phenyl)propanoic acid, 15c 1H NMR spectrum. Figure S26: (S)-2-ethoxy-3-(4-(4-(4-((1S,3aS,5aR,5bR,7aR,11aR,11bR,13aR,13bR)-1-isopropyl-5a,5b,8,8,11a-pentamethyl-9-oxoicosahydro-1H-cyclopenta[a]chrysene-3a-carboxamido)butoxy)phenethoxy)phenyl)propanoic acid, 15c 13C NMR spectrum. Figure S27: (S)-2-ethoxy-3-(4-(4-(5-((1S,3aS,5aR,5bR,7aR,11aR,11bR,13aR,13bR)-1-isopropyl-5a,5b,8,8,11a-pentamethyl-9-oxoicosahydro-1H-cyclopenta[a]chrysene-3a-carboxamido)pentoxy)phenethoxy)phenyl)propanoic acid, 15d 1H NMR spectrum. Figure S28: (S)-2-ethoxy-3-(4-(4-(5-((1S,3aS,5aR,5bR,7aR,11aR,11bR,13aR,13bR)-1-isopropyl-5a,5b,8,8,11a-pentamethyl-9-oxoicosahydro-1H-cyclopenta[a]chrysene-3a-carboxamido)pentoxy)phenethoxy)phenyl)propanoic acid, 15d 13C NMR spectrum. Figure S29: (S)-2-ethoxy-3-(4-(4-(6-((1S,3aS,5aR,5bR,7aR,11aR,11bR,13aR,13bR)-1-isopropyl-5a,5b,8,8,11a-pentamethyl-9-oxoicosahydro-1H-cyclopenta[a]chrysene-3a-carboxamido)hexoxy)phenethoxy)phenyl)propanoic acid, 15e 1H NMR spectrum. Figure S30: (S)-2-ethoxy-3-(4-(4-(6-((1S,3aS,5aR,5bR,7aR,11aR,11bR,13aR,13bR)-1-isopropyl-5a,5b,8,8,11a-pentamethyl-9-oxoicosahydro-1H-cyclopenta[a]chrysene-3a-carboxamido)hexoxy)phenethoxy)phenyl)propanoic acid, 15e 13C NMR spectrum.

Author Contributions

Chemistry investigation, M.E.B. and V.V.F.; in vivo investigation: S.A.B., M.V.K., Y.V.M., S.V.N. and N.A.Z.; in vitro investigation: M.A.P. and S.V.P. under the supervision of S.P.M.; project administration and supervision: O.A.L., M.V.K. and S.V.P.; writing—M.E.B., S.A.B., M.V.K. and S.V.P.; writing—review and editing, O.A.L., M.V.K. and N.F.S. All authors have read and agreed to the published version of the manuscript.

Funding

This research was funded by the Russian Scientific Foundation project No. 24-25-00120.

Institutional Review Board Statement

The experiment protocol was approved by the Ethics Committee of N.N. Vorozhtsov Institute of Organic Chemistry SB RAS (protocol no. P-01-01.2024-14).

Informed Consent Statement

Not applicable.

Data Availability Statement

No new data were created or analyzed in this study. Data sharing is not applicable to this article.

Acknowledgments

The authors would like to acknowledge the Multi-Access Chemical Research Center SB RAS for spectral and analytical measurements. The authors would like to thank Diana Steuck for providing translation and proofreading of the article.

Conflicts of Interest

The authors declare no conflicts of interest.

References

  1. Artasensi, A.; Pedretti, A.; Vistoli, G.; Fumagalli, L. Type 2 Diabetes Mellitus: A Review of Multi-Target Drugs. Molecules 2020, 25, 1987. [Google Scholar] [CrossRef] [PubMed]
  2. Kalliora, C.; Drosatos, K. The Glitazars Paradox: Cardiotoxicity of the Metabolically Beneficial Dual PPARα and PPARγ Activation. J. Cardiovasc. Pharmacol. 2020, 76, 514–526. [Google Scholar] [CrossRef] [PubMed]
  3. Taylor, S.I.; Yazdi, Z.S.; Beitelshees, A.L. Pharmacological treatment of hyperglycemia in type 2 diabetes. J. Clin. Investig. 2021, 131, e142243. [Google Scholar] [CrossRef] [PubMed]
  4. Doumas, M.; Imprialos, K.; Stavropoulos, K.; Athyros, V.G. Pharmacological Management of Type 2 Diabetes Complications. Curr. Vasc. Pharmacol. 2020, 18, 101–103. [Google Scholar] [CrossRef]
  5. Takada, I.; Makishima, M. Peroxisome proliferator-activated receptor agonists and antagonists: A patent review (2014-present). Expert Opin. Ther. Pat. 2020, 30, 1–13. [Google Scholar] [CrossRef]
  6. Alnuaimi, S.; Reljic, T.; Abdulla, F.S.; Memon, H.; Al-Ali, S.; Smith, T.; Serdarevic, F.; Velija Asimi, Z.; Kumar, A.; Semiz, S. PPAR agonists as add-on treatment with metformin in management of type 2 diabetes: A systematic review and meta-analysis. Sci. Rep. 2024, 14, 8809. [Google Scholar] [CrossRef]
  7. Balachandran, K. Dual PPAR α/γ Agonists: Continuing Cardiac Concerns. Indian J. Endocrinol. Metab. 2019, 23, 586–587. [Google Scholar]
  8. Bhosle, D.; Bhosle, V.; Bobde, J.; Bhagat, A.; Shaikh, H.; Kadam, R. Study of Saroglitazar in Treatment Of Pre-diabetes with Dyslipidemia: STOP-D. J. Assoc. Physicians India 2018, 66, 14–17. [Google Scholar]
  9. Dutta, D.; Bhattacharya, S.; Surana, V.; Aggarwal, S.; Singla, R.; Khandelwal, D.; Sharma, M. Efficacy and safety of saroglitazar in managing hypertriglyceridemia in type-2 diabetes: A meta-analysis. Diabetes Metab. Syndr. Clin. Res. Rev. 2020, 14, 1759–1768. [Google Scholar] [CrossRef]
  10. Jain, N.; Bhansali, S.; Kurpad, A.; Hawkins, M.; Sharma, A.; Kaur, S.; Rastogi, A.; Bhansali, A. Effect of a Dual PPAR α/γ agonist on Insulin Sensitivity in Patients of Type 2 Diabetes with Hypertriglyceridemia- Randomized double-blind placebo-controlled trial. Sci. Rep. 2019, 9, 19017. [Google Scholar] [CrossRef]
  11. Ji, L.; Song, W.; Fang, H.; Li, W.; Geng, J.; Wang, Y.; Guo, L.; Cai, H.; Yang, T.; Li, H.; et al. Efficacy and safety of chiglitazar, a novel peroxisome proliferator-activated receptor pan-agonist, in patients with type 2 diabetes: A randomized, double-blind, placebo-controlled, phase 3 trial (CMAP). Sci. Bull. 2021, 66, 1571–1580. [Google Scholar] [CrossRef] [PubMed]
  12. Ning, Z.; Ai, G.; Chen, B.; Yao, H.; Cao, H.; Pan, D.; Lu, X. Impact of chiglitazar on glycemic control in type 2 diabetic patients with metabolic syndrome and insulin resistance: A pooled data analysis from two phase III trials. J. Diabetes 2024, 16, e13484. [Google Scholar] [CrossRef] [PubMed]
  13. Newman, D.J.; Cragg, G.M. Natural Products as Sources of New Drugs over the Nearly Four Decades from 01/1981 to 09/2019. J. Nat. Prod. 2020, 83, 770–803. [Google Scholar] [CrossRef] [PubMed]
  14. Al-Assaf, H. Hepatoprotective and antioxidant effect of corosolic acid on carbon tetrachloride induced hepatotoxicity. Afr. J. Pharm. Pharmacol. 2013, 7, 673–678. [Google Scholar] [CrossRef]
  15. Semenov, D.E.; Zhukova, N.A.; Ivanova, E.P.; Sorokina, I.V.; Baiev, D.S.; Nepomnyashchikh, G.I.; Tolstikova, T.G.; Biryukova, M.S. Hepatoprotective Properties of Betulonic Acid Amide and Heptral in Toxic Liver Injury Induced by Carbon Tetrachloride in Combination with Ethanol. Bull. Exp. Biol. Med. 2015, 158, 336–341. [Google Scholar] [CrossRef]
  16. Afrose, S.; Hossain, M.S.; Maki, T.; Tsujii, H. Karaya root saponin exerts a hypocholesterolemic response in rats fed a high-cholesterol diet. Nutr. Res. 2009, 29, 350–354. [Google Scholar] [CrossRef]
  17. Tai, M.M. A Mathematical Model for the Determination of Total Area Under Glucose Tolerance and Other Metabolic Curves. Diabetes Care 1994, 17, 152–154. [Google Scholar] [CrossRef]
  18. Wu, M.; Ye, W.; Zheng, Y.; Zhang, S. Oxamate Enhances the Anti-Inflammatory and Insulin-Sensitizing Effects of Metformin in Diabetic Mice. Pharmacology 2017, 100, 218–228. [Google Scholar] [CrossRef] [PubMed]
  19. Fomenko, V.; Blokhin, M.; Kuranov, S.; Khvostov, M.; Baev, D.; Borisova, M.S.; Luzina, O.; Tolstikova, T.G.; Salakhutdinov, N.F. Triterpenic Acid Amides as a Promising Agent for Treatment of Metabolic Syndrome. Sci. Pharm. 2021, 89, 4. [Google Scholar] [CrossRef]
  20. Kuranov, S.O.; Luzina, O.A.; Onopchenko, O.; Pishel, I.; Zozulya, S.; Gureev, M.; Salakhutdinov, N.F.; Krasavin, M. Exploring bulky natural and natural-like periphery in the design of p-(benzyloxy)phenylpropionic acid agonists of free fatty acid receptor 1 (GPR40). Bioorg. Chem. 2020, 99, 103830. [Google Scholar] [CrossRef]
  21. Günther, A.; Makuch, E.; Nowak, A.; Duchnik, W.; Kucharski, Ł.; Pełech, R.; Klimowicz, A. Enhancement of the Antioxidant and Skin Permeation Properties of Betulin and Its Derivatives. Molecules 2021, 26, 3435. [Google Scholar] [CrossRef] [PubMed]
  22. Astrazeneca. Process for The Preparation of 2-Ethoxy-3-[4-(2-(Methanesulphonyloxyphenyl)-Ethoxy) Phenil] Propanoic Acid. WO2003082812A2, 9 October 2023.
  23. Tan, C.K.; Zhuang, Y.; Wahli, W. Synthetic and natural Peroxisome Proliferator-Activated Receptor (PPAR) agonists as candidates for the therapy of the metabolic syndrome. Expert Opin. Ther. Targets 2017, 21, 333–348. [Google Scholar] [CrossRef] [PubMed]
  24. Qi, Y.; Takahashi, N.; Hileman, S.M.; Patel, H.R.; Berg, A.H.; Pajvani, U.B.; Scherer, P.E.; Ahima, R.S. Adiponectin acts in the brain to decrease body weight. Nat. Med. 2004, 10, 524–529. [Google Scholar] [CrossRef] [PubMed]
  25. Blokhin, M.E.; Kuranov, S.O.; Khvostov, M.V.; Fomenko, V.V.; Luzina, O.A.; Zhukova, N.A.; Elhajjar, C.; Tolstikova, T.G.; Salakhutdinov, N.F. Terpene-Containing Analogues of Glitazars as Potential Therapeutic Agents for Metabolic Syndrome. Curr. Issues Mol. Biol. 2023, 45, 2230–2247. [Google Scholar] [CrossRef] [PubMed]
  26. Chira, E.C.; McMillen, T.S.; Wang, S.; Haw, A.; O’Brien, K.D.; Wight, T.N.; Chait, A. Tesaglitazar, a dual peroxisome proliferator-activated receptor alpha/gamma agonist, reduces atherosclerosis in female low-density lipoprotein receptor deficient mice. Atherosclerosis 2007, 195, 100–109. [Google Scholar] [CrossRef]
  27. Chaput, E.; Saladin, R.; Silvestre, M.; Edgar, A.D. Fenofibrate and Rosiglitazone Lower Serum Triglycerides with Opposing Effects on Body Weight. Biochem. Biophys. Res. Commun. 2000, 271, 445–450. [Google Scholar] [CrossRef] [PubMed]
  28. Fu, T.; Kashireddy, P.; Borensztajn, J. The peroxisome-proliferator-activated receptor alpha agonist ciprofibrate severely aggravates hypercholesterolaemia and accelerates the development of atherosclerosis in mice lacking apolipoprotein E. Biochem. J. 2003, 373(Pt 3), 941–947. [Google Scholar] [CrossRef]
  29. Tyagi, S.; Gupta, P.; Saini, A.; Kaushal, C.; Sharma, S. The peroxisome proliferator-activated receptor: A family of nuclear receptors role in various diseases. J. Adv. Pharm. Technol. Res. 2011, 2, 236–240. [Google Scholar] [CrossRef]
  30. Foretz, M.; Guigas, B.; Viollet, B. Metformin: Update on mechanisms of action and repurposing potential. Nat. Rev. Endocrinol. 2023, 19, 460–476. [Google Scholar] [CrossRef]
  31. Horakova, O.; Kroupova, P.; Bardova, K.; Buresova, J.; Janovska, P.; Kopecky, J.; Rossmeisl, M. Metformin acutely lowers blood glucose levels by inhibition of intestinal glucose transport. Sci. Rep. 2019, 9, 6156. [Google Scholar] [CrossRef]
  32. Meyer, K.; Völkl, A.; Endele, R.; Kühnle, H.F.; Pill, J. Species differences in induction of hepatic enzymes by BM 17.0744, an activator of peroxisome proliferator-activated receptor alpha (PPARα). Arch. Toxicol. 1999, 73, 440–450. [Google Scholar] [CrossRef] [PubMed]
  33. Yao, H.; Wang, Y.; Zhang, X.; Li, P.; Shang, L.; Chen, X.; Zeng, J. Targeting peroxisomal fatty acid oxidation improves hepatic steatosis and insulin resistance in obese mice. J. Biol. Chem. 2023, 299, 102845. [Google Scholar] [CrossRef] [PubMed]
  34. Weir, G.C.; Laybutt, D.R.; Kaneto, H.; Bonner-Weir, S.; Sharma, A. Beta-cell adaptation and decompensation during the progression of diabetes. Diabetes 2001, 50, S154–S159. [Google Scholar] [CrossRef] [PubMed]
Figure 1. The chemical structure of known glitazars.
Scipharm 92 00065 g001
Figure 2. Luciferase assay of compounds 15a–15e and tezaglitazar (TEZ) in CHO-PPARAα (A) and CHO-PPARγ (B) (all compounds were in 1 µM); * Indicates a statistically significant difference (p ≤ 0.05) compared to control (0.1% DMSO). Statistical analysis was performed by one-way ANOVA followed by the Dunnett’s multiple comparisons test.
Scipharm 92 00065 g002
Figure 3. Dynamics of changes in body weight (a) and food consumption (b) in mice during the experiment. Group size n = 7. * p ≤ 0.05 compared to the AY group. Statistical analysis was performed by one-way ANOVA followed by the Dunnett’s multiple comparisons test.
Scipharm 92 00065 g003
Figure 4. OGTT Results after two weeks of the experiment. All test substances were administered 30 min before the glucose load. (a) Glycemic curves, (b) Area under glycemic curves (AUC). Group size n = 7. * p ≤ 0.05 compared to the AY group. Statistical analysis was performed by one-way ANOVA followed by the Dunnett’s multiple comparisons test.
Scipharm 92 00065 g004
Figure 5. OGTT results two days after cancelation of a four-week administration of substances. (a) Glycemic curves, (b) Area under glycemic curves (AUC). Group size n = 7. * p ≤ 0.05 compared to the AY group. Statistical analysis was performed by one-way ANOVA followed by the Dunnett’s multiple comparisons test.
Scipharm 92 00065 g005
Figure 6. ITT results. The test was carried out 3 days after 4 weeks of daily substance administration. Group size n = 7. * p ≤ 0.05 compared to the AY group. Statistical analysis was performed by one-way ANOVA followed by the Dunnett’s multiple comparisons test.
Scipharm 92 00065 g006
Figure 7. Histological evaluation of liver and pancreas in mice after 4 weeks of the experiment. Hematoxylin and eosin staining. ×200. The presented images are representative for n = 3 repeats of the histological analysis for each organ of each animal.
Scipharm 92 00065 g007
Figure 8. Histological evaluation of the kidney and brown fat in mice after 4 weeks of the experiment. Hematoxylin and eosin staining. ×200. The presented images are representative for n = 3 repeats of the histological analysis for each organ of each animal.
Scipharm 92 00065 g008
Scheme 1. Synthesis of new dihydrobetulonic acid amide derivatives with amino alcohol linkers from C2 to C6.
Scipharm 92 00065 sch001
Table 1. Biochemical blood parameters after the end of the substances’ administration. TC—total cholesterol, TG—triglycerides, ALT—alanine aminotransferase, AST—aspartate aminotransferase, ALP—alkaline phosphatase. Group size n = 7. * p < 0.05 as compared to the AY group. Statistical analysis was performed by one-way ANOVA followed by the Dunnett’s multiple comparisons test.
GroupTC, mmol/LTG, mmol/LALT,
U/L
AST,
U/L
ALP,
U/L
C57Bl/63.88 ± 0.031.32 ± 0.0513.10 ± 1.5526.19 ± 3.6668.37 ± 10.03
AY3.87 ± 0.031.39 ± 0.0614.55 ± 2.9427.36 ± 5.7579.50 ± 13.55
MF3.95 ± 0.041.43 ± 0.065.24 ± 1.10 *41.32 ± 6.68121.70 ± 17.61
TEZ3.85 ± 0.021.12 ± 0.03 *20.52 ± 3.1458.06 ± 9.00 *383.92 ± 74.95 *
15a3.88 ± 0.031.19 ± 0.04 *16.59 ± 2.7750.63 ± 9.14264.28 ± 29.62 *
15d3.83 ± 0.021.32 ± 0.0420.20 ± 3.0750.63 ± 8.46165.81 ± 16.56 *
15c3.80 ± 0.011.27 ± 0.0224.44 ± 3.4747.64 ± 7.25130.37 ± 20.19
15b3.81 ± 0.021.20 ± 0.02 *21.24 ± 2.4949.47 ± 5.27 *135.55 ± 13.65 *
15e3.89 ± 0.041.41 ± 0.0519.79 ± 2.8036.67 ± 7.42143.36 ± 19.56 *
Table 2. Body, liver, and adipose tissue weight of animals. Group size n = 7. * p ≤ 0.05 compared to the AY group. Statistical analysis was performed by one-way ANOVA followed by the Dunnett’s multiple comparisons test.
Body Mass,
g.
Liver Mass,
g.
Gonadal
Fat Mass, g.
Interscapular
Fat Mass, g.
Interscapular
Brown Fat
Mass, g.
C57Bl/626.2 ± 0.361.31 ± 0.040.3 ± 0.03-0.17 ± 0.011
AY41.1 ± 0.401.76 ± 0.102.1 ± 0.200.94 ± 0.080.31 ± 0.03
MF40.3 ± 1.451.59 ± 0.042.4 ± 0.141.15 ± 0.070.26 ± 0.029
TEZ26.0 ± 0.77 *2.58 ± 0.22 *0.4 ± 0.07 *0.44 ± 0.08 *0.22 ± 0.006 *
15a31.5 ± 0.84 *2.14 ± 0.11 *1.2 ± 0.09 *0.64 ± 0.03 *0.20 ± 0.026 *
15d40.3 ±1.072.08 ± 0.132.2 ± 0.121.04 ± 0.070.36 ± 0.074
15c42.2 ± 1.362.11 ± 0.222.4 ± 0.151.11 ± 0.080.32 ± 0.034
15b43.6 ± 1.772.19 ± 0.212.3 ± 0.171.16 ± 0.080.30 ± 0.051
15e41.7 ± 0.502.00 ±0.092.3 ± 0.181.05 ± 0.150.30 ± 0.032
Disclaimer/Publisher’s Note: The statements, opinions and data contained in all publications are solely those of the individual author(s) and contributor(s) and not of MDPI and/or the editor(s). MDPI and/or the editor(s) disclaim responsibility for any injury to people or property resulting from any ideas, methods, instructions or products referred to in the content.