1. Introduction
Lack of access to affordable drugs continues to represent a major global health issue [
1,
2]. Medicines that contain plant extracts are essential as a remedy for the treatment of different human diseases [
3]. Such dosage forms are in high demand because of their wide biological action, higher safety in comparison with synthetic drugs, and lesser costs [
4,
5]. Nowadays, the effectiveness of plant preparation is widely discussed, but in some cases, their activity and safety are confirmed by clinical trials.
Among plant medicines with proven effectiveness, ivy leaf (
Hedera Helix L.) preparations are widely used to treat acute upper respiratory tract infections and the cough associated with a cold and are also applied for the symptomatic treatment of acute and chronic inflammatory bronchial disorders accompanied by cough and sputum in adults and children, due to their spasmolytic, bronchodilatory, mucolytic, and expectorant action [
6,
7,
8,
9]. Data about the results of clinical trials for ivy leaves and acute respiratory tract diseases [
10] and inflammatory bronchial diseases [
8] are described.
Hedera helix leaves, extracts, and preparation for oral use are marked as amended (well-established use) on the basis of Article 10a of Directive 2001/83/EC [
11].
This is why in the world’s pharmaceutical market today, there are many preparations in different dosage forms (syrup, drops, sachet, soluble tablets), also some manufacturers decide to produce novel medicines of ivy leaf extract.
According to literature sources, triterpene saponins were revealed to be responsible for the therapeutic effects of ivy leaves [
7,
12,
13]. The main active triterpene saponins are hederacoside C and α-hederine [
14,
15]. Some of studies showed that mainly α-hederine was responsible for the pharmacological activity of
Hedera folium by increasing the β
2–adrenergic responsiveness in alveolar type II (A549) cells and human airway smooth muscle (HASM) cells [
15,
16].
However, the European Pharmacopoeia proposes hederacoside C as an indicator of the quality of ivy leaf, thus, this substance should be used for the standardization of its extracts and their pharmaceutics. Hederacoside C ((3-[{2-
O-(α-
l-rhamnopyranosyl)-α-
l-arabinopyranosyl} oxy]-23-hydroxyolean-12-en-28-oic acid 6-
O-{4-
O-(α-
l-rhamnopyranosyl)-β-
d-glucopyranosyl}-β-
d-glucopyranosyl ester (structure formula is given in
Figure 1 ) is a major active saponin and biomarker of
Hedera helix L. [
13], therefore, this substance should be quantitatively measured to prove the quality of ivy leaf extracts and its products.
One of the main steps of the pharmaceutical development of medicines is the choice of methods for quality control. The decision about this is connected to different factors. The correctness of the method must be confirmed by validation. Furthermore, manufacturers take into account different economic factors. It is a well-known fact that raw substance or active pharmaceutical ingredients are generally the most significant components of the pharmaceutical cost of production [
17].
Additionally, applying modern methods for quality control, such as chromatographic methods, is expensive. Their usage requires costly equipment, the use of a large number of solvents of chromatographic grade, standards, and highly qualified personnel. Moreover, usually the great number of different batches must be analyzed. In the case of plant medicines, as a rule, only chromatography allows us to identify and evaluate the number of individual markers. Thus, the estimation of cost-effectiveness of quality control methods should be also reviewed from an economic point of view.
The concepts of green chemistry [
18] are powerful tools to provide a framework for operations and actions to make chemical processes more environmentally benign. Such actions require the usage of safer, less toxic, more benign solvents [
19], lowering energy consumption [
20], and a preference for reagents and substances based on renewable sources [
21]. In short, the main purposes and requests of green chemistry are to decrease environmental pollution, and safety risks for human health by increasing the number of greenish reagents, decreasing steps in analytical methodology, and lowering resource use.
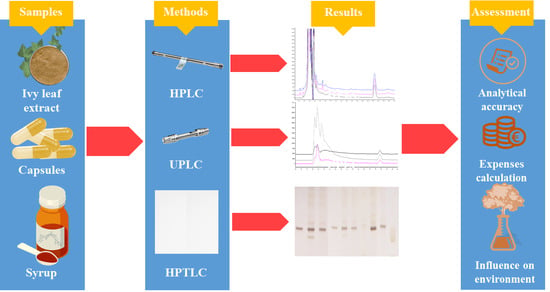
The aim of this study is to develop and validate different chromatographic methods (HPLC, UPLC, and HPTLC) for the assessment of the hederacoside C amount for the standardization of ivy leaf extracts and their original dosage forms, such as capsules and syrup, and choose among them a less costly, more effective, and green technology.
2. Materials and Methods
2.1. Chemicals, Reagents, and Instrumentation
Hederacoside C analytical standard was purchased from Sigma-Aldrich GmbH (Steinheim, Germany). All solvents were of HPLC grade acetonitrile and methanol were purchased from Honeywell GmbH (Offenbach, Germany), sulfuric acid, acetone, and ethyl acetate were from Sigma- GmbH (Steinheim, Germany), ethanol was from Merck (Darmstadt, Germany), and the water was obtained using a Mili-Q purification system (Millipore, Burlington, MA, USA). Agilent Bond Elut C18 (500 mg, 6mL) was selected for the SPE procedure.
2.2. Instrument
Liquid chromatography separation was performed using a Shimadzu Nexera X2 LC-30AD HPLC system (Shimadzu, Tokyo, Japan) composed of a quaternary pump, an on-line degasser, a column temperature controller, an SIL-30AC autosampler (Shimadzu, Tokyo, Japan), a CTO-20AC thermostat (Shimadzu, Tokyo, Japan), as well as a SPD-M20A diode array detector (DAD). Other instruments such as the Ultrasonic Cleaner Set for ultra-sonication using (Wise Clean WUC-A06H, Witeg Labortechnik GmbH, Wertheim, Germany), Libra UniBloc AUW120D (Shimadzu Analytical Scale, Tokyo, Japan), and class “A” analytical vassals that meet the requirements of the SPhU (SPhU, 2015) were used in the investigation. The HPTLC method was carried out on the CAMAG Linomat 5 sample applicator with a 100 µL syringe, the examination of the plate was made with CAMAG TLC Visualiser 2. System and was operated by winCATS software.
2.3. Methods (Chromatographic Conditions, Standard and Sample Preparation)
2.3.1. Chromatographic Conditions for HPLC Analysis
The separation of components was done with RP-column ACE C18 (150 mm × 4.6 mm, 5.0 μm; Aberdeen, Scotland, UK). The composition of the mobile phase was water and acetonitrile in the ratio of 71:29, respectively. The analysis was performed at a flow rate of 0.5 mL/min. The detection was monitored at the wavelength of 210 nm, the column temperature was set at 40 °C, and 10 µL were injected into the chromatographic system. The mobile phase, all samples, and standards injected were filtered through a 0.45 µm membrane filter.
2.3.2. Chromatographic Conditions for UPLC Analysis
Analysis was performed with the ACQUITY UPLC BEH C18 column (50 mm × 2.1 mm, 1.7 μm; Waters, Milford, MA, USA), the mixture of water and acetonitrile in the ratio (71:29 respectively) was used as a mobile phase at a flow rate of 0.05 mL/min. The wavelength was set at 210 nm, the temperature of the column was 40 °C. The volume of injection was 1 µL. The mobile phase, all samples, and standards were filtered through a 0.45 µm membrane filter.
2.3.3. Chromatographic Conditions for HPTLC
The method was optimized on stationary phase pre-coated silica gel 60 F254 glass sheets (10 × 10 cm), with a mobile phase of anhydrous formic acid/acetone/methanol/ethyl acetate (4:20:20:30 v/v). The standard and test solutions were spotted in the form of bands of 5 mm width, the volume of injection was set at 8 µL. The study was carried out in a 20 × 20 cm twin trough glass chamber. The chromatographic chamber was allowed to saturate for about 30 min and the migration distance allowed was 80 mm. The detection of hederacoside C was performed after being sprayed with a 20% sulfuric acid in ethanol solution after the plate was heated at 105 °C and examined in daylight.
2.3.4. Standard Preparation for HPLC and UPLC Methods
The concentration of the standard solution was 60 µm/mL of hederacoside C. Approximately 6 mg of hederacoside C of analytical standard were accurately weighed into 100 mL volumetric flasks, 10 mL of methanol were added, and then it was sonicated for 15 min at room temperature in an ultrasonic bath to dissolve hederacoside C. After cooling to room temperature, the volume was filled up to the mark with water.
2.3.5. Standard Preparation for HPTLC Method
The final concentration of hederacoside C in methanol was 1 mg/mL.
2.4. Preparations of Samples for HPLC and UPLC Methods
2.4.1. Extract of Ivy Leaf
Accurately weighted extract (about 28 mg) was placed into the volumetric flask with a volume of 100 mL, 10 mL of methanol were added, and the mixture was sonicated for 15 min at room temperature in an ultrasonic bath. After cooling, the volume was filled up with water.
2.4.2. Capsules
Accurately weighted capsules of powder (about 280 mg) were placed into the volumetric flask with a volume of 250 mL, 20 mL of methanol were added, and the mixture was sonicated for 15 min at room temperature in an ultrasonic bath. After cooling, the volume was filled up with water.
2.4.3. Placebo Preparation of Capsules
Accurately weighted capsules of placebo (about 280 mg) were placed into the volumetric flask with volume 250 mL, 20 mL of methanol were added, and the mixture was sonicated for 15 min at room temperature in an ultrasonic bath. After cooling, the volume was filled up with water.
2.4.4. Sample Preparation of Syrup
Five milliliters of syrup were weighted in a 50 mL volumetric flask, 80% of the volume was filled with water, sonicated for 10 min to homogenize the solution in an ultrasonic bath, and then cooled to room temperature, and the flask was filled up to the mark with the same solvent.
2.4.5. Placebo Preparation of Syrup
Five milliliters of placebo (containing all syrup matrix components, ivy leaf extract) were weighted and added to a 50 mL volumetric flask along with about 40 mL of water, sonicated for 10 min, and filled to the mark with the same solution.
2.4.6. Solid-Phase Extraction Procedure for Analysis of Syrup by UPLC Method
The SPE cartridge conditioning was performed with 6 mL of methanol. Column equilibration should be reached by washing the cartridge with 12 mL of water. After that, the 5 mL of sample solution was applied to the cartridge and washed with 6 mL of water. The column was dried under full vacuum for 5 min. Then, the analyte was eluted by 4 mL of a mixture of water: acetonitrile in the ratio of 60:40, the sample was received into a 5 mL flask and diluted with the water.
2.5. Sample Preparation for HPTLC Analysis
2.5.1. Extract of Ivy Leaf
Accurately weighted extract (about 50 mg) was placed into the volumetric flask with volume 20 mL, 15 mL of methanol were added, and the mixture was sonicated for 15 min at room temperature in an ultrasonic bath. After cooling, the volume was filled up with the same solvent.
2.5.2. Capsules
Accurately weighted capsules of powder (about 300 mg) were placed into the volumetric flask with a volume of 20 mL, 15 mL of methanol were added, and the mixture was sonicated for 15 min at room temperature in an ultrasonic bath. After cooling, the volume was filled up with the same solvent.
2.5.3. Placebo Preparation of Capsules
Accurately weighted capsules of placebo (about 280 mg) were placed into the volumetric flask with a volume of 20 mL, 15 mL of methanol were added, and the mixture was sonicated for 15 min at room temperature in an ultrasonic bath. After cooling, the volume was filled up with methanol.
2.5.4. Sample Preparation of Syrup
Two milliliters of syrup were weighted in 5 mL volumetric flask, 2 mL of water was added, sonicated for 10 min to homogenize the solution in an ultrasonic bath, and then cooled to room temperature, and the flask was filled up to the mark with the same solvent.
2.5.5. Placebo Preparation of Syrup
Five milliliters of placebo (containing all syrup matrix components, (except ivy leaf extract) was weighted and added to 5 mL volumetric flask along with about 2 mL of water, sonicated for 10 min, and filled up to the mark with the same solution.
2.5.6. Solid-Phase Extraction
The SPE cartridge conditioning was performed with 6 mL of methanol. The column equilibration should be reached by washing the cartridge with 12 mL of water. After that, the 5 mL of sample solution was applied to the cartridge and washed with 6 mL of water. The column was dried under full vacuum for 5 min. Then, the analyte was eluted by 4 mL of a methanol solution into a 5 mL volumetric flask and filled up with the same solution.
2.6. Economical Estimation of Developed Methods
We conducted an analysis of national legislation to calculate the cost of analytical research for the methods of analysis (HPLC, UPLC, HPTLC) [
22]. According to the accounting regulations’ standards, the costs included are: direct labor costs, other direct costs, variable overhead, and fixed overhead. [
23]. Other expenses include the intra-factory movement of materials, semi-finished products, tools from warehouses to workshops, and finished products to warehouses and a lack of work in progress, payment for downtime, and so forth. The depreciation of fixed assets is a part of the overhead costs. It should be noted that the list and composition of items of cost products (works, services) are established by the enterprise independently. Therefore, taking into account the provisions of national legislation on determining the cost of products (works, services) and the specificity of analytical research, we have formed the following cost items: basic raw materials, auxiliary materials, electricity, transport and procurement costs, wages, social security payments, fixed assets, recycling [
24,
25].
The calculations were made taking into account the time of analytical investigation for each method, namely HPLC analysis-20 min, UPLC-10 min, HPTLC-10 min, and the cost of the calculations are presented in Euro. The conversion was carried out according to the rate of the National Bank of Ukraine on 13 September, 2019, 1 Euro = 27.22 UAH [
26].
2.7. Assessment of Analytical Methods Impact on Environmental
The influence of the analytical methods on environmental depends on its analytical procedure parameters, such as the amount of reagents, hazards, energy, and waste [
27]. The comparison of methods was performed using Eco-scale, where the ideal green analysis has a value of 100. If some parameter of the method departs from the principles of the ideal green analysis, penalty points are assigned. The sum of the penalty points received after revision should be used for the Eco-scale calculation, according to the following formula:
The results of an investigation can be ranked in the following matter:
>75 represents excellent green analysis;
>50 represents acceptable green analysis;
<50 represents unacceptable green analysis.
The Globally Harmonized System of Classification and Labeling of Chemicals provides full information about the determination of the safety class of the reagent on the basis of physical, environmental, and health hazards [
28]. For simplicity, some papers [
29] propose a calculation of penalty points for each reagent by multiplying the number of Globally Harmonized System (GHS) hazard pictograms by a degree of hazard (for the mark “warning” multiplication by 1 and for “danger”-2).
Penalty points for energy are assigned according to energy-consuming laboratory practices and instruments [
30]. Thus, the least energy consuming methods (<0.1kWh per sample) are immunoassays, titration, UV-Vis spectrophotometer, UPLC, HPTLC, and other techniques which require more energy usage (≤1.5 kWh per sample) such as LC or GC. The most energy-consuming (>1.5 kWh per sample) are NMR, GC-MS, LC-MS, X-ray diffraction.
Furthermore, penalty points are assigned for occupational hazards and the generation of wastes.
3. Results and Discussions
3.1. Method Development
Besides the pharmacopeia method, there are various methods for the determination of hederacoside C, they include HPLC with a DAD detector for leaves [
31], extract [
32], some dosage forms [
33], and LC-MS for rat plasma [
34,
35].
Although all above-mentioned papers are well-reported and contain validated data and practical applications, some of them focus on the development and validation of methods for analyzing bio-analytical samples using mass-spectrometry, and those methods cannot be used for the routine control of dosage forms. Other developed methods propose using a DAD detector.
Since the saponins lack chromophore groups in their structure, therefore, it is required to use a wavelength of about 210 nm for increasing sensitivity.
In that range, lower selectivity is observed because each substance with the chromophore group would be detected at such wavelengths. Various dosage forms with the extract of ivy leaf are widely used, among them tablets, drops, capsules, and syrups. Due to such a diversity of components, the developed method should be specific enough to provide accurate results and provide good separation between excipients and hederacoside C as a marker of ivy leaf extract.
Some of the analytical methods [
32,
33,
34,
36] propose to use a gradient elution for obtaining higher specificity, as a result of a better separation of substances. Such a decision is not fine enough because of the increased time of analysis. In gradient elution HPLC, the analysis time is determined by the sum of the time required for the separation and the time required to re-equilibrate the column to the initial eluent to prepare it for the next sample run.
Furthermore, the UPLC method was applied to reduce the time and cost of analysis and at the same time provide the selectivity, sensitivity, and accuracy for analytes and related products.
Furthermore, High-Performance Thin Layer Chromatography (HPTLC) is a useful analytical method suitable for the identification and quantification of different components. Such a procedure promotes some benefits over HPLC, among them are the shorter analysis time, lower amounts of the mobile phase, minimization of interference from previous analysis, and samples, as well as standards, which can be processed simultaneously under the same condition and provide better analytical accuracy and precision. [
37].
The present investigation reports that the HPLC, UPLC, HPTLC methods for the quantitative analysis of hederacoside C in extract, capsules and syrup were developed and validated according to the International Conference on Harmonization [
38] and the State Pharmacopoeia of Ukraine [
39].
The composition of the mobile phase was optimized by testing various mixtures of water and acetonitrile. Thus, the retention time of the main substance was more than 20 min with a concentration of acetonitrile less than 29%, otherwise, the separation between hederacoside C and some components of the samples was not acceptable enough with a higher amount of organic solvent. Different combinations of water with several acids including acetic acid and trifluoroacetic acid were tested to enhance the resolution and eliminate the peak tailing of the main substance, although none of the investigated acids showed any improvements for the method. Various columns such as ACE C18 (150 × 4.6 mm, particle size 5 µm) and Eclipse XDB-C18 (150 × 4.6 mm, particle size 5 µm) were applied to analyze the tested samples. The suitable separation was achieved with the ACE C18 column since Eclipse XDB showed unsatisfactory separation between hederacoside C and some substance in the syrup test solution.
3.2. Assay
The retention time of hederacoside C was about 15.9 min for all analyzed samples. The calculated amount of hederacisde C is shown in
Table 1. The typical chromatograms are presented in
Figure 2.
Further, the conditions of the HPLC method were adapted for UPLC, since the UPLC method provides some benefits such as decreasing time analysis and, as a result, cost saving during the quality control of medicines.
The main change was for the flow rate, after achieving an acceptable separation at 0.05 mL/min, all test samples were tested for the quantitative determination of hederacoside C. Although during the analysis of the syrup sample no separation between hederacoside C and the component of syrup placebo was observed (
Figure 3), the selectivity of the method should be increased.
Pretreatment plays one of the critical roles in the analysis. For instance, one of the methods [
31] proposes to directly inject the diluted syrup vehicle into the chromatographic system. Syrup vehicles are complex mixtures, consisting of a variety of excipients such as diluters, solubilizers, stabilizers, flavorants, preservatives, and so forth. The injection of all those components into the chromatographic system could lead to a decreasing specificity of determination, rapid reduction of column efficiency, split peaks, and severely reduced column lifetimes, especially in the case of the UPLC column, where the particle size of the sorbent is smaller than 2 µm. Thus, solid-phase extraction (SPE) has been applied to remove excipients from the matrix to allow it to reach specificity for the quantification of active pharmaceutical ingredient (API) n the syrup by UPLC. Furthermore, no analytical method using the SPE method for the determination of hederacoside C to obtain a high sensitivity, specificity, and minimum matrix interference has been reported. The proposed SPE protocol shows acceptable separations and accurate quantitative results for the main substance (
Figure 4).
Chromatograms of some analyzed samples are shown in
Figure 4. The separation between hederacoside C and other sample components was satisfactory and the resolution factor was higher than two in all test solutions.
The European Pharmacopeia [
33], as well as the State Pharmacopoeia of Ukraine [
36], propose the TLC method for the identification of hederacoside C, thus, the transfer of this method was produced to the HPTLC plate. Such a procedure has some advantages. Among them, is the reduction of the time for sample investigation, and this allows to economize finance, which is strongly important for pharmaceutical manufacturers.
The main issue was applying the syrup sample for this method. Another solid-phase extraction was applied to clean up the sample for analysis. Different solutions for elution were checked, such as methanol with its mixtures with water (60% and 80%) and acetonitrile with its mixture (60%, 80%). The satisfactory shape of the spot was established with methanol. Results obtained from the HPTLC studies are presented in
Figure 5 and
Table 1.
The data were obtained for all samples and measured by the HPLC, UPLC, and HPTLC methods. Each sample was analyzed in triplicate. All methods were compared by the matched pair Student’s
t-test. The comparison of the three analytical methods used for the determination of hederacoside C was done by the test equality of the means (
Table 1) (UN Secretary-General 2016).
3.3. Method Validation
The developed methods were validated in terms of specificity, linearity, precision, stability, and accuracy, besides the Limit of Detection (LOD) and Limit of Quantification (LOQ) were calculated for both methods.
3.3.1. Specificity
The interference of placebo excipients for capsules and syrup was investigated by comparing the chromatograms obtained from test, standard, and placebo solutions. The prepared placebo contained the same ingredients in an equal amount as test samples. Obtained results showed no interference to hederacoside C from excipients. For this reason, the proposed methods are specific for the determination of hederacoside C.
3.3.2. Linearity, LOD, LOQ
The study of linearity was carried out by the analysis of a series of solvents with different concentrations of hederacoside C. The results of linearity studied with the calculated LOD and LOQ are shown in
Table 2.
3.3.3. Precision
The study has been carried out within two days by different analysts. Test solution with 100% concentration was analyzed. The results of the RSD deviation of assay determination, also the errors of the method, are shown in
Table 3. The developed method is correct since the requirements for the error criterion are ≤ 6.4%.
3.3.4. Accuracy
The investigation of accuracy has been evaluated by means of recovery assays carried out by adding known amounts of the reference compound to the sample solutions. The amounts of analytes added correspond to 50%, 100%, and 200% of hederacoside C in samples. The calculated data are shown in
Table 4. Recoveries were obtained in the range of 98.13–100.12, depicting that the proposed methods are accurate for the determination of hederacoside C.
The stability of hederacoside C was carried out within 24 h for a standard solution. It was established that stored solutions were stable for up to 24 h in the case of the HPLC, UPLC, HPTLC methods, hence peak deviations of substance were 0.395%, 0.138%, and 0.387%, respectively.
All procedures showed satisfactory results in the data and could be recommended for the analysis of hederacoside C in different dosage forms as accurate and reproducible methods of quality control.
3.4. Eco-Scale Calculation
Chromatographic analysis requires the usage of various procedures and pretreatment of analyzed samples. Besides, for the assay of a sample, usually, a couple of determination methods are acceptable. The selection of analytical methods is commonly based on its accuracy, precision, cost, and the environmental and health impact [
30].
All developed chromatographic methods for the analysis of hederacoside C were estimated for their greenness using the analytical Eco-scale to choose the method with the least environmental impact. Furthermore, different conditions of pretreatment for each sample (extract, capsules, and syrup) were taken into account. HPLC (
Table 5) and UPLC (
Table 6) showed similar Eco-scale values. Thus, HPLC for extract, capsules, and the syrup has 78, 78, and 84, respectively, in comparison with UPLC values 81, 81, and 78, respectively. Both methods represent an excellent green analysis, and the differences between them are not significant, thus, they can be equal in terms of green chemistry. On the another hand, the HPTLC (
Table 7) method had significantly different results 59, 59, 53.
Thus, the HPTLC method was recognized as the less greenish technique compared to HPLC and UPLC.
3.5. Economic Calculation of Analytical Methods
The cost of required reagents for analytical researches was carried out on the basis of the official company database of Sigma-Aldrich [
40]. The procedure of the cost calculation is presented in
Table 8.
Costs for “electricity” are the costs that are directly spent in the technological process when performing analytical research. Electricity costs for technological purposes are calculated according to the actual cost of energy based on the readings of the measuring instruments. Therefore, the electricity cost was calculated on the basis of the technical characteristics of the equipment (energy consumption per kWh), the period of the analytical study, and the national electricity tariff for household and small non-household consumers at 0.09 Euro/kWh with an value-added tax. It is established that the number of costs for the article “electricity” in the conduct of analytical research by HPLC is 0.70 Euro, UPLC is 0.39 Euro, HPTLC is 0.35 Euro.
Transport and procurement costs according to various data can be from 1% to 15% of the total cost of raw materials, basic and auxiliary materials. To calculate the cost of analytical research for methods of analysis HPLC, UPLC, HPTLC we have taken the minimum values of transport and procurement costs, namely 1% [
41].
The calculation of expenditures under the article “wages” was made on the basis of official data of the State Statistics Service as of 01.06.2019 with respect to the average wage per month of the Senior Researcher, which was 293 euros. For a month of work, the senior researcher works 176 h. Allowances for social events make up 38.5% of the salaries of the main employees.
For the calculation of the article “Depreciation of fixed assets,” we used a straight-line method of calculating depreciation. Under this method, the annual depreciation amount (ADA) is determined by dividing the amortised cost (AC) by the useful life (UL). According to accounting standards 7, the amortised cost of an item of equipment is the initial or revalued value (RV) of assets less the liquidation value (LV), with the following calculation formula:
According to the provisions of item 138.3.3 of the Tax Code of Ukraine, the minimum allowable depreciation terms for fixed assets for equipment are five years. Therefore, taking into account the data of the initial and liquidation value of the equipment, which is necessary for the analytical study and the minimum useful life, we have calculated the depreciation of fixed assets. [
42] It is established that the amount of expenses under the item “depreciation of fixed assets” in the conduct of analytical research by HPLC is 1.05 Euro, UPLC is 0.52 Euro, HPTLC is 0.17 Euro.
The environmental impact of chemical reagents is a global environmental and pharmaceutical problem worldwide. Protecting the environment from the adverse effects of drugs requires immediate resolution. The laboratory enters into an agreement with an organization licensed to utilize reagent waste. According to the commercial offers of Kharkiv-Eco LLC, the cost of services related to the organic solvent waste is EUR 0.55 per 1 L. It was found that the number of disposal costs for HPLC exploration was 0.01 Euro, UPLC was 0.02 Euro, and HPTLC method was 0.0003 Euro. The results of the calculation of cost items by various methods of analytical research are summarized in
Table 9.
The “basic raw materials” are the largest share in the structure of total expenses. Thus, for the HPLC study, their specific gravity is 60.36 %, the UPLC is 65.83%, the HPTLC is 64.43%. It should be noted that the article “depreciation of fixed assets” is a significant expense in the cost of analytical research in various methods. It can be explained by the high cost of the equipment.
Based on the results, the HPTLC method had the lowest cost. The costs for applying the HPTLC method was 2.3 and 1.6 times lower than for HPLC and UPLC, respectively.
Next, we have calculated the cost of analytical research by HPLC, UPLC, HPTLC with dosage forms (extract, capsules, syrup). The results of the study are presented in
Table 10.
4. Conclusions
A reliable HPLC, UPLC, and HPTLC method for routine qualitative and quantitative analysis of hederacoside C in raw materials (such as an extract) and original dosage forms (capsules and syrups) was developed and validated in terms of specificity, linearity, precision, accuracy, and stability. Furthermore, the LOD and LOQ were calculated for methods. The SPE procedure of the preparation of the syrup sample for UPLC analysis was used to minimize the interference of excipients to the determination of the main substance. These methods offer a useful analytical tool for routine quality control of hederacoside C in different samples. Additionally, the environmental impact of each method was estimated and the HPTLC method was recognized as a less greenish method than HPLC and UPLC. On the another hand, the HPTLC method had the lowest expenses. The costs for applying the HPTLC method were 2.3 and 1.6 times lower than for HPLC and UPLC, respectively. According to the obtained results, the UPLC method was recognized as the most suitable for analysis, since it has a lower influence on the environment than the HPTLC method, needs smaller costs for applying than HPLC, and still shows satisfactory accuracy.

 ,
, 


