Article

Inter- and Intra-Population Variation of Foliage Calcium and Magnesium in Two Chinese Pine Species

1
Co-Innovation Center for Sustainable Forestry in Southern China, Key Laboratory of State Forestry and Grassland Administration on Subtropical Forest Biodiversity Conservation, College of Biology and the Environment, Nanjing Forestry University, Nanjing 210037, China
2
College of Forestry, Nanjing Forestry University, Nanjing 210037, China
*
Author to whom correspondence should be addressed.
These authors contributed equally to this work.
Plants 2023, 12(3), 562; https://doi.org/10.3390/plants12030562
Submission received: 3 November 2022 / Revised: 16 January 2023 / Accepted: 17 January 2023 / Published: 26 January 2023
(This article belongs to the Section Plant Nutrition)

Abstract

:
Calcium and magnesium are major nutrient elements of plants, and both play an important role in plant growth and development. Pinus massoniana and P. hwangshanensis are important afforestation tree species in barren mountains in China. However, observation and research on calcium and magnesium nutrition of dominant forest species in China are still limited. This study determined the concentration of calcium and magnesium in needles for two species from five sites in East China by inductively coupled plasma optical emission spectrometry (ICP-OES). We then explored the inter- and intra-population variation pattern of calcium and magnesium and their relationship with environmental factors. There were significant differences in traits among populations. The strongest factors, which impacted the variation of calcium and magnesium concentration, were elevation and individual differences, respectively. Element concentration was correlated to environmental factors such as longitude, latitude, elevation, and mean annual temperature. The results of this study can be helpful for a better understanding of tree growth, population survival, and forest succession.

1. Introduction

Calcium (Ca) and magnesium (Mg) are among the macronutrients of plants [1,2,3]. Based on principal component analysis (PCA) of elements, leaf chemical variation in nitrogen (N) and phosphorus (P) concentrations was recognized as the first axis of the “leaf economics spectrum” (LES) [4,5,6], whereas a gradient in Ca and Mg concentrations were labeled as the second axis of “structure and photosynthetic activity” [7], “mechanical properties” [8], or “digestibility” [9]. Thus, the variation pattern of plant Ca and Mg concentrations, although less understood than that of N and P, is crucial for understanding the ecological processes and functions of plants.
As one of the important elements in plant growth and development, Ca is associated with the cell wall structure and affects the plasticity and rigidity of the cell wall [10,11]. It is also involved in the stabilization of membranes, and a low concentration of free Ca2+ must be maintained in the cytoplasm to avoid the formation of insoluble calcium salts [2]. When deficient in Ca, plants may display meristem death, root disintegration, stem collapse, and leaf deformity and necrosis [3]. In addition, Ca is also a signal molecule in abiotic stress responses [12,13], biotic interactions [14], and pathogen defense [15]. Like Ca, Mg is also an exchangeable cation. Mg is supported to maintain the structural integrity of chlorophyll, ribosome, and chromatin [16,17]. It plays very important physiological roles in plants in photosynthesis and carbohydrate metabolism [18], as well as in the hydrolysis of high-energy compounds, and affects the activity of some enzymes such as DNA and RNA polymerases, ATPase, PEP carboxylase, and RuBisCO [19,20]. In the absence of Mg, plant leaves may show interveinal chlorosis, anthocyanin pigmentation, and then necrotic spotting [3,21].
In tree species, Ca and Mg are essential for tree metabolism and various physiological processes related to growth [22,23]. Cambial Ca2+ concentrations determine cell division, cell wall chemistry, and cell differentiation and then affect cambium width, vessel size, and wood formation [22]. Efficient Ca2+ supply may be a decisive factor in wood formation [24], which has significant impacts on assimilate partitioning and mineral distribution of the phloem [25] and lignification reaction in the wood [26]. Ca or a combination of nutrients (including Ca) may affect stem sinuosity [27]. In sapwood and heartwood, the Ca chemical species are distinct [28]. Thus, it can be served as a chemical marker for wood traits (e.g., wood anatomy and density) [29,30]. In addition, Ca:Mn ratios can be used as early-warning signals of forest dieback [31], and Ca physiology is considered to associate with the structure and function of forest ecosystems [32]. In terms of tree growth and development, the physiological function of magnesium is also essential. In Pinus radiata, Mg deficiency markedly reduces its net photosynthetic rate, biomass, and height growth [33,34,35]. Mg addition could reduce the symptom of extreme Mg deficiency and stimulate shoot growth in European beech [36]. Mg treatments may adjust the wood stiffness of standing trees in radiata pine [37]. In general, effective and balanced calcium and magnesium are very important for the function of the forest ecosystem [38]. Unfortunately, little is known about the plasticity level and the intra-specific variation patterns of calcium and magnesium nutrition in naturally growing trees and only a few reports have been found [39,40,41,42,43]. However, these data are not only necessary for nutrition diagnosis, fertilization scheme formulation, and plantation management for a forest stand, but also critical for tree genetic improvement and selective breeding.
Pinus massoniana (Masson pine) and P. hwangshanensis (Huangshan pine) are two very important tree species in southern China that belong to Subgen. Pinus, Sect. Pinus, and Subsect. Pinus [44]. The horizontal ranges of Masson pine (27°55′~32°30′ N, 102°40′~109°55′ E) a nearly sympatric to Huangshan pine (22°48′~31°48′ N, 112°30′~122°30′ E), with a lower elevation (generally below 700 m) in the former and a higher altitude (generally above 700 m) in the latter [45,46,47]. The two pine species share or own independently the following features: (1) in the same Subsection systematically; (2) with an overlapping range horizontally and distinct distributions vertically; (3) with different vegetation types, e.g., ‘Masson pine warm evergreen coniferous forest’ and ‘Huangshan pine cool evergreen coniferous forest’ [48,49]. Investigating the Ca and Mg nutrition of Masson pine, and Huangshan pine is undoubtedly essential for understanding their ecological processes, such as forest growth and development and nutrient cycling, as well as forestry practices, such as afforestation and forest management. Unfortunately, reports in this regard are limited [50,51]. A systematic and complete understanding with regard to the law of element variation, phenotypic plasticity, and ecological adaptability of the two species is still lacking. The knowledge about the effects of genetics and environment on elemental chemistry is also insufficient.
In this study, we aimed to solve the following three questions: (1) are there any differences in the variation levels and patterns of Ca and Mg nutrition between the two pines? (2) What are the plasticity level and variation pattern of Ca and Mg elements in each pine species? (3) What is the relationship between Ca and Mg concentrations and environmental factors? We expect that exploring the intra-specific variation of Ca and Mg nutrition of the two pines will provide solid data support for enriching the adaptive ecological theory and selective breeding practice.

2. Results

2.1. Difference in Ca and Mg Concentrations among Populations of Two Pines

The concentrations of Ca and Mg in P. massoniana and P. hwangshanensis were distinct (Table 1). Generally, the concentration of Ca was higher than that of Mg. The Ca concentration of P. hwangshanensis was significantly lower than that of P. massoniana in population S (population from Mt. Sanqingshan). As for Mg concentration, P. massoniana was significantly higher than P. hwangshanensis in population H (population from Mt. Huangshan), population J (population from Mt. Jinggangshan), and population T (population from Mt. Tianmushan).
Variation of element concentrations among populations also occurred within a species. For P. massoniana, the highest mean values in Ca concentration (5.62 mg·g−1) and Ca: Mg ratio (5.20) appeared in population S, whereas the top Mg concentration (1.41 mg·g−1) was in population J. Population L (population from Mt. Lushan) had the lowest mean Ca concentration (2.59 mg·g−1) and Ca:Mg ratio (2.47), while population H held the minimal mean Mg concentration (0.92 mg·g−1). For P. massoniana, the Ca concentration in population S was significantly higher than in other populations except for population H. Besides, population H had a significantly lower Mg concentration than population J and population T. The Ca:Mg ratio in population H and population S was significantly higher than that in population J, population L, and population T.
For P. hwangshanensis, population H had the highest mean Ca concentration and Ca:Mg ratio, with values of 3.78 mg·g−1 and 5.65. Moreover, the mean Mg concentration from population J was the highest, 1.09 mg·g−1, among different populations. The lowest mean Ca concentration and Ca:Mg ratio were in population J, with the values of 2.85 mg·g−1 and 2.60. Furthermore, the lowest mean Mg concentration occurred in population H (0.67 mg·g−1). In a word, the most abundant mean Mg concentration was in population J, and the lowest was in population H, no matter which species. Whether P. hwangshanensis or P. massoniana, the richest and the poorest mean Ca concentration and Ca:Mg ratio were in the same population. The Ca concentration of P. hwangshanensis had no significant difference among different populations. For P. hwangshanensis, population H held a significantly lower Mg concentration than population J and population L. Population J held a significantly higher Mg concentration than population T and population H. For Ca:Mg ratio, population H was significantly higher than other populations, and population T was significantly higher than population J and population L.
The Ca and Mg concentrations varied in different populations to various extents, according to CV. For P. massoniana, the most changeable Ca and Mg concentrations were in population J, with the CV of 56.08% and 26.85%. And for P. hwangshanensis, the most changeable Ca and Mg concentrations occurred in population H and population L separately.

2.2. Correlation between Calcium and Magnesium

We found that there was a certain correlation between Ca and Mg concentrations partly. The correlation coefficient of P. massoniana of population L was the highest and most significant. It could be seen in P. hwangshanensis only the correlation coefficient of population J was significant (Table 2).

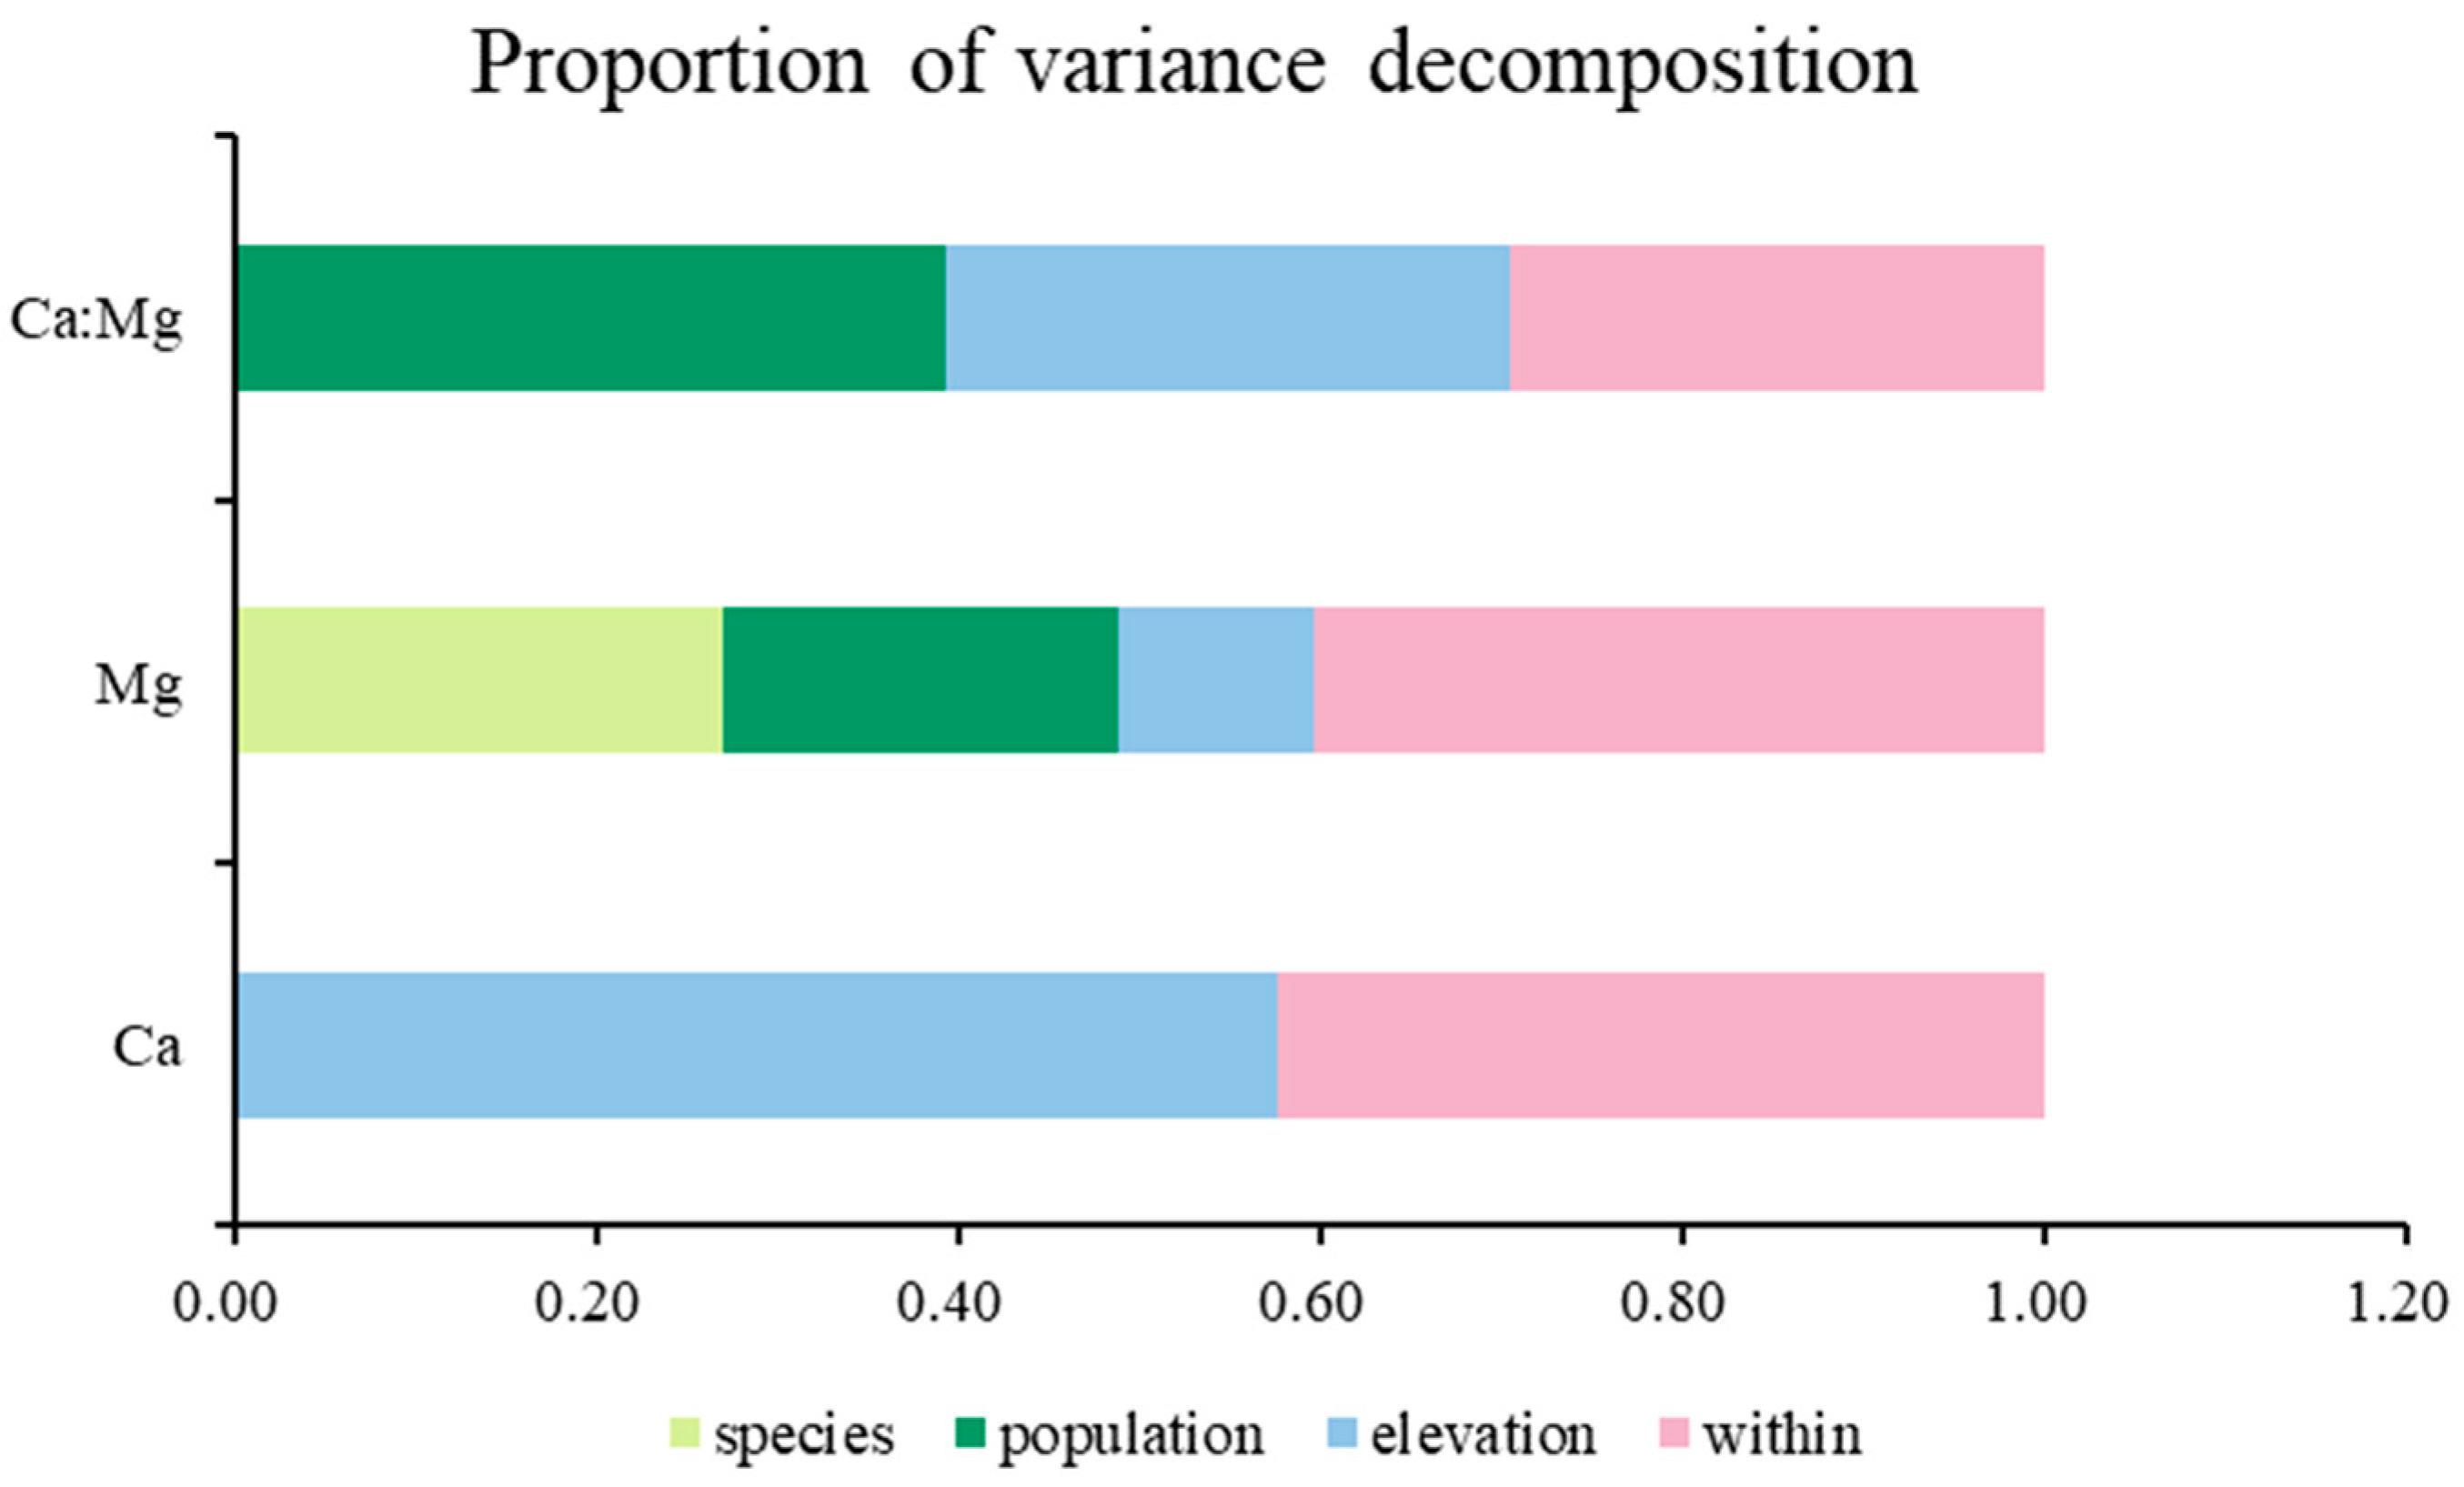
2.3. Source of Variation

Figure 1 shows a partitioning of the variance to species, population, elevation, and among individuals (within). For Ca concentration, elevation accounted for approximately 0.58, and the value of the effects of population and species were close to zero. A little less than half the variance of the dataset was attributable to among individuals, which meant individual differences within the plot. Additionally, for Mg concentration, the principal source of variation was among individuals. Species, population, and elevation accounted for 0.27, 0.22, and 0.11 of the total variance, respectively. Otherwise, for Ca:Mg ratio, population, elevation, and among individuals accounted for approximately 0.39, 0.31, and 0.30, respectively. Partitioning of the variance to species for Ca concentration and Ca:Mg ratio were both not obvious in the figure but still had a very low proportion.

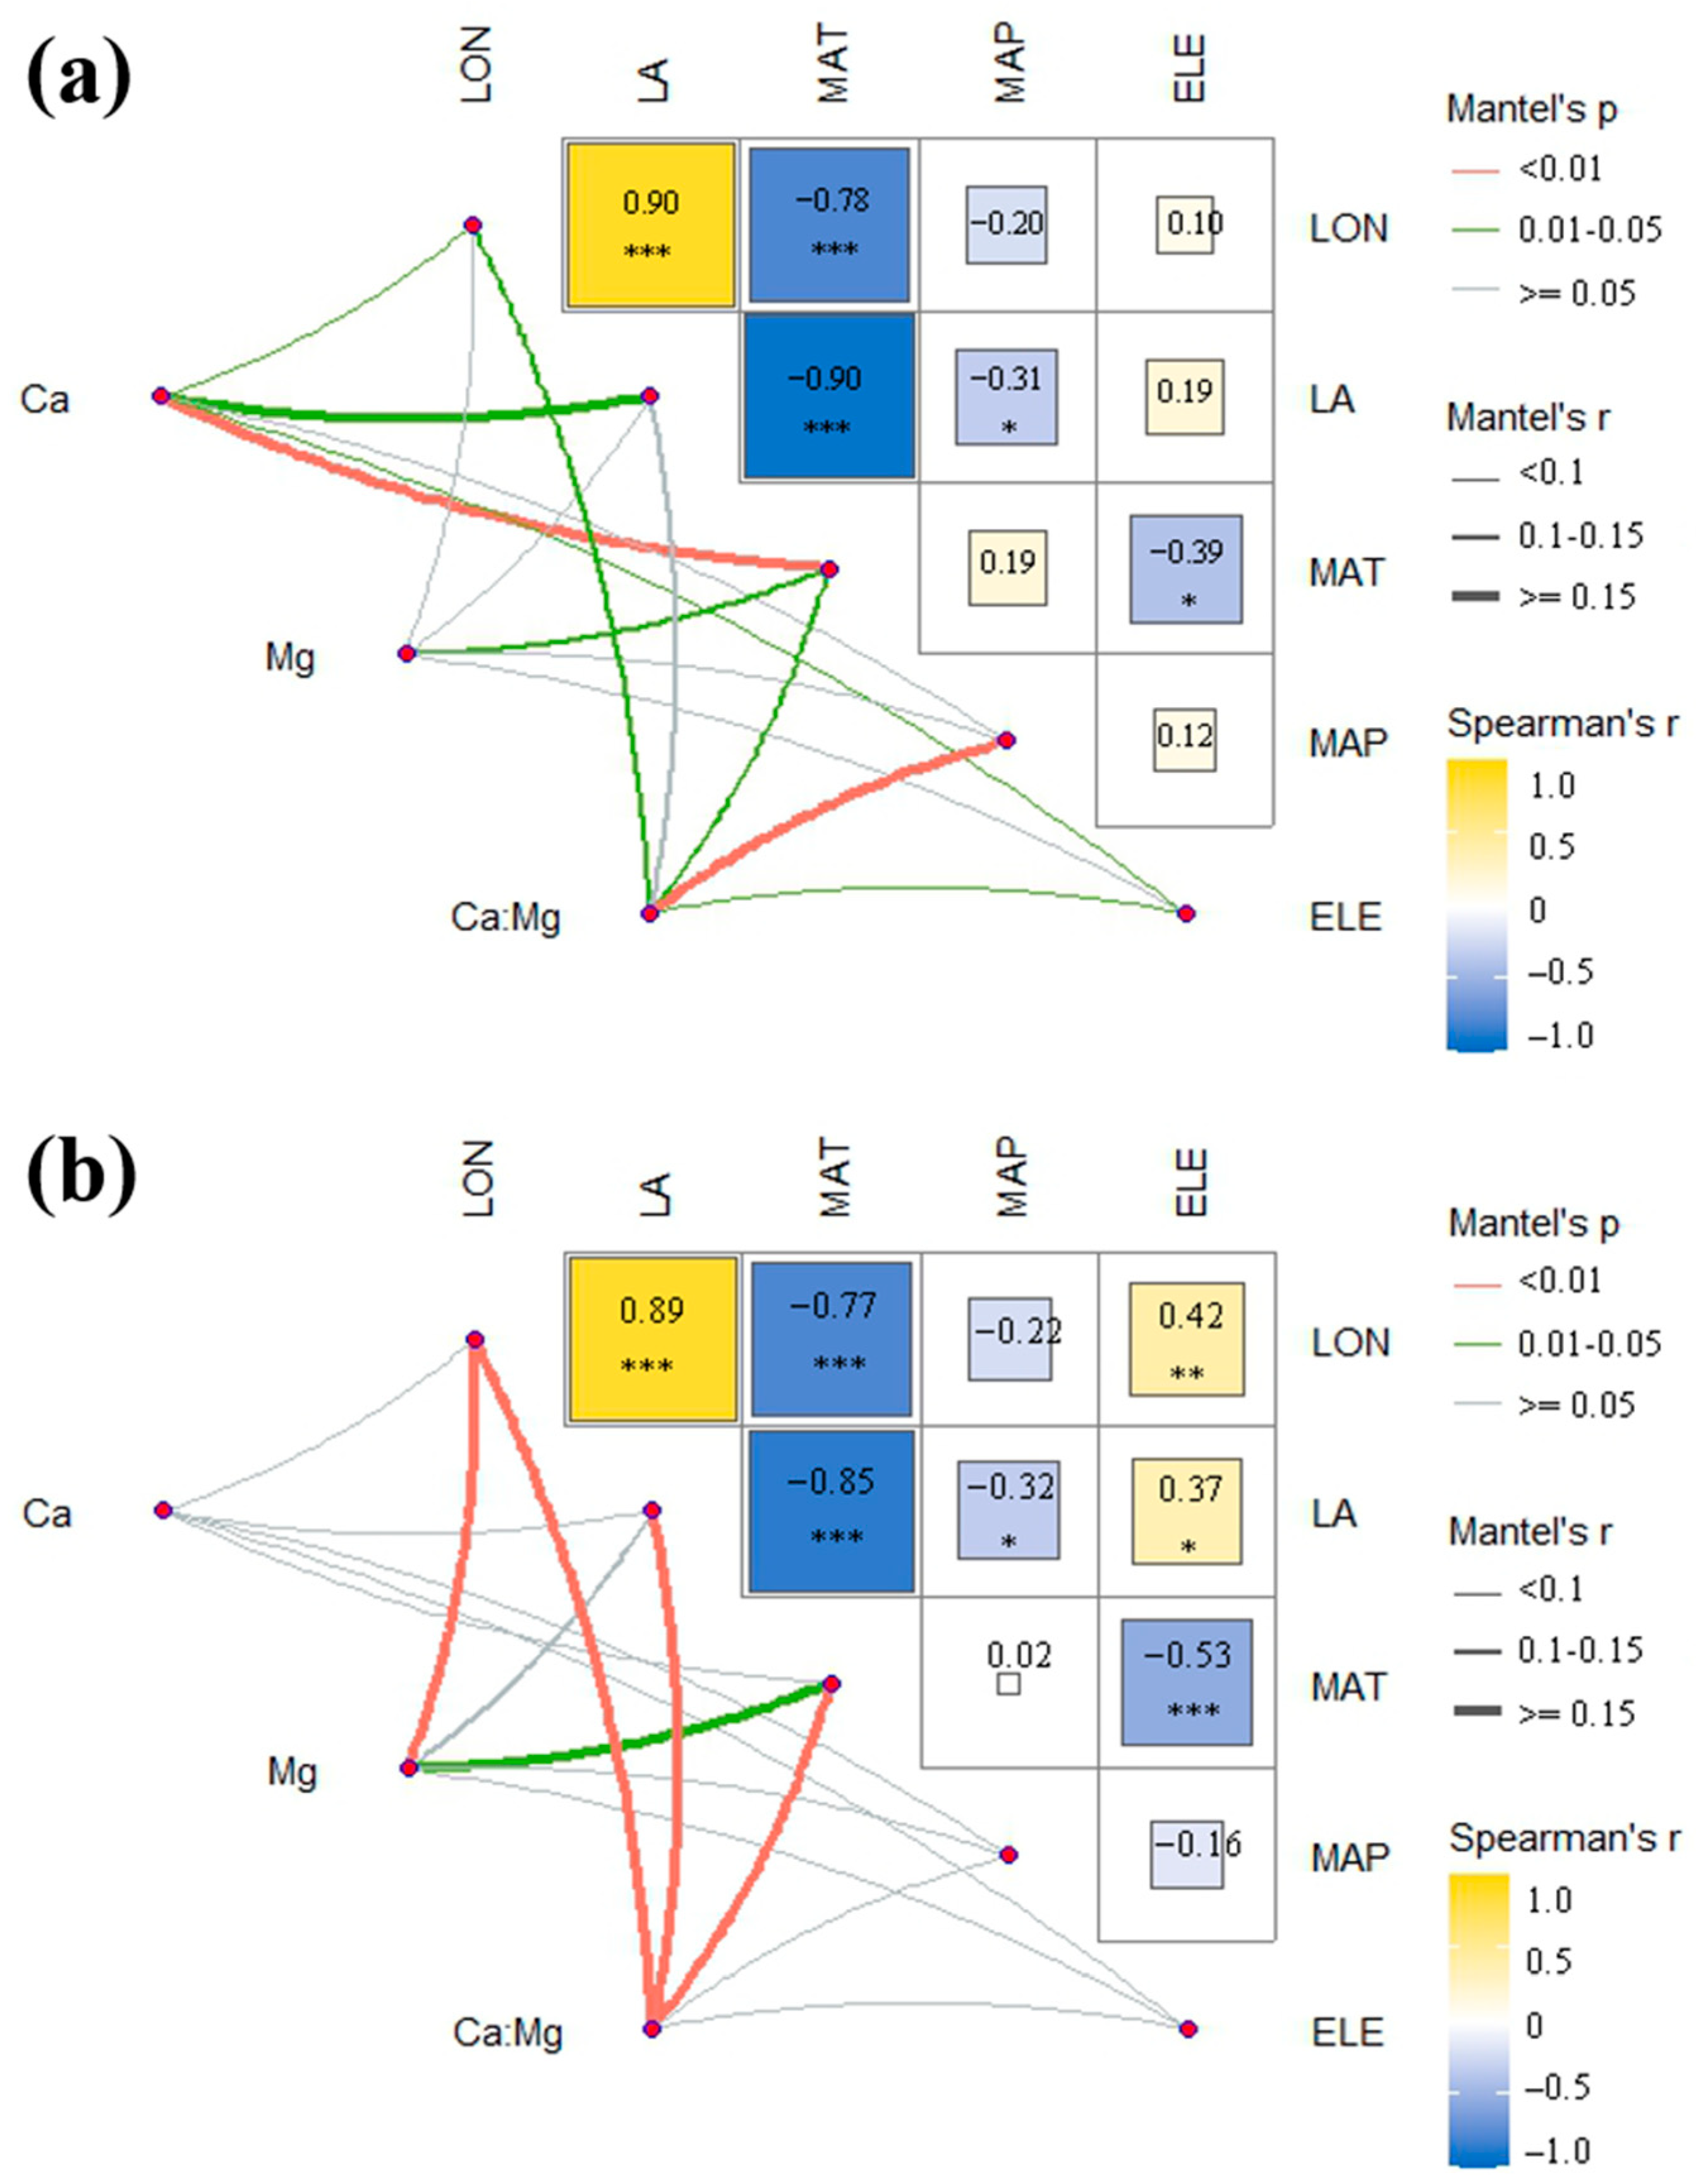
2.4. Correlation with Environmental Factors

There were obvious correlations between environmental variables (Figure 2). Mean annual temperature (MAT) was found to be negatively significantly correlated with longitude, latitude, and elevation. For P. massoniana, Ca concentration was strongly correlated with latitude and MAT. Mg concentration had no significant correlation with all environmental factors except MAT. Additionally, mean annual precipitation (MAP) was the strongest correlation of the Ca:Mg ratio.
For P. hwangshanensis, Ca concentration had no significant correlation with all factors. As for Mg concentration, it was clearly correlated with MAT as P. massoniana. Ca:Mg ratio had a significant and strong correlation with longitude, latitude, and MAT. It was found that for both species, Mg concentration was only significantly correlated to MAT. Ca:Mg ratio of the two species were significantly correlated to longitude and MAT.

3. Discussion

3.1. Concentration of Calcium and Magnesium

The leaf is the most active organ of plant metabolism, and its chemical element concentration can reflect the characteristics of the absorption and accumulation of elements by plants [52]. More importantly, it can indicate the adaptive strategies of plants to different environments. In turn, the environment can also affect the concentration of nutrient elements in plants. An important cause of the difference in foliage Ca and Mg concentration is tree species. The value for P. canariensis and P. halepensis seemed to be much higher than that for P. taeda in both Ca and Mg (Table 3). Within a species, Ca and Mg nutrition may vary depending on region or site (Table 4). Ca and Mg concentration generally decreased with tree age [53]. Similarly, Ca concentration in P. pinaster and P. radiata decreased significantly with needle age; this difference, however, did not appear in Mg [54]. It was worth pointing out that the concentrations of two elements in young needles were usually lower than those in mature needles [39]. Ca concentration was lower in green needles than that in the litter, while Mg concentration was the opposite [55]. Elevated Ca and Mg concentrations for P. halepensis were found in winter [56]. In addition to tree age and needle development stage, environmental factors also affected the nutrient levels of these two elements. Significantly higher foliar Ca concentration in Aleppo pine could be explained by the nature of the calcareous soil parent material [42]. Ca and Mg concentrations in densely populated areas decreased [57]. Silvicultural treatments reduced foliage Ca and Mg concentrations [58]. However, another study showed that thinning treatments did not change foliage Ca and Mg concentrations in P. halepensis [59].

3.2. Correlation between Calcium and Magnesium

Different populations had similar patterns of correlation between these two elements. The correlation between Ca and Mg concentration was positive. Especially the correlations of P. massoniana in Mt. Lushan and Mt. Jinggangshan and of P. hwangshanensis in Mt. Jinggangshan were significant. It suggested that these two elements promote each other’s absorption. The same result was confirmed, and it showed that there was no antagonistic effect of Ca concentrations in soils on Mg uptake [42]. Calcium and magnesium have important effects on various vital movements of cells. Cellular functions of Ca2+ are structural and act as a secondary messenger, which plays a role in biotic and abiotic stress, stomatal regulation, and physical damage [12,67]. The majority of cellular Mg2+ has roles as enzyme cofactors and in the stabilization of nucleotides and nucleic acids [1].
In the current study, we could not verify the existence of the ‘structure and photosynthetic activity axis’ for foliage Ca and Mg nutrients in pines, but as stated above, it was found that Ca and Mg concentrations were related. This correlation is also reflected in the Ca:Mg ratio. Ca:Mg ratio was recognized as one of the key indicators for plant nutrient status [68]. According to previous reports, the foliage Ca:Mg ratio in plants is plastic within a certain range (general plants 1.0~6.67 [58]; trees 2.78~14.47, shrubs 3.47~6.48, grasses 2.69~3.84 [68]). Compared with the references, the foliage Ca:Mg ratio of P. massoniana (1.10~9.11) and P. hwangshanensis (1.89~8.73) is roughly within this range, but the minimum value is outside this range due to a series of complex factors. Although the issue of the ‘structure and photosynthetic activity axis’ still needs empirical studies, we can find some clues related to this topic. The highest concentrations of Ca and Mg were measured in leaf palisade and spongy mesophyll cells, respectively, and this conservative mechanism of foliage Ca and Mg distribution may be related to Ca and Mg homeostasis in plants [69]. For the regulation of Ca and Mg homeostasis in plants, a family of CorA-type Mg2+ transporters and related signal networks have been reported recently [70].

3.3. Genetic and Environmental Variation of Calcium and Magnesium

Different traits may have different sources of variation, mainly including genetic and environmental factors. Mg concentration was constrained more strongly genetically than environmentally, with 0.27 of the variance apportioned to species. Only 0.11 was due to elevation, which represented environmental effects partly. The variation of Ca concentration was greatly affected by elevation, with 0.58 of the total variance. The trait varied due to different environments and had a much higher level of plasticity. Intra-species variability was an apparent influencing factor in the variation of Ca and Mg concentration, as well as the Ca:Mg ratio. All traits had a certain proportion among individuals, consistent with previous studies [71]. There are also other reasons for variation. The functional type showed the greatest direct influence on most leaf minerals in the research of a larger research scale [72]. Therefore, the results of the source of variation for different circumstances are not in complete accord.
All element concentrations of the two species except the Ca concentration of P. hwangshanensis had significant differences among populations. Actually, the population could be regarded as the result of a complex interaction between genetic variation and environmental factors. Species in different sites may have genetic variation due to geographical isolation. In addition, different specific environments, together with the former, probably lead to differences in plant traits. However, there was no significant difference in the Ca concentration of P. hwangshanensis, which may be the result of the lack of randomness and extensiveness of sampling.
Element concentration is affected by various environmental factors. Foliar nutrient concentration might be the result of a complex interaction between soil nutrients and effective availability caused by climate, water, and other site and treatment effects [58]. Previous studies identified Ca concentration of pine needles was significant relative to elevation [73]. In our study, the Ca concentration of P. massoniana also displayed a positive and significant correlation with elevation. Elevation can cause changes in temperature, light, moisture, and other habitat factors, thus affecting plant growth and physiological metabolism [74,75].
Ca concentration of P. massoniana was significantly correlated with longitude and latitude. Leaf minerals exhibited significant latitudinal and longitudinal trends, which meant they had similar environmental and biological controls that shaped the biogeographic patterns of the plant minerals [72]. The concentrations of plant elements reflect the adaptation to changeable conditions from the north to south and from west to east in China.
MAT had a significant effect on Ca and Mg concentration as well as the Ca:Mg ratio of P. massoniana. And the strongest relationship was with Ca concentration. Meanwhile, the Mg concentration of P. hwangshanensis was only significantly related to MAT. Temperature and precipitation can further affect the element concentration of leaves by affecting both plant growth rate and soil nutrients [76]. However, most traits in our study had no significant relationship with MAP. It was speculated that the relationship between element concentration and the environment was weakened after data was processed.
Nutrient concentration in tree species has been used to assess the nutrient status of forests [56]. Leaf nutrient concentrations can also be used as an indicator of stand development and health status [58]. The cutting of forests has taken away branches, leaves, and other parts with higher reserves of nutrient elements, resulting in a large number of nutrient element losses. The needle nutrient concentrations for most of the nutrients studied except for Na, Mn, and C could not be affected after eight years of thinning [59]. So, we should choose scientific and reasonable methods for logging to minimize the impact of human activities on forest nutrients. Otherwise, understanding the variation patterns of nutrient elements can be crucial to planning the best silvicultural practices as a basic strategy for improving stand resilience.

4. Materials and Methods
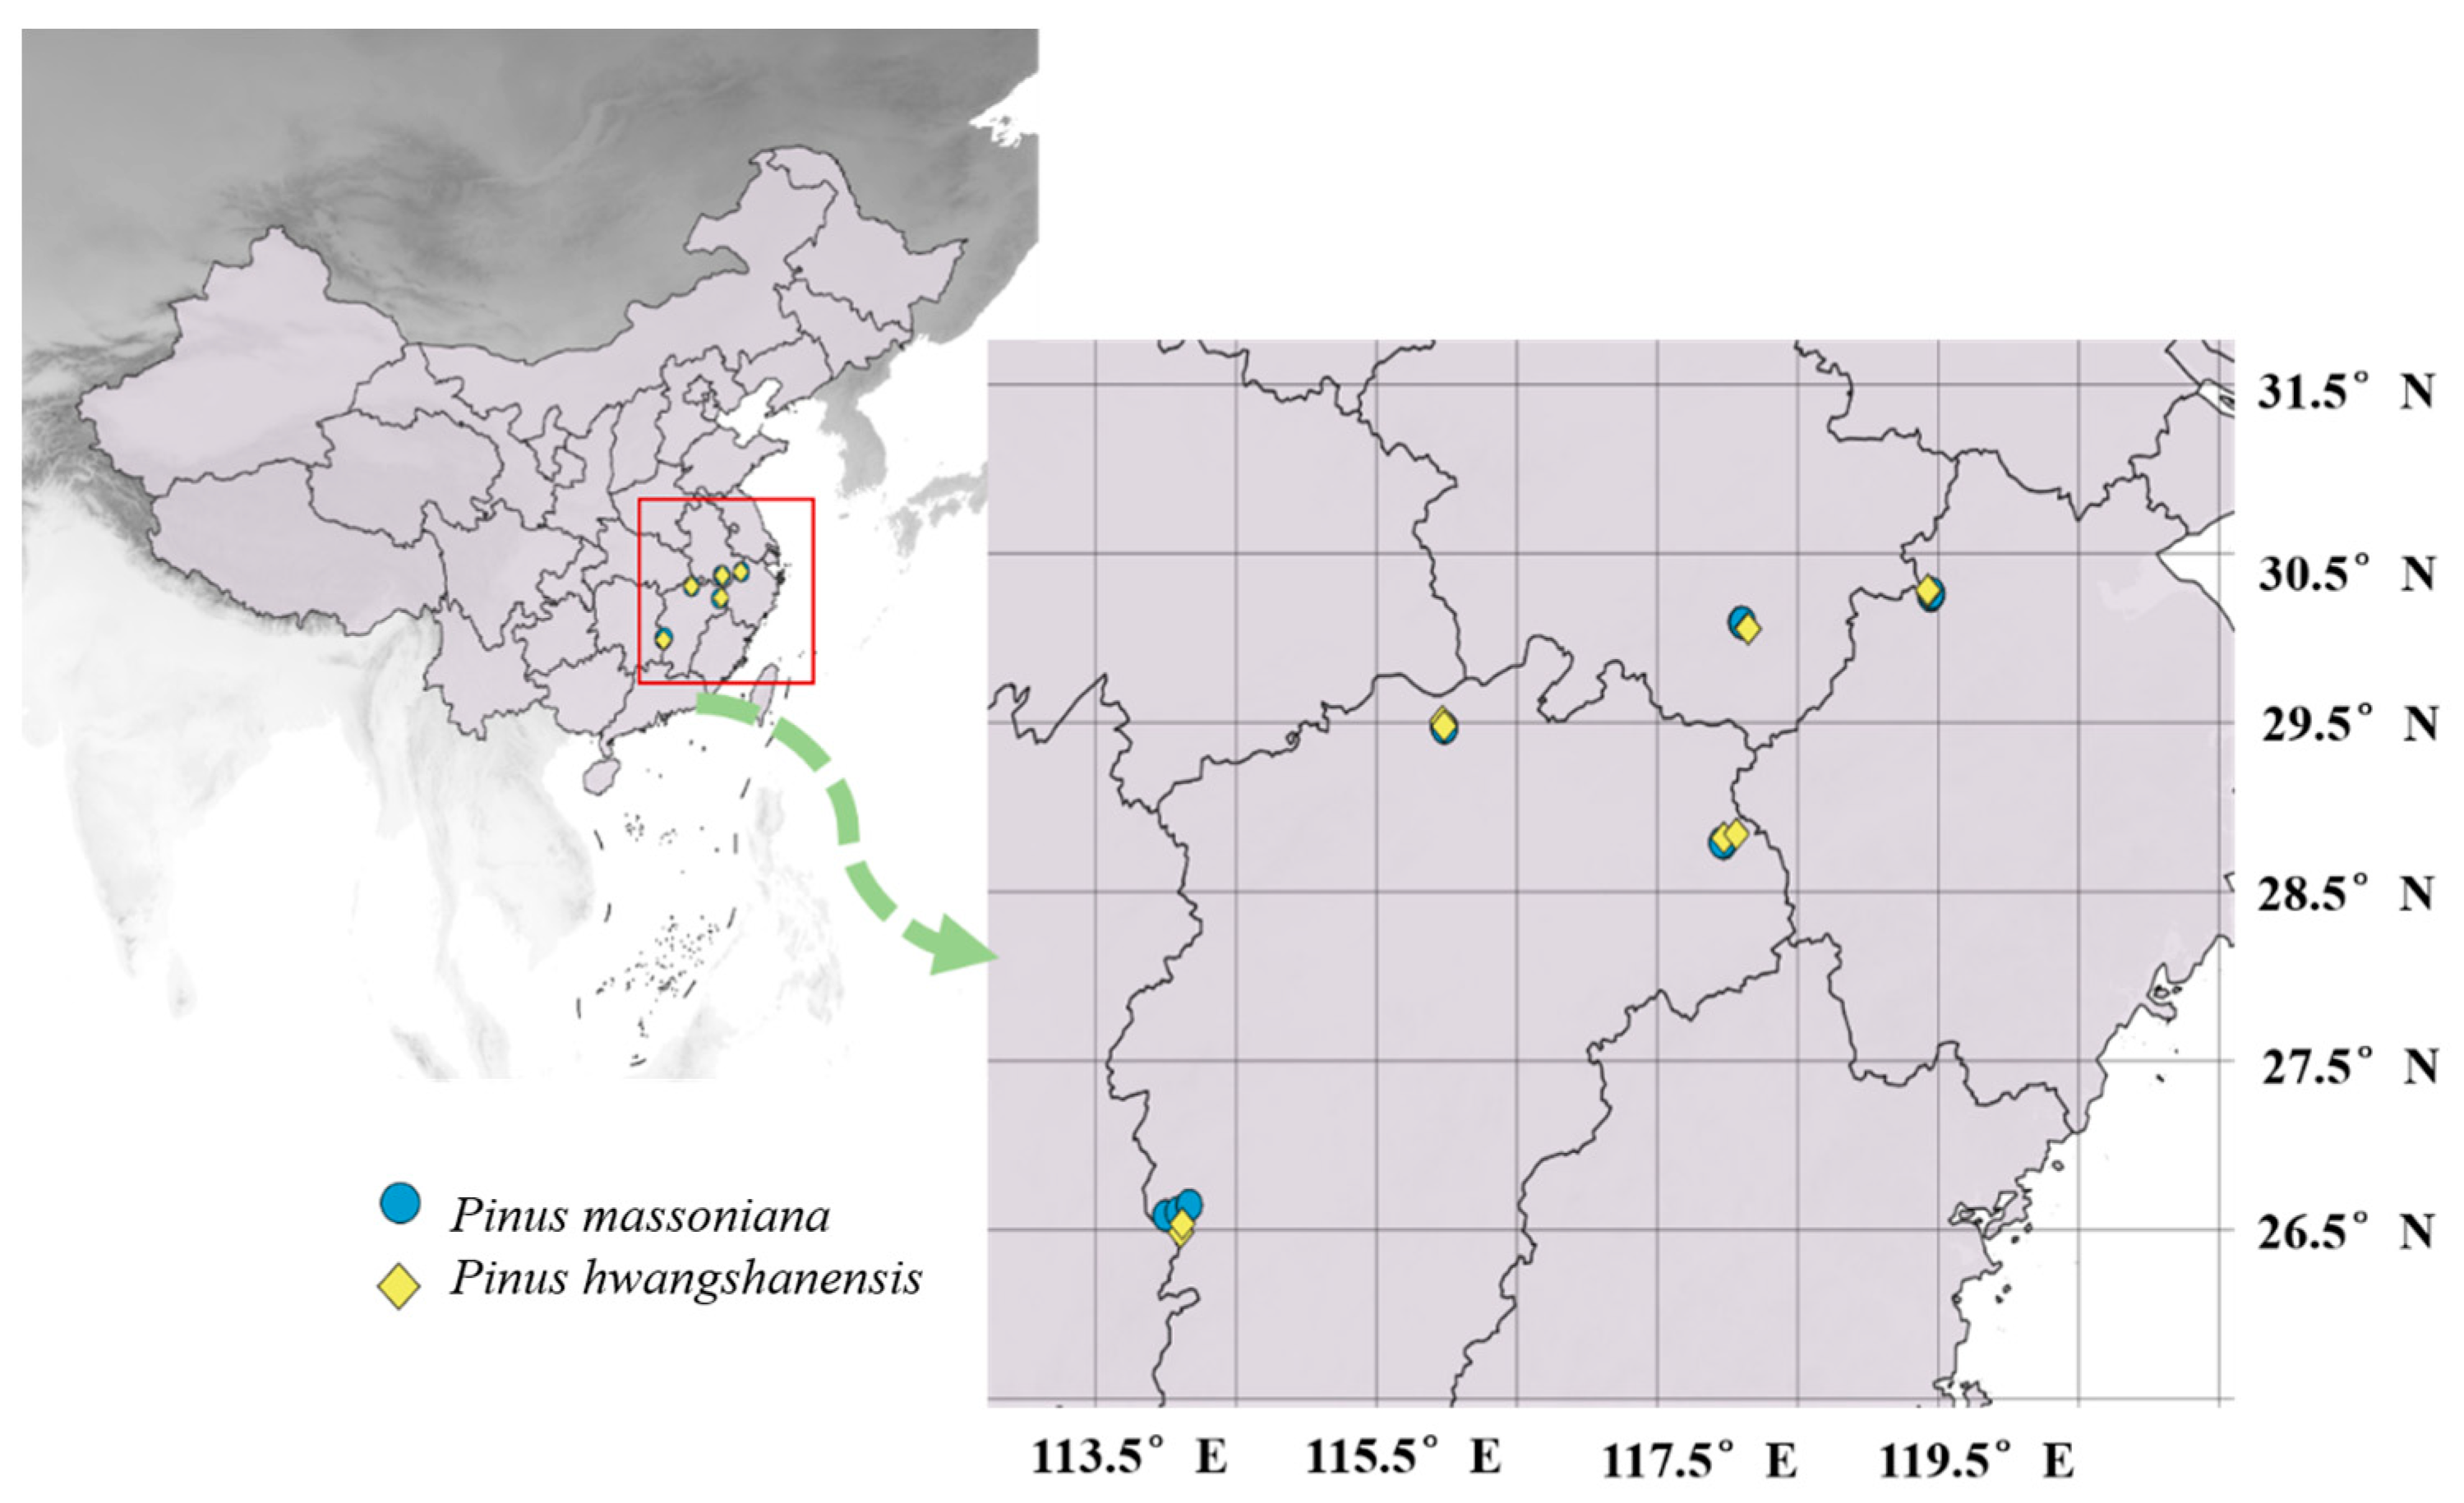
4.1. Plant Sampling

The samples were taken from five different sites in China, including Mt. Sanqingshan, Mt. Lushan, Mt. Jinggangshan, Mt. Huangshan, and Mt. Tianmushan. All these study sites need to meet the following conditions: (1) with both P. massoniana and P. hwangshanensis populations; (2) with an elevation gradient; (3) with both P. massoniana and P. hwangshanensis as a dominant species in local communities, respectively. These places are located in the middle subtropical zone, and the landforms are characterized by middle and low mountains, hills, valleys, and plains. It has an obvious monsoon climate, characterized by hot summer and warm winter, four distinct seasons, rain and heat over the same period, and developed monsoon. The annual precipitation is generally abundant, mostly 1000~2000 mm. The average annual temperature is usually about 16~20 °C, while the average temperature of the coldest month is generally between 5~10 °C. The typical soil is mainly red or yellow soil. The zonal vegetation is evergreen, broad-leaved forest with warm and temperate coniferous forests.
P. hwangshanensis is one of the representative coniferous tree species in the eastern subtropical mountains of China. It is barren tolerant and distributed in high-elevation areas. P. massoniana is an important afforestation tree species in barren mountains in China, usually distributed below 700 m above sea level. To obtain samples of the two pines, the sample plot with an area of 20 × 50 m was established before sampling. For P. massoniana, the plots were selected at different elevations below 600 m. Besides, roughly consistent schemes were used for P. hwangshanensis, but the selected elevation was above 800 m (Table 4, Figure 3). Three healthy and well-growing individuals were chosen randomly and as scattered as possible in each plot. Foliar samples on annual branches were collected from the outer layer of the lower crown using a pruning pole and stored in plastic bags with silica gel to keep dry.

4.2. Chemical Analyses

The needles were washed in deionized water, dried at the temperature of 80 °C, and sieved through a sieve with a mesh diameter of 0.3 mm after being homogenized in a laboratory grinder. The powder samples were digested in a mixture of HNO3 and HCIO4 = 4:1. Next, the concentrations of Ca and Mg were measured by inductively coupled plasma optical emission spectrometry (ICP-OES).

4.3. Environmental Variables

Leaf nutrient elements are closely related to environmental factors, including temperature, precipitation, elevation, and others. Mean annual temperature (MAT) and mean annual precipitation (MAP) were obtained from the website (http://www.worldclim.org/), accessed on 20 September 2022. In addition, elevation, longitude, and latitude were recorded when sampling.

4.4. Statistical Analyses

In order to compare the concentration of calcium and magnesium, the calcium-magnesium ratio of two species from five populations, mean, minimum and maximum values, and other results were calculated. One-way ANOVA and multiple comparisons were made with populations as the main factors. The difference between species was also obtained through one-way ANOVA. All the data were transformed before analysis for better data normality. Pearson correlation analysis was taken to understand the correlation between Ca and Mg concentration. All analyses were conducted with the statistical software SPSS 27.
A multilevel model was fitted for each trait about species, populations, elevation, and ‘within’. The ‘within’ was regarded as natural intra-species variability within the plot and all variables were log-transformed before analysis. All parameters estimated by the REML module of the R statistical package were nested in the specified order to partition the variance to different levels [71]. It may be conducive to compare and analyze the sources of variation of these variables.
A Mantel test measures the correlation between two matrices typically containing measures of distance. In our study, trait variables and environmental variables were transformed into matrices. Computing the correlation and significance between trait variables and environmental variables through the Mantel test with the package ‘linkET’ in R 4.2.1. Meanwhile, Spearman’s correlation coefficients were calculated between environmental variables. The Mantel composite graph was visualized by ‘ggplot2’ in R [77].

5. Conclusions

Our study systematically investigated the concentrations of calcium and magnesium for P. massoniana and P. hwangshanensis in different sites. The concentrations of Ca and Mg had significant variations among different populations. The variation of Ca was constrained more strongly environmentally than genetically, while Mg was the opposite. Concentrations of both elements had a certain correlation with longitude, latitude, MAT, and elevation. Our study on the variation pattern of calcium and magnesium elements can provide a basis for afforestation management and forest nutrient protection. Besides, the soil nutrient conditions at the sampling sites were not measured. The relationship between soil nutrition and leaf nutrition is not clear, so further research is needed.

Author Contributions

Conceptualization, M.H., Y.Y., and Y.F.; formal analysis, M.H., Y.Y. and T.L.; investigation, M.H., Y.Y., M.F., K.H. and L.W.; project administration, X.Y., L.C. and Y.F.; writing—original draft, M.H. and Y.Y.; writing—review & editing, L.W., T.L. and Y.F. All authors have read and agreed to the published version of the manuscript.

Funding

This research was funded by the Special Foundation for National Science and Technology Basic Resources Investigation of China (2019FY202300 to Y.F.).

Data Availability Statement

All data supporting the findings of this study are available within the paper, which are published online.

Conflicts of Interest

The authors declare no conflict of interest.

References

  1. Maathuis, F.J.M. Physiological functions of mineral macronutrients. Curr. Opin. Plant Biol. 2009, 12, 250–258. [Google Scholar] [CrossRef] [PubMed]
  2. Thor, K. Calcium-Nutrient and Messenger. Front. Plant Sci. 2019, 10, 440. [Google Scholar] [CrossRef] [PubMed]
  3. de Bang, T.C.; Husted, S.; Laursen, K.H.; Persson, D.P.; Schjoerring, J.K. The molecular-physiological functions of mineral macronutrients and their consequences for deficiency symptoms in plants. New Phytol. 2021, 229, 2446–2469. [Google Scholar] [CrossRef] [PubMed]
  4. Wright, I.J.; Reich, P.B.; Westoby, M.; Ackerly, D.D.; Baruch, Z.; Bongers, F.; Cavender-Bares, J.; Chapin, T.; Cornelissen, J.H.C.; Diemer, M.; et al. The worldwide leaf economics spectrum. Nature 2004, 428, 821–827. [Google Scholar] [CrossRef] [PubMed]
  5. Donovan, L.A.; Maherali, H.; Caruso, C.M.; Huber, H.; de Kroon, H. The evolution of the worldwide leaf economics spectrum. Trends Ecol. Evol. 2011, 26, 88–95. [Google Scholar] [CrossRef]
  6. Edwards, E.J.; Chatelet, D.S.; Sack, L.; Donoghue, M.J. Leaf life span and the leaf economic spectrum in the context of whole plant architecture. J. Ecol. 2014, 102, 328–336. [Google Scholar] [CrossRef] [Green Version]
  7. Agren, G.I.; Weih, M. Plant stoichiometry at different scales: Element concentration patterns reflect environment more than genotype. New Phytol. 2012, 194, 944–952. [Google Scholar] [CrossRef]
  8. Nakajima, N.; Morikawa, H.; Igarashi, S.; Senda, M. Differential effect of calcium and magnesium on mechanical properties of pea stem cell walls. Plant Cell Physiol. 1981, 22, 1305–1315. [Google Scholar]
  9. Mladkova, P.; Mladek, J.; Hejduk, S.; Hejcman, M.; Pakeman, R.J. Calcium plus magnesium indicates digestibility: The significance of the second major axis of plant chemical variation for ecological processes. Ecol. Lett. 2018, 21, 885–895. [Google Scholar] [CrossRef]
  10. Podgorska, A.; Burian, M.; Gieczewska, K.; Ostaszewska-Bugajska, M.; Zebrowski, J.; Solecka, D.; Szal, B. Altered Cell Wall Plasticity Can Restrict Plant Growth under Ammonium Nutrition. Front. Plant Sci. 2017, 8, 1344. [Google Scholar] [CrossRef] [Green Version]
  11. Park, J.; Kim, W.S. Preharvest Spraying of CaCl2 Alleviates the Scape Bending of Gerbera ‘Harmony’ Flowers by Strengthening the Pectin Crosslinks through Ca2+ Bonds. Horticulturae 2022, 8, 523. [Google Scholar] [CrossRef]
  12. Gilroy, S.; Suzuki, N.; Miller, G.; Choi, W.G.; Toyota, M.; Devireddy, A.R.; Mittler, R. A tidal wave of signals: Calcium and ROS at the forefront of rapid systemic signaling. Trends Plant Sci. 2014, 19, 623–630. [Google Scholar] [CrossRef]
  13. Kudla, J.; Becker, D.; Grill, E.; Hedrich, R.; Hippler, M.; Kummer, U.; Parniske, M.; Romeis, T.; Schumacher, K. Advances and current challenges in calcium signaling. New Phytol. 2018, 218, 414–431. [Google Scholar] [CrossRef] [PubMed]
  14. Tian, W.; Wang, C.; Gao, Q.F.; Li, L.G.; Luan, S. Calcium spikes, waves and oscillations in plant development and biotic interactions. Nat. Plants 2020, 6, 750–759. [Google Scholar] [CrossRef]
  15. Toyota, M.; Spencer, D.; Sawai-Toyota, S.; Wang, J.Q.; Zhang, T.; Koo, A.J.; Howe, G.A.; Gilroy, S. Glutamate triggers long-distance, calcium-based plant defense signaling. Science 2018, 361, 1112. [Google Scholar] [CrossRef] [PubMed]
  16. Ohyama, T. New Aspects of Magnesium Function: A Key Regulator in Nucleosome Self-Assembly, Chromatin Folding and Phase Separation. Int. J. Mol. Sci. 2019, 20, 4232. [Google Scholar] [CrossRef] [PubMed] [Green Version]
  17. Ishfaq, M.; Wang, Y.Q.; Yan, M.W.; Wang, Z.; Wu, L.Q.; Li, C.J.; Li, X.X. Physiological Essence of Magnesium in Plants and Its Widespread Deficiency in the Farming System of China. Front. Plant Sci. 2022, 13, 802274. [Google Scholar] [CrossRef]
  18. Gerendas, J.; Fuhrs, H. The significance of magnesium for crop quality. Plant Soil 2013, 368, 101–128. [Google Scholar] [CrossRef] [Green Version]
  19. Guo, W.L.; Nazim, H.; Liang, Z.S.; Yang, D.F. Magnesium deficiency in plants: An urgent problem. Crop J. 2016, 4, 83–91. [Google Scholar] [CrossRef] [Green Version]
  20. Chaudhry, A.H.; Nayab, S.; Hussain, S.B.; Ali, M.; Pan, Z.Y. Current Understandings on Magnesium Deficiency and Future Outlooks for Sustainable Agriculture. Int. J. Mol. Sci. 2021, 22, 1819. [Google Scholar] [CrossRef]
  21. Tian, X.Y.; He, D.D.; Bai, S.; Zeng, W.Z.; Wang, Z.; Wang, M.; Wu, L.Q.; Chen, Z.C. Physiological and molecular advances in magnesium nutrition of plants. Plant Soil 2021, 468, 1–17. [Google Scholar] [CrossRef]
  22. Fromm, J. Wood formation of trees in relation to potassium and calcium nutrition. Tree Physiol. 2010, 30, 1140–1147. [Google Scholar] [CrossRef] [PubMed] [Green Version]
  23. Momen, B.; Behling, S.J.; Lawrence, G.B.; Sullivan, J.H. Photosynthetic and Growth Response of Sugar Maple (Acer saccharum Marsh.) Mature Trees and Seedlings to Calcium, Magnesium, and Nitrogen Additions in the Catskill Mountains, NY, USA. PLoS ONE 2015, 10, e0136148. [Google Scholar] [CrossRef] [PubMed]
  24. Lautner, S.; Ehlting, B.; Windeisen, E.; Rennenberg, H.; Matyssek, R.; Fromm, J. Calcium nutrition has a significant influence on wood formation in poplar. New Phytol. 2007, 173, 743–752. [Google Scholar] [CrossRef] [PubMed]
  25. Schulte-Baukloh, C.; Fromm, J. The effect of calcium starvation on assimilate partitioning and mineral distribution of the phloem. J. Exp. Bot. 1993, 44, 1703–1707. [Google Scholar] [CrossRef]
  26. Westermark, U. Calcium promoted phenolic coupling by superoxide radical—A possible lignification reaction in wood. Wood Sci. Technol. 1982, 16, 71–78. [Google Scholar] [CrossRef]
  27. Espinoza, J.A.; Allen, H.L.; McKeand, S.E.; Dougherty, P.M. Stem sinuosity in loblolly pine with nitrogen and calcium additions. Forest Ecol. Manag. 2012, 265, 55–61. [Google Scholar] [CrossRef]
  28. Alves, E.E.N.; Rodriguez, D.R.O.; de Azevedo Rocha, P.; Vergütz, L.; Junior, L.S.; Hesterberg, D.; Pessenda, L.C.R.; Tomazello-Filho, M.; da Costa, L.M. Synchrotron-based X-ray microscopy for assessing elements distribution and speciation in mangrove tree-rings. Results Chem. 2021, 3, 100121. [Google Scholar] [CrossRef]
  29. Rodriguez, D.R.O.; Hevia, A.; Sanchez-Salguero, R.; Santini, L.; de Carvalho, H.W.P.; Roig, F.A.; Tomazello, M. Exploring wood anatomy, density and chemistry profiles to understand the tree-ring formation in Amazonian tree species. Dendrochronologia 2022, 71, 125915. [Google Scholar] [CrossRef]
  30. Dwivedi, P.; Sucre, E.; Turnblom, E.C.; Harrison, R.B. Investigating Relationships between Nutrient Concentrations, Stem Sinuosity, and Tree Improvement in Douglas-Fir Stands in Western Washington. Forests 2019, 10, 541. [Google Scholar] [CrossRef] [Green Version]
  31. Hevia, A.; Sanchez-Salguero, R.; Camarero, J.J.; Querejeta, J.I.; Sanguesa-Barreda, G.; Gazol, A. Long-term nutrient imbalances linked to drought-triggered forest dieback. Sci. Total Environ. 2019, 690, 1254–1267. [Google Scholar] [CrossRef] [PubMed]
  32. McLaughlin, S.; Wimmer, R. Calcium physiology and terrestrial ecosystem processes. New Phytol. 1999, 142, 373–417. [Google Scholar] [CrossRef]
  33. Sun, O.; Payn, T. Magnesium nutrition and photosynthesis in Pinus radiata: Clonal variation and influence of potassium. Tree Physiol. 1999, 19, 535–540. [Google Scholar] [CrossRef] [PubMed]
  34. Sun, O.J.; Gielen, G.J.H.P.; Sands, R.; Smith, C.T.; Thorn, A.J. Growth, Mg nutrition and photosynthetic activity in Pinus radiata: Evidence that NaCl addition counteracts the impact of low Mg supply. Trees 2001, 15, 335–340. [Google Scholar] [CrossRef]
  35. Laing, W.; Greer, D.; Sun, O.; Beets, P.; Lowe, A.; Payn, T. Physiological impacts of Mg deficiency in Pinus radiata: Growth and photosynthesis. New Phytol. 2000, 146, 47–57. [Google Scholar] [CrossRef]
  36. Ende, H.; Zöttl, H. Effects of magnesium fertilizer on the vitality and nutrition of a European beech (Fagus sylvatica L.) stand in the Southern Black Forest of West Germany. Water Air Soil Pollut. 1990, 54, 561–566. [Google Scholar] [CrossRef]
  37. Xue, J.M.; Clinton, P.W.; Leckie, A.C.; Graham, J.D. Magnesium fertilizer, weed control and clonal effects on wood stiffness of juvenile Pinus radiata at two contrasting sites. Forest Ecol. Manag. 2013, 306, 128–134. [Google Scholar] [CrossRef]
  38. Ovington, J. The calcium and magnesium contents of tree species crown in close stands. New Phytol. 1959, 58, 164–175. [Google Scholar] [CrossRef]
  39. Tausz, M.; Trummer, W.; Wonisch, A.; Goessler, W.; Grill, D.; Jimenez, M.S.; Morales, D. A survey of foliar mineral nutrient concentrations of Pinus canariensis at field plots in Tenerife. Forest Ecol. Manag. 2004, 189, 49–55. [Google Scholar] [CrossRef]
  40. Blanco, J.A.; Imbert, J.B.; Castillo, F.J. Nutrient return via litterfall in two contrasting Pinus sylvestris forests in the Pyrenees under different thinning intensities. Forest Ecol. Manag. 2008, 256, 1840–1852. [Google Scholar] [CrossRef]
  41. Carlson, C.A.; Fox, T.R.; Allen, H.L.; Albaugh, T.J.; Rubilar, R.A.; Stape, J.L. Growth Responses of Loblolly Pine in the Southeast United States to Midrotation Applications of Nitrogen, Phosphorus, Potassium, and Micronutrients. Forest Sci. 2014, 60, 157–169. [Google Scholar] [CrossRef]
  42. Michopoulos, P.; Farmaki, L.; Thomaidis, I. Foliar status and factors affecting foliar and soil chemistry in a natural aleppo pine forest. J. Plant Nutr. 2017, 40, 1443–1452. [Google Scholar] [CrossRef]
  43. Pongrac, P.; Baltrenaite, E.; Vavpetic, P.; Kelemen, M.; Kladnik, A.; Budic, B.; Vogel-Mikus, K.; Regvar, M.; Baltrenas, P.; Pelicon, P. Tissue-specific element profiles in Scots pine (Pinus sylvestris L.) needles. Trees 2019, 33, 91–101. [Google Scholar] [CrossRef] [Green Version]
  44. Gernandt, D.S.; Lopez, G.G.; Garcia, S.O.; Liston, A. Phylogeny and classification of Pinus. Taxon 2005, 54, 29–42. [Google Scholar] [CrossRef] [Green Version]
  45. Cheng, W.E. Sylva Sinica; China Forestry Publishing House: Beijing, China, 1983; Volume 1. [Google Scholar]
  46. Zhao, S.; Wang, H. Division of breeding areas and improvement strategies for Pinus massoniana. J. Sichuan For. Sci. Technol. 1991, 12, 42–45. [Google Scholar]
  47. Tong, Z.; Fan, Y. Dividing the distribution area of Pinus taiwanensis based on climatic and ecologic factors. J. Cent.-South For. Colloge 1993, 13, 81–87. [Google Scholar]
  48. Wang, L.; Zhuo, Z. On the positional problem of the Pinus taiwanensis forest in the vegetation altitude belts of Mt. Lushan. Acta Phytoecol. Et Geobot. Sin. 1989, 13, 28–35. [Google Scholar]
  49. Li, M.; He, Z.; Jiang, L.; Gu, X.; Jin, M.; Chen, B.; Liu, J. Distribution pattern and driving factors of species diversity and phylogenetic diversity along altitudinal gradient on the south slope of Daiyun Mountain. Acta Ecol. Sin. 2020, 41, 1148–1157. [Google Scholar]
  50. Ye, J.; Yan, L.; Chen, M.; Li, Y.; Zheng, X.; Zhang, K.; Zhong, L.; Tang, N. Study on nutrient distribution in fast-growing, high-resistance and polysarcous Tugong pine in the Southeast of Guangxi. J. Shanxi Agric. Sci. 2016, 44, 364–368. [Google Scholar]
  51. Ma, Z.; Gao, S.; Yang, W.; Wu, F. Seasonal release characteristics of Ca, Mg and Mn of foliar litter of six tree species in subtropical evergreen broadleaved forest. Chin. J. Appl. Ecol. 2015, 26, 2913–2920. [Google Scholar]
  52. Grubb, P.J.; Turner, I.M.; Burslem, D.P. Mineral nutrient status of coastal hill dipterocarp forest and adinandra belukar in Singapore: Analysis of soil, leaves and litter. J. Trop. Ecol. 1994, 10, 559–577. [Google Scholar] [CrossRef]
  53. Angel, H.Z.; Priest, J.S.; Stovall, J.P.; Oswald, B.P.; Weng, Y.H.; Williams, H.M. Individual tree and stand-level carbon and nutrient contents across one rotation of loblolly pine plantations on a reclaimed surface mine. New Forest 2019, 50, 733–753. [Google Scholar] [CrossRef] [Green Version]
  54. Gomez-Rey, M.X.; Couto-Vazquez, A.; Gonzalez-Prieto, S.J. Age and thinning effects on elemental composition of Pinus pinaster and Pinus radiata needles. Iforest 2021, 14, 299–306. [Google Scholar] [CrossRef]
  55. Kainulainen, P.; Holopainen, J.K. Concentrations of secondary compounds in Scots pine needles at different stages of decomposition. Soil Biol. Biochem. 2002, 34, 37–42. [Google Scholar] [CrossRef]
  56. Jimenez, M.N.; Navarro, F.B. Monthly foliar-nutrient pattern in a semiarid Aleppo pine plantation five years after thinning. Forest Ecol. Manag. 2015, 343, 63–72. [Google Scholar] [CrossRef]
  57. Yalcin, I.E.; Ozyigit, I.I.; Dogan, I.; Demir, G.; Yarci, C. Determining Element Accumulations in Turkish Red Pine Used as a Bioindicator for Estimating of Existing Pollution on Both Sides of Bosphorus in Istanbul. Fresen Environ. Bull. 2020, 29, 4963–4972. [Google Scholar]
  58. Lopez-Serrano, F.R.; de las Heras, J.; Gonazalez-Ochoa, A.I.; Garcia-Morote, F.A. Effects of silvicultural treatments and seasonal patterns on foliar nutrients in young post-fire Pinus halepensis forest stands. Forest Ecol. Manag. 2005, 210, 321–336. [Google Scholar] [CrossRef]
  59. Segura, C.; Fernandez-Ondono, E.; Jimenez, M.N.; Navarro, F.B. Thinning affects the needlefall nutrient return to soil in a semiarid Aleppo pine afforestation while the nutrient dynamics remain unchanged. Forest Ecol. Manag. 2017, 405, 257–270. [Google Scholar] [CrossRef]
  60. Zhu, M.; Ye, G.; You, S.; You, L.; Bai, Y.; Gao, W. Caloric values and correlations of nutrient elements in three forestation species of a coastal sandy land. J. Zhejiang A F Univ. 2012, 29, 829–834. [Google Scholar]
  61. Chen, W.; Kou, L.; Jiang, L.; Gao, W.; Yang, H.; Wang, H.; Li, S. Short-term responses of foliar multi-element stoichiometry and nutrient resorption of slash pine to N addition in subtropical China. Chin. J. Appl. Ecol. 2017, 28, 1094–1102. [Google Scholar]
  62. Sun, Z.-G.; Chen, Q.; Li, X.-Z.; Lu, X.-W.; Chen, X.-Z.; Su, J.-W.; Liu, Y.-C.; Liu, Y.-G.; Huai, K.-Y. The Effect of Zinc, Boron and Magnesium on the Growth of Young Pinus kesiya var. langbianensis Forest. J. West China For. Sci. 2019, 48, 143–147. [Google Scholar]
  63. Sun, Y.; Wang, J.; Zhang, H.; Wang, J.; Wu, T.; Zhang, P. Variation in needle stoichiometric characters of Pinus thunbergii along a coastal-inlandgradient. Chin. J. Ecol. 2019, 38, 1662–1668. [Google Scholar]
  64. Tong, Z.; He, L.; Ou, Y.; Wang, Y. Nutrient Accumulation and Distribution Characteristics of Pinus yunnanensis Plantation in Central Yunnan Plateau. Guangxi For. Sci. 2019, 48, 46–50. [Google Scholar]
  65. Albaugh, J.M.; Blevins, L.; Allen, H.L.; Albaugh, T.J.; Fox, T.R.; Stape, J.L.; Rubilar, R.A. Characterization of Foliar Macro- and Micronutrient Concentrations and Ratios in Loblolly Pine Plantations in the Southeastern United States. South J. Appl. For. 2010, 34, 53–64. [Google Scholar] [CrossRef] [Green Version]
  66. Pereira, M.; Bassaco, M.V.M.; Motta, A.C.V.; Maeda, S.; Prior, S.A.; Marques, R.; Magri, E.; Bognola, I.A.; Gomes, J.B.V. Influence of industrial forest residue applications on Pinus taeda: Soil, litter, growth, nutrition, and wood quality characteristics. New Forest 2023, 54, 83–106. [Google Scholar] [CrossRef]
  67. Huang, D.L.; Gong, X.M.; Liu, Y.G.; Zeng, G.M.; Lai, C.; Bashir, H.; Zhou, L.; Wang, D.F.; Xu, P.A.; Cheng, M.; et al. Effects of calcium at toxic concentrations of cadmium in plants. Planta 2017, 245, 863–873. [Google Scholar] [CrossRef]
  68. Wen, J.H.; Tao, H.M.; Du, B.M.; Hui, D.F.; Sun, N.X.; Umair, M.; Liu, C.J. Plantations modified leaf elemental stoichiometry compared to the native shrub community in karst areas, Southwest of China. Trees 2021, 35, 987–999. [Google Scholar] [CrossRef]
  69. Rios, J.J.; Lochlainn, S.O.; Devonshire, J.; Graham, N.S.; Hammond, J.P.; King, G.J.; White, P.J.; Kurup, S.; Broadley, M.R. Distribution of calcium (Ca) and magnesium (Mg) in the leaves of Brassica rapa under varying exogenous Ca and Mg supply. Ann. Bot. 2012, 109, 1081–1089. [Google Scholar] [CrossRef]
  70. Tang, R.J.; Luan, S. Regulation of calcium and magnesium homeostasis in plants: From transporters to signaling network. Curr. Opin. Plant Biol. 2017, 39, 97–105. [Google Scholar] [CrossRef]
  71. Fyllas, N.M.; Patino, S.; Baker, T.R.; Nardoto, G.B.; Martinelli, L.A.; Quesada, C.A.; Paiva, R.; Schwarz, M.; Horna, V.; Mercado, L.M.; et al. Basin-wide variations in foliar properties of Amazonian forest: Phylogeny, soils and climate. Biogeosciences 2009, 6, 2677–2708. [Google Scholar] [CrossRef] [Green Version]
  72. Han, W.X.; Fang, J.Y.; Reich, P.B.; Woodward, F.I.; Wang, Z.H. Biogeography and variability of eleven mineral elements in plant leaves across gradients of climate, soil and plant functional type in China. Ecol. Lett. 2011, 14, 788–796. [Google Scholar] [CrossRef]
  73. Brown, G.; Luu, I.; O’Sullivan, G. Trace Metal Concentrations in Pine Needles at Varying Elevation in Proximity to Roadways in an Urban Environment. J. Environ. Prot. 2017, 8, 733–743. [Google Scholar] [CrossRef] [Green Version]
  74. Soethe, N.; Lehmann, J.; Engels, C. Nutrient availability at different altitudes in a tropical montane forest in Ecuador. J. Trop. Ecol. 2008, 24, 397–406. [Google Scholar] [CrossRef]
  75. Macek, P.; Klimes, L.; Adamec, L.; Dolezal, J.; Chlumska, Z.; de Bello, F.; Dvorskry, M.; Rehakova, K. Plant Nutrient Content Does Not Simply Increase with Elevation under the Extreme Environmental Conditions of Ladakh, NW Himalaya. Arct. Antarct. Alp. Res. 2012, 44, 62–66. [Google Scholar] [CrossRef] [Green Version]
  76. Reich, P.B.; Oleksyn, J. Global patterns of plant leaf N and P in relation to temperature and latitude. Proc. Natl. Acad. Sci. USA 2004, 101, 11001–11006. [Google Scholar] [CrossRef] [Green Version]
  77. Sunagawa, S.; Coelho, L.P.; Chaffron, S.; Kultima, J.R.; Labadie, K.; Salazar, G.; Djahanschiri, B.; Zeller, G.; Mende, D.R.; Alberti, A.; et al. Structure and function of the global ocean microbiome. Science 2015, 348, 1261359. [Google Scholar] [CrossRef] [PubMed]
Figure 1. Proportion of variance decomposition. Different color block length represents the interpretation rate of different factors to variation of traits. Vertical axis represents different traits, and horizontal axis represents different proportion.
Plants 12 00562 g001
Figure 2. Correlation with environmental factors of two species. (a) P. massoniana; (b) P. hwangshanensis. Pairwise comparisons of environmental factors are shown with a color gradient denoting Spearman’s correlation coefficients. * p < 0.05, ** p < 0.01, *** p < 0.001. The different colors of lines represent the significance between traits and environmental factors. The correlation coefficients between traits and environmental factors are expressed by lines of different thickness.
Plants 12 00562 g002
Figure 3. Distribution of the sampling points. Blue icons stand for P. massoniana, yellow icons stand for P. hwangshanensis.
Plants 12 00562 g003
Table 1. Ca and Mg concentrations in the needles of P. massoniana and P. hwangshanensis among populations (mg·g−1).
CaP. massonianaP. hwangshanensis
PopulationHJLSTHJLST
Mean4.00 ab4.01 b2.59 b5.62 a*3.39 b3.78 a2.85 a3.11 a2.97 a3.42 a
Median3.534.272.625.483.133.312.953.283.083.40
Variance3.965.060.280.651.381.770.420.380.910.76
SD1.992.250.530.811.181.330.650.610.950.87
Minimum1.741.101.494.731.772.181.571.911.882.46
Maximum8.388.223.537.085.095.943.623.814.265.19
CV49.77%56.08%20.60%14.38%34.72%35.18%22.71%19.74%32.05%25.41%
MgP. massonianaP. hwangshanensis
PopulationHJLSTHJLST
Mean0.92 c*1.41 a*1.07 bc1.13 abc1.32 ab*0.67 c1.09 a1.00 ab0.87 abc0.84 bc
Median0.921.370.931.021.380.681.130.920.790.89
Variance0.050.140.070.070.050.020.020.090.050.05
SD0.230.380.270.270.210.130.150.310.230.22
Minimum0.600.920.730.900.980.450.830.720.690.44
Maximum1.282.231.481.481.530.821.321.771.271.12
CV24.62%26.85%25.33%23.74%16.20%19.19%13.38%30.89%26.13%26.09%
Ca:MgP. massonianaP. hwangshanensis
PopulationHJLSTHJLST
Mean4.33 a2.75 b2.47 b*5.20 a*2.56 b*5.65 a2.60 c3.23 c3.45 bc4.22 b
Median3.522.992.394.892.275.272.743.163.344.22
Variance3.851.590.202.110.672.840.170.530.881.17
SD1.961.260.441.450.821.690.410.730.941.08
Minimum2.921.101.863.871.683.791.892.152.303.00
Maximum9.114.833.087.774.288.733.054.334.485.94
CV45.34%45.79%17.99%27.96%32.05%29.85%15.71%22.55%27.22%25.62%
SD = Standard Deviation, CV = Coefficient of Variance; S = Mt. Sanqingshan, L = Mt. Lushan, J = Mt. Jinggangshan, H = Mt. Huangshan, T = Mt. Tianmushan. Different lowercase letters (abc) after the numerical value indicate that the difference between populations reaches a 0.05 significant level. * It indicates that there is a significant difference between the two pines in the population.
Table 2. Pearson correlation coefficients between calcium and magnesium concentrations in the needles of P. massoniana and P. hwangshanensis.
PopulationSLJHT
P. hwangshanensis0.6640.5120.792 *0.5240.576
P. massoniana0.0120.713 *0.680 *0.4190.504
* p < 0.05.
Table 3. Foliage Ca and Mg concentrations of pine (Pinus) needles in previous reports.
SpeciesCountries and RegionsCa Concentration (mg·g−1)Mg Concentration (mg·g−1)
P. elliottiiChina, Fujian2.00.8 [60]
China, Jiangxi3.80.9 [61]
P. kesiya var. langbianensisChina, Yunnan1.91.4 [62]
P. massonianaChina, Sichuan6.81.3 [51]
P. thunbergiiChina, Shandong4.51.6 [63]
P. yunnanensisChina, Yunnan3.21.4 [64]
P. brutiaTurkey, Istanbul2.3~4.60.7~0.8 [57]
P. canariensisSpain, Tenerife9.11.5 [39]
P. halepensisSpain, Yeste/Calasparra7.0/7.52.7/2.0 [58]
Greece, Parnitha7.91.5 [42]
Spain, Granada2.40.2 [59]
Spain, Granada12.32.5 [56]
P. pinasterSpain, Galicia1.11.6 [54]
P. radiataSpain, Galicia3.60.9 [54]
P. sylvestrisFinland, Suonenjoki4.30.5 [55]
Lithuania, Neris4.91.2 [43]
P. taedaUSA, 11 Southern States1.81.0 [65]
USA, Texas2.8~4.01.8~2.3 [53]
USA, 8 southeastern States1.71.0 [41]
Brazil, Southern region1.80.5 [66]
Numbers in the square frame in the last column correspond to the references cited.
Table 4. The geographic locations of sampling populations in P. massoniana and P. hwangshanensis.
PopulationAbbreviationLongitude (°E)Latitude (°N)Site (plot) and Elevation (m)
P. massonianaP. hwangshanensis
Mt. Sanqingshan, JiangxiS118°00′~118°06′28°52′~28°57′300, 4001062, 1500
Mt. Lushan, JiangxiL115°50′~116°10′29°28′~29°45′300, 400, 500900, 1000, 1100
Mt. Jinggangshan, JiangxiJ113°39′~114°23′26°27′~26°40′300, 500, 600900, 1100, 1300
Mt. Huangshan, AnhuiH116°49′~118°59′29°13′~31°05′350, 450, 550900, 1100, 1200
Mt. Tianmushan, ZhejiangT118°36′~120°06′29°52′~30°55′340, 480, 5801200, 1400, 1500
Disclaimer/Publisher’s Note: The statements, opinions and data contained in all publications are solely those of the individual author(s) and contributor(s) and not of MDPI and/or the editor(s). MDPI and/or the editor(s) disclaim responsibility for any injury to people or property resulting from any ideas, methods, instructions or products referred to in the content.

