The Significance of Pulmonary Artery Size in Pulmonary Hypertension

Abstract
:1. Introduction
2. Methods
3. Pathophysiology
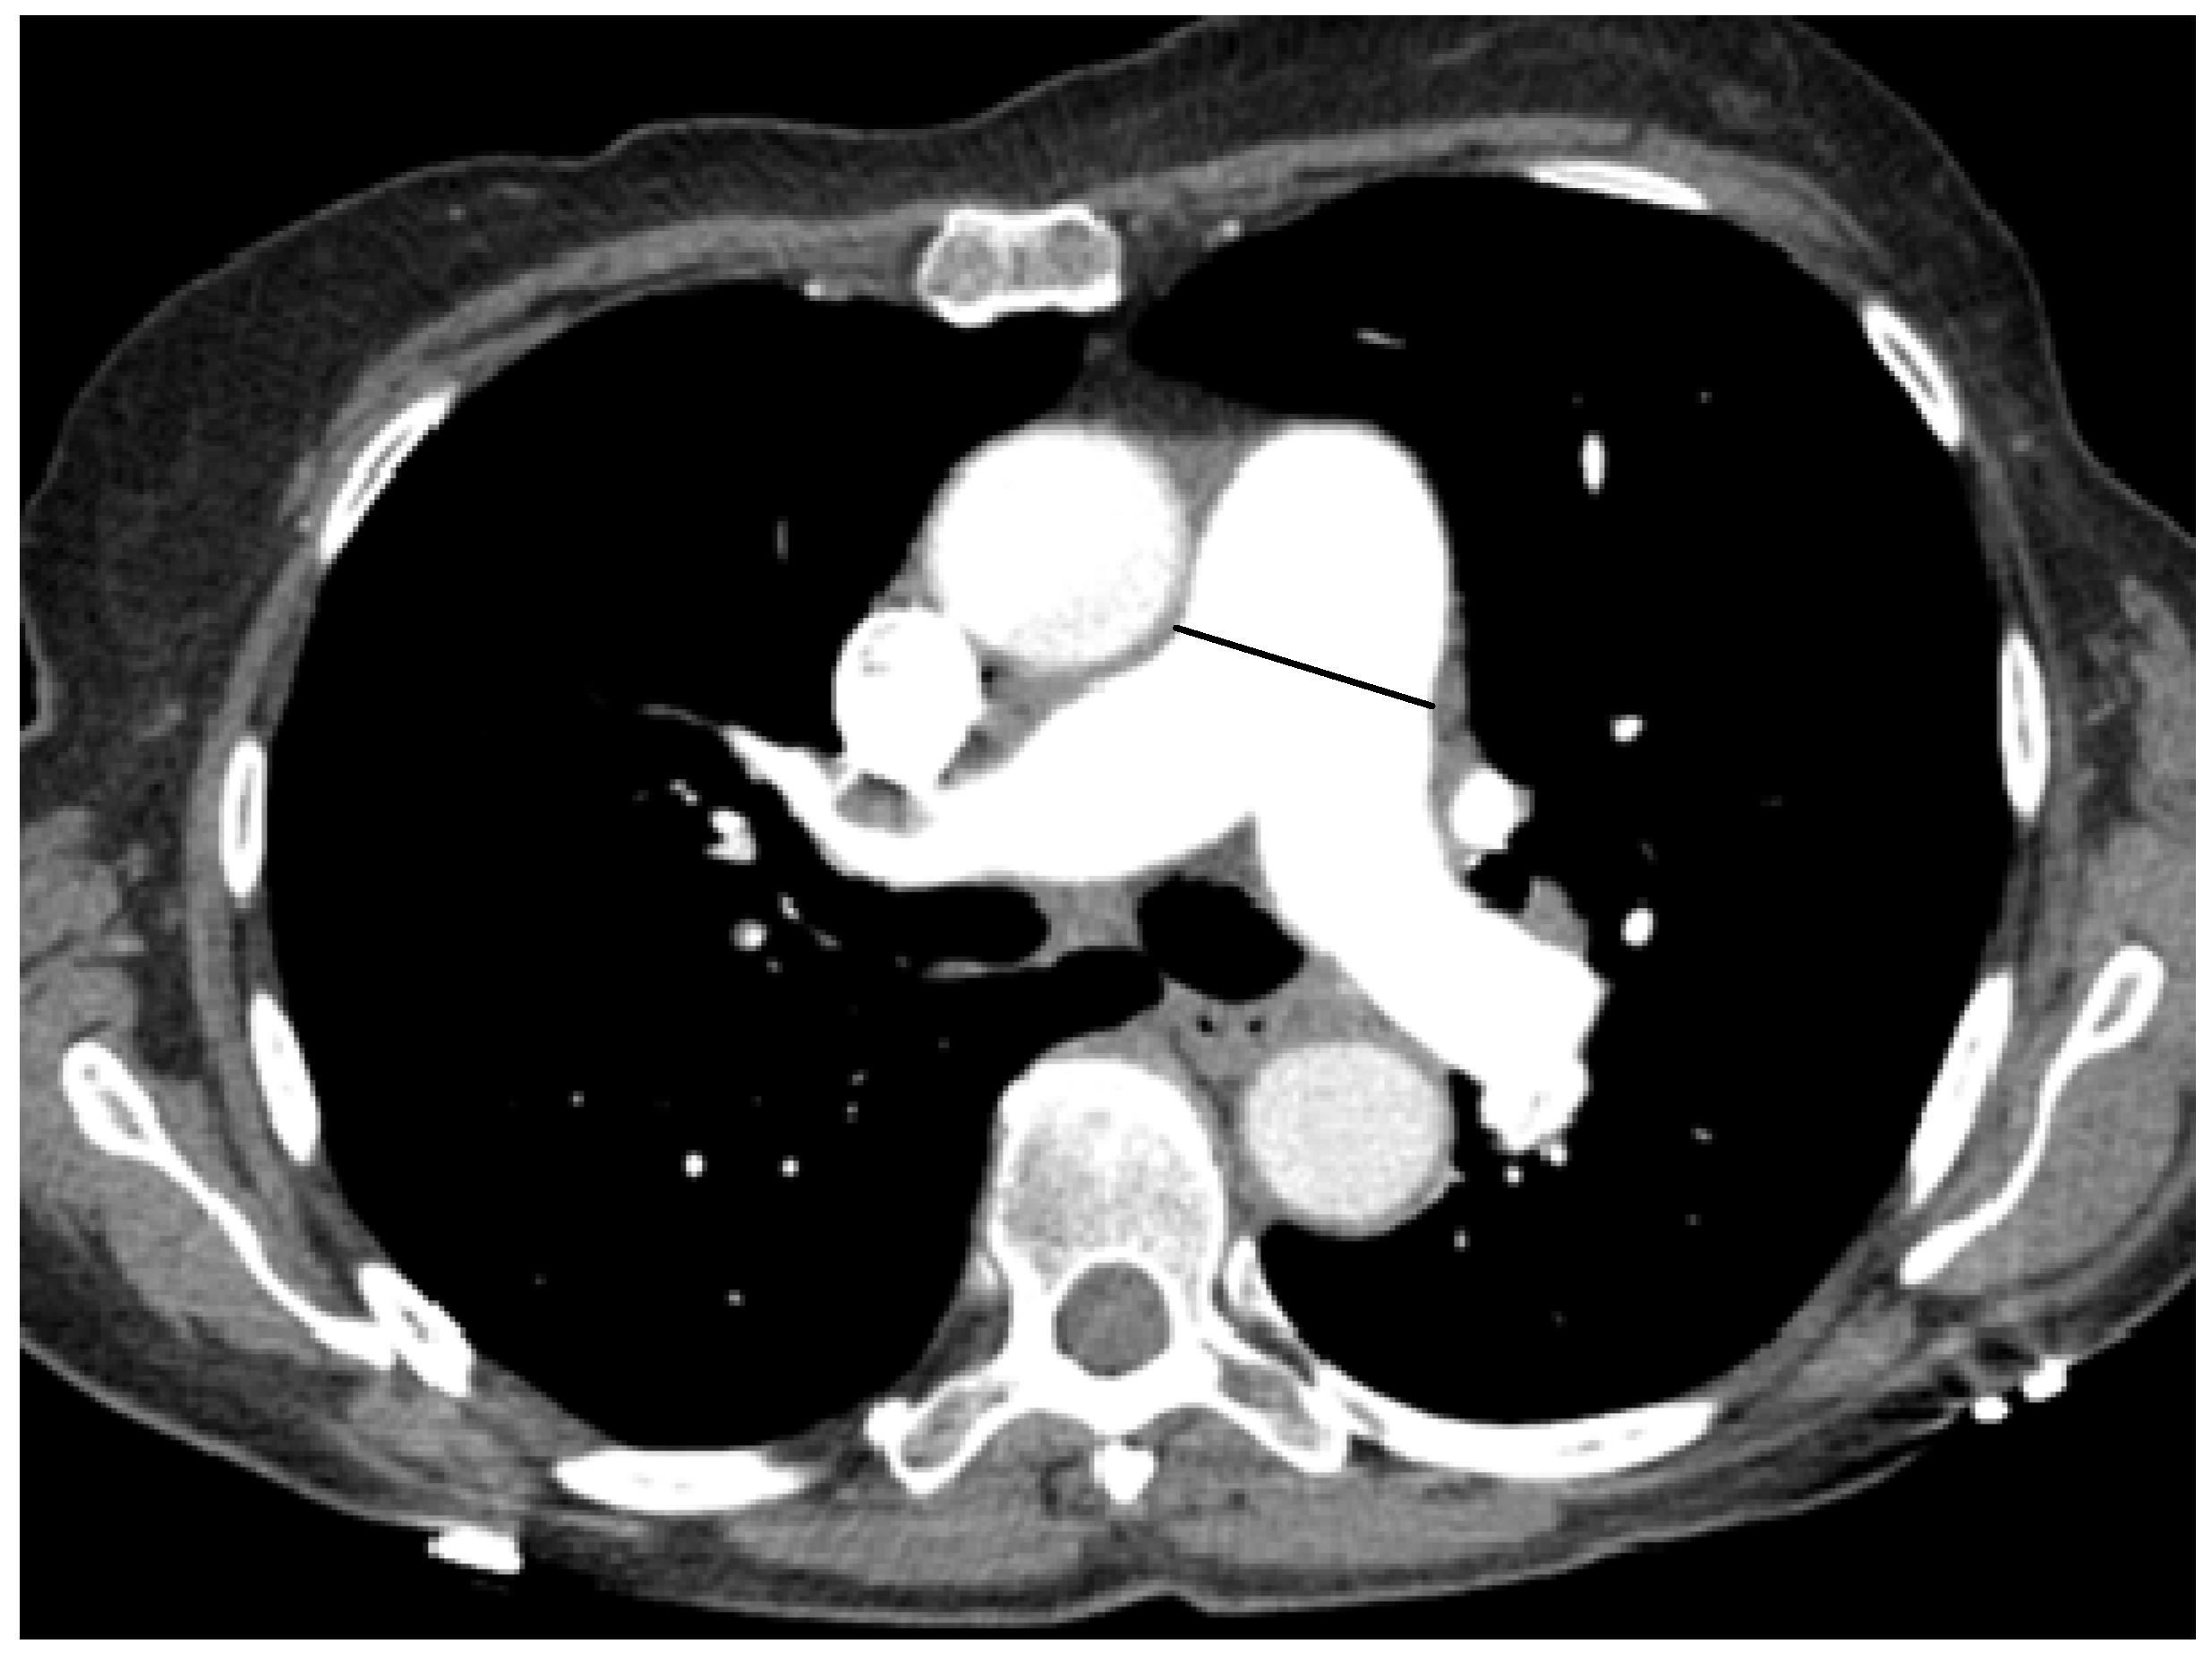
4. What Is the Normal Reference Value?

5. Correlation between PA Size and PH

| Studies | Patients | Measurement | Correlation or Operating Characteristics |
|---|---|---|---|
| Predominantly PH WHO group 1 | |||
| Edwards PD et al. 1998 [15] | 100 normal subjects 12 patients with PAH | Main PA in predicting PH (MPAP > 20 mmHg), cut-off 33.2 mm | sensitivity 58%, specificity 95% |
| Grubstein A et al. 2008 [26] | 38 patients with PH (primary PH, n = 20) 22 control | Main PA vs. PASP by echo Main PA vs. RHC | r = 0.43 r = 0.38 |
| Rajaram S et al. 2012 [30] | 81 patients with connective tissue disease | Main PA vs. MPAP PA/Ao ratio vs. MPAP Main PA in predicting PH (MPAP ≥ 25 mmHg), cut-off 29 mm PA/Ao ratio > 1 in predicting | r = 0.37 r = 0.43 sensitivity 59%, specificity 73%, AUC = 0.71 sensitivity 54%, specificity 74%, AUC = 0.73 |
| Predominantly PH WHO group 2 | |||
| Kuriyama et al. 1984 [17] | 32 patients with cardiopulmonary diseases (Most of the patients had cardiac disease, n = 25) 26 control | Main PA vs. MPAP Main PA in predicting PH (MPAP > 18 mmHg), cut-off 28.6 mm | r = 0.83 sensitivity 69%, specificity 100% |
| Burger IA et al. 2011 [10] | 100 patients -CAD assessment(60) -Dyspnea (40) with PH (n = 37) | Main PA in predicting PH (Echo RV/RA gradient ≥ 30 mmHg), cut-off 30 mm | sensitivity 78%, specificity 91%, PPV 83%, AUC = 0.85 |
| Predominantly PH WHO group 2 | |||
| Chan AL et al. 2011 [9] | 101 hospitalized patients (Most of the patients had cardiac disease, n = 70) | Main PA in predicting PH (MPAP ≥ 25 mmHg), cut-off 29 mm PA/Ao ratio > 0.84 in predicting PH | sensitivity 67.9%, specificity 56.3%, AUC = 0.68 sensitivity 79.2%, specificity 50%, AUC = 0.68 |
| Kam JC et al. 2013 [16] | 40 patients with left-sided cardiac disease | Main PA in predicting PH (MPAP ≥ 25 mmHg), cut-off 33.3 mm Cut-off < 27.3 | specificity 100%, PPV 100%, AUC = 0.95 sensitivity 100%, NPV 100% |
| Predominantly PH WHO group 3 | |||
| Haimovici et al. 1997 [25] | 55 patients, candidates for heart-lung transplantation -Chronic lung disease e.g., COPD, IPF (45) -PVD (10) | Main PA vs. MPAP Main PA/BSA vs. MPAP Left main PA vs. MPAP Left main PA/BSA vs. MPAP Main and left main PA/BSA vs. MPAP | r = 0.67 r = 0.66 r = 0.69 r = 0.71 r = 0.87 |
| Ng CS et al. 1999 [20] | 50 patients with cardiopulmonary diseases (Most of the patients had chronic lung disease, n = 33) | Main PA vs. MPAP PA/Ao ratio vs. MPAP Main PA diameter cut-off of 30mm in predicting PH (MPAP > 20 mmHg) PA/Ao >1 in predicting PH (MPAP >20mmHg) | r = 0.74 r = 0.74 sensitivity 68%, specificity 100%, PPV 100% sensitivity 70%, specificity 92%, PPV 96% |
| Tan RT et al. 1998 [23] | 36 patients with PH 9 control -Chronic lung disease, e.g., COPD, ILD (24)-PVD (12) | Main PA vs. MPAP Main PA in predicting PH (MPAP > 20 mmHg), cut-off 29 mm | r = 0.12 (NS) sensitivity 87%, specificity 89%, PPV 97% and sensitivity 84%, specificity 75%, PPV 95% in subgroup of parenchymal lung disease (n = 28) |
| Predominantly PH WHO group 3 | |||
| Iyer AS et al. 2014 [29] | 60 patients with COPD, referred for transplantation | Main PA vs. MPAP PA/Ao ratio vs. MPAP PA/Ao ratio vs. MPAPadjusting for age, race, sex, BMI, resting oxygen saturation, sleep apnea, congestive heart failure, and diabetes mellitus PA/Ao >1 in predicting PH (MPAP >25 mmHg) | r = 0.60 r = 0.56 r = 0.30 sensitivity 73%, specificity 84%, AUC = 0.83 |
| Predominantly PH WHO group 4 | |||
| Moore et al. 1988 [19] | 24 patients with primary PH and CTEPH | Main PA vs. MPAP | No correlation, r was not reported |
| Schmidt et al. 1996 [22] | 50 patients with CTEPH | Main PA vs. MPAP | r = 0.43 |
| Sanal S et al. 2006 [21] | 190 patients with acute pulmonary embolism | Main PA in predicting PH (Echo PASP ≥ 50 mmHg), cut-off 28.6 mm PA/Ao ratio > 1 in predicting PH | sensitivity 75%, specificity 75%, PPV 52% sensitivity 59%, specificity 82%, PPV 55% |
| Mixed PH groups | |||
| Abel E et al. 2012 [11] | 27 patients with PH defined as MPAP ≥ 25 mmHg | Main PA vs. MPAP PA/Ao ratio vs. MPAP | r = 0.53 r = 0.41 |
| Dornia C et al. 2012 [28] | 114 patients with PH defined as MPAP ≥ 25 mmHg 58 control with MPAP < 20 mmHg | Main PA in predicting PH (MPAP ≥ 25 mmHg), cut-off 29 mm PA/Ao ratio > 1 in predicting PH | sensitivity 93.9%, specificity 62.1%, PPV 82.9%, NPV 83.7%, AUC = 0.93 sensitivity 63.2%, specificity 93.1%, PPV 94.7%, NPV 56.3%, AUC = 0.88 |
| Mixed PH groups | |||
| Mahammdi A et al. 2013 [18] | 298 patients with PH defined as MPAP ≥ 25 mmHg 102 control with MPAP < 25 mmHg | Main PA vs. MPAP Main PA/BSA vs. MPAP PA/Ao ratio vs. MPAP Main PA in predicting PH (MPAP ≥ 25 mmHg), cut-off 31.5 mm PA/Ao ratio > 1 in predicting PH Combined Main PA > 29.5 and PA/Ao ratio > 1 | r = 0.51 r = 0.35 r = 0.54 sensitivity 52%, specificity 90% sensitivity 71%, specificity 76% AUC = 0.80 |
| Lange T et al. 2013 [31] | 78 patientsn = 52, MPAP ≤ 20 mmHg n = 26, MPAP 21–24 mmHg | Main PA vs. MPAP Main PA in predicting borderline PH, cut-off 29 mm | r = 0.49 sensitivity 77%, specificity 62%, PPV 50%, NPV 84%, AUC = 0.73 |
| Corson N et al. 2014 [13] | 175 patients with PH 16 patients without PH (by RHC) 114 normal (but no RHC) | Main PA vs. MPAP Main PA in predicting PH (MPAP ≥ 25 mmHg), cut-off 29 mm PA/Ao ratio >1 in predicting PH | r = 0.34 sensitivity 89%, specificity 83%, AUC = 0.96 sensitivity 89%, specificity 82%, AUC = 0.94 |
| Studies | Patients | Measurement | Correlation or Operating Characteristics |
|---|---|---|---|
| Zisman D et al. 2007 [24] | 65 patients with idiopathic pulmonary fibrosis | Main PA vs. MPAP Main PA/BSA vs. MPAP PA/Ao ratio vs. MPAP | r = 0.14 (NS) r = 0.13 (NS) r = 0.20 (NS) |
| Devaraj A et al. 2008 [27] | 77 patients With (group A, n = 30) Without (group B, n = 47) fibrotic lung disease | Group A Main PA vs. MPAP PA/Ao ratio vs. MPAP Group B Main PA vs. MPAP PA/Ao ratio vs. MPAP | r = 0.23(NS) r = 0.54 r = 0.67 r = 0.72 |
| Alhamad EH et al. 2011 [12] | 134 patients With ILD (group A, n = 100) Without ILD (group B, n = 34) | Group A Main PA vs MPAP PA/Ao ratio vs. MPAP Group B Main PA vs. MPAP PA/Ao ratio vs. MPAP Group A Main PA in predicting PH (MPAP ≥ 25 mmHg), cut-off 25 mm Group B Main PA in predicting PH (MPAP ≥ 25 mmHg), cut-off 31.6 mm | r = 0.30 r = 0.43 r = 0.70 r = 0.62 sensitivity 86%, specificity 41%, AUC = 0.65 sensitivity 47%, specificity 93%, AUC = 0.73 |
| Condliffe et al. 2011 [43] | 89 scleroderma CT within 3 months of RHC, n = 81 Subset of patients without ILD, n = 63 | Main PA vs MPAP PA/Ao ratio vs. MPAP No ILD, n = 63 Main PA vs. MPAP PA/Ao ratio vs. MPAP | r = 0.34 r = 0.42 r = 0.56 r = 0.61 |
| McCall RK et al. 2014 [32] | 48 scleroderma Without ILD (group A, n = 20) With ILD (group B, n = 28) FVC >70% (group C, n = 18) FVC <70% (group D, n = 16) | Group A Main PA vs. MPAP PA/Ao ratio vs. MPAP Group B Main PA vs. MPAP PA/Ao ratio vs. MPAP Group C Main PA vs MPAP PA/Ao ratio vs. MPAP Group D Main PA vs. MPAP PA/Ao ratio vs. MPAP Main PA in predicting PH (MPAP ≥ 25 mmHg), cut-off 30.8 mm | r = 0.68 r = 0.50 r = 0.70 r = 0.47 r = 0.69 r = 0.66 r = 0.42 (NS) r = −0.09 (NS) sensitivity 81%, specificity 87%, AUC = 0.86 |
6. Diagnostic Utility of PA Size
7. Clinical Utility
8. Summary
Author Contributions
Conflicts of Interest
References
- D'Alonzo, G.E.; Barst, R.J.; Ayres, S.M.; Bergofsky, E.H.; Brundage, B.H.; Detre, K.M.; Fishman, A.P.; Goldring, R.M.; Groves, B.M.; Kernis, J.T.; et al. Survival in patients with primary pulmonary hypertension. Results from a national prospective registry. Ann. Intern. Med. 1991, 115, 343–349. [Google Scholar]
- Benza, R.L.; Miller, D.P.; Barst, R.J.; Badesch, D.B.; Frost, A.E.; McGoon, M.D. An evaluation of long-term survival from time of diagnosis in pulmonary arterial hypertension from the REVEAL Registry. Chest 2012, 142, 448–456. [Google Scholar] [CrossRef] [PubMed]
- Galie, N.; Corris, P.A.; Frost, A.; Girgis, R.E.; Granton, J.; Jing, Z.C.; Klepetko, W.; McGoon, M.D.; McLaughlin, V.V.; Preston, I.R.; et al. Updated treatment algorithm of pulmonary arterial hypertension. J. Am. Coll. Cardiol. 2013, 62, D60–D72. [Google Scholar] [CrossRef] [PubMed]
- McLaughlin, V.V.; Archer, S.L.; Badesch, D.B.; Barst, R.J.; Farber, H.W.; Lindner, J.R.; Mathier, M.A.; McGoon, M.D.; Park, M.H.; Rosenson, R.S.; et al. ACCF/AHA 2009 expert consensus document on pulmonary hypertension a report of the American College of Cardiology Foundation Task Force on Expert Consensus Documents and the American Heart Association developed in collaboration with the American College of Chest Physicians; American Thoracic Society, Inc.; and the Pulmonary Hypertension Association. J. Am. Coll. Cardiol. 2009, 53, 1573–1619. [Google Scholar]
- Galie, N.; Hoeper, M.M.; Humbert, M.; Torbicki, A.; Vachiery, J.L.; Barbera, J.A.; Beghetti, M.; Corris, P.; Gaine, S.; Gibbs, J.S.; et al. Guidelines for the diagnosis and treatment of pulmonary hypertension: The Task Force for the Diagnosis and Treatment of Pulmonary Hypertension of the European Society of Cardiology (ESC) and the European Respiratory Society (ERS), endorsed by the International Society of Heart and Lung Transplantation (ISHLT). Eur. Heart J. 2009, 30, 2493–2537. [Google Scholar] [CrossRef] [PubMed]
- Epler, G.R.; McLoud, T.C.; Gaensler, E.A.; Mikus, J.P.; Carrington, C.B. Normal chest roentgenograms in chronic diffuse infiltrative lung disease. N. Engl. J. Med. 1978, 298, 934–939. [Google Scholar] [CrossRef] [PubMed]
- Zompatori, M.; Bna, C.; Poletti, V.; Spaggiari, E.; Ormitti, F.; Calabro, E.; Tognini, G.; Sverzellati, N. Diagnostic imaging of diffuse infiltrative disease of the lung. Respiration 2004, 71, 4–19. [Google Scholar] [CrossRef] [PubMed]
- McGoon, M.; Gutterman, D.; Steen, V.; Barst, R.; McCrory, D.C.; Fortin, T.A.; Loyd, J.E. Screening, early detection, and diagnosis of pulmonary arterial hypertension: ACCP evidence-based clinical practice guidelines. Chest 2004, 126, 14S–34S. [Google Scholar] [CrossRef] [PubMed]
- Chan, A.L.; Juarez, M.M.; Shelton, D.K.; MacDonald, T.; Li, C.S.; Lin, T.C.; Albertson, T.E. Novel computed tomographic chest metrics to detect pulmonary hypertension. BMC Med. Imag. 2011, 11, 7. [Google Scholar] [CrossRef]
- Burger, I.A.; Husmann, L.; Herzog, B.A.; Buechel, R.R.; Pazhenkottil, A.P.; Ghadri, J.R.; Nkoulou, R.N.; Jenni, R.; Russi, E.W.; Kaufmann, P.A. Main pulmonary artery diameter from attenuation correction CT scans in cardiac SPECT accurately predicts pulmonary hypertension. J. Nucl. Cardiol. 2011, 18, 634–641. [Google Scholar] [CrossRef] [PubMed]
- Abel, E.; Jankowski, A.; Pison, C.; Luc Bosson, J.; Bouvaist, H.; Ferretti, G.R. Pulmonary artery and right ventricle assessment in pulmonary hypertension: Correlation between functional parameters of ECG-gated CT and right-side heart catheterization. Acta Radiol. 2012, 53, 720–727. [Google Scholar] [CrossRef] [PubMed]
- Alhamad, E.H.; Al-Boukai, A.A.; Al-Kassimi, F.A.; Alfaleh, H.F.; Alshamiri, M.Q.; Alzeer, A.H.; Al-Otair, H.A.; Ibrahim, G.F.; Shaik, S.A. Prediction of pulmonary hypertension in patients with or without interstitial lung disease: Reliability of CT findings. Radiology 2011, 260, 875–883. [Google Scholar] [CrossRef] [PubMed]
- Corson, N.; Armato, S.G., 3rd.; Labby, Z.E.; Straus, C.; Starkey, A.; Gomberg-Maitland, M. CT-based pulmonary artery measurements for the assessment of pulmonary hypertension. Acad. Radiol. 2014, 21, 523–530. [Google Scholar]
- Devaraj, A.; Wells, A.U.; Meister, M.G.; Corte, T.J.; Wort, S.J.; Hansell, D.M. Detection of pulmonary hypertension with multidetector CT and echocardiography alone and in combination. Radiology 2010, 254, 609–616. [Google Scholar] [CrossRef] [PubMed]
- Edwards, P.D.; Bull, R.K.; Coulden, R. CT measurement of main pulmonary artery diameter. Br. J. Radiol. 1998, 71, 1018–1020. [Google Scholar] [CrossRef] [PubMed]
- Kam, J.C.; Pi, J.; Doraiswamy, V.; Elnahar, Y.; Abdul-Jawad, S.; DeBari, V.A.; Klukowicz, A.J.; Shamoon, F.; Miller, R.A. CT scanning in the evaluation of pulmonary hypertension. Lung 2013, 191, 321–326. [Google Scholar] [CrossRef] [PubMed]
- Kuriyama, K.; Gamsu, G.; Stern, R.G.; Cann, C.E.; Herfkens, R.J.; Brundage, B.H. CT-determined pulmonary artery diameters in predicting pulmonary hypertension. Invest. Radiol. 1984, 19, 16–22. [Google Scholar] [CrossRef] [PubMed]
- Mahammedi, A.; Oshmyansky, A.; Hassoun, P.M.; Thiemann, D.R.; Siegelman, S.S. Pulmonary artery measurements in pulmonary hypertension: The role of computed tomography. J. Thorac. Imag. 2013, 28, 96–103. [Google Scholar] [CrossRef]
- Moore, N.R.; Scott, J.P.; Flower, C.D.; Higenbottam, T.W. The relationship between pulmonary artery pressure and pulmonary artery diameter in pulmonary hypertension. Clin. Radiol. 1988, 39, 486–489. [Google Scholar] [CrossRef] [PubMed]
- Ng, C.S.; Wells, A.U.; Padley, S.P. A CT sign of chronic pulmonary arterial hypertension: the ratio of main pulmonary artery to aortic diameter. J. Thorac. Imag. 1999, 14, 270–278. [Google Scholar] [CrossRef]
- Sanal, S.; Aronow, W.S.; Ravipati, G.; Maguire, G.P.; Belkin, R.N.; Lehrman, S.G. Prediction of moderate or severe pulmonary hypertension by main pulmonary artery diameter and main pulmonary artery diameter/ascending aorta diameter in pulmonary embolism. Cardiol. Rev. 2006, 14, 213–214. [Google Scholar] [CrossRef] [PubMed]
- Schmidt, H.C.; Kauczor, H.U.; Schild, H.H.; Renner, C.; Kirchhoff, E.; Lang, P.; Iversen, S.; Thelen, M. Pulmonary hypertension in patients with chronic pulmonary thromboembolism: chest radiograph and CT evaluation before and after surgery. Eur. Radiol. 1996, 6, 817–825. [Google Scholar] [CrossRef] [PubMed]
- Tan, R.T.; Kuzo, R.; Goodman, L.R.; Siegel, R.; Haasler, G.B.; Presberg, K.W. Utility of CT scan evaluation for predicting pulmonary hypertension in patients with parenchymal lung disease. Medical College of Wisconsin Lung Transplant Group. Chest 1998, 113, 1250–1256. [Google Scholar]
- Zisman, D.A.; Karlamangla, A.S.; Ross, D.J.; Keane, M.P.; Belperio, J.A.; Saggar, R.; Lynch, J.P., 3rd.; Ardehali, A.; Goldin, J. High-resolution chest CT findings do not predict the presence of pulmonary hypertension in advanced idiopathic pulmonary fibrosis. Chest 2007, 132, 773–779. [Google Scholar] [CrossRef] [PubMed]
- Haimovici, J.B.; Trotman-Dickenson, B.; Halpern, E.F.; Dec, G.W.; Ginns, L.C.; Shepard, J.A.; McLoud, T.C. Relationship between pulmonary artery diameter at computed tomography and pulmonary artery pressures at right-sided heart catheterization. Massachusetts General Hospital Lung Transplantation Program. Acad. Radiol. 1997, 4, 327–334. [Google Scholar]
- Grubstein, A.; Benjaminov, O.; Dayan, D.B.; Shitrit, D.; Cohen, M.; Kramer, M.R. Computed tomography angiography in pulmonary hypertension. Israel Med. Assoc. J. 2008, 10, 117–120. [Google Scholar]
- Devaraj, A.; Wells, A.U.; Meister, M.G.; Corte, T.J.; Hansell, D.M. The effect of diffuse pulmonary fibrosis on the reliability of CT signs of pulmonary hypertension. Radiology 2008, 249, 1042–1049. [Google Scholar] [CrossRef] [PubMed]
- Dornia, C.; Lange, T.J.; Behrens, G.; Stiefel, J.; Muller-Wille, R.; Poschenrieder, F.; Pfeifer, M.; Leitzmann, M.; Manos, D.; Babar, J.L.; et al. Multidetector computed tomography for detection and characterization of pulmonary hypertension in consideration of WHO classification. J. Comput. Assist. Tomo. 2012, 36, 175–180. [Google Scholar] [CrossRef]
- Iyer, A.S.; Wells, J.M.; Vishin, S.; Bhatt, S.P.; Wille, K.M.; Dransfield, M.T. CT scan-measured pulmonary artery to aorta ratio and echocardiography for detecting pulmonary hypertension in severe COPD. Chest 2014, 145, 824–832. [Google Scholar] [CrossRef] [PubMed]
- Rajaram, S.; Swift, A.J.; Capener, D.; Elliot, C.A.; Condliffe, R.; Davies, C.; Hill, C.; Hurdman, J.; Kidling, R.; Akil, M.; et al. Comparison of the diagnostic utility of cardiac magnetic resonance imaging, computed tomography, and echocardiography in assessment of suspected pulmonary arterial hypertension in patients with connective tissue disease. J. Rheumatol. 2012, 39, 1265–1274. [Google Scholar] [CrossRef] [PubMed]
- Lange, T.J.; Dornia, C.; Stiefel, J.; Stroszczynski, C.; Arzt, M.; Pfeifer, M.; Hamer, O.W. Increased pulmonary artery diameter on chest computed tomography can predict borderline pulmonary hypertension. Pulmonary Circulation 2013, 3, 363–368. [Google Scholar] [CrossRef] [PubMed]
- McCall, R.K.; Ravenel, J.G.; Nietert, P.J.; Granath, A.; Silver, R.M. Relationship of main pulmonary artery diameter to pulmonary arterial pressure in scleroderma patients with and without interstitial fibrosis. J. Comput. Assist. Tomo. 2014, 38, 163–168. [Google Scholar] [CrossRef]
- Truong, Q.A.; Massaro, J.M.; Rogers, I.S.; Mahabadi, A.A.; Kriegel, M.F.; Fox, C.S.; O'Donnell, C.J.; Hoffmann, U. Reference values for normal pulmonary artery dimensions by noncontrast cardiac computed tomography: The Framingham Heart Study. Circulation 2012, 5, 147–154. [Google Scholar] [PubMed]
- Edwards, W.D.; Edwards, J.E. Clinical primary pulmonary hypertension: Three pathologic types. Circulation 1977, 56, 884–888. [Google Scholar] [CrossRef] [PubMed]
- Heath, D.; Smith, P.; Gosney, J.; Mulcahy, D.; Fox, K.; Yacoub, M.; Harris, P. The pathology of the early and late stages of primary pulmonary hypertension. Br. Heart J. 1987, 58, 204–213. [Google Scholar] [CrossRef] [PubMed]
- Simonneau, G.; Gatzoulis, M.A.; Adatia, I.; Celermajer, D.; Denton, C.; Ghofrani, A.; Gomez Sanchez, M.A.; Krishna Kumar, R.; Landzberg, M.; Machado, R.F.; et al. Updated clinical classification of pulmonary hypertension. J. Am. Coll. Cardiol. 2013, 62, D34–D41. [Google Scholar] [CrossRef] [PubMed]
- Mitsumori, L.M.; Wang, E.; May, J.M.; Lockhart, D.W.; Branch, K.R.; Dubinsky, T.J.; Shuman, W.P. Triphasic contrast bolus for whole-chest ECG-gated 64-MDCT of patients with nonspecific chest pain: Evaluation of arterial enhancement and streak artifact. Am. J. Roentgenol. 2010, 194, W263–W271. [Google Scholar] [CrossRef]
- Weininger, M.; Barraza, J.M.; Kemper, C.A.; Kalafut, J.F.; Costello, P.; Schoepf, U.J. Cardiothoracic CT angiography: current contrast medium delivery strategies. Am. J. Roentgenol. 2011, 196, W260–W272. [Google Scholar] [CrossRef]
- Mortimer, A.M.; Singh, R.K.; Hughes, J.; Greenwood, R.; Hamilton, M.C. Use of expiratory CT pulmonary angiography to reduce inspiration and breath-hold associated artefact: contrast dynamics and implications for scan protocol. Clin. Radiol. 2011, 66, 1159–1166. [Google Scholar] [CrossRef] [PubMed]
- Karazincir, S.; Balci, A.; Seyfeli, E.; Akoglu, S.; Babayigit, C.; Akgul, F.; Yalcin, F.; Egilmez, E. CT assessment of main pulmonary artery diameter. Diagn. Interv. Radiol. 2008, 14, 72–74. [Google Scholar] [PubMed]
- Kovacs, G.; Berghold, A.; Scheidl, S.; Olschewski, H. Pulmonary arterial pressure during rest and exercise in healthy subjects: A systematic review. Eur. Resp. J. 2009, 34, 888–894. [Google Scholar] [CrossRef]
- Nevsky, G.; Jacobs, J.E.; Lim, R.P.; Donnino, R.; Babb, J.S.; Srichai, M.B. Sex-specific normalized reference values of heart and great vessel dimensions in cardiac CT angiography. Am. J. Roentgenol. 2011, 196, 788–794. [Google Scholar] [CrossRef]
- Condliffe, R.; Radon, M.; Hurdman, J.; Davies, C.; Hill, C.; Akil, M.; Guarasci, F.; Rajaram, S.; Swift, A.J.; Wragg, Z.; et al. CT pulmonary angiography combined with echocardiography in suspected systemic sclerosis-associated pulmonary arterial hypertension. Rheumatology 2011, 50, 1480–1486. [Google Scholar] [CrossRef] [PubMed]
- Darin Carabenciov, T.L.; Burger, C.; Lee, A. Correlation Between CT Measured Pulmonary Artery Size And Invasively Confirmed Pulmonary Artery Pressures. Am. J. Resp. Crit. Care Med. 2012, A1886. [Google Scholar]
- Wells, J.M.; Washko, G.R.; Han, M.K.; Abbas, N.; Nath, H.; Mamary, A.J.; Regan, E.; Bailey, W.C.; Martinez, F.J.; Westfall, E.; et al. Pulmonary arterial enlargement and acute exacerbations of COPD. N. Engl. J. Med. 2012, 367, 913–921. [Google Scholar] [CrossRef] [PubMed]
- Matsushita, S.; Matsuoka, S.; Yamashiro, T.; Fujikawa, A.; Yagihashi, K.; Kurihara, Y.; Nakajima, Y. Pulmonary arterial enlargement in patients with acute exacerbation of interstitial pneumonia. Clin. Imag. 2014, 38, 454–457. [Google Scholar] [CrossRef]
- Boerrigter, B.; Mauritz, G.J.; Marcus, J.T.; Helderman, F.; Postmus, P.E.; Westerhof, N.; Vonk-Noordegraaf, A. Progressive dilatation of the main pulmonary artery is a characteristic of pulmonary arterial hypertension and is not related to changes in pressure. Chest 2010, 138, 1395–1401. [Google Scholar] [CrossRef] [PubMed]
- Zylkowska, J.; Kurzyna, M.; Florczyk, M.; Burakowska, B.; Grzegorczyk, F.; Burakowski, J.; Wieteska, M.; Oniszh, K.; Biederman, A.; Wawrzynska, L.; et al. Pulmonary artery dilatation correlates with the risk of unexpected death in chronic arterial or thromboembolic pulmonary hypertension. Chest 2012, 142, 1406–1416. [Google Scholar] [CrossRef] [PubMed]
© 2014 by the authors; licensee MDPI, Basel, Switzerland. This article is an open access article distributed under the terms and conditions of the Creative Commons Attribution license (http://creativecommons.org/licenses/by/3.0/).
Share and Cite
Ussavarungsi, K.; Whitlock, J.P.; Lundy, T.A.; Carabenciov, I.D.; Burger, C.D.; Lee, A.S. The Significance of Pulmonary Artery Size in Pulmonary Hypertension. Diseases 2014, 2, 243-259. https://doi.org/10.3390/diseases2030243
Ussavarungsi K, Whitlock JP, Lundy TA, Carabenciov ID, Burger CD, Lee AS. The Significance of Pulmonary Artery Size in Pulmonary Hypertension. Diseases. 2014; 2(3):243-259. https://doi.org/10.3390/diseases2030243
Chicago/Turabian StyleUssavarungsi, Kamonpun, Joseph P. Whitlock, Taylor A. Lundy, Ivan D. Carabenciov, Charles D. Burger, and Augustine S. Lee. 2014. "The Significance of Pulmonary Artery Size in Pulmonary Hypertension" Diseases 2, no. 3: 243-259. https://doi.org/10.3390/diseases2030243
APA StyleUssavarungsi, K., Whitlock, J. P., Lundy, T. A., Carabenciov, I. D., Burger, C. D., & Lee, A. S. (2014). The Significance of Pulmonary Artery Size in Pulmonary Hypertension. Diseases, 2(3), 243-259. https://doi.org/10.3390/diseases2030243