Abstract
Today, there is a great need for greener urban freight transportations due to their ever-increasing environmental impact. The planet’s climate has been significantly affected as the temperature is constantly rising and extreme weather events are occurring more and more often. Aiming to reduce the environmental impact of freight transportation in urban areas, an advanced vehicle routing and scheduling system for improving urban freight transportations, has been developed. This paper presents the functionality of the advanced system, while also analyzing its subsystems and demonstrating its use in a case study. The system is provided as an integrated cloud-based software to support the needs of logistics companies, in order to efficiently schedule their deliveries and perform the routing of their vehicles. The utilized multi-objective algorithm produces solutions that minimize either the distribution cost or the environmental emissions or a combination of these parameters. An application of the system is performed for validation purposes, concerning the comparison of the system’s results with corresponding real-life data provided by a medium-sized logistics company. The results of the testing reveal its significant contribution to the reduction of the environmental impact of the company’s distribution services.
1. Introduction
The change of people’s way of life over time has resulted, in a relatively short period of time, in the great increase of the population of the cities. At the same time, the population of rural areas has greatly decreased. This, of course, has dramatically increased the need to distribute goods in and out of urban areas. A fleet of trucks of smaller or larger capacity is required to carry out this transportation. However, the large number of these trucks circulating in urban areas has exacerbated the already heavy traffic load due to private vehicles and public transport that serve the transportation of citizens [1]. Along with the rapid growth of urbanization, big cities have attracted a lot of interest because they help increase productivity in a country’s economy. Following the trend of growing urban populations and developing urban areas, the number of businesses and industries that move to urban environments and are located in metropolitan areas is continuously increasing [2]. In addition, the population in cities is demanding and consuming an ever-growing volume of goods. This has resulted in an increasing need for goods to move in and out of cities in a sustainable and efficient way, especially in large cities and, according to many research studies, this is going to be one of the main challenges faced by humanity in the near future [3,4].
Urban freight transportation is a key part of the traffic problem that exists in cities, which is directly related to the quality of life of consumers both in terms of time and cost of travel (urban transportation) but also in terms of ensuring availability and quality of goods in stores (freight transportation). The management of urban freight transportation involves many parts, including producers, traders, distributors, logistics companies, storage companies, transportation companies, and ultimately consumers [5]. The end result is that, in most cities, daily traffic congestion is created which is a major problem for urban freight transportation which represents the last mile in the modern supply chains. Unfortunately, this situation is constantly deteriorating despite efforts to address it. In fact, various researchers have proposed emission minimization-focused algorithms, but none of them have been applied in a vehicle routing and scheduling software [6,7,8,9].
The ever-increasing urbanization, and especially the need to supply cities, has led to a number of problems, the most important of which are [2,4,10,11]:
- The increase in transport costs due to more fuel consumption and possible increase in labor costs.
- The use of a larger number of smaller vehicles, due to the small width of roads within cities, as the regular flow of deliveries must be maintained despite congestion, especially during peak hours.
- The low reliability regarding the timely and generally smooth distribution of goods.
- The significant contribution of transport to the increase of environmental pollution, including the increase of the greenhouse effect.
- The noise pollution from the operation of the heavy engines of the trucks having as a consequence the, in many cases, daily annoyance of the locals. Unfortunately, only a few European cities, thanks to the existence of historic centers, have provided areas of pure residence where the passage of vehicles is prohibited.
- The obstruction of the movement of other public or private vehicles, especially when deliveries are made during the day and in places where the roads are quite narrow.
In fact, transport is responsible for almost 30% of total carbon dioxide emissions in the European Union, of which 72% comes from road transport. Of this percentage, 60.7% comes from pollutants emitted by cars, 11.9% from light trucks, 26.2% from heavy vehicles, trucks, and buses and 1.2% from motorcycles [12]. In addition to road transportation, there are also various other sectors that are greatly responsible for CO2 emissions, such as construction, manufacturing, and air and sea transportations [13,14,15,16]. However, in most of these sectors, it is way more challenging to reduce CO2 emissions compared to the road transportation sector as the needed measures are more costly and difficult to enforce. Therefore, in this research we have focused on reducing the CO2 emission of road transportation by developing an advanced vehicle routing and scheduling system for reducing environmental emissions. The analysis of these data has led the leaders of the European Union to set strict limits on emissions to the car industry and in case of non-compliance to impose severe fines, which in many cases exceed two billion euros. The European Union aims to reduce transport emissions by 60% by 2050 from 1990 levels [17]. The world’s population is growing by about 81 million people a year, according to the World Bank, which is directly reflected in consumption and mobility needs [18]. In addition, the volume of road transport will increase by 300% by 2050 in Eurasia [19].
The combined effects of these problems are economic and social, to the extent that they not only reduce the efficiency of urban freight transportation but also increase its cost, while reducing the quality of life of citizens and causing a serious impact on their health. Given that the vast majority of consumers of final products are located in urban areas, the need of effective urban freight transportation with the aid of advanced systems, such as vehicle routing, delivery scheduling, warehouse management, waste collection, recycling, and reverse logistic systems, demands increased attention. Optimizing road transport through the development of digital tools and processes will drastically reduce costs and emissions, while trucks will no longer remain at the border for long periods of time. Utilizing the potential of advanced vehicle routing and scheduling systems, with the use of multi-objective algorithms that can be adjusted to minimize emissions or distribution costs can lead to a significant improvement of the distribution services of logistics companies. However, closer cooperation is needed with all stakeholders to take advantage of the use of such transportation systems.
It is, therefore, obligatory for regulatory pressures, such as the ones set by the European Union (EU) to be imposed in the form of specific measures by the authorities on the various supply companies, such as rules relating to the establishment of lanes and timetables, the level of emissions from trucks, the conditions for access to roads companies can also use the location of terminals. Such strict policies, as the ones that are being set by the European Union, are beginning to be applied worldwide aiming for a great reduction of the environmental impact of urban freight transportation. Most of these policies are set on a strategic level and include the presentation of the current situation, its comparison with future goals that they set, and, finally, a demonstration of measures that need to be taken in order to achieve the goals. As technology rapidly evolves, these strategic policies may be further aided by the use of advanced systems as humanity can be aided by advanced tools that can facilitate daily tasks. In fact, today, we are in the era of digital transformation where cities are becoming increasingly smart, and many complicated activities can be simplified with the use of advanced systems and methods [20,21]. All of these facts create a great opportunity for reducing the environmental impact of daily activities, especially those activities that have a huge impact, such as urban freight transportation.
The scheduling of deliveries and the routing of vehicles has been and continues to be an intractable problem to this day. This problem is of great importance for businesses because, on the one hand, it affects the cost of distribution and therefore the overall business performance and on the other hand, many companies are becoming more environmentally sensitive and interested in lowering their environmental footprint. However, the task of vehicle routing and scheduling is not always an easy task. On the contrary, it can become very complicated as various factors and parameters need to be taken into account when performing vehicle routing and scheduling. To perform this task, researchers, for many years, have studied the Vehicle Routing Problem (VRP) and its variations.
According to the research of Konstantakopoulos et al. (2020) [22], among the variants of the VRP that are most commonly addressed by researchers and practitioners, are the time windows (VRPTW) and the simultaneous pickups and deliveries (VRPSPD). Concerning the VRPTW, customers indicate a time slot in which the vehicle may start serving the customer. On the other hand, in the VRPSPD, in every stage of the distribution, the goods on board cannot exceed the vehicle’s capacity; thus, pickups and deliveries are only permitted when there is available space. These two variants are the ones that we focus on in the current research, as they cover the needs of most logistics companies. In addition to these two variants, several other static parameters, such as other variants of the VRP, as well as other dynamic parameters, may be considered and, therefore, increase the complexity of the route scheduling process.
It should be noted that there is a research gap and also absence of targeted algorithms and tools for vehicle routing and scheduling software in urban areas with these areas being, in fact, the ones that are mostly polluted by road transportations. Additionally, the vast majority of the available tools only focus on the reduction of the service cost without taking into account the environmental impact of the activities. There have been various studies that clearly demonstrate both the economic and environmental impacts of urban freight transportation, and it becomes clear that, today, more than ever, there is a great need for reducing their environmental impact [23,24]. The planet, as noted by many scientists, is revenging on us and is getting increasingly warm due to the greenhouse gas emissions, while humanity also has to deal with more frequent extreme weather phenomena.
At the same time, city logistics companies, operating in urban areas and in a highly competitive environment, have to manage many conflicting delivery scheduling goals, such as lower delivery costs, higher customer satisfaction, compliance with laws and regulations, and lower environmental impact. In fact, city logistics, being the means over which freight distribution can occur in urban areas, require the efficient movement of urban freight, while at the same time mitigating externalities that may jeopardize the achievement of their objectives. City logistics are strongly related but not limited to urban freight transportation, as it is one of their key activities, but also provide a plethora of services for efficient movement of goods from production to consumption. In addition, in urban areas, where city logistics take place, strict time constraints apply and the data change dynamically and, therefore, the routing of vehicles and the scheduling of deliveries becomes even more challenging, especially when the environmental impact parameter is involved. Transportation and distribution of products are some of the most important activities of city logistics, while, if we also take into account the fact that the largest percentage of logistics costs of a commercial or industrial enterprise is due to transportation and distribution, the importance of vehicle fleet management and optimal routing becomes even more evident.
Therefore, due to the nature of urban freight transportation, the utilization of software and systems tends to become a necessity in order to effectively perform vehicle routing and scheduling tasks. In fact, it has been found that the use of computer systems for vehicle routing and scheduling, especially in cases where more than 10 vehicles are needed, usually leads to cost reductions between 10% and 20% [25]. These reductions can be further increased if utilizing vehicle routing and scheduling algorithms that focus on specific optimization parameters. Finally, it should be noted that besides reducing the cost of the distribution services of logistics companies, computer systems could also focus on other parameters, such as the minimization of the distance travelled and the truck emissions.
Thus, aiming to close the research gap and to contribute on the research field of vehicle routing and scheduling under emission restriction constraints, we developed an advanced system. More specifically, the objective of this paper is to present a vehicle routing and scheduling system developed for reducing the environmental impact of urban freight transportations. For this reason, the functionality of the system is presented, and a case study of its application at a medium sized logistics company is analyzed. In the remainder of the paper, we present our solution for achieving reduced environmental emissions in urban freight transportations. More specifically, Section 2 presents the system our team developed, as well as its architectural elements and its functionality. Afterwards, Section 3 presents our case study concerning an application of the developed system, for validation purposes, concerning the comparison of the system’s results with corresponding real-life data provided by a medium-sized logistics company. Finally, Section 4 is the conclusions section of our paper where we discuss the results of our research, we indicate the research and the system’s limitations, and, finally, we present our future goals.
2. The Urban Freight Transportation System
To achieve more effective and less pollutive urban freight transportations, an advanced system for vehicle routing and scheduling has been developed in the context of a research project co-funded by Greece and the European Union. This system operates in a cloud environment and it is offered as a service to potentially interested companies in order to efficiently plan their deliveries and perform the routing of their vehicles based on various parameters, such as time-windows, distribution costs, and environmental emissions. The system uses advanced methods to solve vehicle routing and scheduling problems, taking into account a plethora of constraints [26,27]. The main goal, however, in the research project’s context, is to minimize the environmental impact of urban freight transports. Therefore, the novelty of the system is that can be used by city logistics companies to facilitate their distribution tasks as it provides them with all needed tools for an efficient movement of goods, while also mitigating externalities, such as strict time windows, distribution costs, and emissions.
The system solves the static routing problem, where deliveries are scheduled to meet the delivery times requested by customers, taking into account traffic congestion data and using forecasting methods and speed models. It also solves the dynamic routing problem, where deliveries are dynamically scheduled and routes are recalculated based on real-time traffic congestion data provided by online services that use knowledge-based methods to collect, analyze, and configure data.
A set of metaheuristics algorithms addressing the vehicle routing and scheduling functions were initially evaluated and different traffic congestion avoidance strategies were considered to calculate the best delivery schedules and optimal routes for both of the aforementioned alternatives [22]. In addition, in order to accurately calculate transit times on urban road networks, urban expressways and road networks leading to urban areas, various forecasting methods and forecasting techniques were evaluated, aiming to select the most efficient ones that could be applied to the system [28]. Finally, a set of multi-objective metaheuristic algorithms were integrated into the system to solve both the static and the dynamic versions of the problem. The different vehicle routing and scheduling results that may be created by the system, based on the objective the company decides to focus on, can be seen in Section 3 of this paper, which presents a cost minimization, as well as an environmental emissions minimization scenario.
2.1. System’s Architecture
The system operates in a cloud environment, including all the main elements shown in Figure 1.
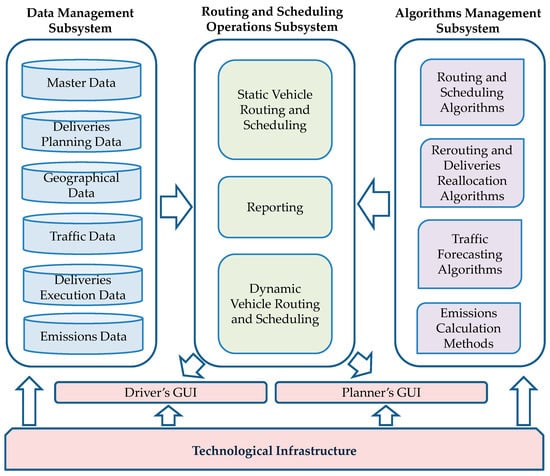
Figure 1.
The system’s architectural elements.
It is essentially an advanced system for the routing of vehicles and scheduling of deliveries in urban areas, operating in the cloud and taking advantage of cloud computing. The users of the system can be logistics companies or even other companies that offer goods distribution services in urban areas. The system’s functionality and the incorporated algorithms can assist companies to effectively schedule their deliveries and supports the creation of greener distribution services, as routes are calculated taking into account the CO2 emissions of the various plans. The main elements of the system are the data management subsystem, the routing and scheduling operations subsystem, and the algorithms management subsystem. In addition, the system has a graphical user interface (GUI) for the planner (the person who is responsible for the preparation of the delivery plans) and a user interface for the drivers (the persons who are responsible for the execution of deliveries). Finally, the technological infrastructure of the system is of great importance, as it includes all the databases, programming languages, and interfaces with companies’ systems and services used for the development of the cloud-based system.
2.2. The Subsystems
The system includes three subsystems, as presented in Figure 1.
- Data Management Subsystem
It comprises all the data that are necessary for the operation of the system, i.e., master data (drivers, depots, vehicles), deliveries planning data (orders and points of delivery to be scheduled), geographical data (the data used by the algorithms for customer geocoding and vehicle routing), traffic data (the data related with the traffic congestion which are used for traffic forecasting and the calculation of the most effective vehicle routes), deliveries execution data (the result of the algorithms run, the schedules, and routes, as well as the status of the deliveries reported by the drivers), and, finally, emissions data, including all the assumptions and metrics for the calculation of CO2 emission of every route and plan. This subsystem is technically designed to exchange data with the company’s other systems, using appropriate interfaces. More specifically, this system sends all the aforementioned types of data to the algorithms management subsystem for feeding the routing and scheduling, as well as the traffic forecasting algorithms and for calculating the costs and emissions. Additionally, the data management subsystem sends the master, deliveries planning and deliveries execution data to the routing and scheduling operations subsystem in order for it to create the deliveries schedules and the reports. We focused on minimizing CO2 emissions as they are the principal greenhouse gas that is emitted from motor vehicles. Greenhouse gas emissions also include nitrous oxide (6.2%), methane (17.3%), and fluorinated gases (2.1%), but their contribution to the climate change is not as significant as CO2 (74.4%), which accounts for around three quarters of total emissions [29].
- Algorithms Management Subsystem
This subsystem includes the various algorithms for the vehicle routing and scheduling of deliveries. These algorithms have been developed by our team for the needs of the specific cases (emissions and distribution cost minimization) the system deals with. More specifically, the implemented algorithm for creating the initial schedule of deliveries belongs to the metaheuristics category and, more specifically, is a genetic algorithm (GA) based on the nondominated sorting genetic algorithm II (NSGA-II), proposed by (Deb et al., 2002) [30]. The proposed GA has the ability, to deal with multiple objectives, i.e., cost and environmental emissions minimization. The algorithm is initially fed with a population of solutions (parents) that are combined for creating new solutions (children). In each iteration, the solutions of both sets (parents and children) are evaluated according to cost and emissions, and the best solutions are used as parents in the next iteration.
More specifically, multiple metaheuristic algorithms have been proposed over the years for addressing the variants of the VRP. Initially, taboo search algorithms and Large Neighborhood Search algorithms were implemented and offer high quality solution. Over the years, however, genetic and evolutionary algorithms seem to attract the interest of researchers. Moreover, similar genetic and evolutionary algorithms, which consider the same variants with the current research, have been developed by researchers [31,32] and offer optimal solutions in benchmark instances, and that is the main reason that the specific algorithm was selected for integration in the proposed system. On the other hand, exact algorithms were not implemented in our system as they cannot handle routing cases with the amount of logistics companies’ daily orders (more than 800) due to their tremendously increased computational time [33]. Heuristic algorithms, were also excluded, in spite of the minimum computational time needed, as they lose in terms of quality of provided solutions. Therefore, metaheuristics, and, more specifically, genetic algorithms, were the category of algorithms that were selected to be implemented in our system as they offer the best trade-off between solution quality and computational time.
A sample case presenting the way that these algorithms deal with multiple objectives is shown in Figure 2. Such an algorithm is thoroughly presented and analyzed by Konstantakopoulos et al. (2020) [26].
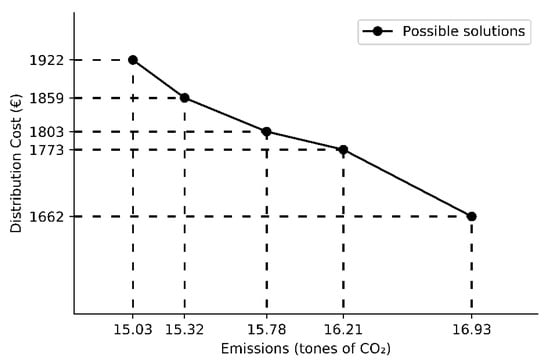
Figure 2.
The way of dealing with multiple objectives.
The multi-objective algorithm can offer multiple solutions, which correspond to different plans of routes and schedules of deliveries. The main advantage of the multi-objective algorithm is that each solution can in no case be considered better than the others as for meeting all the objectives. More specifically, when comparing multiple solutions, as shown in Figure 2, a decrease in the one objective (either cost or emissions), is combined with a simultaneous increase in the second objective. Through this approach, and by offering multiple plans, logistics companies have the opportunity to select the solution that better meets their needs. The system’s algorithms are used both for the static version of the problem (Routing and Scheduling Algorithms), as well as the dynamic version of the problem (vehicles rerouting and deliveries ad-hoc reallocation), and receives appropriate data from the data management subsystem. In addition, the system incorporates a traffic forecasting algorithm for traffic congestion and travel times calculations, based on historical data provided by the data management subsystem. Moreover, this subsystem includes the emission calculation methods, based on vehicle types, traveling hours, waiting hours, and vehicle speeds that are provided by the data management subsystem. The calculation of emissions can assist the decision of the final plan that reduces transportation costs and CO2 emissions. Finally, the algorithms management subsystem sends the results that occur from running the algorithms to the routing and scheduling operations subsystem in order for it to create the deliveries schedules and the reports.
- Routing and Scheduling Operations Subsystem
It includes all the operations used by the system’s users in order to effectively prepare the routes and schedules, while also taking into account the minimization of total transportation cost, as well as the minimization of environmental emissions. This subsystem uses all the appropriate data from the Data Management Subsystem and also calls appropriate algorithms from the Algorithms Management Subsystem. Essentially, it functions based on the functionality for static and dynamic routing and scheduling, which is presented in Section 2.3.
2.3. System’s Functionality
Using the developed advanced vehicle routing and scheduling system, companies can upload data related to the orders (delivery points, delivery times, time windows, etc.), as well as data related to the fleet (drivers, vehicles, capacity, etc.). The system can then combine the above with historical traffic data. The use of historical data leads, in the first phase, to a statistical estimation of traffic and also enables the routing of vehicles and the creation of the initial delivery schedule. This original schedule is then returned to logistics companies and ends up in the navigation devices the company vehicles are equipped with.
Therefore, after the initial schedule has been created, the transfer of products from logistics companies to customers is able to begin. However, during the delivery to the server of the logistics company or even during the execution of deliveries, new data may arrive and require modifications to the routes of the vehicles. These data can be order cancellations, time window changes, vehicle mechanical failures, and unexpected out-of-company events, such as real-time traffic problems or even extraordinary weather conditions, that can occur while driving. In this case, and only when necessary, the system can implement rerouting and update the navigation devices used by the drivers, so that the respective driver can change either his course or his delivery plan. Thus, based on the above, it becomes clear that the system needs to be able to receive both static and dynamic data to process them and, if necessary, decide to perform changes in the delivery plan.
Concerning the static vehicle routing and scheduling, the system creates vehicle routes based on the original delivery schedules taking into account constraints, such as time windows and road accessibility. These restrictions should not be violated and planning should be done in parallel with truck routing. Static routing uses geographic data, such as maps and a road network, from data providers. Concerning the dynamic vehicle routing and scheduling, the system creates new routes and reschedules deliveries each time the system user (company) reports a problem or a schedule change is required. For the dynamic routing, the real-time position and the current state of each vehicle is monitored by receiving their position from the truck global positioning systems (GPS). Additionally, real-time data about road traffic, road blocks and the position of other vehicles in the transport network are provided by a traffic data providing company whose application programming interfaces (APIs) have been integrated into the system. Finally, the system dynamically checks the feasibility of routes, as well as possible violations of time windows, depending on the condition of the trucks and the traffic congestion.
Figure 3 represents the main workflow of the system’s functionality that has been analyzed in this Section.
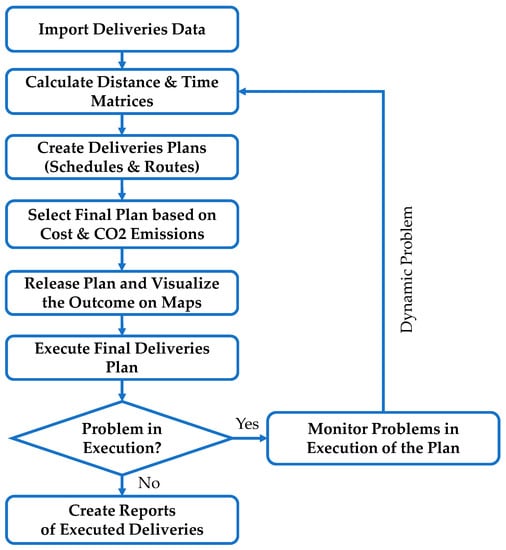
Figure 3.
The workflow of system’s operation.
The way the system works is by creating an initial schedule of deliveries and then make changes when needed. Initially the company imports deliveries data, and the system calculates the distance and time matrices of all delivery points. In the next step, the system creates various deliveries plans and enables the selection of the most appropriate one based on the selected objective (cost or emissions minimization). The distribution cost and the CO2 emissions are calculated for every proposed delivery plan and the company can then select the plan that better fits its needs. Distance, vehicle loads, and time windows are also taken into account by the vehicle routing and scheduling algorithm and the CO2 emissions are calculated based on Equation (1) in Section 3 of this paper. Finally, after selecting the appropriate plan, the outcome is visualized on maps and the execution of deliveries is able to begin. All the aforementioned steps are part of the initial static routing of vehicles. However, during the execution of deliveries, in case there are problems, such as order cancelations, road blocks, or other extraordinary events, a rerouting service may be needed in order to reschedule the deliveries. Therefore, the system needs to monitor in real time the execution of deliveries and, when needed, perform the dynamic routing and scheduling. This ability of the system to deal with the dynamic vehicle routing problem is essential when dealing with urban freight transportations where extraordinary events are more likely to occur and continuous real-time monitoring and rerouting of vehicles becomes a necessity.
Both the static and dynamic variants of the problem are commonly faced by most of the logistics companies delivering goods in urban areas, and the effective solution of the problem is crucial for their effective and efficient distribution operations. Cost reduction is not the only objective of the system as the CO2 emissions reduction is also taken into account by the planners, in order to make their decisions for the daily routes and schedules. Utilizing tailor-made algorithms and advanced functionality, the system can help companies to deliver the orders in the most cost-effective way, while at the same time ensuring that the routes are planned in such a way as to ensure sustainability, environmental friendliness, and the least possible impact on the microclimate of cities.
3. Case Study: An Application of the UFT System at a Medium-Sized Greek Logistics Company
Aiming to validate whether the developed advanced vehicle routing and scheduling system offers added value to logistics companies’ services, the system was tested in real-life conditions. Therefore, we contacted a well-known medium-sized logistics company and, after showcasing the system’s functionality, we agreed to demonstrate and tests the system, using real-life orders of the company. The selected company operates in Greece and is an active distributor of a variety of products. It is a rapidly growing medium-sized enterprise in the peripheral unit of the city of Thessaloniki. The distribution center is located in privately owned facilities of 2600 sqm in the Nea Redestos suburb of Thessaloniki.
More specifically, the products that the company distributes belong to the field of tobacco, food and beverages, novelties, cosmetics, supermarket, and telecommunication products, thus facilitating its customers who now only need to turn to a single supplier to meet most of their needs. The company has for sale more than 3000 different products and serves a total of 1280 customers, with about 800 orders served on a daily basis. The company executes deliveries 324 days a year, and its policy is to execute its orders on the same day they are placed. The way the company creates its daily delivery schedules is a result of years of experience in the field of logistics services. The company was founded in 1947 and, for many decades, operated as a small tobacco sales station in the eastern suburbs of Thessaloniki. In 1993, the company set out a new strategy to expand the provided services, increasing its clientele, as well as its distributed products. Afterwards, in 1997, the company built larger and more functional warehouses in Nea Redestos, Thessaloniki, and moved its headquarters there. This is also the current location of the company’s warehouses.
Essentially, based on the years of experience it has, the company creates its deliveries by evaluating its needs and utilizing the existing knowledge on the issue of vehicle routing and deliveries scheduling. As such, the company has divided the entire city of Thessaloniki, as well as some of the areas around it, which are included in its distribution network, into 18 zones. Based on these zones, that are presented in Figure 4, the company manually calculates its daily delivery schedules.
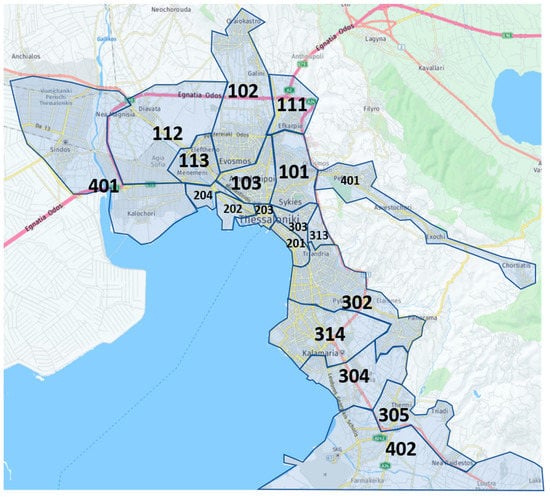
Figure 4.
The company’s distribution network (18 zones).
More specifically, each morning, the customer service team of the company gets into contact with the customers and receives their daily orders. Once the order is registered, the pricing, collection and routing procedures proceed. Concerning the routing procedure, each time an order is placed, the postal code of the customer is searched, and, based on where the customer is located, the order is categorized in a specific delivery pool. Then, when all of the daily orders are collected and categorized, the delivery scheduler starts the creation of the delivery routes by adding 3 to 5 orders per route taking into account the zones, the capabilities of the vehicle fleet, e.g., available trucks, drivers, truck capacities, and time windows.
Therefore, if an order cannot be added into a specific route due to its size, the delivery scheduler needs to find another zone that is close to the zone of the order and makes an effort to add it into a route from that specific zone. In addition, some of the areas are included in more than one zone due to their size. It becomes clear, however, that this method of vehicle routing results in a not optimal execution of the deliveries, as well as a not very efficient utilization of the trucks and drivers of the company.
It is obvious, however, that since the company enables customers to receive the order within just a few hours from the moment of its placement in the system, there are several difficulties in what has to do with the distribution of products. With this company policy, the problem of storage and availability of funds is essentially transferred from customers to suppliers. In fact, the increasing frequency of orders leads to a reduction in their size, thus changing the collection process from complete units (e.g., pallets) to smaller units (e.g., pieces) while also creating a need for more deliveries and smaller time windows. In addition, as the company does not have an advanced vehicle routing and delivery scheduling system, delays, unnecessary routes, and inefficient utilization of the vehicles’ payload are often observed. Of course, all this ultimately leads to a significant environmental impact from the distribution processes as the company’s vehicles move for much longer time periods and emit a significant amount of air pollutants.
Moreover, a scenario of even greater complexity is created in cases of distributing fragile, luxury or also large-size items, that are in fact a significant amount of the products offered by the company. These types of orders are commonly needed to be prioritized and, in many cases, create problems to the scheduling and execution of the delivery routes. At the same time, due to living in an economic period where, for reasons of liquidity and security, small points of sale maintain minimal stocks, the delivery of orders with delays or errors creates serious problems and friction points with the customers. Therefore, aiming to reduce the environmental impact of its activities and in general improve the offered distribution services in order to achieve higher customer satisfaction and more efficient operations, the company decided to test the advanced vehicle routing and scheduling system we developed. Specifically, the company provided us with real-life data of a specific day, presented in two data sheets with the first one presenting order data and the second one with real-life data that were generated based on the execution of the day’s deliveries and can be seen in Table 1.

Table 1.
Provided real-life data.
The system was then utilized on a pilot basis for the vehicle routing and scheduling of these specific orders. In order to feed data to the system, we utilized Table 1’s order data that were provided by the company. More specifically, we created a data sheet based on those data and uploaded it to the system’s server. We could now visualize all the delivery addresses on the map and locate each and every order’s address, as seen in Figure 5. In addition, we could also click on any order address and view the order’s information, including the customer code, the delivery time window, the total weight, and the volume of the order (Figure 5). Having the ability to visualize all the daily orders on map could be very useful for the vehicle routing and scheduling. In fact, even if not willing to use our software for the routing of vehicles, the logistics company could perform its existing method of routing in a way more efficient way. Potentially, the company could deliver the exact same orders within less routes achieving a greater fleet utilization and reducing the environmental impact of its deliveries. At the same time, in case of unpredicted road events, such as road accidents, roadblocks, extreme traffic congestion, or even order cancelations, the company could utilize the map visualization service of our system and be able to view the order points and their related data on the map and decide whether specific orders need to be canceled or delivered via other routes.
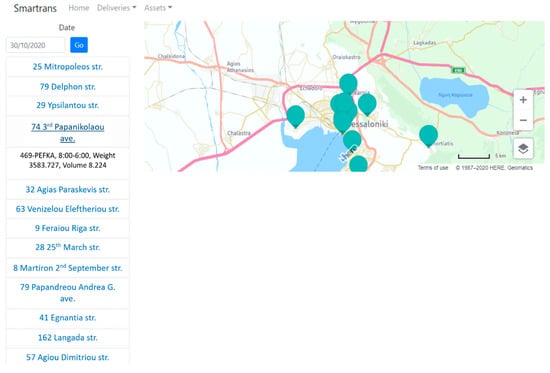
Figure 5.
Visualization of orders and order data.
All these valuable aids of the map visualization service of all the daily orders and the data related to them become even more beneficial when considering that the delivery scheduler of the company needs to deal with more than 800 orders on a daily basis. This huge amount of orders needed to be delivered essentially makes the created delivery schedule, very inelastic. Therefore, the added value of the visualization service of our system could potentially lead to the easier overcoming of any problems occurring during deliveries.
After the visualization of the orders on map, we used the routing service of our system in order to perform the vehicle routing and scheduling. The system created a full delivery schedule for the orders to be delivered in the same day and assigned them to specific routes. As we can see in Figure 6 (top-left part), which presents 3 of the created routes, the system has assigned a specific vehicle (plate number), a specific driver (driver name), and has also calculated the total distance needed to be traveled in order to deliver the orders. Additionally, the system presents us also with the suggested route start time and the total number of orders included in the route. We can also observe that each route has been assigned with a different color (Figure 6—top part) and also that, by clicking on one of the routes, we can get additional information about it. More specifically, we can see the delivery points on map, as well as the order code, the customer name, the time window, the address, the estimated time of arrival, the weight, the volume, and the delivery status of each order (Figure 6—bottom-right part).
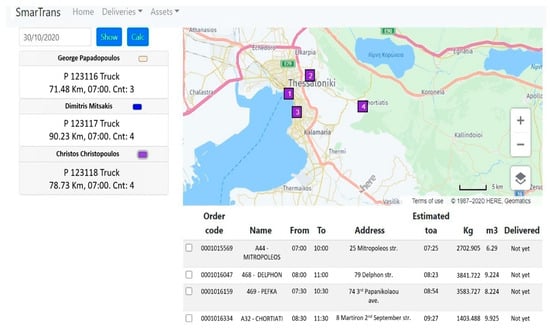
Figure 6.
Delivery schedule and routes.
The system also enables the company to make any required changes, when needed. For example, if one order is canceled the company can click the check box next to the specific order and remove it from the scheduled route. Additionally, if unpredicted events occur, the company can move an order to a different vehicle route or even, if needed, recalculate some of the routes. This added flexibility of the delivery schedule is extremely important for companies that mainly have to deal with a huge amount of daily orders and highly unpredictable events. Most notably, in cases of roadblocks, road accidents or situations with extreme traffic congestion without the use of the vehicle routing and scheduling system, some products included in the order would have been returned to the company’s warehouse since their deliveries could not be executed. This would happen as the method used by the company is not flexible and does not utilize real time data, and, at the same time, a new routing of the vehicles would be very time consuming; thus, the orders would not be able to be sent within the time windows.
However, the use of the vehicle routing and scheduling system would enable a quick creation of a new routing schedule of the deliveries while also taking into account the road blocks or the traffic congestion in real time. Therefore, all orders would be successfully completed, and the environment would not be burdened by unnecessary unsuccessful vehicle routes.
Finally, we performed various calculations based on the results generated with the use of the vehicle routing and scheduling system, by setting it to minimize the environmental emissions. We then decided to compare these results with the corresponding results of the real-life data, as seen in Table 2, in order to evaluate the effectiveness of the vehicle routing and scheduling system.
Table 2.
Calculations based on the real-life data provided by the logistics company.
As seen in Table 2, having implemented the advanced routing system for the same number of orders, we found out that its use presented a plethora of improved results, and, if it had been originally used for the vehicle routing and scheduling, it would have been highly beneficial for the company. More specifically, the same number of orders could have been delivered with 8.6% less routes, 18% less service time, and 21% less kilometers per route. In addition, the time needed for the routing of vehicles is extremely reduced (95.3%) and could enable a more flexible delivery schedule. All these factors could greatly improve both the quality of distribution services offered by the logistics company, as well as the customer’s satisfaction.
Furthermore, besides improving the efficiency of deliveries and increasing customer satisfaction, the use of the advanced vehicle routing and scheduling system could also have a significant impact on environmental emissions related to the transportation of its products. Specifically, utilizing the data from the real-life execution of the orders, as well as from the system’s results, the daily CO2 emissions of the logistics company’s distribution services were calculated by using Equation (1). This way of calculating the total CO2 emissions is integrated into the routing and scheduling functionality of the system.
For our calculations, we estimated a 20% of empty running truck routes and used the data presented in Table 2. Therefore, the CO2 emission factors are 98.5 for the real-life scenario and 90.8 for the system’s scenario according to Reference [34].
Total CO2 emissions = Number of routes × average transport weight × average transport distance × average CO2-emission factor per tone-km.
Thus, for the specific day’s orders, according to Equation (1), the CO2 emissions from the distribution services based on the real-life data were calculated to be 20.65 tn of CO2. However, the emissions based on the system’s results were found to only be 15.03 tn of CO2. Therefore, 5.62 fewer tons of CO2 were going to be emitted (27.17% reduction). In an annual basis, assuming 324 working days per year, the use of the routing and scheduling system could result in a reduction of emissions by 1820.88 tons of CO2.
Moreover, in order to present a more real-life scenario that concerns most logistics companies, we also run the system’s vehicle routing and scheduling services by using a second objective for our multi-objective algorithm. We decided to focus on minimizing distribution costs and found out that the emissions, while not as much as in our first scenario that was focused on the minimization of emissions, could once again be significantly reduced. Any company interested in using our system has the ability to choose whether to minimize the distribution costs, the environmental emissions, or even choose another solution that is proposed by the system that tries to balance the aforementioned objectives. The case of minimizing environmental emissions, while not being the most common one, has gained significant popularity amongst logistics companies over the last years as many logistics companies are becoming increasingly concerned about the environmental footprint of their services. At the same time, these companies also want to present a more environmentally friendly image to the public and therefore do not always aim at minimizing their distribution costs but, instead, decide to sacrifice some profit in order to achieve greener operation.
More specifically, the cost minimization scenario resulted in the creation of 176 routes with an average vehicle load of 11.979 tons, an average travelled distance of 95.22 km and a CO2 emission factor equal to 84.3. This scenario is the one that mostly meets the needs of logistics companies as most of them aim to minimize their distribution costs while also satisfying the requirements and needs of customers. In this scenario, the emissions based on the system’s results were found to be 16.93 tn of CO2 or 3.72 fewer tons of CO2 based (18.02% reduction). In an annual basis, assuming 324 working days per year, this scenario could result in a reduction of emissions by 1205.28 tons of CO2. Both in the emissions minimization and the cost minimization scenarios, there is a significant reduce of CO2 emissions. In order to more clearly demonstrate the environmental impact of the reduced amount of CO2 emissions, in Table 3, we demonstrate the equivalency of various activities that could result in the same amount of emissions, as well as some activities that would be needed in order to overcome the impact of these emissions [35].
Table 3.
Equivalent activities corresponding to the specific amount of reduced CO2 emissions.
Based on the results of Table 3, it becomes clear that, even in the cost minimization scenario where the focus is not on reducing emissions, there is a significant reduction of the environmental impact of the case company’s distribution activities. This impact can be further reduced when setting the emissions reduction as the objective of the system. In order to demonstrate how significant is the application of our system for a yearly base, we calculated all the equivalents that are presented in Table 3. Based on these calculations, it can be understood that, by only implementing the system to a single company for a period of one year, there is a dramatic reduction in CO2 emissions equaling to the yearly emissions of 357 vehicles or 191 houses. In fact, the tons of waste (562) that need to be recycled in order to achieve the same reduction of emissions is more than the 1/3 of the total daily recycling in Greece [36]. Moreover, the trees needed to be grown for 10 years are equivalent to 100 hectare of olive tree cultivation.
Therefore, it becomes evident that implementing the advanced routing and scheduling system for the logistics company’s distribution services could result in a significant amount of CO2 emissions reduction and, thus, to a way lower environmental impact of its activities. In addition, the environmental impact could be even further reduced by utilizing the dynamic capabilities of the system and monitoring the road traffic congestion, the order cancelations, or any other unpredicted events and providing modifications to the schedule or even vehicle rerouting when necessary.
4. Conclusions
Concluding the presentation of the advanced vehicle routing and scheduling system, it becomes clear that the use of such a system may present a plethora of advantages for logistics companies that operate in urban areas. Such advantages include fewer traveled kilometers, more effective fleet utilization, less consumed fuel, higher driver productivity, quicker deliveries, less scheduling time, higher customer satisfaction, and easier adaptation to business development. Whether aiming at minimizing the emissions or the distribution costs, a logistics company that uses such a system for its distribution activities will perform them much more effectively while at the same time having a significantly less environmental impact.
From the case study presented in this paper, it becomes even more evident that today’s logistics companies need to implement such advanced systems for their activities as road transportation is responsible for the 72% of CO2 emissions. Making use of the system, in both tested scenarios, the company could achieve a noticeable reduction in CO2 emissions, and, if more companies decide to use such systems, the environmental impact of urban freight transportations could be vastly reduced. In fact, the results of the application of the system to the medium-sized logistics company’s distribution operations show a 27.17% reduction of CO2 emissions. This may lead to a significant reduction of the company’s environmental footprint if it decides to adopt the system for its distribution services. Afterall, we should not forget that the whole planet is in great danger, and, as noted by scientists, a rapid rise in temperature has recently been observed. In fact, such alternations of hot and cold periods have never occurred simultaneously around the world for the last two millennia.
It should be noted, however, that the system has only been tested in one medium-sized company; therefore, in order to achieve more robust results, further testing is required. More specifically, our team plans to test the system in additional logistics companies of various sizes. We have already contacted such companies, and, after presenting them the results of our case, they have expressed their interest in testing our system. Therefore, in the following months, we estimate that about 5 additional tests will be performed. Another limitation of our research is that we only focus on CO2 emissions, while there are also other parameters needed to be taken into account for creating greener routes. Finally, it should be made clear that the use of a system, such as the one presented in this paper, requires the company to create a technological infrastructure in order to make use of the system and also creates the need for significant expenditure on technological equipment and software. However, the investment can be amortized in a fairly short period of time, thanks to the reductions that the company will have in its operating costs, as well as its ability to increase its existing customer base.
The next goal of our team is to create an improved version of our system that will fully support green vehicle routing and scheduling. The new system will be able to effectively work with fleets of electrical or hybrid vehicles (e.g., use of fast charging stations, preference in green routes, ensuring emission limit compliance with EU directives, etc.) and will be fully compliant with the goals set by the European Union for reduced transport emissions by 2050.
Author Contributions
Conceptualization, E.P.K. and S.P.G.; methodology, E.P.K. and S.P.G.; software, S.P.G. and G.A.P.; validation, E.P.K. and G.D.K.; formal analysis, E.P.K. and S.P.G.; investigation, G.A.P. and G.D.K.; resources, S.P.G. and G.A.P.; data curation, E.P.K.; writing—original draft preparation, E.P.K. and G.D.K.; writing—review and editing, E.P.K. and S.P.G.; visualization, E.P.K.; supervision, S.P.G.; project administration, S.P.G.; funding acquisition, G.A.P. All authors have read and agreed to the published version of the manuscript.
Funding
The present work is co-funded by the European Union and Greek national funds through the Operational Program “Competitiveness, Entrepreneurship and Innovation” (EPAnEK), under the call “RESEARCH-CREATE-INNOVATE” (project code: T1EDK-00527 and Acronym: SMARTRANS).
Conflicts of Interest
The authors declare no conflict of interest.
References
- Lin, S.; Xi, Y.; Yang, Y. Short-term traffic flow forecasting using macroscopic urban traffic network model. In Proceedings of the 2008 11th International IEEE Conference on Intelligent Transportation Systems, Beijing, China, 12–15 October 2008. [Google Scholar]
- Kauf, S. City logistics—A strategic element of sustainable urban development. In Proceedings of the 2nd International Conference “Green Cities—Green Logistics for Greener Cities”, Szczecin, Poland, 2–3 March 2016; pp. 158–164. [Google Scholar]
- Sbihi, A.; Eglese, R.W. The Relationship between Vehicle Routing & Scheduling and Green Logistics—A Literature Survey, 1st ed.; Lancaster University Management School: Lancaster, UK, 2007; pp. 9–17. [Google Scholar]
- Taniguchi, E.; Thompson, R.G. City Logistics 1: New Opportunities and Challenges (Systems and Industrial Engineering), 1st ed.; Wiley-ISTE—Institute for City Logistics: New Jersey, NJ, USA, 2018; pp. 15–19. [Google Scholar]
- Kumarage, A.S. Urban traffic congestion: The problem & solutions. Econ. Rev. 2004, 1, 2–8. [Google Scholar]
- Zhou, Y.; Lee, G.M. A Lagrangian relaxation-based solution method for a green vehicle routing problem to minimize greenhouse gas emissions. Sustainability 2017, 9, 776. [Google Scholar] [CrossRef]
- Wang, J.; Yao, S.; Sheng, J.; Yang, H. Minimizing total carbon emissions in an integrated machine scheduling and vehicle routing problem. J. Clean. Prod. 2019, 229, 1004–1017. [Google Scholar] [CrossRef]
- Saberi, M.; Verbas, İ.Ö. Continuous Approximation model for the vehicle routing problem for emissions minimization at the strategic level. J. Transp. Eng. 2012, 138, 1368–1376. [Google Scholar] [CrossRef][Green Version]
- Ehmke, J.F.; Campbell, A.M.; Thomas, B.W. Vehicle routing to minimize time-dependent emissions in urban areas. Eur. J. Oper. Res. 2016, 251, 478–494. [Google Scholar] [CrossRef]
- Gayialis, S.P.; Konstantakopoulos, G.D.; Kechagias, E.P.; Papadopoulos, G.A.; Ponis, S.T. Developing an advanced cloud-based vehicle routing and scheduling system for urban freight transportation. In Advances in Production Management Systems. Smart Manufacturing for Industry 4.0; Moon, I., Lee, G., Park, J., Kiritsis, D., Von Cieminski, G., Eds.; Springer: Cham, Switzerland, 2018; Volume 536, pp. 190–197. [Google Scholar]
- Allen, J.; Thorne, G.; Browne, M. BESTUFS Good Practice Guide on Urban Freight Transport; BESTUFS: Westminster, UK, 2007; pp. 10–13. [Google Scholar]
- Europarl CO2 Emissions from Cars: Facts and Figures (Infographics). Available online: https://www.europarl.europa.eu/news/en/headlines/society/20190313STO31218/co2-emissions-from-cars-facts-and-figures-infographics (accessed on 24 October 2020).
- Lin, B.; Xu, M. Regional differences on CO2 emission efficiency in metallurgical industry of China. Energy Policy 2018, 120, 302–311. [Google Scholar] [CrossRef]
- Dulebenets, M.A. A comprehensive multi-objective optimization model for the vessel scheduling problem in liner shipping. Int. J. Prod. Econ. 2018, 196, 293–318. [Google Scholar] [CrossRef]
- Lo, P.L.; Martini, G.; Porta, F.; Scotti, D. The determinants of CO2 emissions of air transport passenger traffic: An analysis of Lombardy (Italy). Transp. Policy 2020, 91, 108–119. [Google Scholar] [CrossRef]
- Andersson, F.N.G.; Opper, S.; Khalid, U. Are capitalists green? Firm ownership and provincial CO emissions in China. Energy Policy 2018, 123, 349–359. [Google Scholar] [CrossRef]
- Eceuropa Transport Emissions: A European Strategy for Low-Emission Mobility. Available online: https://ec.europa.eu/clima/policies/transport_en (accessed on 24 October 2020).
- World Bank Population, Total. Available online: https://data.worldbank.org/indicator/SP.POP.TOTL (accessed on 25 October 2020).
- IRU The European Green Deal: What It Means for Road Transport. Available online: https://www.iru.org/resources/newsroom/european-green-deal-what-it-means-road-transport (accessed on 25 October 2020).
- Fu, Y.; Zhang, X. Mega urban agglomeration in the transformation era: Evolving theories, research typologies and governance. Cities 2020, 105, 102813. [Google Scholar] [CrossRef]
- Bär, L.; Ossewaarde, M.; Van Gerven, M. The ideological justifications of the smart city of Hamburg. Cities 2020, 105, 102811. [Google Scholar] [CrossRef]
- Konstantakopoulos, G.D.; Gayialis, S.P.; Kechagias, E.P. Vehicle routing problem and related algorithms for logistics distribution: A literature review and classification. Oper. Res. 2020, 20, 1–30. [Google Scholar] [CrossRef]
- Kurth, M.; Kozlowski, W.; Ganin, A.; Mersky, A.; Leung, B.; Dykes, J.; Kitsak, M.; Linkov, I. Lack of resilience in transportation networks: Economic implications. Transp. Res. Part D Transp. Environ. 2020, 86, 102419. [Google Scholar] [CrossRef]
- Gharehbaghi, K.; McManus, K.; Robson, K. Minimizing the environmental impacts of mega infrastructure projects. J. Eng. Des. Technol. 2019, 17, 736–746. [Google Scholar] [CrossRef]
- FBP Computerised Vehicle Routing and Scheduling (CVRS) for Efficient Logistics Guide. Available online: http://www.northeastfreightpartnership.info/bestpractice/Publications/Equipment%20and%20Systems/Quick%20Guide%20To%20CVRS.pdf (accessed on 30 October 2020).
- Kechagias, E.P.; Gayialis, S.P.; Konstantakopoulos, G.D.; Papadopoulos, G.A. An application of a multi-criteria approach for the development of a process reference model for supply chain operations. Sustainability 2020, 12, 5791. [Google Scholar] [CrossRef]
- Konstantakopoulos, G.D.; Gayialis, S.P.; Kechagias, E.P.; Papadopoulos, G.A.; Tatsiopoulos, I.P. A Multiobjective Large neighborhood search metaheuristic for the vehicle routing problem with time windows. Algorithms 2020, 13, 243. [Google Scholar] [CrossRef]
- Kechagias, E.P.; Gayialis, S.P.; Konstantakopoulos, G.D.; Papadopoulos, G.A. Traffic flow forecasting for city logistics: A literature review and evaluation. Int. J. Decis. Support Syst. 2019, 4, 159–176. [Google Scholar] [CrossRef]
- Ritchie, H.; Roser, M. Greenhouse Gas Emissions. Available online: https://ourworldindata.org/greenhouse-gas-emissions (accessed on 11 November 2020).
- Deb, K.; Pratap, A.; Agarwal, S.; Meyarivan, T. A fast and elitist multiobjective genetic algorithm: NSGA-II. IEEE Trans. Evol. Comput. 2002, 6, 182–197. [Google Scholar] [CrossRef]
- Ombuki, B.; Ross, B.J.; Hanshar, F. Multi-objective genetic algorithms for vehicle routing problem with time windows. Appl. Intell. 2006, 24, 17–30. [Google Scholar] [CrossRef]
- Chiang, T.C.; Hsu, W.H. A knowledge-based evolutionary algorithm for the multiobjective vehicle routing problem with time windows. Comput. Oper. Res. 2014, 45, 25–37. [Google Scholar] [CrossRef]
- El-Sherbeny, N.A. Vehicle routing with time windows: An overview of exact, heuristic and metaheuristic methods. J. King Saud Univ. Sci. 2010, 22, 123–131. [Google Scholar] [CrossRef]
- CEFIC/ECTA Guidelines for Measuring and Managing CO2 Emission from Freight Transport Operations. Available online: https://www.google.com.hk/url?sa=t&rct=j&q=&esrc=s&source=web&cd=&ved=2ahUKEwi8yuTt26ntAhVPPHAKHcOYDNMQFjABegQIAxAC&url=https%3A%2F%2Fwww.ecta.com%2Fresources%2FDocuments%2FEvents%2F2017%2520RC%2520Workshop%2F3.%2520Jos%2520Verlinden%2C%2520New%2520CO2%2520Calculation%2520Method%2520and%2520Models.pdf&usg=AOvVaw1iArd8drSsuD_6AyfJHKpa (accessed on 30 October 2020).
- EPA Greenhouse Gas Equivalencies Calculator from the United States Environmental Protection Agency. Available online: https://www.epa.gov/energy/greenhouse-gas-equivalencies-calculator (accessed on 30 October 2020).
- Eoan Recycling Statiscics for Greece. Available online: https://www.eoan.gr/wp-content/uploads/2020/10/%CE%A3%CE%A4%CE%91%CE%A4%CE%99%CE%A3%CE%A4%CE%99%CE%9A%CE%91%CE%95%CE%9B%CE%9B%CE%91%CE%94%CE%91%CE%A3_7%CF%81%CE%B5%CF%85%CE%BC%CE%B1%CF%84%CE%B1_20200924_WHITE_PAPER.pdf?fbclid=IwAR3SJTGdWfEl3-zYmp6Azr-x8B-37dMlPkSrbuQTkiQzH19DFcIyuHKR3Rg (accessed on 12 November 2020). (In Greek).
Publisher’s Note: MDPI stays neutral with regard to jurisdictional claims in published maps and institutional affiliations. |
© 2020 by the authors. Licensee MDPI, Basel, Switzerland. This article is an open access article distributed under the terms and conditions of the Creative Commons Attribution (CC BY) license (http://creativecommons.org/licenses/by/4.0/).