1. Introduction
Driven by the rapid expansion of e-commerce platforms and social media channels, large-scale agricultural products require continuous outflow to urban consumer markets, while mass-produced industrial freight faces urgent demand for inflow into rural regions. The demand for express delivery in rural areas has experienced a corresponding surge, which has put forward higher requirements for rural logistics in terms of time and cost. However, there are some problems in traditional rural logistics, such as high transportation costs and long delivery times due to low population density and dispersed demand. It is not realistic to construct more infrastructure to improve the service, and the key is to fully utilize the functions of existing resources to fulfill the delivery requirement. In the urban freight network, collaboration with passenger networks, like buses, subways, and taxis, could boost urban freight efficiency without large-scale network expansion [
1]. Motivated by this, integrating the resources of passenger and freight transport is also being explored in rural areas.
The feasibility of the integration of passenger and freight transportation (IPFT) in rural areas is supported by two fundamental factors. On the one hand, in rural areas, comprehensive public transport networks have been constructed. On the other hand, the flows of urban–rural bus passengers are decreasing due to changes in population mobility and travel habits, resulting in low occupancy rates and poor financial performance. To promote the IPFT in rural areas, the Ministry of Transportation of China has introduced relevant policies encouraging rural public transport companies and freight transport companies to integrate resources and construct reasonable input and benefit-sharing mechanisms. For example, Hunan Province in China has launched 630 IPFT routes, increasing rural upward parcel volume by ~30% and reducing downward delivery costs by ~20% [
2].
To sum up, the IPFT by urban–rural buses is advocated in rural areas, which is also a key measure to promote the national rural revitalization strategy. The IPFT by urban–rural buses allows for the sharing of vehicles and infrastructure, leveraging the idle capacity of passenger transport to achieve an integrated network for both passenger and freight transport, particularly increasing the efficiency for the first and last mile of both passenger and freight transport chains [
3]. Freight transport companies pay public transport companies to deliver freight at rates significantly lower than the operational costs of managing deliveries themselves. Meanwhile, public transport companies benefit from the increased revenue, thereby enhancing their financial sustainability. The IPFT model has generated mutually beneficial economic outcomes for all stakeholders.
In traditional rural logistics, passenger and freight transport are operated independently, where passenger stations and freight stations are separate and different vehicles are used. The core of the IPFT is to integrate the public transport network and the express delivery network, whose rationality is the key to determining the transportation efficiency. To construct a reasonable IPFT network, three critical and interrelated decisions must be made first: selecting IPFT stations, allocating all demands, and planning transport routes, i.e., location-routing problem. Considering the differences in economy and population among counties, townships, and villages, the demand distribution exhibits differentiated characteristics. The same level of stations may result in resource waste or insufficient service, so a three-level county–township–village station is considered. Therefore, this paper studies the county–township–village station location-routing problem for the IPFT by urban–rural buses, aiming to optimize transport efficiency and total costs.
2. Literature Review
2.1. Integration of Passenger and Freight Transport
In recent years, many scholars have focused on the idle capacity of public transport and explored ways to improve operational efficiency through the IPFT and other methods [
1]. The IPFT has been widely applied in urban areas, leveraging various transport modes, such as trams, metro systems, buses, and taxis. For example, Pietrzak et al. [
4] studied the case of trams for freight transport in Europe and analyzed the feasibility of freight tram implementation. Ren et al. [
5] focused on optimizing joint transport scheduling by using ride-hailing vehicles to simultaneously carry passengers and parcels in urban last-mile delivery. Azcuy et al. [
6] focused on how to utilize the capacity of urban public transport systems as an intermediate means to support last-mile delivery. Schröder et al. [
7] developed a multi-agent model capable of simultaneously simulating urban passenger and freight transport behaviors, providing support for integrated urban transport planning and policy evaluation. Nieto-Isaza et al. [
8] studied the location selection problem of freight transfer stations along urban rail transit lines. Bruzzone et al. [
9] studied the feasibility of integrating passenger and freight transport in first-last mile logistics through a freight-on-transit system, proposing a multi-commodity network design model. Li et al. [
10] proposed an operational strategy for the IPFT during off-peak hours in urban rail systems and proposed a train service model considering scheduling, freight allocation, and station inventory. Masson et al. [
11] proposed a two-level hybrid transport model by optimizing the idle capacity of buses to transport freight to central urban stations, followed by freight trucks for terminal delivery. Machado et al. [
12] integrated freight delivery into urban bus networks by minimizing the number of buses modified for freight. Lu et al. [
13] designed optimal routes for a fleet of taxis serving both passenger and parcel requests. Xue et al. [
14] discussed how to optimize the utilization of urban taxi resources by integrating passenger and parcel transport in the shared ride model.
Compared with the IPFT in urban areas, there is relatively less research on the IPFT in rural areas, which mainly focused on vehicle scheduling, multi-vehicle joint transport, and other aspects. Qu et al. [
15] studied the feasibility and operational characteristics of the IPFT in urban–rural public transport systems. Wang et al. [
16] studied the coordination between logistics trucks and urban–rural buses in urban fringe areas, optimizing vehicle routing and scheduling problems. Yang et al. [
17] proposed a demand-driven IPFT service model based on the green transit routing problem. Cavallaro et al. [
18] focused on the IPFT for flexible routing in rural areas and proposed a framework that integrates demand-responsive transport with the IPFT. He et al. [
19] proposed a rural bus integrated transport system, which optimized multi-trip route planning for buses and the coordination of parcel transfers. Xue et al. [
20] proposed an optimization model for integrating urban–rural buses with postal services, considering the demand uncertainty. Zhou et al. [
21] studied the coordinated routing of urban–rural buses and express delivery vehicles and proposed a joint model for location selection and route planning in intermodal transport. Bing et al. [
22] developed a mixed-integer programming model to optimize vehicle configuration, timetabling, and compartment space allocation.
2.2. Location-Routing Problem
The location-routing problem (LRP) is a fundamental problem in the field of logistics and supply chain optimization. Facility capacity and vehicle capacity are important factors in the LRP. Liu et al. [
23] proposed an LRP model with capacity-constrained facilities. Rabbani et al. [
24] developed a bi-objective LRP for industrial waste management, which comprehensively considers the heterogeneity of waste types and the capacity constraints of transport vehicles. Then, the following research extended the model to more complex logistics scenarios.
Some scholars imposed constraints on distribution distance and proposed a location-routing problem with distance constraints. For example, Berger et al. [
25] studied a location-routing problem with distribution distance constraints, aiming to determine the optimal facility locations and vehicle routes. Jouzdani et al. [
26] incorporated route length constraints to limit allocation distances and ensure the proper functioning of the supply chain. Almouhanna et al. [
27] proposed a location-routing model with distance constraints for electric vehicle applications.
Regarding facility location, research has evolved from single-level to multi-level location selection. Irawan et al. [
28] addressed the two-stage capacitated facility location problem, focusing on optimizing warehouse locations and capacity configurations under multi-level capacity constraints. Zhou et al. [
29] proposed a robust optimization model for distribution networks integrating multi-capacity facility location, vehicle routing, and carbon emission management. Wang et al. [
30] addressed a multi-depot, multi-period, and resource-sharing LRP for electric vehicle charging stations. Marand et al. [
31] studied a hub location problem with heterogeneous capacity choices, incorporating price-sensitive demand and congestion effects.
In traditional location-routing problems, vehicles are required to start from and eventually return to the origin, forming a closed path. Later, scholars relaxed this requirement and allowed for an open path, where the origin and the destination of vehicles are different. Pichka et al. [
32] studied a second-level open LRP based on a multi-level distribution system, where the vehicle does not return to its origin. Zhen et al. [
33] integrated open routing with a shared mobility model and proposed a nonlinear mixed-integer programming formulation to reduce last-mile delivery costs. Heidari et al. [
34] proposed a bi-objective mathematical planning model to solve a two-echelon closed–open LRP featuring closed routes at the first level and open routes at the second.
2.3. Literature Summary
To present the differences between this study and the related literature more clearly,
Table 1 gives a summary of related references. It can be seen that the research on the IPFT, whether in urban or rural areas, often focuses on the construction of single-level stations, with limited consideration given to distribution distance constraints and open routing. Furthermore, there are few studies that simultaneously address multi-level station capacity construction, distribution distance limits, and open routing in the location-routing problems. The two most relevant pieces of literature, He et al. [
19] and Zhou et al. [
21], also establish location-routing models based on the IPFT in rural areas, but both studies focus on the construction of single-level stations.
2.4. Contribution and Outline
To the best of our knowledge, this is the first study to design a county–township–village IPFT station network and present its corresponding station location-routing model. A mixed-integer linear programming model is developed for the problem, considering the location of county IPFT stations, township IPFT stations, and village IPFT stations, the allocation of non-IPFT stations, the capacity of IPFT stations, and the route planning of all stations. A comprehensive series of numerical experiments is conducted on a randomly generated dataset, and the computational results validate the feasibility and advantage of the proposed model. According to the simulation results, the IPFT achieves an 11.41% cost reduction compared to the traditional mode in which passenger and freight transport are operated separately; compared to the single-level station network, the county–township–village station network can further reduce the overall transportation cost, with an average reduction of 32.48%.
The structure of this paper is organized as follows.
Section 2 reviews the relevant literature.
Section 3 provides a detailed description of the research problem.
Section 4 presents the optimization model.
Section 5 presents numerical experiments to validate the feasibility of the model and examine the impact of key parameters through sensitivity analysis, based on specified data sources and parameter settings.
Section 6 discusses the experimental results. Finally,
Section 7 concludes the study and outlines directions for future research.
3. Problem Description
The core for the IPFT by urban–rural buses lies in the shared and complementary use of transport capacity and the joint construction and utilization of stations. In the IPFT, public transport companies can utilize the idle capacity of buses to deliver freight to various stations or consolidate the freight from each station for unified delivery by freight transport companies. Freight transport companies are responsible for the centralized transportation of freight between the county IPFT stations and the comprehensive freight hub. To ensure the safety of both passengers and freight, buses should undergo a “passenger and freight separation” retrofit. Additionally, information systems will be equipped to enable real-time freight tracking.
The IPFT network consists of county IPFT stations, township IPFT stations, village IPFT stations, and passenger stations. IPFT stations can carry out both passenger and freight transport simultaneously, while passenger stations can only carry out passenger transport. The service capacities of county IPFT stations, township IPFT stations, and village IPFT stations are different. County IPFT stations act as regional freight transit hubs, enabling bidirectional transport through dedicated freight routes. Freight transport companies handle the centralized freight from stations, transport it to the comprehensive freight hub using trucks, and also deliver the freight from the hub to county IPFT stations for further distribution. Due to the bidirectional nature of bus routes, county IPFT stations function as both the starting and ending stations. On the downward route, service originates from a county IPFT station and terminates at an IPFT station, where freight is distributed to rural areas. Conversely, on the upward route, service originates from an IPFT station and terminates at a county IPFT station, where freight from rural areas is consolidated. To make the problem clearer,
Figure 1 presents the operational flow of the IPFT network.
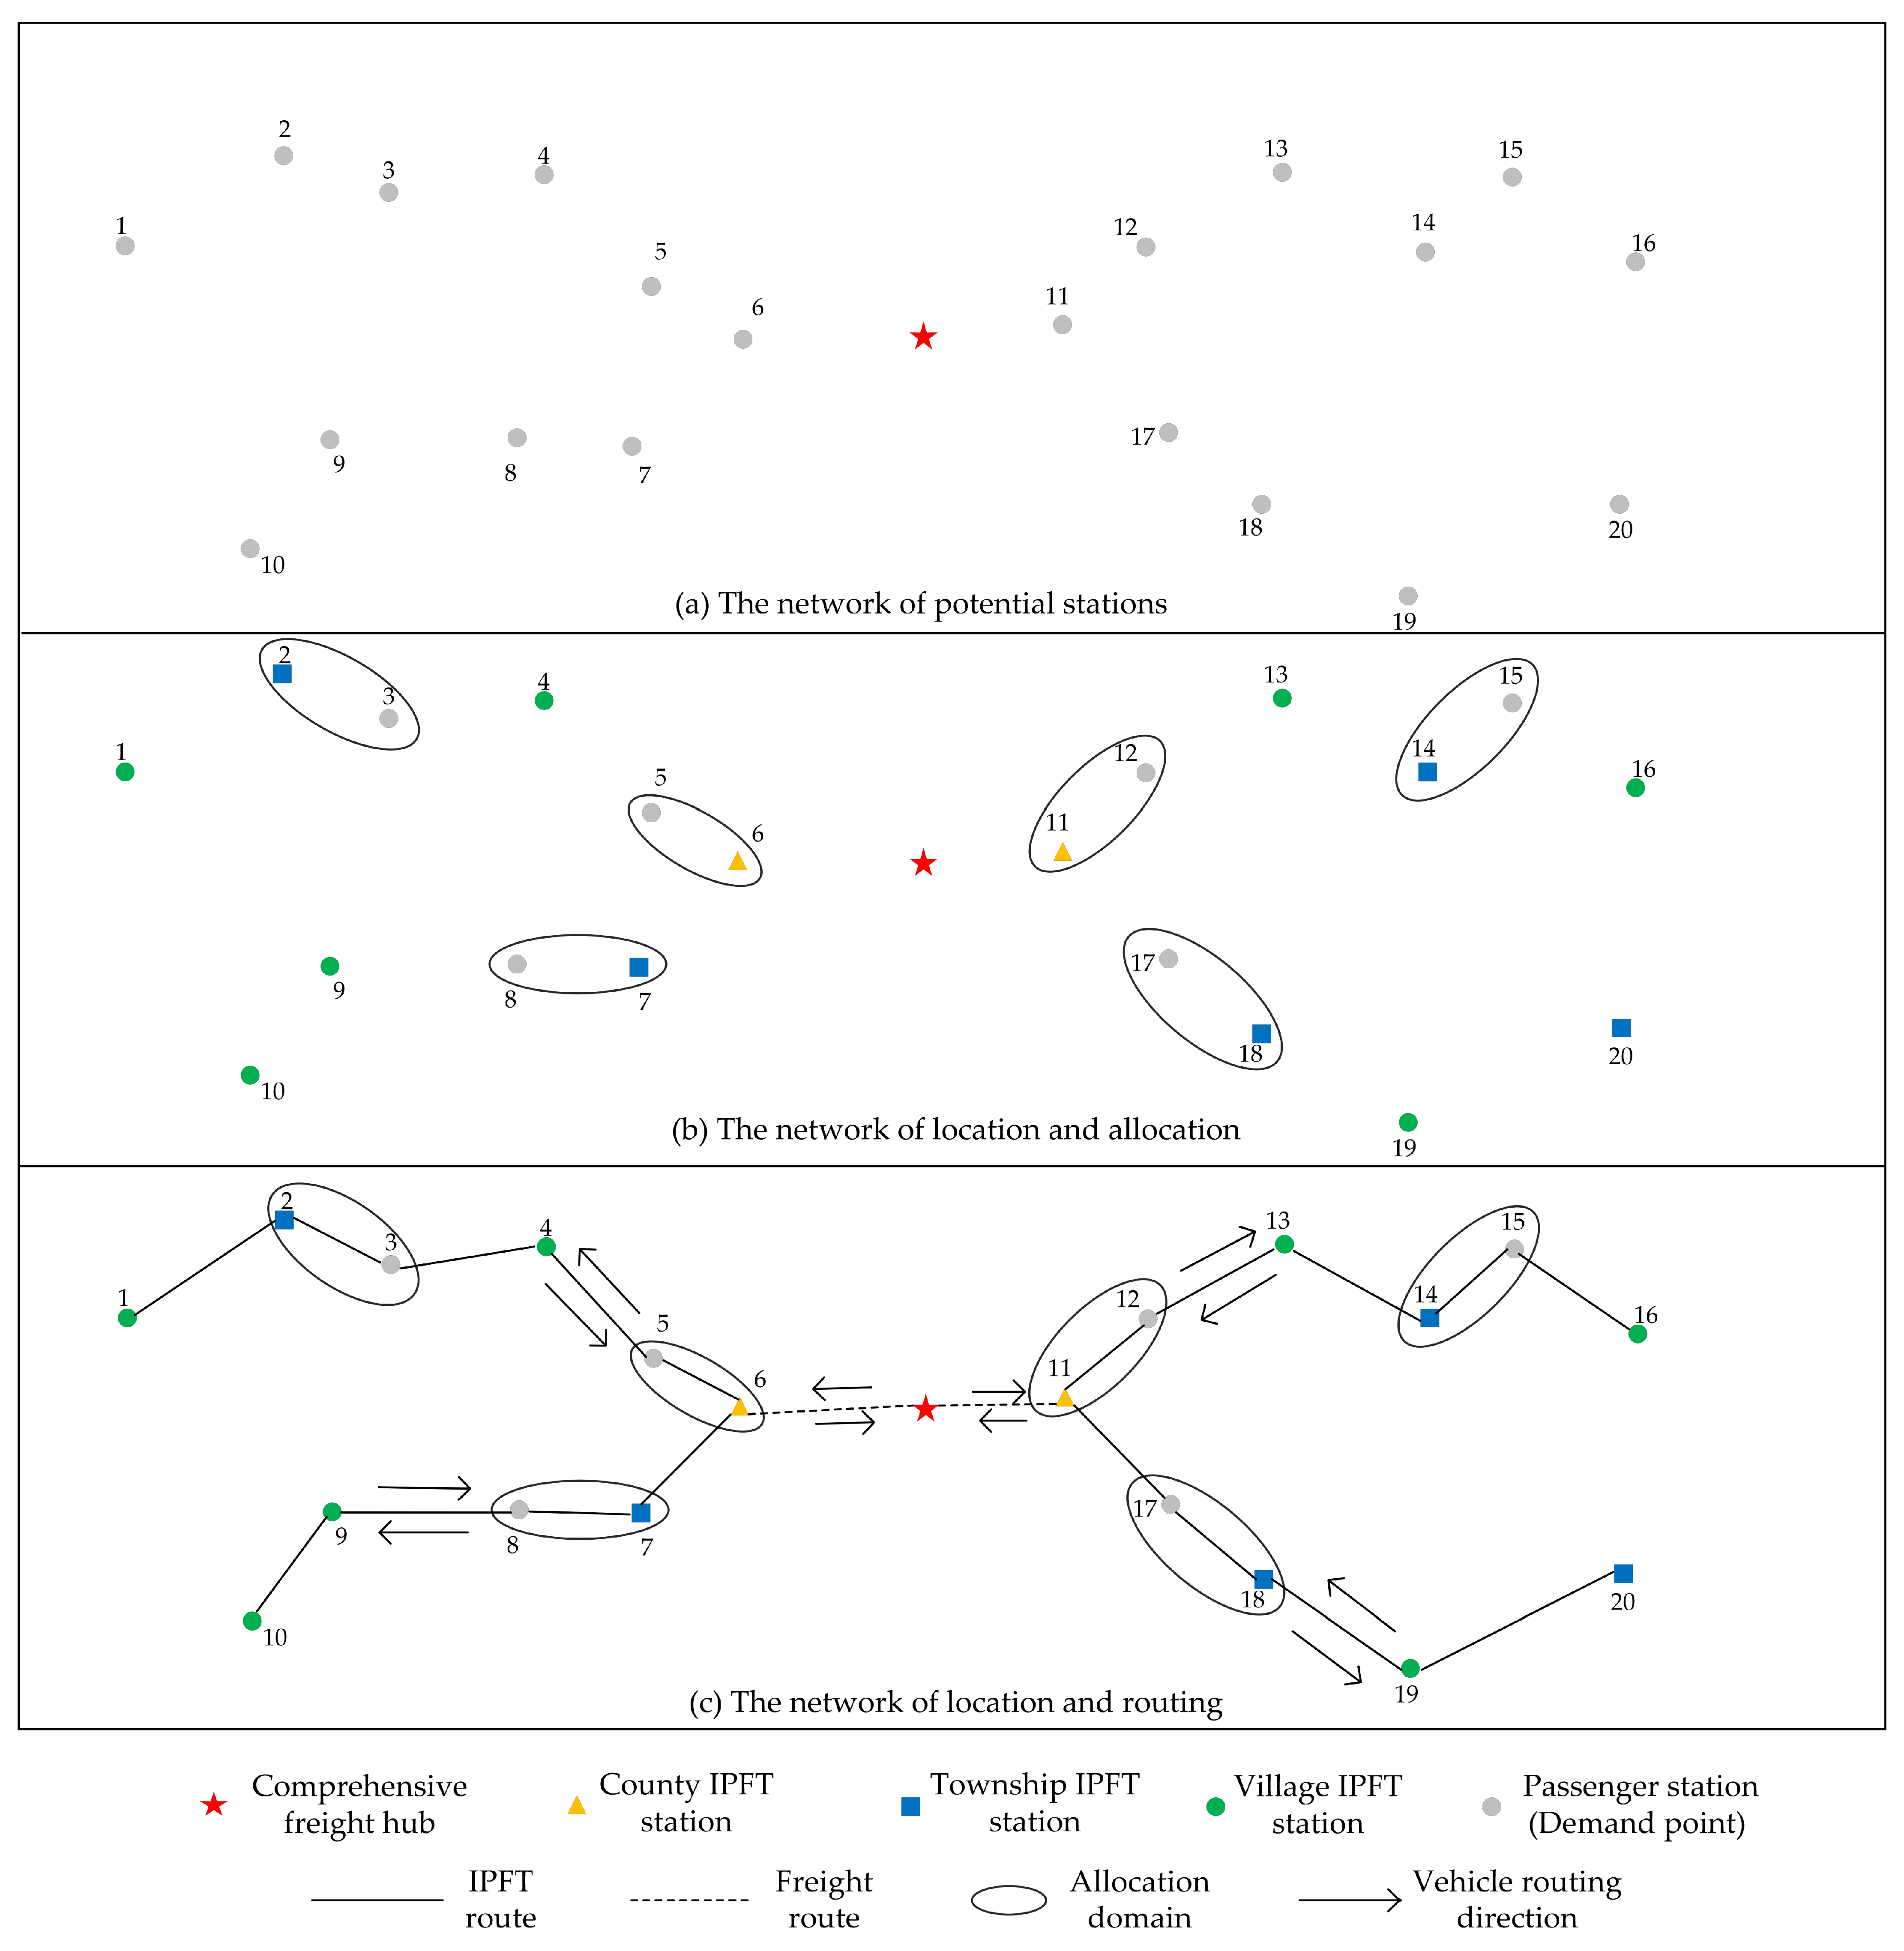
The foundation of the IPFT network is the existing public transport network. The existing bus stations are seen as demand points, i.e., potential IPFT stations, and some of them are selected to construct county IPFT stations, township IPFT stations, or village IPFT stations. The freight demand of non-IPFT stations is allocated to nearby IPFT stations, where villagers will pick up and drop off their freight at the allocated IPFT stations. Dedicated bus routes are planned to cover all stations, with each station served by a single route to ensure clarity and control. To make the decision-making process more vivid,
Figure 2 illustrates an example of the detailed process. Specifically,
Figure 2a shows the spatial distribution of all potential stations, with stations 1–10 in the first county and stations 11–20 in the second. Subsequently,
Figure 2b shows the network of location and allocation, where two county IPFT stations, five township IPFT stations, and seven village IPFT stations are selected, and the non-IPFT stations are allocated to the nearby IPFT stations.
Figure 2c shows the network of location-routing, where four routes and their sequence are determined.
4. Mathematical Modeling
4.1. Assumption and Notation
In this study, the main purpose is to present the location-routing model for the IPFT by urban–rural buses. The scheduling of buses is omitted, such as transfer scheduling, bus departure frequencies, and bus capacity. For the convenience of modeling, the following assumptions are considered.
- ➢
Each IPFT route must start from and end at an IPFT station, and one of the start or the end stations must be a county IPFT station.
- ➢
When the freight demand of a station is allocated to a nearby IPFT station, both the maximum allocation distance and the freight capacity constraints must be satisfied.
- ➢
The number of counties is given, and the number of the opened IPFT routes in each county is known. Each county has only one county IPFT station.
- ➢
Generally, most freight demands in rural areas need to be distributed through comprehensive freight hubs. So, the destination of the upward freight demand and the origin of the downward freight demand are both located at the comprehensive freight hub.
Table 2 and
Table 3 provide the explanation of sets, parameters, decision variables, and auxiliary variables used.
4.2. Optimization Model
Based on the problem description, assumptions, and notations, the mathematical model is proposed in this section. Given the number of constraints, the model is described by category.
Objective function. The objective of this problem is to minimize the total cost, as presented in Formula (1), where the first term denotes the station construction cost, the second and third terms represent operational costs, and the fourth and fifth terms denote transport costs.
Location and allocation constraints. Constraints (2) and (3) ensure that each county has exactly one county IPFT station, and each station has a unique level. Constraints (4) and (5) ensure that the freight demand of each station is allocated to a single selected IPFT station within the same county. Constraints (6) impose a limit on the freight allocation distance. Constraints (7) ensure that the volume of services offered by the selected station should be less than its capacity.
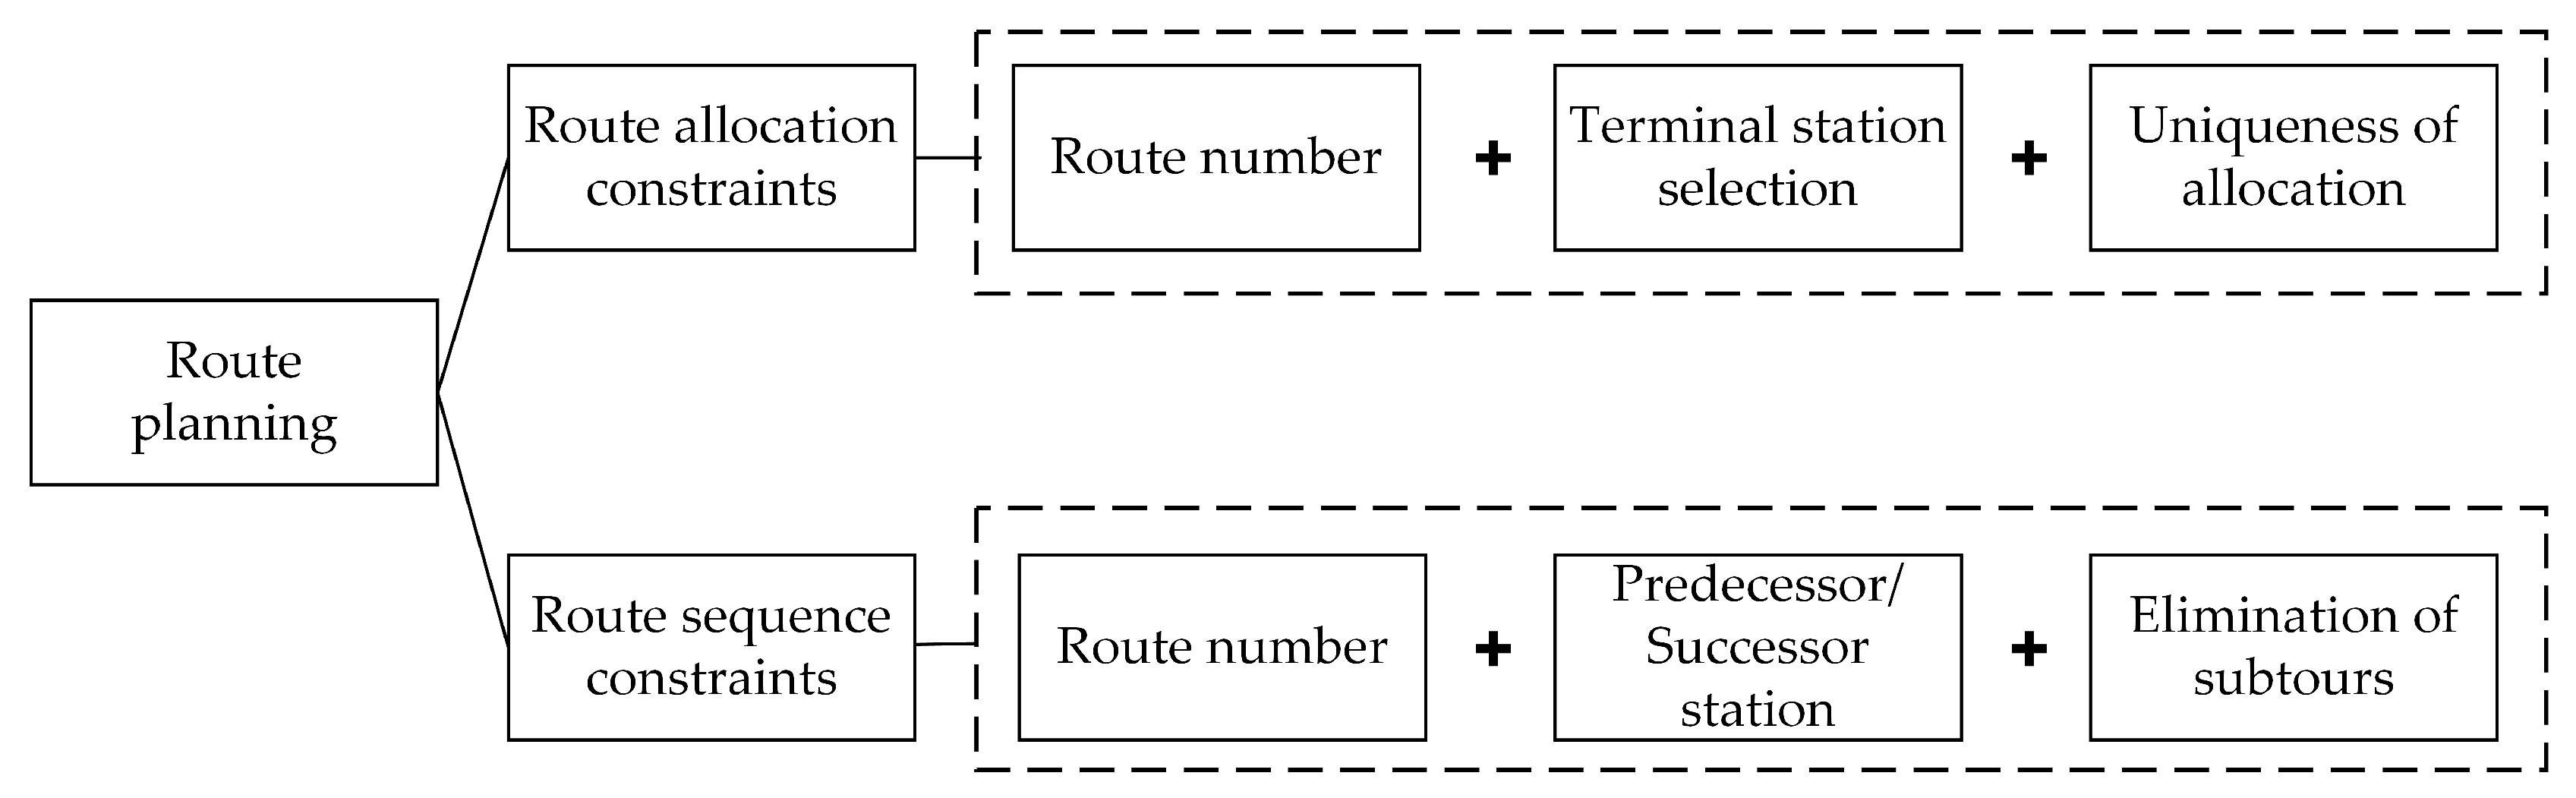
Route allocation constraints. Constraints (8)–(11) enforce the route allocation rules, ensuring that a station can be visited by a route and be selected as its terminal station only if it is allocated to the route. Constraints (12) ensure the total number of routes in each county.
Route sequence constraints. Constraints (13)–(15) define the terminal station of each route. Constraints (16) ensure that the terminal station of each route must be either a township or a village IPFT station. Constraints (17)–(19) give the predecessor station and the successor station in the route sequence. Constraints (20) and (21) are introduced to eliminate self-loops and subtours.
Route allocation constraints and route sequence constraints jointly determine bus route planning. Key decisions involve selecting end stations, assigning stations to routes, and determining station sequences while ensuring the number of routes, unique station allocation, and elimination of self-loops and subtours.
Figure 3 depicts these key route planning decisions for clarity.
Auxiliary variable calculation constraints. Constraints (22)–(25) calculate the distance from stations to the county IPFT station in the same route, and calculate the total longest distance of each route. Constraints (26) and (27) determine the transport cost of unit freight. Constraint (28) presents the total freight volume for each county.
Domain of decision variables. Constraints (29) specify the domain of decision variables.
5. Numerical Experiments
5.1. Data Source and Parameter Setting
To assess the feasibility of the proposed model, a series of experiments were conducted. The numerical experiments were performed on a personal laptop (Intel (R) Core (TM) i7-1065G7 CPU @ 1.30 GHz and 16.0GB of RAM). The code development was performed using CPLEX Studio IDE 12.10.0.
Due to the difficulty of obtaining actual rural demand data, numerical experiments are conducted based on a randomly generated dataset. Two counties and fifteen stations are considered, where the first county includes five stations and the second county includes ten stations . According to the model requirements, one route is established in the first county , and two routes are established in the second county .
According to the parameter settings provided by He et al. [
19], the average number of daily trips made by rural residents typically ranges from 5 to 15. In rural areas, passenger and freight demands vary significantly across different stations due to differences in geographical location, population size, and regional functions. To capture the heterogeneity, this study randomly generates the annual passenger transport demand for each station within three predefined intervals:
,
, and
, reflecting varying levels of travel frequency among rural residents. Given that the frequency of parcel deliveries generally exceeds that of passenger travel in rural areas, the freight demand at each station is set to be twice the passenger demand, aligning the simulation more closely with practical conditions.
For distance measurement, Euclidean distances between stations are used in the experiments.
Table 4 provides the detailed passenger and freight demand for each station, where the unit of passenger demand is person-times and the unit of freight demand is items.
Table 5 presents additional parameter settings used in the model, where cost indicators are expressed in RMB (e.g., RMB or RMB/km), distances are expressed in kilometers (km), transport costs are expressed in RMB/person/km, and ratio parameters are dimensionless.
5.2. Model Results and Analysis
5.2.1. Network Structure Comparison
The characteristics of this problem mainly include the IPFT, the allocation of freight demand, and the allocation distance limitation. Therefore, to validate the feasibility of the proposed model, it is compared with three models: the pure public transport network model (shown in
Appendix A), the model without freight allocation (given in
Appendix B), and the model without an allocation distance limitation for freight. To illustrate the network structure without freight distribution, the maximum allocation distance limitation in this model is set to 0.
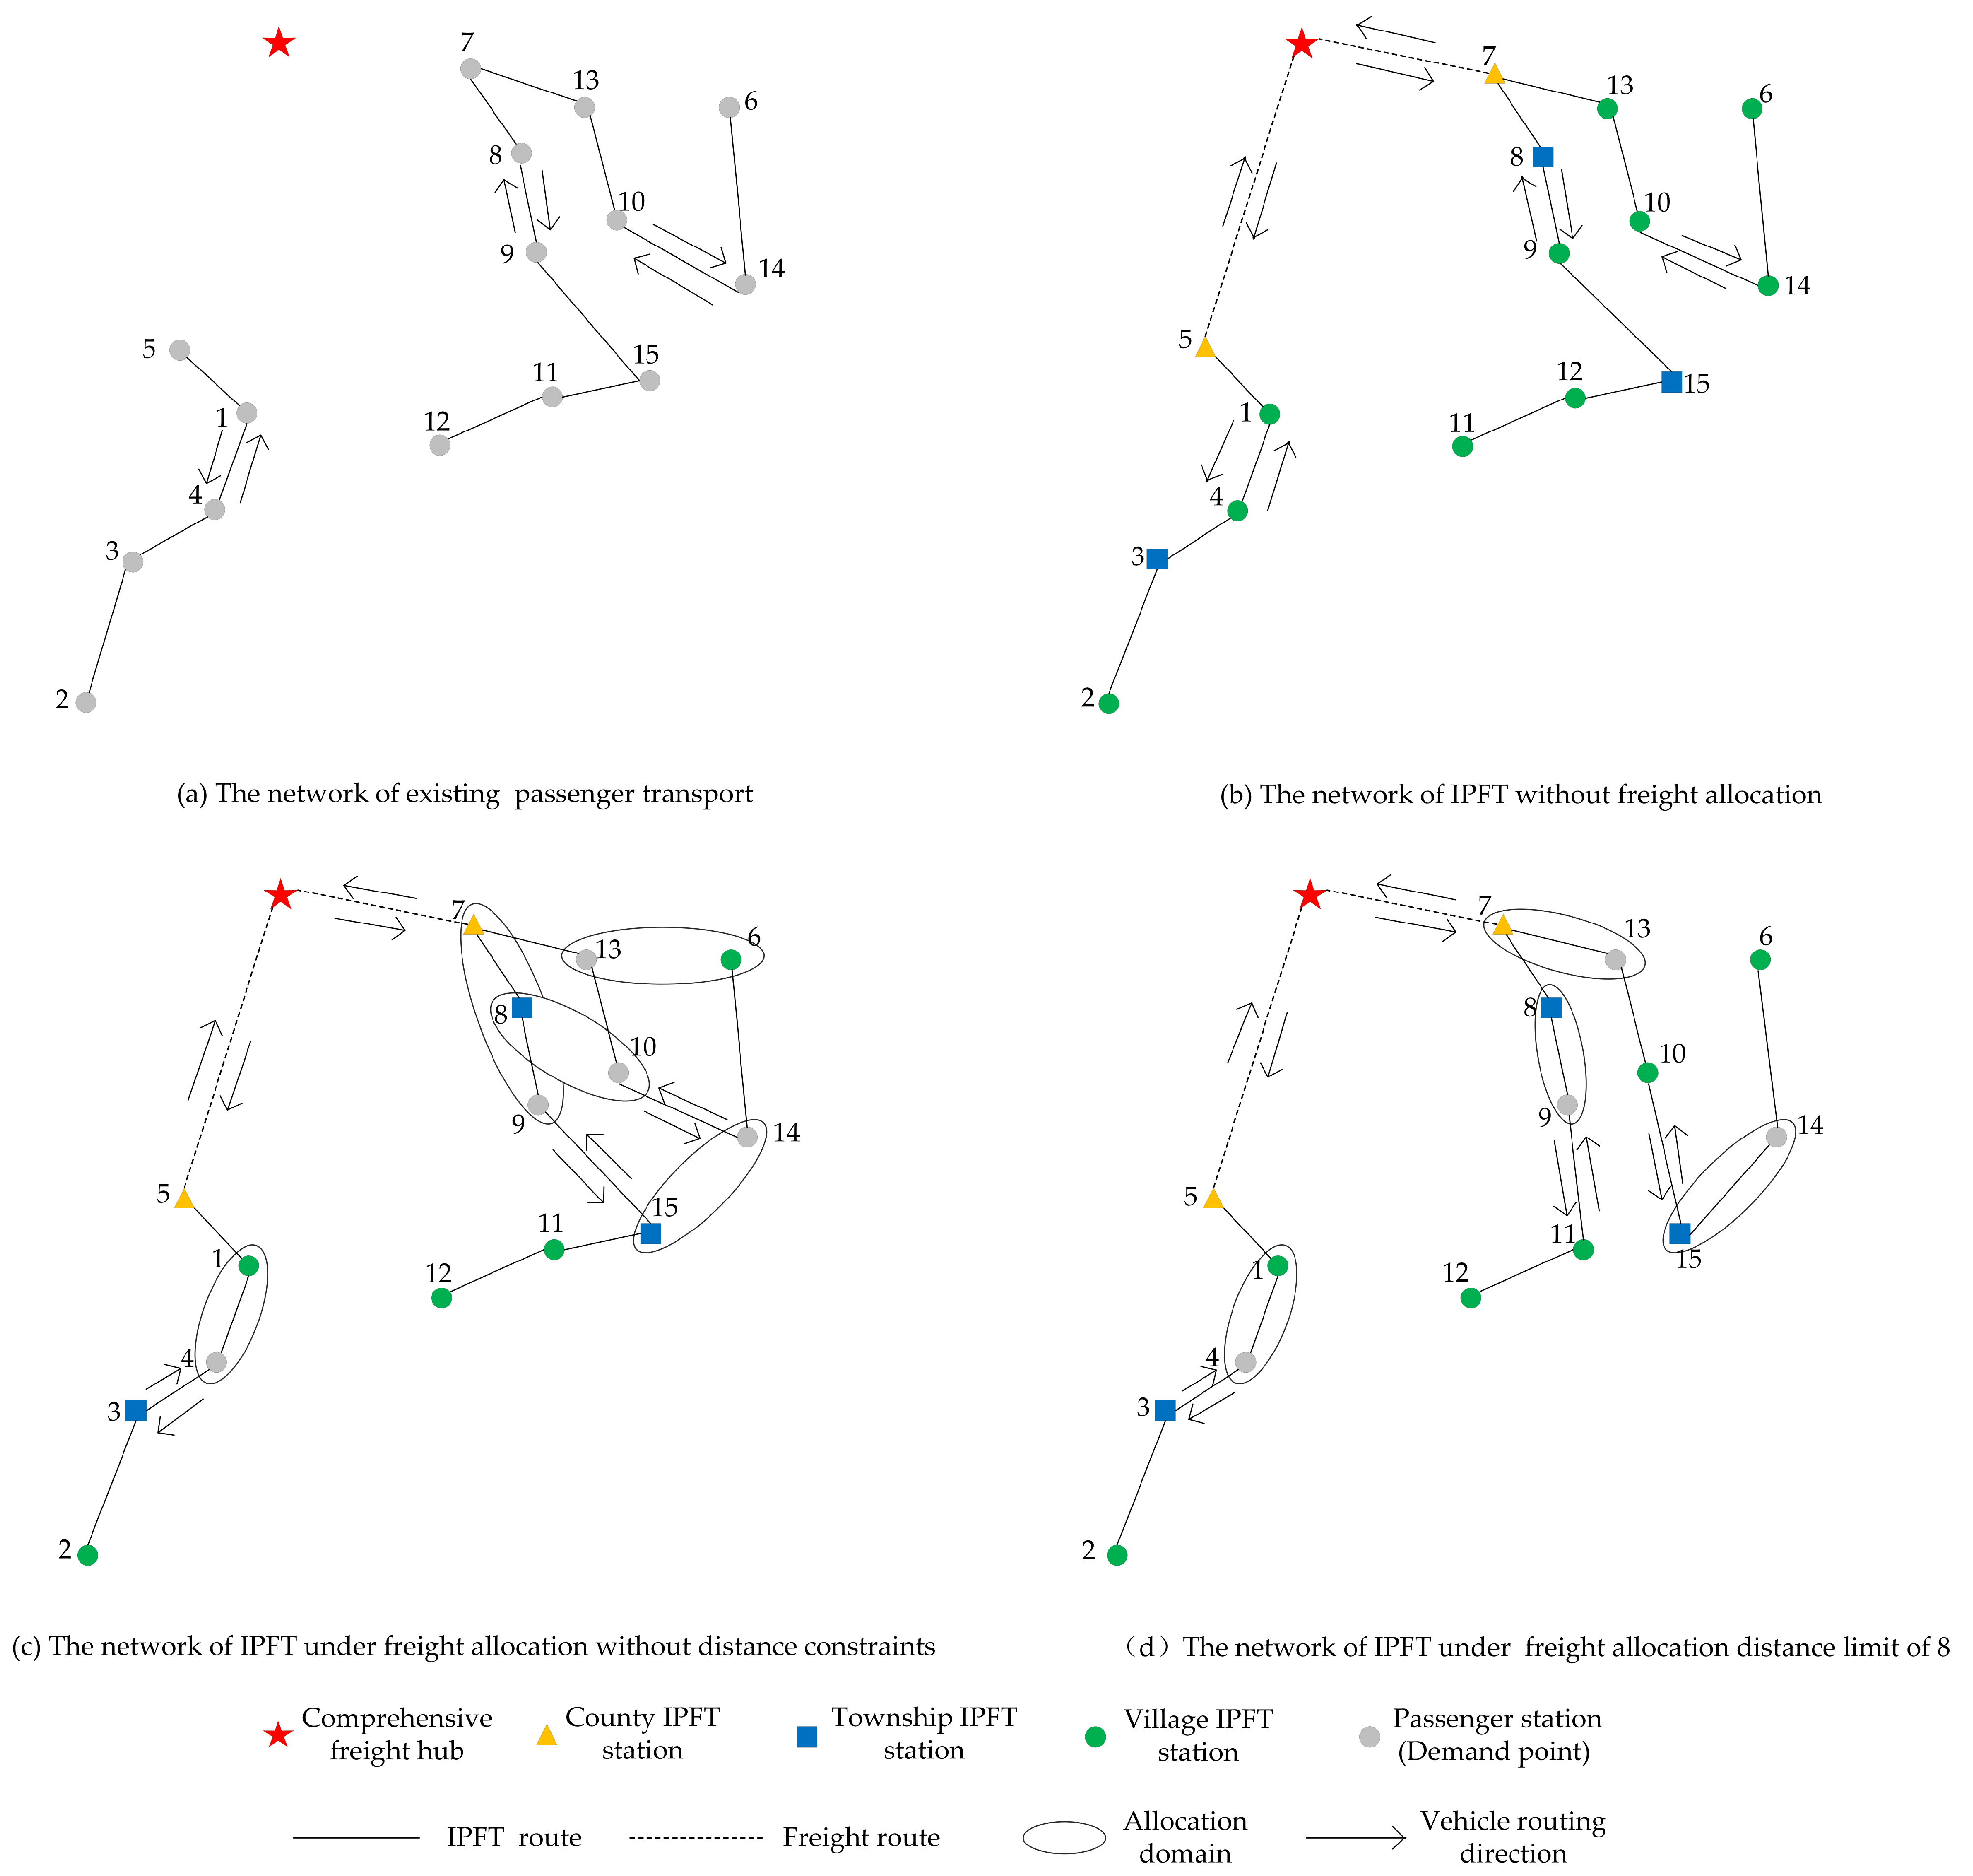
Figure 4 presents the comparison results.
Figure 4a shows the original public transport network without considering freight demand, and
Figure 4b presents the result of the model without freight allocation, in which IPFT stations are established at each station.
Figure 4c shows the optimal result when freight allocation is allowed, without any constraints on the freight allocation distance.
Figure 4d presents the results of the proposed model, in which the maximum freight allocation distance is set to 8.
The comparison between
Figure 4a and
Figure 4d shows that, under the IPFT, two county IPFT stations are constructed at stations 5 and 7; three township IPFT stations are constructed at stations 3, 8, and 15; and six village IPFT stations are constructed at stations 1, 2, 6, 11, 12, and 10. Meanwhile, the freight demand is allocated as follows: 4→1, 9→8, 13→7, and 14→15. Accordingly, three routes are restructured: 5-1-4-3-2, 7-8-9-11-12, and 7-13-10-15-14-6.
Figure 4b shows the planning result without freight allocation. Compared to
Figure 4d, villagers no longer need to handle pickup or delivery of freight alone, leading to higher villager satisfaction. However, the initial construction cost increases by 17.02%.
A comparison between
Figure 4c and
Figure 4d shows that the number of IPFT stations is reduced, resulting in a lower initial construction cost. However, there is a phenomenon of cross-station allocation. For example, the freight demand at station 9 is allocated to the farther IPFT station 7, bypassing the nearest IPFT station 8. In such cases, the cost of self-pickup and delivery increases by 63.81%, leading to a decline in villager satisfaction. This comparison demonstrates that the proposed model effectively achieves station location selection and route planning. By appropriately constraining the freight allocation distance, the model achieves a balance between villager satisfaction and initial construction costs.
5.2.2. Advantages of the IPFT
This section analyzes the saved cost using the IPFT model. A comparison is made between the transport and operational costs of the independent passenger and freight transport modes and the mode proposed in this study. In the proposed model, the maximum freight allocation distance and the unit distance cost multiplier for village self-pickup and delivery are two key factors influencing transport and operational costs. Therefore, the comparative results under different values of these two parameters are examined.
Table 6 presents the comparison results between the two modes, where the third column presents the construction cost of the IPFT station, the forth column presents the self-pickup cost, the fifth column presents the sum of transportation and operational costs of this model with the IPFT, the sixth column presents that of the comparison model with pure passenger transport and pure freight transport (PT + FT), the seventh column calculates the gap of saved cost, and the last column gives the average gap. The results show that the integrated mode effectively reduces transport and operational costs. Changes in the maximum freight allocation distance affect freight distribution relationships, thereby influencing the transport and operational costs. In contrast, changes in the unit distance cost multiplier for village self-pickup and delivery impact self-pickup costs, thereby affecting vehicle transport and operational costs.
As shown in
Table 6, when the cost multiplier is fixed, increasing the maximum freight allocation distance leads to a reduction in construction costs but an increase in self-pickup costs. The integrated transport mode achieves an average cost reduction of 11.14%, with the highest savings rate occurring when the maximum freight allocation distance is 4. When the distance limit is fixed, an increase in the cost multiplier results in higher self-pickup costs as well as increased transport and operational costs, with an average savings rate of 7.56%.
5.2.3. Advantages of the Three-Level Station Network
This section explores the cost savings achieved by the proposed three-level station network compared with the single-level station network under various conditions in order to validate the effectiveness of the proposed network.
Given the variance in freight demand among stations, the single-level station network is configured with a capacity equivalent to that of a county IPFT station to meet all freight demand.
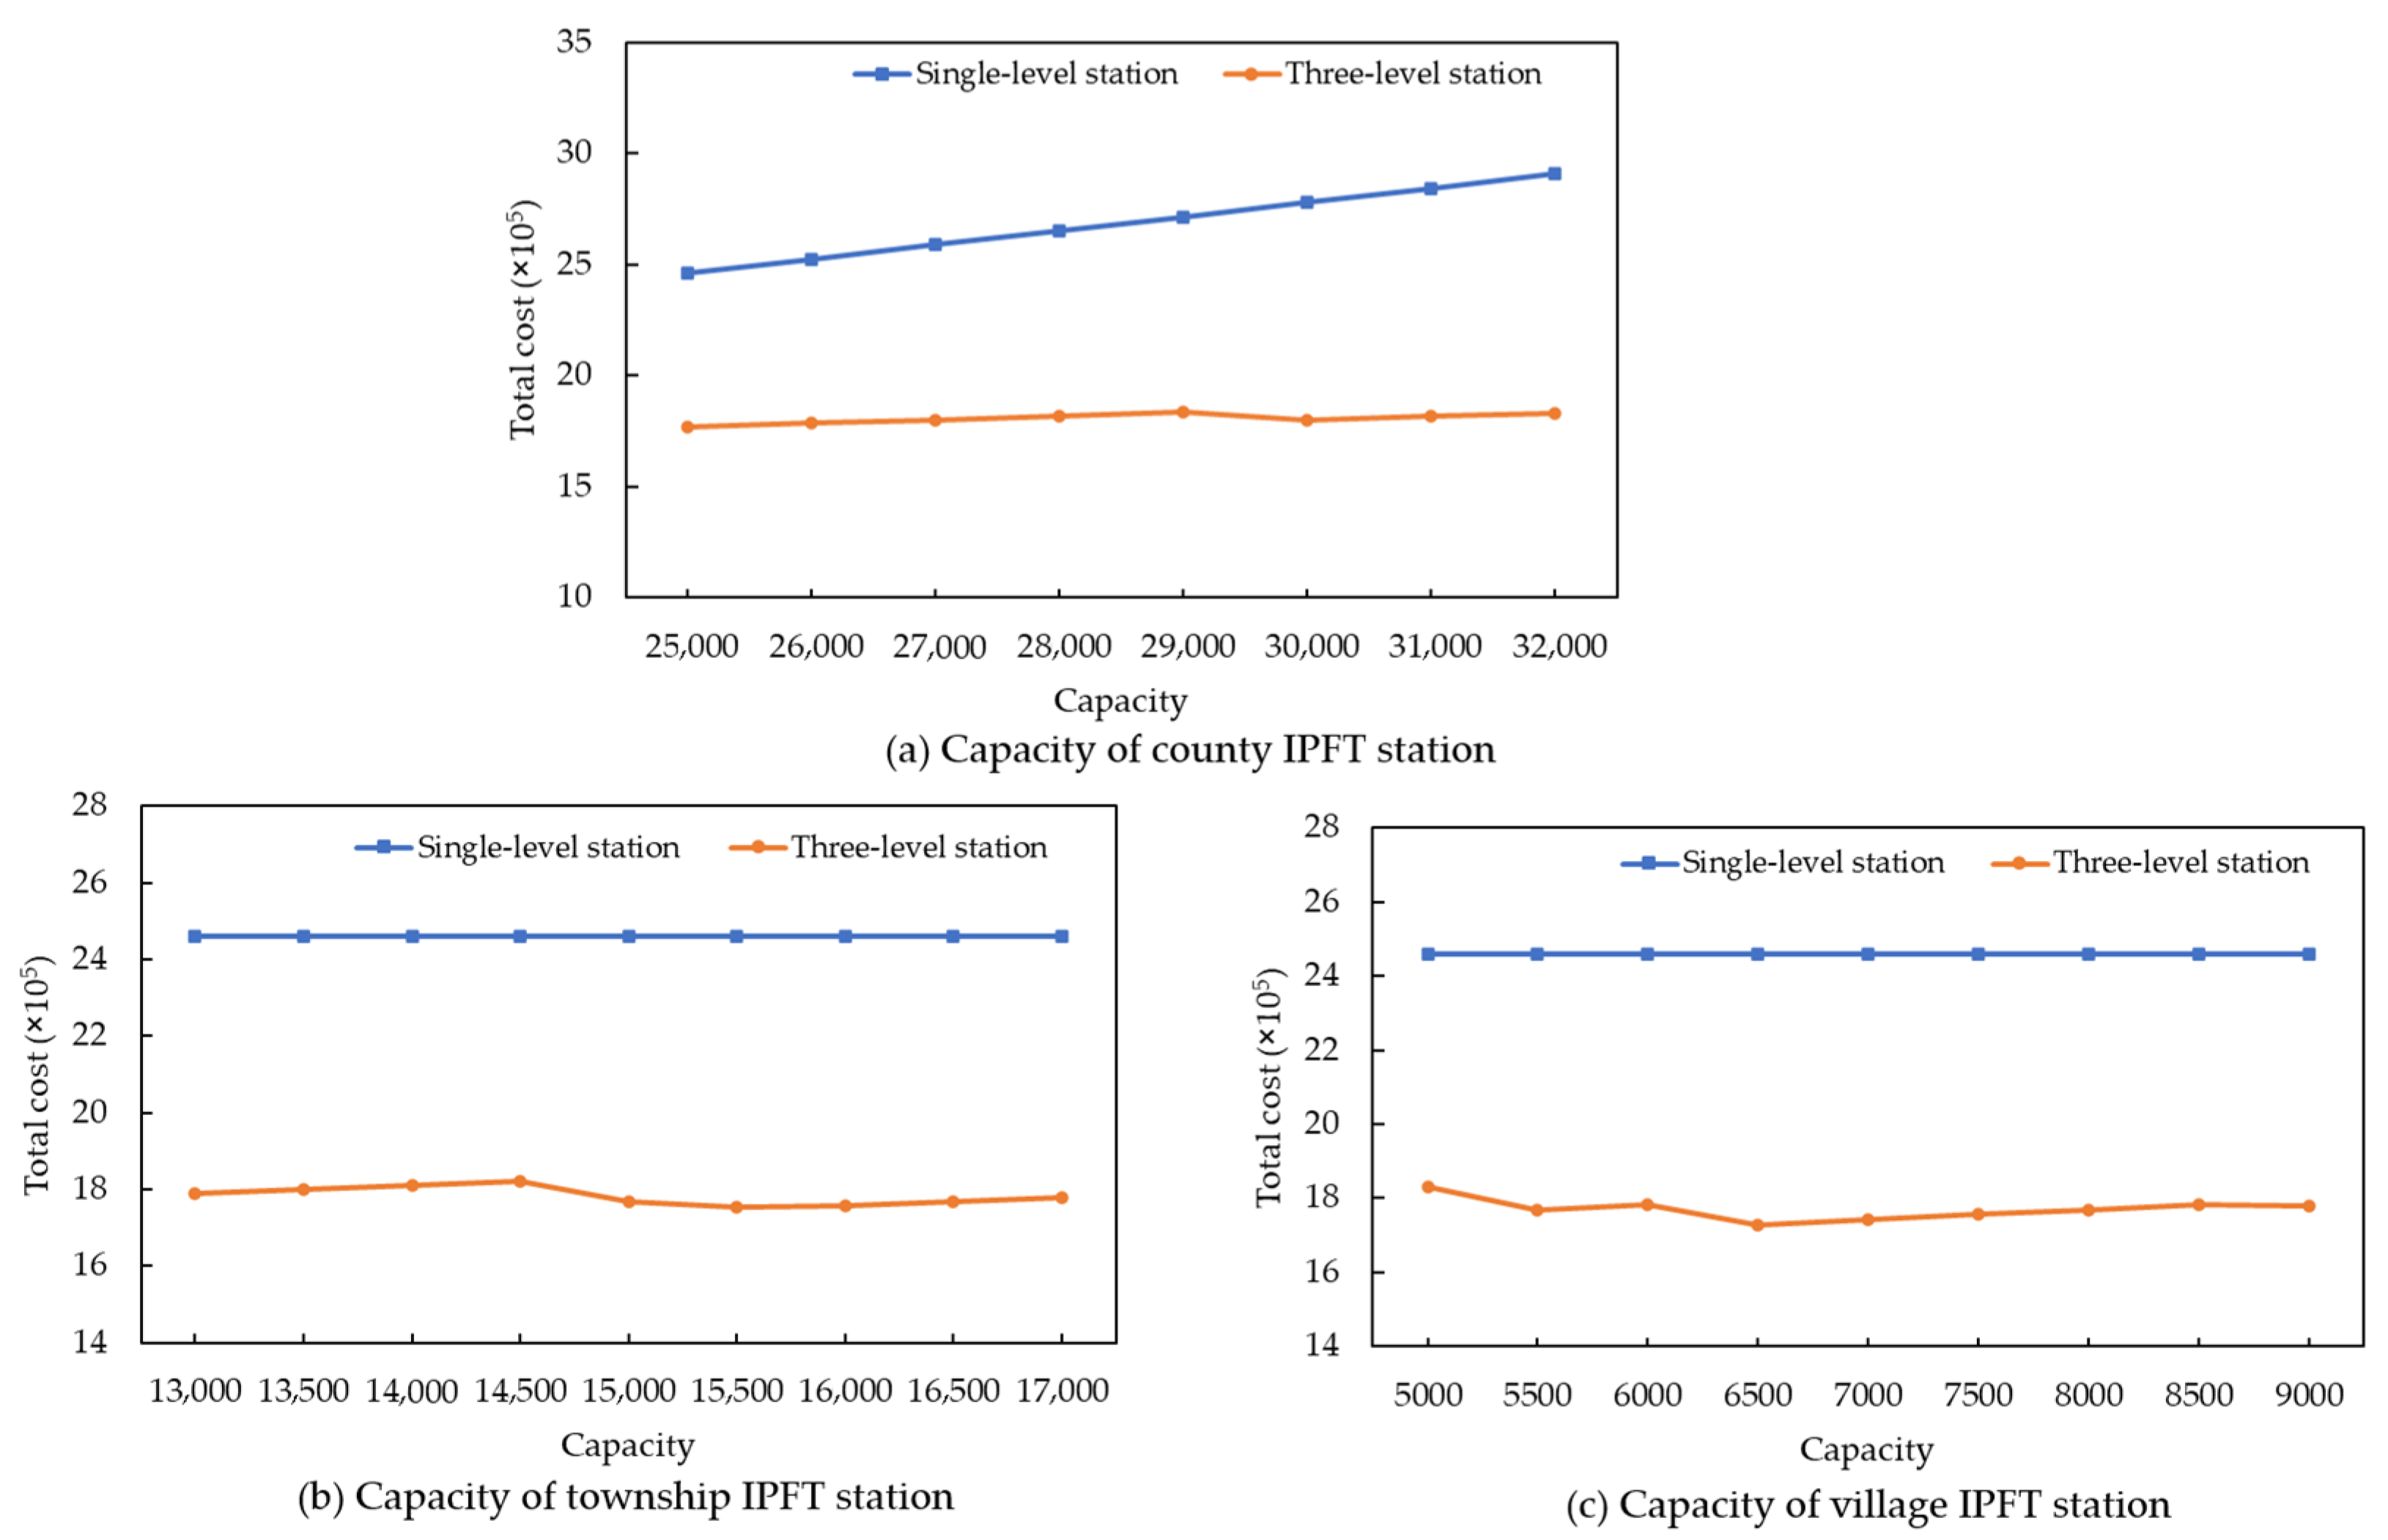
Figure 5a presents a comparison of the total costs between the single-level station and three-level station systems under different station capacities. The results indicate that the three-level station system significantly reduces total costs, with an average cost reduction of 32.48%. Although high-capacity single-level stations can accommodate more freight, the associated increase in construction costs under delivery distance constraints substantially raises the total cost. Moreover, the mismatch between low-demand stations and high-capacity stations in the single-level station network leads to resource underutilization and cost inefficiencies. In contrast, the three-level network allows for a more efficient allocation of freight demand from low-demand stations and improves resource utilization, ultimately leading to superior cost performance. The findings confirm the feasibility and economic benefits of the proposed three-level network.
Furthermore,
Figure 5b and
Figure 5c show the effects of township and village IPFT station capacities, respectively, on total costs within the three-level network, assuming a fixed capacity for the single-level station network. As shown in
Figure 5b, increasing the township IPFT station capacity results in a cost trend that first increases, then decreases, and subsequently increases again. When the capacity reaches 15,500, the total cost reaches its minimum, 27.49% lower than that of the single-level station network, with an average cost advantage of 25.99%. Similarly,
Figure 5c presents the impact of village IPFT station capacity on the total cost, showing an overall trend of initially decreasing and then increasing. The minimized total cost is observed when the station capacity reaches 6500, corresponding to a 27.99% cost reduction compared to the single-station network. On average, the three-level network achieves a 25.48% lower cost than the single-station network.
In summary, the comparative results indicate that a well-designed three-level station network more effectively balances construction costs and transport efficiency while minimizing resource waste. Thus, the three-level station network exhibits clear economic superiority and practical feasibility.
5.3. Sensitivity Analysis
This section conducts a sensitivity analysis to explore the impact of model parameters on the objective function and the network structure. The parameters analyzed include the capacity of village and township IPFT stations ( and ), the unit distance cost multiplier for village self-pickup and delivery (), and the number of routes () established in the second county.
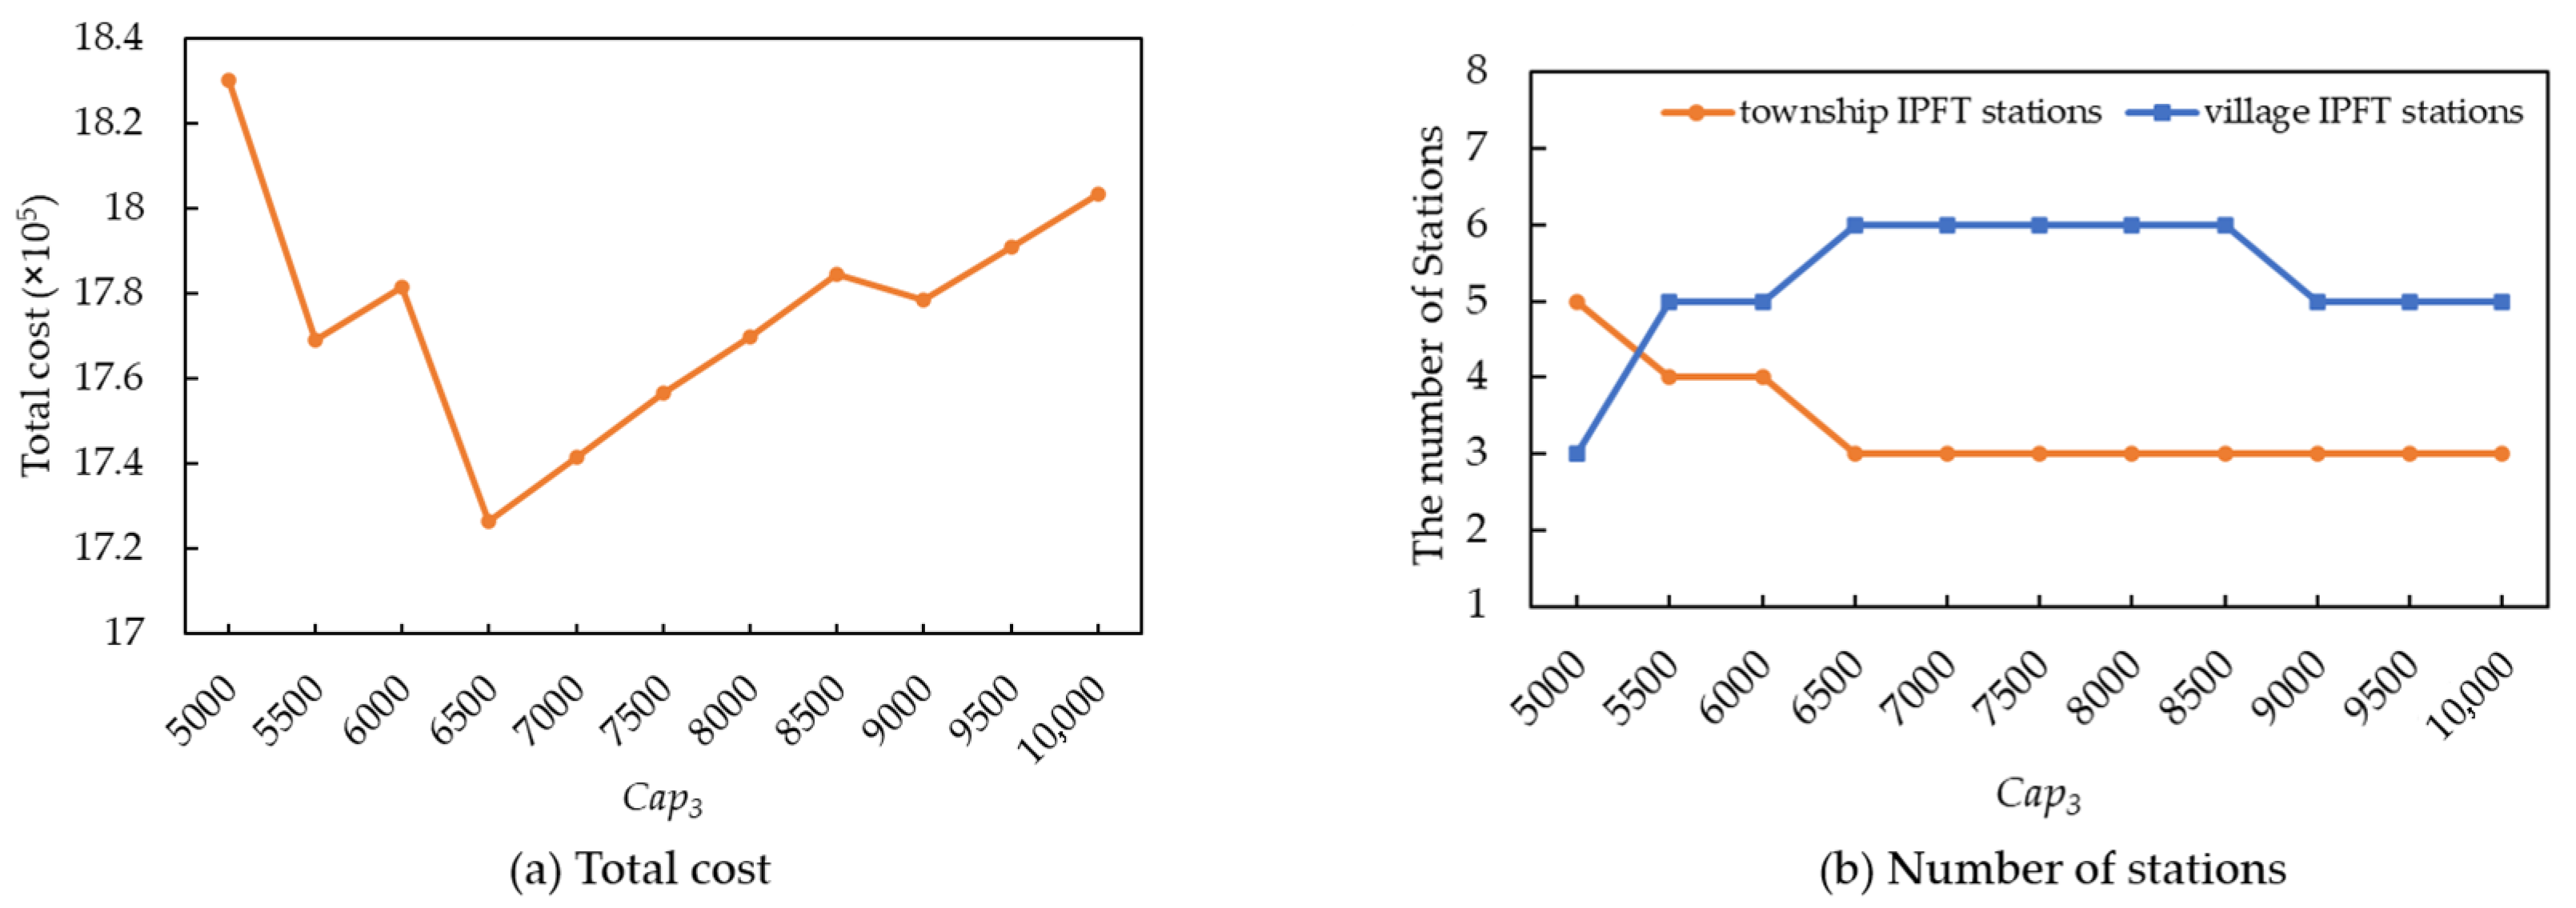
Figure 6 illustrates the impact of village IPFT station capacity on total cost and the number of stations. As the capacity gradually increases, the total cost exhibits a general trend of initially decreasing and then increasing. Meanwhile, the number of village IPFT stations increases, while the number of township IPFT stations decreases, with both eventually stabilizing. This phenomenon is closely related to the freight distribution relationship. As the capacity increases, each village IPFT station can accommodate more freight at a lower construction cost, resulting in a decrease in the number of township IPFT stations and an increase in village IPFT stations, thereby continuously reducing the total cost. When the capacity reaches 6500, the total cost reaches its minimum. However, with a further increase in station capacity, the limited freight demand has already been allocated to surrounding stations; the distribution relationship no longer changes. Therefore, the number of village and township IPFT stations stabilizes, while construction costs continue to rise, ultimately leading to an overall increase in total cost.
It is worth noting that the total cost increases slightly as capacity increases from 5500 to 6500. This is because the relatively small capacity increase is insufficient to alter the freight distribution relationship or the number of stations. However, the increase in capacity leads to higher construction costs, thereby causing a rise in the total cost. Conversely, the total cost decreases slightly when the capacity increases from 8500 to 9000. In this case, the capacity of a certain village station increases sufficiently to accommodate the freight demand from surrounding stations. As a result, the number of village stations decreases, leading to lower construction costs and a slight decline in the total cost.
Figure 7 illustrates the sensitivity of the capacity of township IPFT stations. It can be seen that, when the capacity is less than 14,500, the total cost increases steadily with capacity, where the number of stations remains unchanged. This is because the increase in station capacity leads to higher construction costs but does not affect the freight distribution relationship.
When the capacity increases from 14,500 to 15,500, township IPFT stations are able to accommodate more freight from surrounding areas. As a result, the number of village IPFT stations decreases significantly. In contrast, the increase in township IPFT stations’ capacity leads to a reduction in total cost, reaching its minimum at a capacity of 15,500. As the capacity increases, the excessively high construction cost prevents further changes in the freight distribution relationship. Consequently, the number of stations remains unchanged, but the total cost continues to rise.
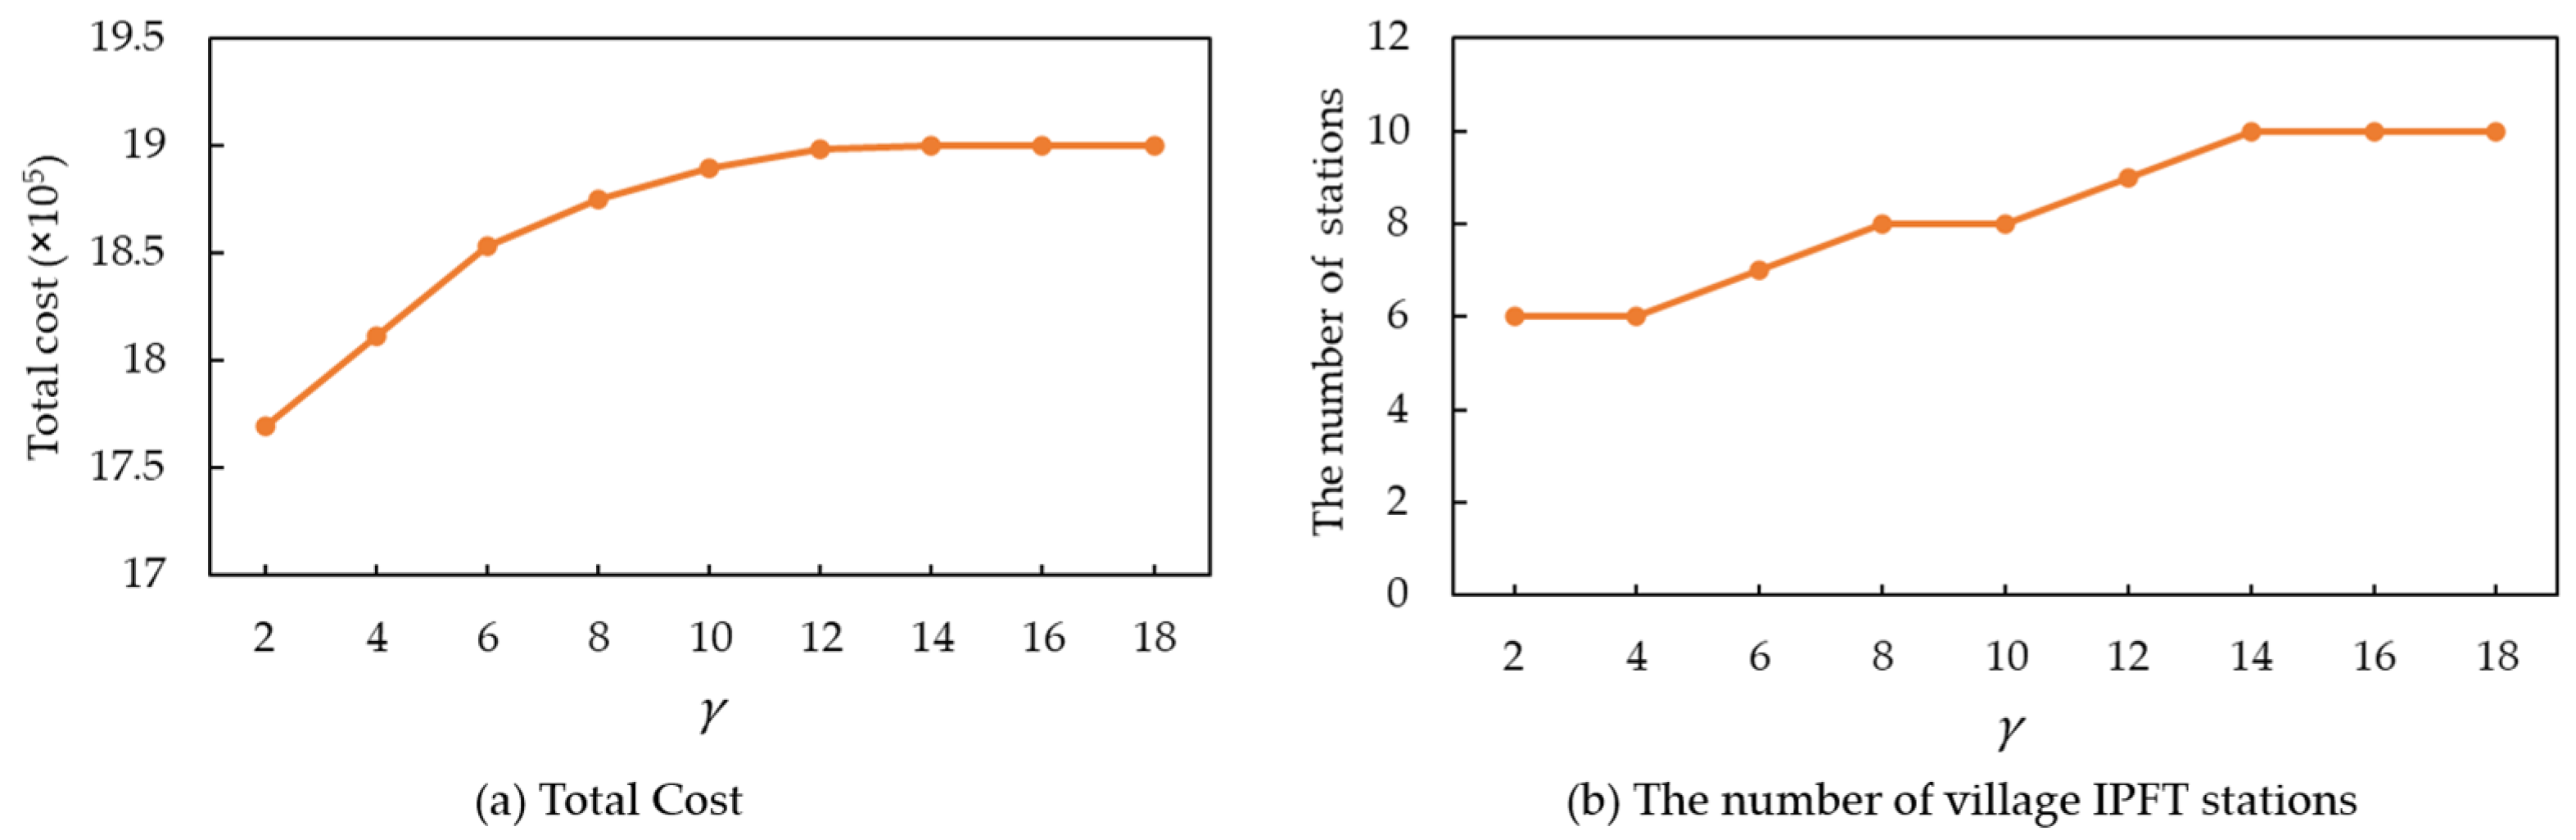
Figure 8 shows the sensitivity of the cost multiplier for self-pickup and delivery. It can be observed that, as the cost multiplier increases, both the total cost and the number of village IPFT stations continue to rise. When it reaches 14, the self-pickup cost exceeds the construction cost of establishing a station. Consequently, all stations are selected as IPFT stations without freight allocation. When it exceeds 14, both the total cost and the number of village IPFT stations remain unchanged.
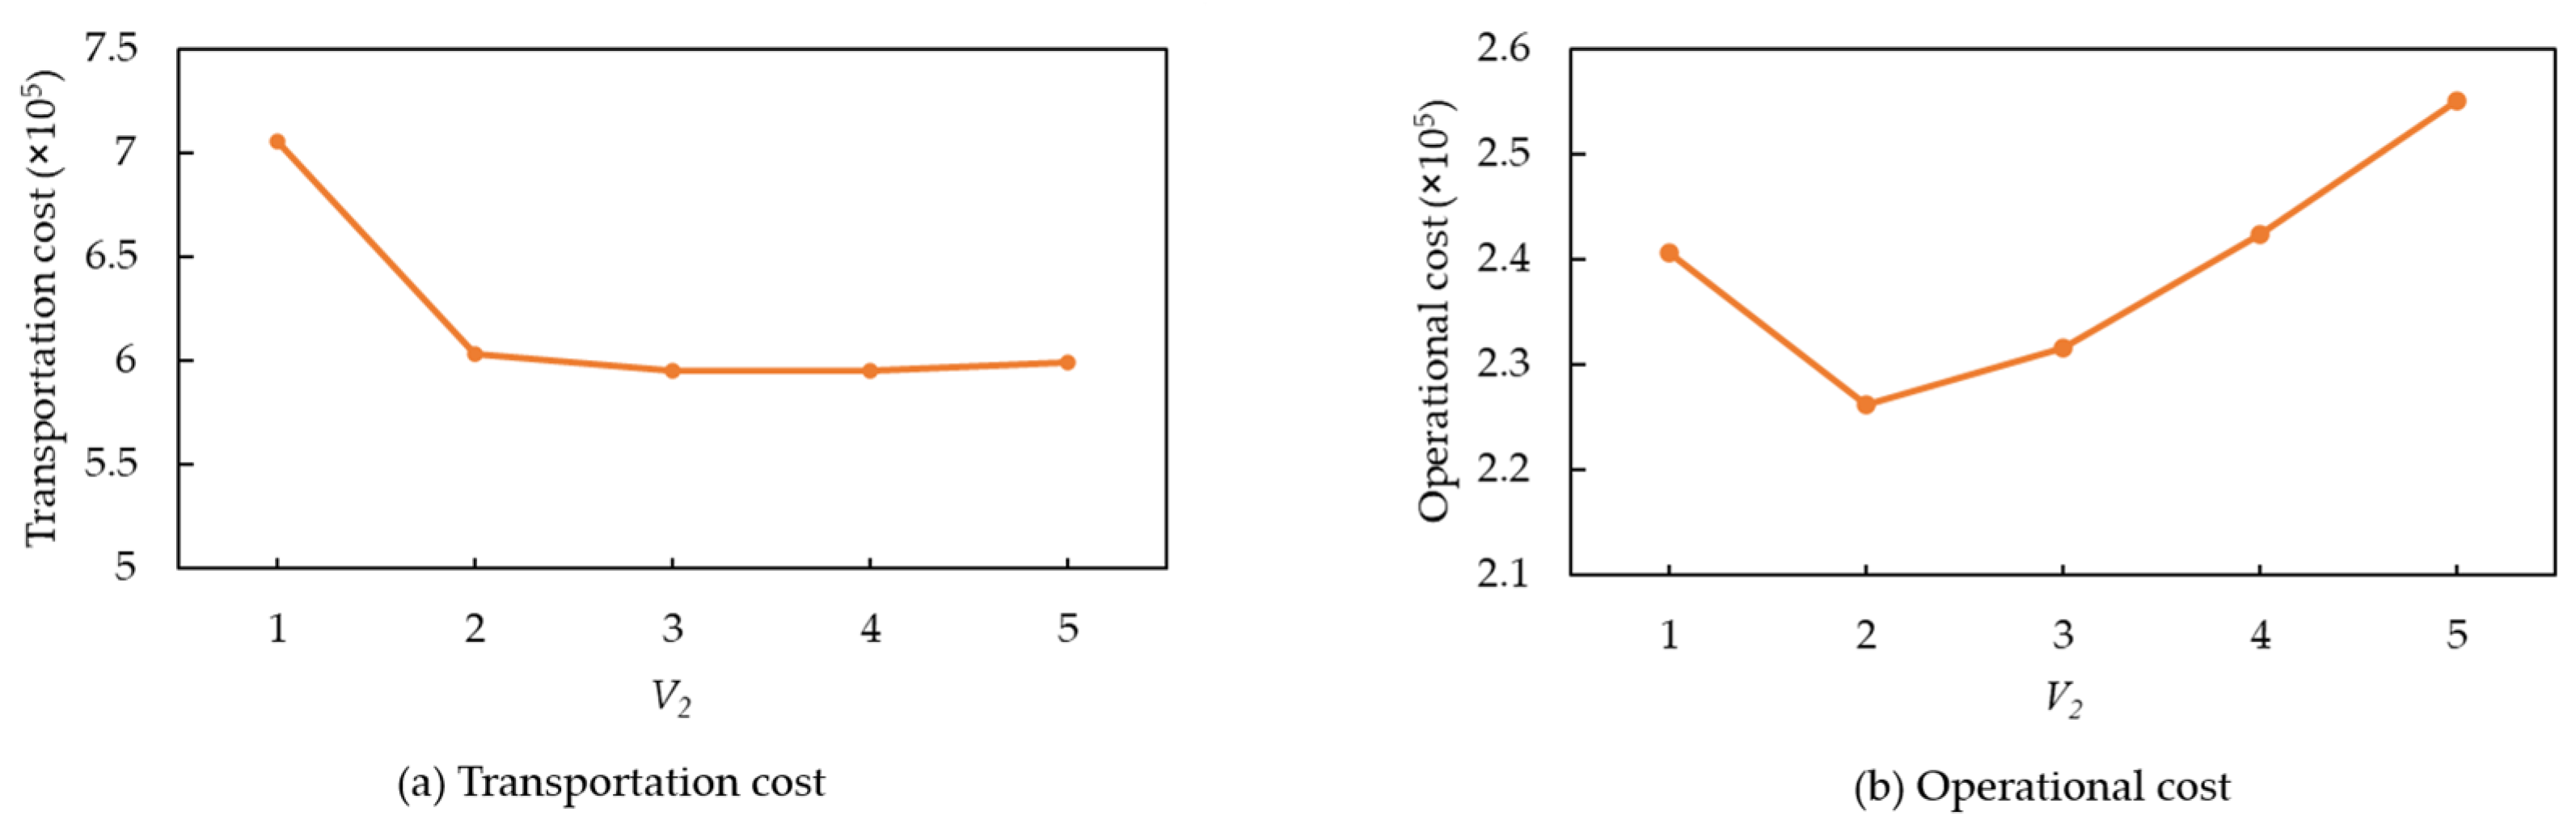
Figure 9 illustrates the sensitivity of the number of routes. It is evident that when the number of routes increases from 1 to 2, both transport and operational costs decrease significantly. However, as the number of routes continues to increase, transport costs stabilize, while operational costs rise significantly. This is because additional routes have a limited impact on freight allocation and transport efficiency, but they substantially increase the operational costs associated with each route.
6. Discussion
An analysis of the numerical experiment results reveals some important managerial implications for decision-makers.
Firstly, the IPFT by urban–rural buses can generate significant economic benefits. After implementing the IPFT network, transport operating costs were reduced by 11.41% compared to pure passenger transport and pure freight transport. It provides support for the economy and feasibility of the IPFT. However, it is worth noting that the maximum station allocation distance can significantly impact the construction cost and village satisfaction. As the distance limitation increases, the construction costs decrease, but the village satisfaction will also decrease. For example, when the allocation distance increases from 4 to 10, the construction cost decreases from 1,100,000 to 940,000. This indicates a reduction in initial investment for freight transport companies. However, the self-pickup cost increases from 0 to 42,000, suggesting a decline in villager satisfaction, which is unfavorable for long-term development. A smaller limitation might result in higher costs owing to constrained allocation flexibility, whereas a larger limitation could diminish villager satisfaction because of extended pickup distances. By comparison and trade-off, it offers a better balance between villager satisfaction and construction cost when the limitation is 6. This provides decision support for decision-makers to balance construction costs and villager satisfaction.
Furthermore, the county–township–village IPFT station can build a more reasonable IPFT network. According to the simulation-based results, the three–level station network can further reduce total costs, with an average cost reduction of 32.48%. Sensitivity analysis reveals that the capacity of stations has a significant impact on total costs. More stations are required when the capacity is low, resulting in higher construction costs. Conversely, if the capacity is too high, constraints on freight allocation distances may lead to resource underutilization. Therefore, managers should reasonably determine the station capacity based on the freight volume at the stations.
In addition, the total cost and the number of township and village IPFT stations are highly sensitive to the capacity of township and village IPFT stations, freight allocation distance limits, delivery and pickup cost multipliers, and the number of routes. As shown in the numerical experiments, the total cost is minimized when the capacity of village stations is set to 6500. When the capacity is less than 6500, the number of IPFT stations increases, leading to higher initial construction costs. When the capacity exceeds 6500, the limitation on allocation distance prevents stations from receiving sufficient freight, resulting in resource waste. A similar pattern is observed for township stations, where the minimum cost is achieved when the capacity is set to 15,500. Additionally, the unit distance cost multiplier for self-pickup and delivery directly affects the overall self-pickup cost. Managers should take measures to reduce self-pickup costs. The number of routes is also a critical decision variable. For example, when the number of routes increases from 1 to 2, the total cost decreases significantly. However, as more routes are added, operational costs rise, leading to an overall increase in total cost. Therefore, setting up two routes is the most reasonable choice for managers. Managers should determine appropriate routes based on real-world conditions to balance transport and operational costs.
In conclusion, for freight transport companies, adopting the IPFT and establishing a three-level station network can save transport and delivery costs while simultaneously improving parcel delivery service efficiency and enhancing villager satisfaction. However, an important issue that deserves careful consideration is how to effectively cooperate with public transport companies while ensuring profitability. For public transport companies, the IPFT increases vehicle utilization and enables more efficient resource allocation. By expanding into freight services, public transport companies can gain additional revenue, thereby achieving financial sustainability. Although the IPFT can bring significant profits, public transport companies must ensure it does not come at the expense of the passenger experience. This requires careful consideration of how to minimize passenger waiting times while handling freight loading and unloading operations. Furthermore, although the model proposed in this study effectively integrates passenger and freight transport, it does not fully account for various real-world factors, such as passenger transfer issues, the potential impact of freight transport on passengers, and uncertainties in the transport process. These aspects require further exploration in future research.
7. Conclusions and Future Direction
This study investigates the county–township–village station location-routing problem for the IPFT by urban–rural buses. A mixed-integer linear programming model is proposed to minimize the total cost, considering constraints related to the location of county, township, and village IPFT stations, freight allocation distance limits, and open route planning. Numerical experiments are conducted to validate the performance of the proposed model, and a sensitivity analysis is presented. The results prove the advantages of the IPFT and the county–township–village station network and provide some valuable insights for managers.
Future research will be extended in these three main directions. First, future work could incorporate real-world case studies or empirical data to validate the effectiveness of the proposed model. Second, future work could develop efficient and accurate algorithms tailored to solve the proposed model more effectively. Third, future work could introduce demand-responsive transit as the transport carrier for the IPFT, enhancing the flexibility of the IPFT in meeting customer needs.
Author Contributions
Conceptualization, X.S.; methodology, X.S. and J.S.; software, J.S.; validation, X.S., J.S. and X.C.; formal analysis, X.S., J.S. and X.C.; investigation, J.S.; resources, X.S., X.C. and H.S.; data curation, X.S. and J.S.; writing—original draft preparation, X.S. and J.S.; writing—review and editing, X.S. and J.S.; visualization, X.S., J.S. and H.S.; supervision, X.C. and H.S.; project administration, X.C. and H.S. All authors have read and agreed to the published version of the manuscript.
Funding
This research was supported by the National Natural Science Foundation of China (No. 72201144), the Provincial Natural Science Foundation of Shandong (Nos. ZR2022QG025, ZR2023MG076), the Humanities and Social Sciences Foundation of the Ministry of Education of China (22YJC630129), and the Taishan Scholars Project Funding (tsqn202306169).
Data Availability Statement
The data presented in this study are available upon request from the corresponding author.
Conflicts of Interest
The authors declare no conflicts of interest.
Abbreviations
The following abbreviations are used in this manuscript:
| IPFT | Integration of passenger and freight transport |
| LRP | Location-routing problem |
| PT | Passenger transport |
| FT | Freight transport |
Appendix A
For the sake of comparison, we adopt the starting station of the pure public transport network model from the IPFT, setting it as the location of the county IPFT station in the IPFT network, denoted as
. The following content provides a detailed presentation of the mathematical programming model of the existing passenger transport network mentioned in this paper. In this model, we have removed the constraints related to location selection and allocation, focusing only on routing for the passenger demand at each station.
s.t. Appendix B
The following presents the detailed mathematical programming model of the bus network without freight allocation constraints. In the model, we have removed the constraint regarding the maximum limit of the freight distribution distance.
s.t.References
- Cavallaro, F.; Nocera, S. Integration of Passenger and Freight Transport: A Concept-Centric Literature Review. Res. Transp. Bus. Manag. 2022, 43, 100718. [Google Scholar] [CrossRef]
- State Council of the People’s Republic of China. Further Regulating Rural Passenger-Freight-Mail Operations for Passenger Peace of Mind and Safe Goods. Available online: https://www.gov.cn/zhengce/202412/content_6990663.htm (accessed on 7 July 2025).
- Antoniou, C.; Nocera, S.; Susilo, Y. The Integration of Passenger and Freight Transport: Trends, Gaps and Future Research Challenges. Transp. Res. Part A Policy Pract. 2023, 173, 103724. [Google Scholar] [CrossRef]
- Pietrzak, O.; Pietrzak, K. Cargo Tram in Freight Handling in Urban Areas in Poland. Sustain. Cities Soc. 2021, 70, 102902. [Google Scholar] [CrossRef]
- Ren, T.; Jiang, Z.; Cai, X.; Yu, Y.; Xing, L.; Zhuang, Y.; Li, Z. A Dynamic Routing Optimization Problem Considering Joint Delivery of Passengers and Parcels. Neural Comput. Appl. 2021, 33, 10323–10334. [Google Scholar] [CrossRef]
- Azcuy, I.; Agatz, N.; Giesen, R. Designing Integrated Urban Delivery Systems Using Public Transport. Transp. Res. Part E Logist. Transp. Rev. 2021, 156, 102525. [Google Scholar] [CrossRef]
- Schröder, S.; Liedtke, G.T. Towards an Integrated Multi-Agent Urban Transport Model of Passenger and Freight. Res. Transp. Econ. 2017, 64, 3–12. [Google Scholar] [CrossRef]
- Nieto-Isaza, S.; Fontaine, P.; Minner, S. The Value of Stochastic Crowd Resources and Strategic Location of Mini-Depots for Last-Mile Delivery: A Benders Decomposition Approach. Transp. Res. Part B Methodol. 2022, 157, 62–79. [Google Scholar] [CrossRef]
- Bruzzone, F.; Nocera, S.; Pesenti, R. Feasibility and Optimization of Freight-on-Transit Schemes for the Sustainable Operation of Passengers and Logistics. Res. Transp. Econ. 2023, 101, 101336. [Google Scholar] [CrossRef]
- Li, Z.; Shalaby, A.; Roorda, M.J.; Mao, B. Urban Rail Service Design for Collaborative Passenger and Freight Transport. Transp. Res. Part E Logist. Transp. Rev. 2021, 147, 102205. [Google Scholar] [CrossRef]
- Masson, R.; Trentini, A.; Lehuédé, F.; Malhéné, N.; Péton, O.; Tlahig, H. Optimization of a City Logistics Transportation System with Mixed Passengers and Goods. EURO J. Transp. Logist. 2017, 6, 81–109. [Google Scholar] [CrossRef]
- Machado, B.; Pimentel, C.; Sousa, A.D. Integration Planning of Freight Deliveries into Passenger Bus Networks: Exact and Heuristic Algorithms. Transp. Res. Part A Policy Pract. 2023, 171, 103645. [Google Scholar] [CrossRef]
- Lu, C.-C.; Diabat, A.; Li, Y.-T.; Yang, Y.-M. Combined Passenger and Parcel Transportation Using a Mixed Fleet of Electric and Gasoline Vehicles. Transp. Res. Part E Logist. Transp. Rev. 2022, 157, 102546. [Google Scholar] [CrossRef]
- Xue, S.; Zhang, Q.; Shiwakoti, N. Sharing a Ride: A Dual-Service Model of People and Parcels Sharing Taxis with Loose Time Windows of Parcels. Systems 2024, 12, 302. [Google Scholar] [CrossRef]
- Qu, X.; Wang, S.; Niemeier, D. On the Urban-Rural Bus Transit System with Passenger-Freight Mixed Flow. Commun. Transp. Res. 2022, 2, 100054. [Google Scholar] [CrossRef]
- Wang, T.; Shao, H.; Qu, X.; Eliasson, J. Consolidating Passenger and Freight Transportation in an Urban–Rural Transit System. Fundam. Res. 2024, 4, 1603–1612. [Google Scholar] [CrossRef]
- Yang, T.; Chu, Z.; Wang, B. Feasibility on the Integration of Passenger and Freight Transportation in Rural Areas: A Service Mode and an Optimization Model. Socio-Econ. Plan. Sci. 2023, 88, 101665. [Google Scholar] [CrossRef]
- Cavallaro, F.; Nocera, S. Flexible-Route Integrated Passenger–Freight Transport in Rural Areas. Transp. Res. Part A Policy Pract. 2023, 169, 103604. [Google Scholar] [CrossRef]
- He, D.; Ceder, A.A.; Zhang, W.; Guan, W.; Qi, G. Optimization of a Rural Bus Service Integrated with E-Commerce Deliv eries Guided by a New Sustainable Policy in China. Transp. Res. Part E Logist. Transp. Rev. 2023, 172, 103069. [Google Scholar] [CrossRef]
- Xue, Y.; Liu, J.; Tu, H.; Bao, G.; He, T.; Qiu, Y.; Bi, Y.; Guan, H. Research on the Optimization of Urban–Rural Passenger and Postal Integration Operation Scheduling Based on Uncertainty Theory. Sustainability 2024, 16, 10268. [Google Scholar] [CrossRef]
- Zhou, X.; Zhao, C.; Xie, F. Collaborative Delivery Route Planning for Rural Public Buses and Express Delivery Vehicles Based on Passenger and Freight Integration. Transp. Res. Rec. J. Transp. Res. Board 2025, 2679, 381–408. [Google Scholar] [CrossRef]
- Bing, X.; Li, Z.; Fu, X. Optimization of Urban–Rural Bus Services with Shared Passenger-Freight Transport: Formulation and a Case Study. Transp. Res. Part A Policy Pract. 2025, 192, 104355. [Google Scholar] [CrossRef]
- Liu, J.; Kachitvichyanukul, V. A Particle Swarm Optimisation Algorithm for the Capacitated Location-Routing Problem. Int. J. Oper. Res. 2015, 24, 184–213. [Google Scholar] [CrossRef]
- Rabbani, M.; Amirhossein Sadati, S.; Farrokhi-Asl, H. Incorporating Location Routing Model and Decision Making Techniques in Industrial Waste Management: Application in the Automotive Industry. Comput. Ind. Eng. 2020, 148, 106692. [Google Scholar] [CrossRef]
- Berger, R.T.; Coullard, C.R.; Daskin, M.S. Location-Routing Problems with Distance Constraints. Transp. Sci. 2007, 41, 29–43. [Google Scholar] [CrossRef]
- Jouzdani, J.; Fathian, M. A Linear MmTSP Formulation of Robust Location-Routing Problem: A Dairy Products Supply Chain Case Study. Int. J. Appl. Decis. Sci. 2014, 7, 327–342. [Google Scholar] [CrossRef]
- Almouhanna, A.; Quintero-Araujo, C.L.; Panadero, J.; Juan, A.A.; Khosravi, B.; Ouelhadj, D. The Location Routing Problem Using Electric Vehicles with Constrained Distance. Comput. Oper. Res. 2020, 115, 104864. [Google Scholar] [CrossRef]
- Irawan, C.A.; Jones, D. Formulation and Solution of a Two-Stage Capacitated Facility Location Problem with Multilevel Ca pacities. Ann. Oper. Res. 2019, 272, 41–67. [Google Scholar] [CrossRef]
- Zhou, Y.; Yu, H.; Li, Z.; Su, J.; Liu, C. Robust Optimization of a Distribution Network Location-Routing Problem Under Carbon Trading Policies. IEEE Access 2020, 8, 46288–46306. [Google Scholar] [CrossRef]
- Wang, Y.; Zhou, J.; Sun, Y.; Wang, X.; Zhe, J.; Wang, H. Electric Vehicle Charging Station Location-Routing Problem with Time Windows and Resource Sharing. Sustainability 2022, 14, 11681. [Google Scholar] [CrossRef]
- Jalili Marand, A.; Hoseinpour, P. Profit Maximization in Congested Hub Location Problems: Demand Models and Service Level Constraints. Transp. Res. Part E Logist. Transp. Rev. 2025, 195, 103995. [Google Scholar] [CrossRef]
- Pichka, K.; Bajgiran, A.H.; Petering, M.E.H.; Jang, J.; Yue, X. The Two Echelon Open Location Routing Problem: Mathematical Model and Hybrid Heuristic. Comput. Ind. Eng. 2018, 121, 97–112. [Google Scholar] [CrossRef]
- Zhen, L.; Tan, Z.; Wang, S.; Yi, W.; Lyu, J. Shared Mobility Oriented Open Vehicle Routing with Order Radius Decision. Transp. Res. Part A Policy Pract. 2021, 144, 19–33. [Google Scholar] [CrossRef]
- Heidari, A.; Imani, D.M.; Khalilzadeh, M.; Sarbazvatan, M. Green Two-Echelon Closed and Open Location-Routing Problem: Application of NSGA-II and MOGWO Metaheuristic Approaches. Environ. Dev. Sustain. 2023, 25, 9163–9199. [Google Scholar] [CrossRef]
| Disclaimer/Publisher’s Note: The statements, opinions and data contained in all publications are solely those of the individual author(s) and contributor(s) and not of MDPI and/or the editor(s). MDPI and/or the editor(s) disclaim responsibility for any injury to people or property resulting from any ideas, methods, instructions or products referred to in the content. |
© 2025 by the authors. Licensee MDPI, Basel, Switzerland. This article is an open access article distributed under the terms and conditions of the Creative Commons Attribution (CC BY) license (https://creativecommons.org/licenses/by/4.0/).


