
Decision Analysis Data Model for Digital Engineering Decision Management

 ,
,  ,
,
Abstract
1. Introduction
- Enable trusted collaboration and interactions through a digital ecosystem;
- Provide analytical frameworks for managing the lifecycle of complex systems;
- Widely adopt reuse practices.
1.1. Review of Research on Decision Analysis Data in Systems Engineering
- MIL-STD 499B [3], published in 1994, describes a requirement for a decision data base, which is “a repository of information used and generated by the systems engineering process, at the appropriate level of detail. The intent of the decision data base is that, when properly structured, it provides access to the technical information, decisions, and rationale that describe the current state of system development and its evolution”.
- The NASA Systems Engineering Handbook was initially published as NASA/SP-6105 in 1995. The 2007 revision describes a need to obtain a comprehensive set of data to support decision making while the initial 1995 publication does not. The most recent version of the NASA handbook [4], published in 2019, states, “Once the technical team recommends an alternative to a NASA decision-maker (e.g., a NASA board, forum, or panel), all decision analysis information should be documented. The team should produce a report to document all major recommendations to serve as a backup to any presentation materials used. The important characteristic of the report is the content, which fully documents the decision needed, assessments done, recommendations, and decision finally made.” In addition to prescribing the need to document decision analysis information, the NASA Systems Engineering Handbook prescribes that the process must be risk-informed, which may include both qualitative and quantitative techniques.
- The INCOSE Systems Engineering Handbook was initially published in 1997. Version 4 of the Handbook, published in 2015, was the first version to describe the need to obtain a comprehensive set of data to support decision making. The INCOSE Systems Engineering Handbook [1], published in 2023, states “Decisions should be documented using digital engineering artifacts. Reports that include the analysis, decisions, and rationale are important for historical traceability and future decisions”. The INCOSE Systems Engineering Handbook prescribes that the process must identify uncertainties and conduct probabilistic analysis.
1.2. Review of Research on Architectural Patterns, Reference Models, and Reference Architectures for Engineering Decisions
- An architectural pattern is a description of element and relation types together with a set of constraints on how they may be used. A pattern can be thought of as a set of constraints on an architecture—on the element types and their patterns of interaction—and these constraints define a set or family of architectures that satisfy them. One of the most useful aspects of patterns is that they exhibit known quality attributes.
- A reference model is a division of functionality together with data flow between the pieces. A reference model is a standard decomposition of a known problem into parts that cooperatively solve the problem. Reference models are a characteristic of mature domains.
- A reference architecture is a reference model mapped into software elements (that cooperatively implement the functionality defined in the reference model) and the data flows between them. Whereas a reference model divides the functionality, a reference architecture is the mapping of that functionality onto a system decomposition.
- Level 0—The physical manufacturing process.
- Level 1—Intelligent devices in the manufacturing process such as process sensors, analyzers, actuators, and related instrumentation.
- Level 2—Control systems for the manufacturing process such as real-time controls and software, human–machine interfaces, and supervisory control and data acquisition (SCADA) software.
- Level 3—Manufacturing workflow management such as. batch management; manufacturing execution/operations management systems (MES/MOMS); laboratory, maintenance, and plant performance management systems; and data collection and related middleware.
- Level 4—Business logistics management such as enterprise resource planning (ERP), which establishes the plant production schedule, material use, shipping, and inventory levels.
- Structure, which includes Class, Component, Composite Structure, Deployment, Object, and Package diagrams;
- Behavior, which includes Activity, State machine, and Use Case diagrams;
- Interaction, which includes Collaboration—Communication, Interaction Overview, Sequence, and Timing diagrams.
- Structure, which includes Class—renamed to be Block, Package, and Parametric (new) diagrams and eliminates Component, Composite Structure, Deployment, and Object diagrams;
- Behavior, which includes Activity (modified), State Machine, and Use Case diagrams;
- Interaction, which includes Sequence diagrams and eliminate Collaboration—Communication, Interaction Overview, and Timing diagrams; and
- Requirements (new), which includes the Requirement (new) diagram.
- Decision Requirements Diagrams show how the elements of decision-making are linked into a dependency network.
- Decision tables to represent how each decision in such a network can be made.
- Business context for decisions such as the roles of organizations or the impact on performance metrics.
1.3. Main Aim of DADM and Principal Conclusions
- Enables trusted collaboration and interactions through a digital ecosystem;
- Is deployable and configurable for multiple decision domains;
- Provides an analytical framework for decision making across the lifecycle stages of complex systems;
- Will be widely adopted;
- Enables traceability and reuse of analysis, decisions, and rationale for decisions;
- Incorporate guidelines for identifying uncertainties and conducting probabilistic analysis and for documenting the rationale and results;
- Provides information models built using composable knowledge and process models that emphasize learning in the presence of uncertainty;
- Can be tailored to agile development for DEVOPS.
2. Methods
2.1. Data Modeling
2.1.1. Conceptual Data Model (CDM)
2.1.2. Logical Data Model (LDM)
2.1.3. Physical Data Model
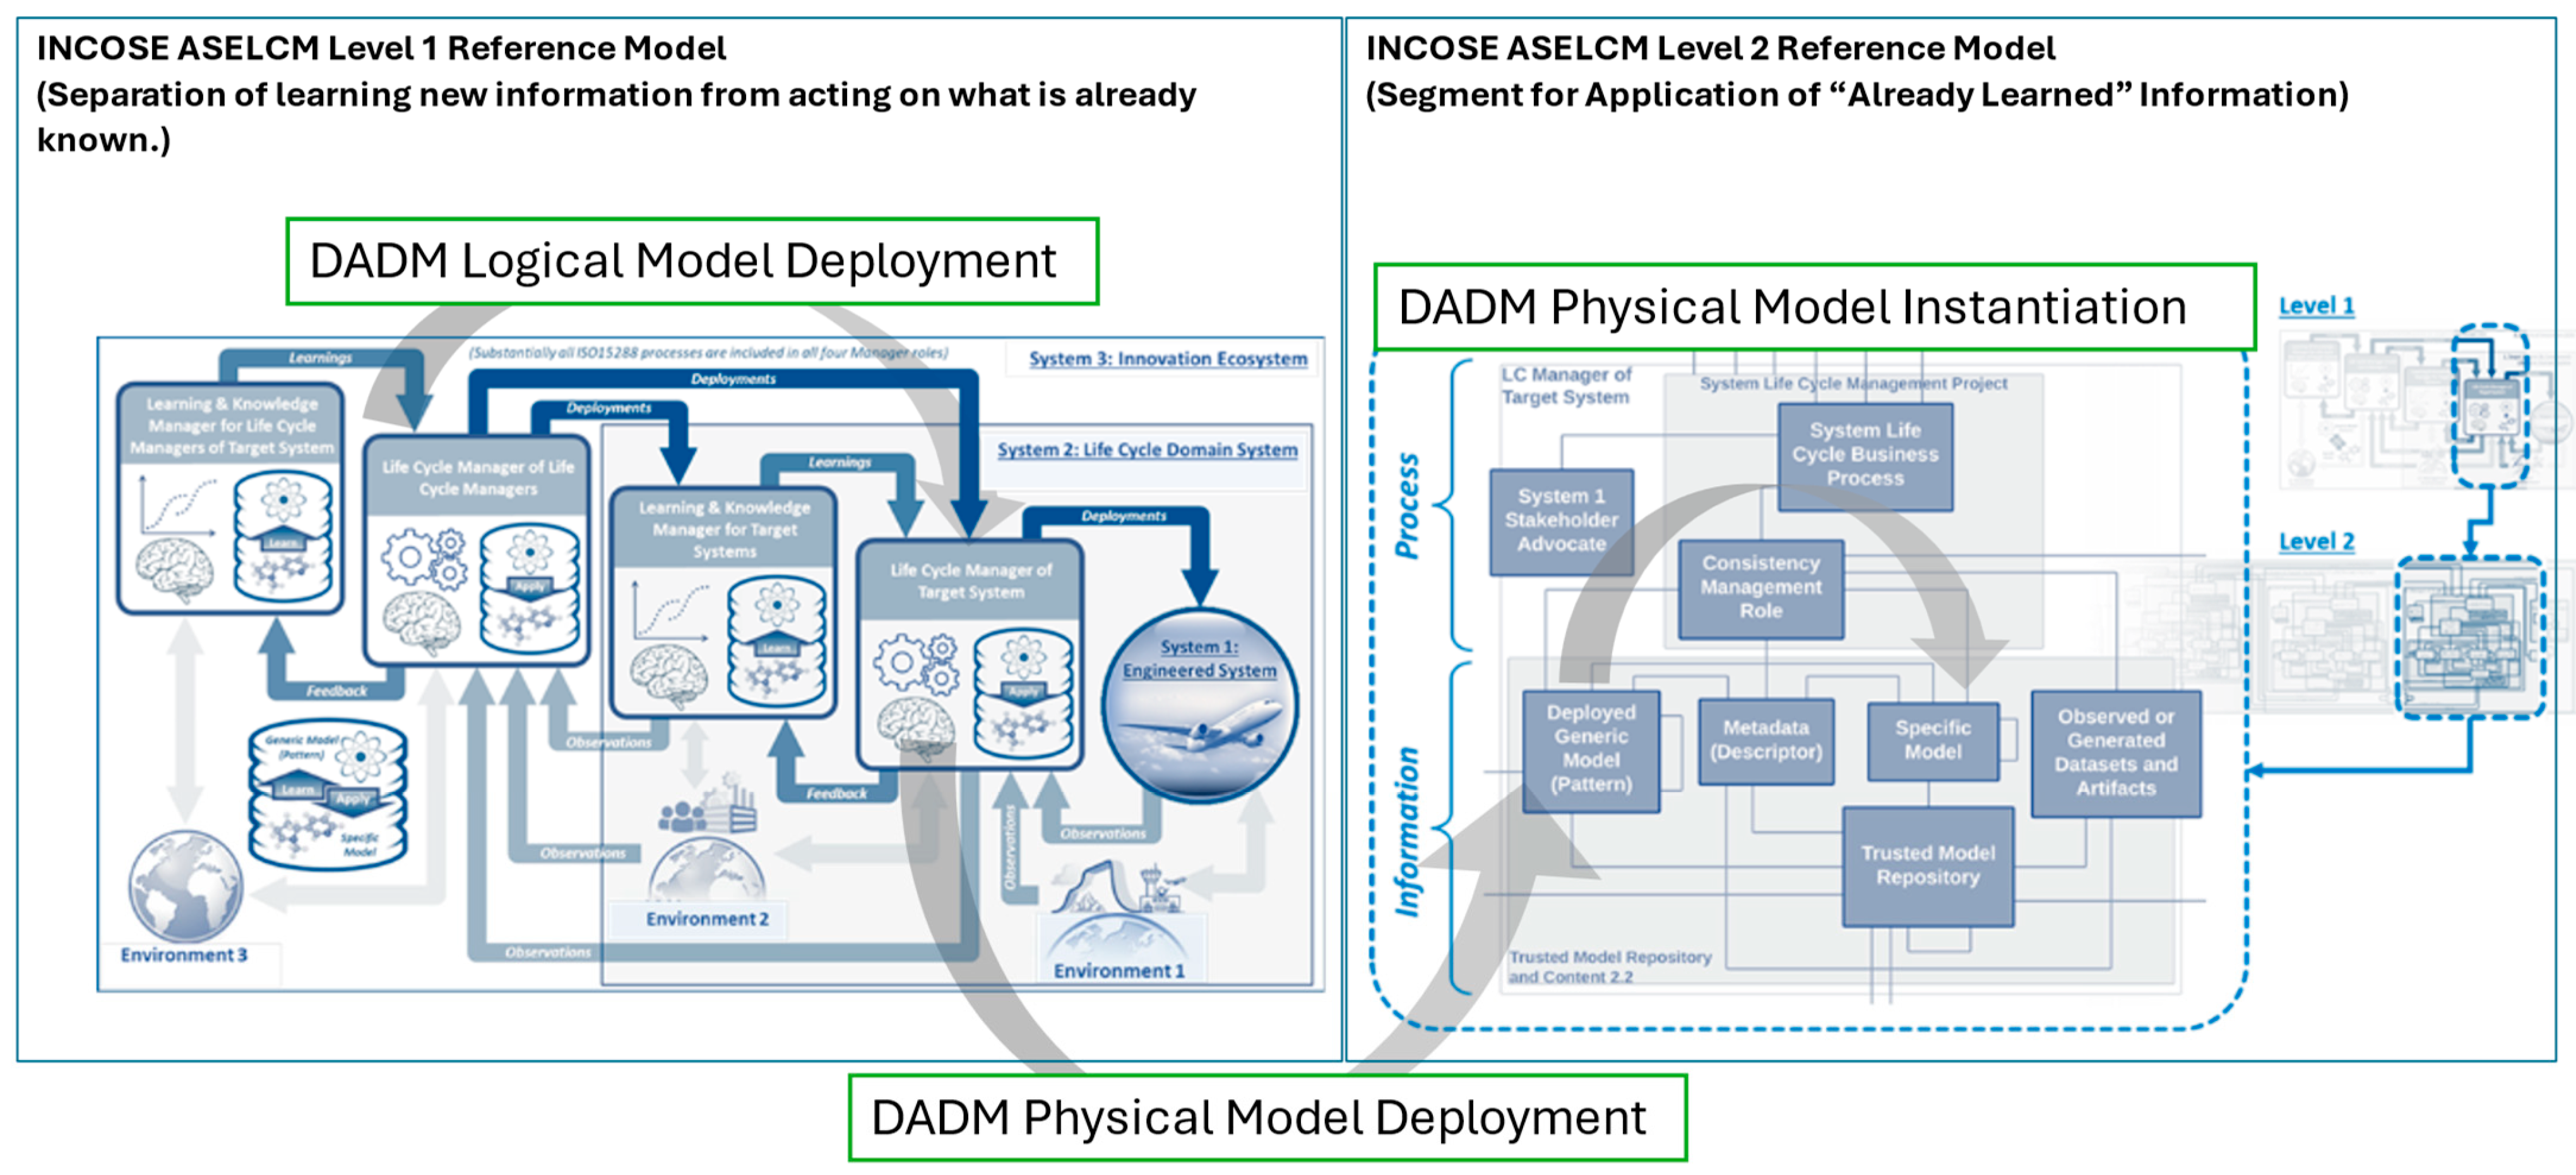
2.2. Agile Systems Engineering Life Cycle Model
2.3. Data Model Validation
3. Results—The Decision Analysis Data Model
3.1. DADM Conceptual Data Modeling
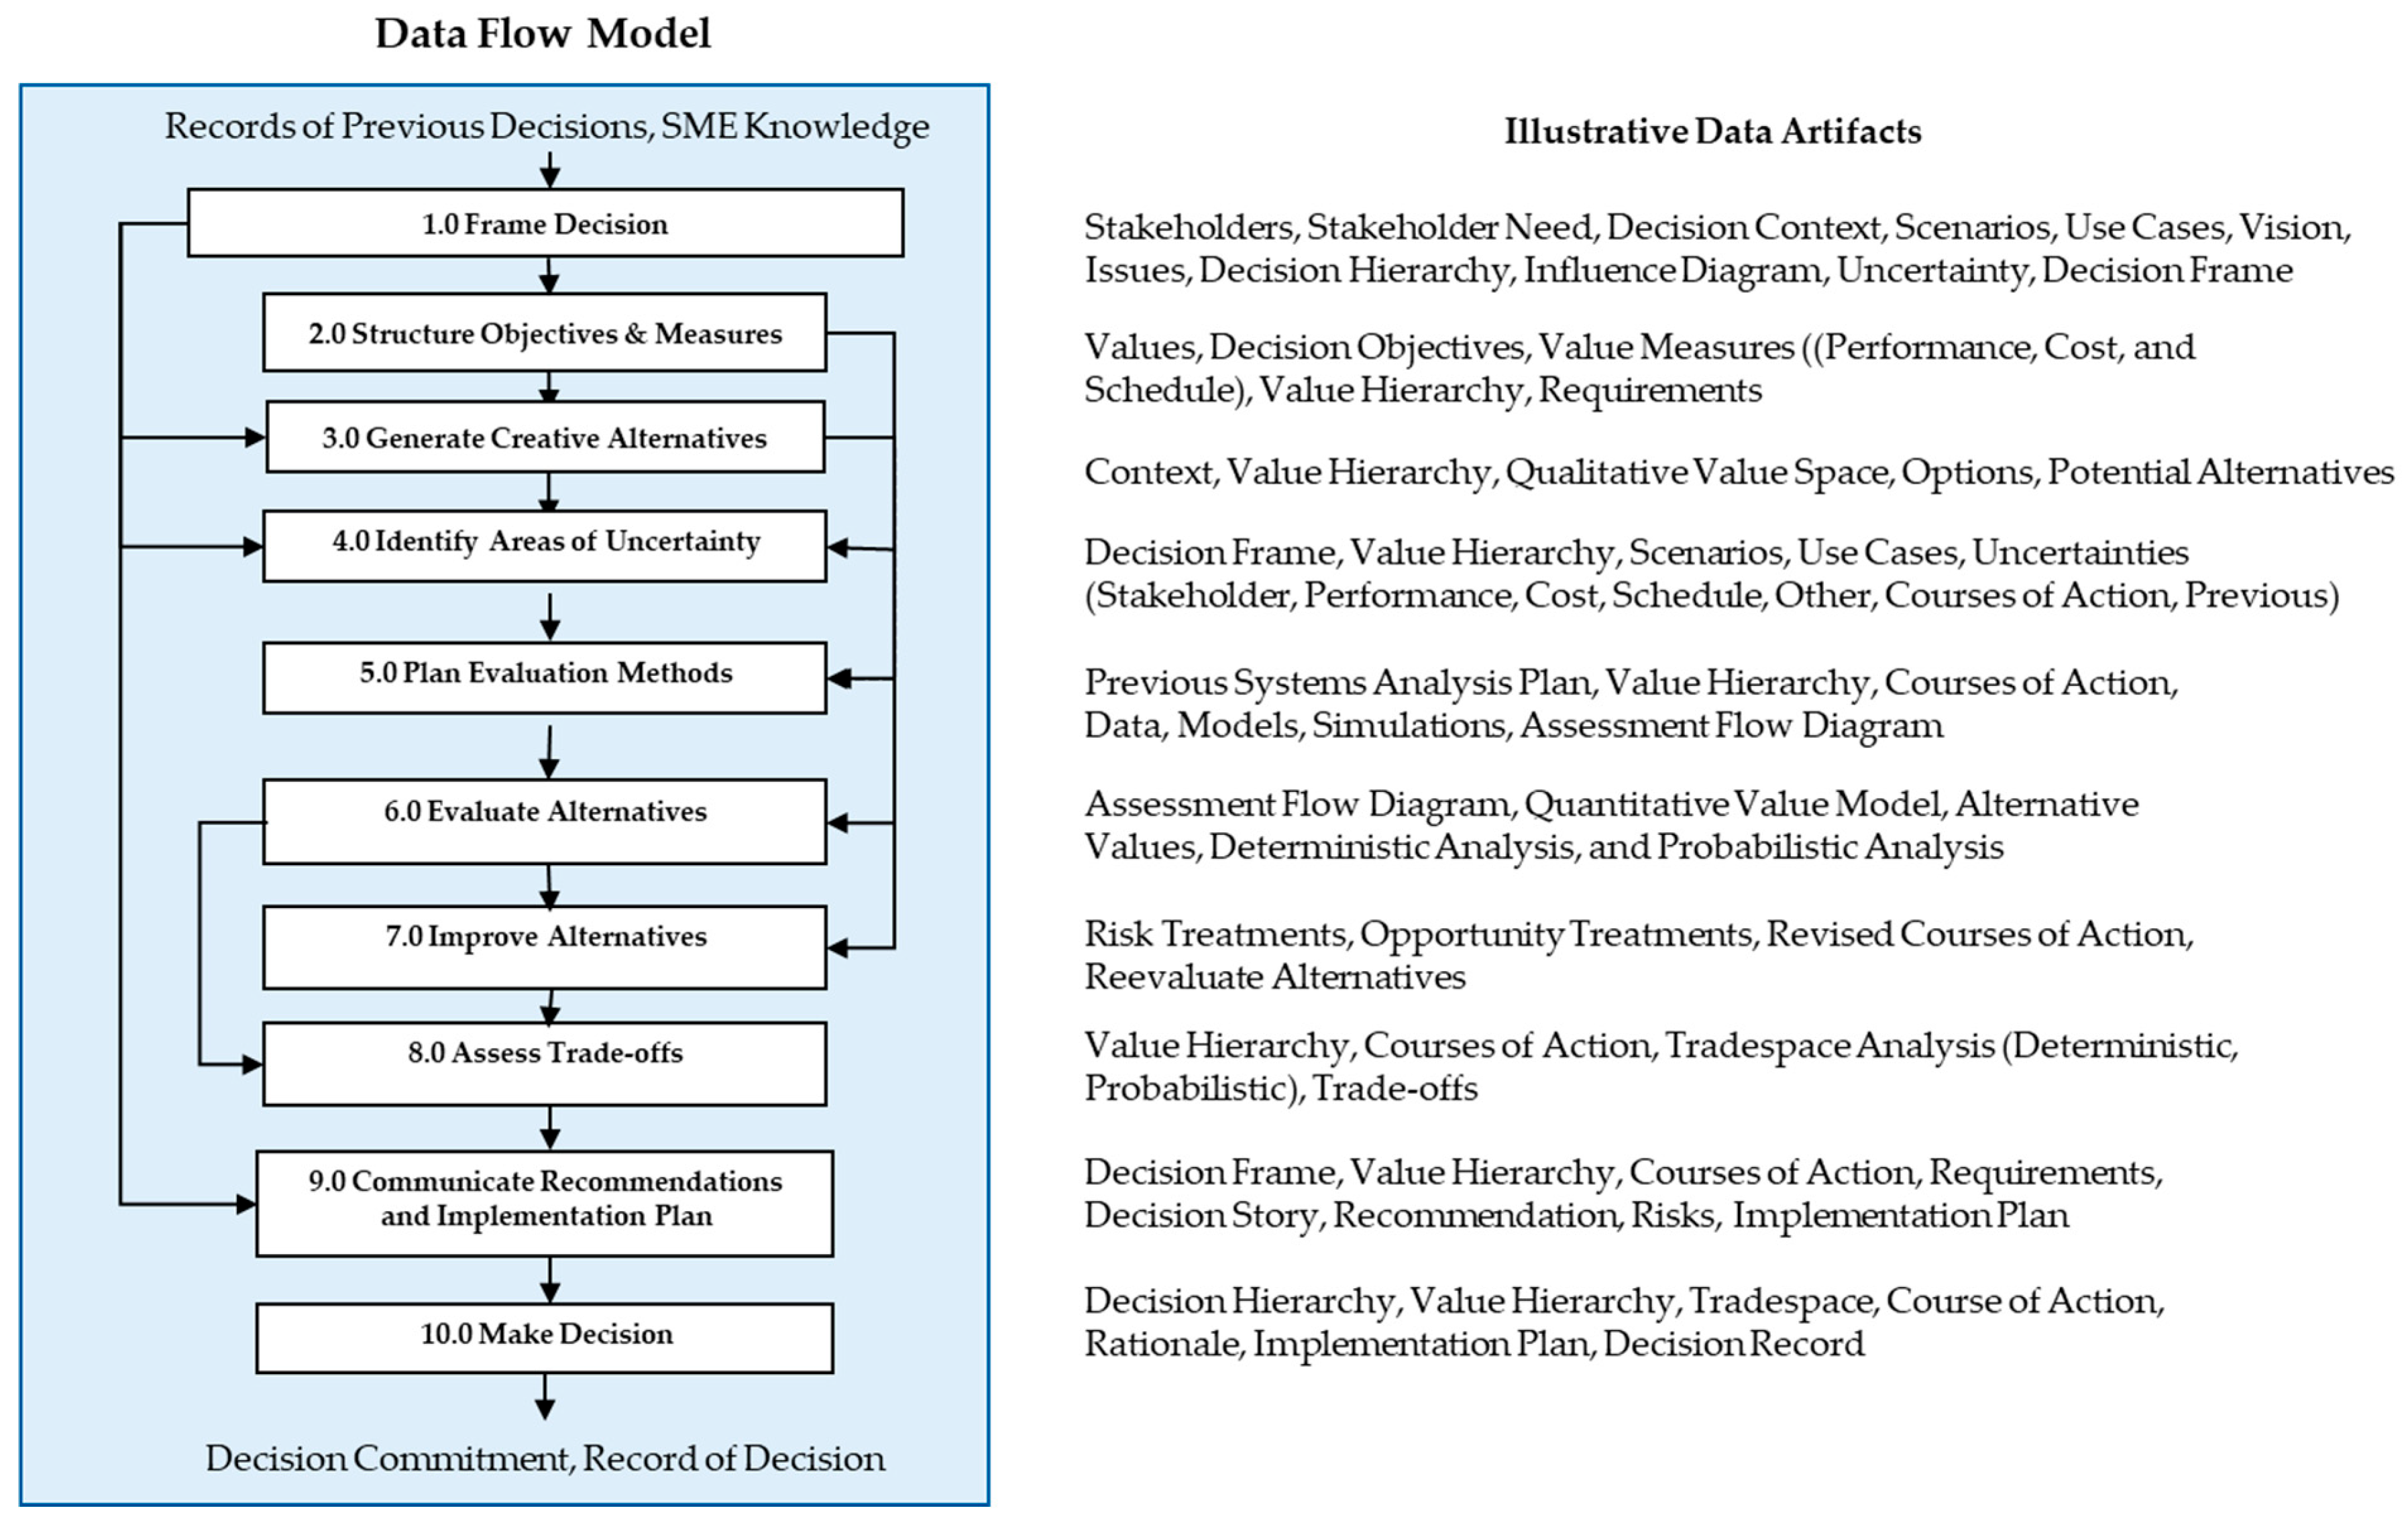
3.2. Logical Data Modeling
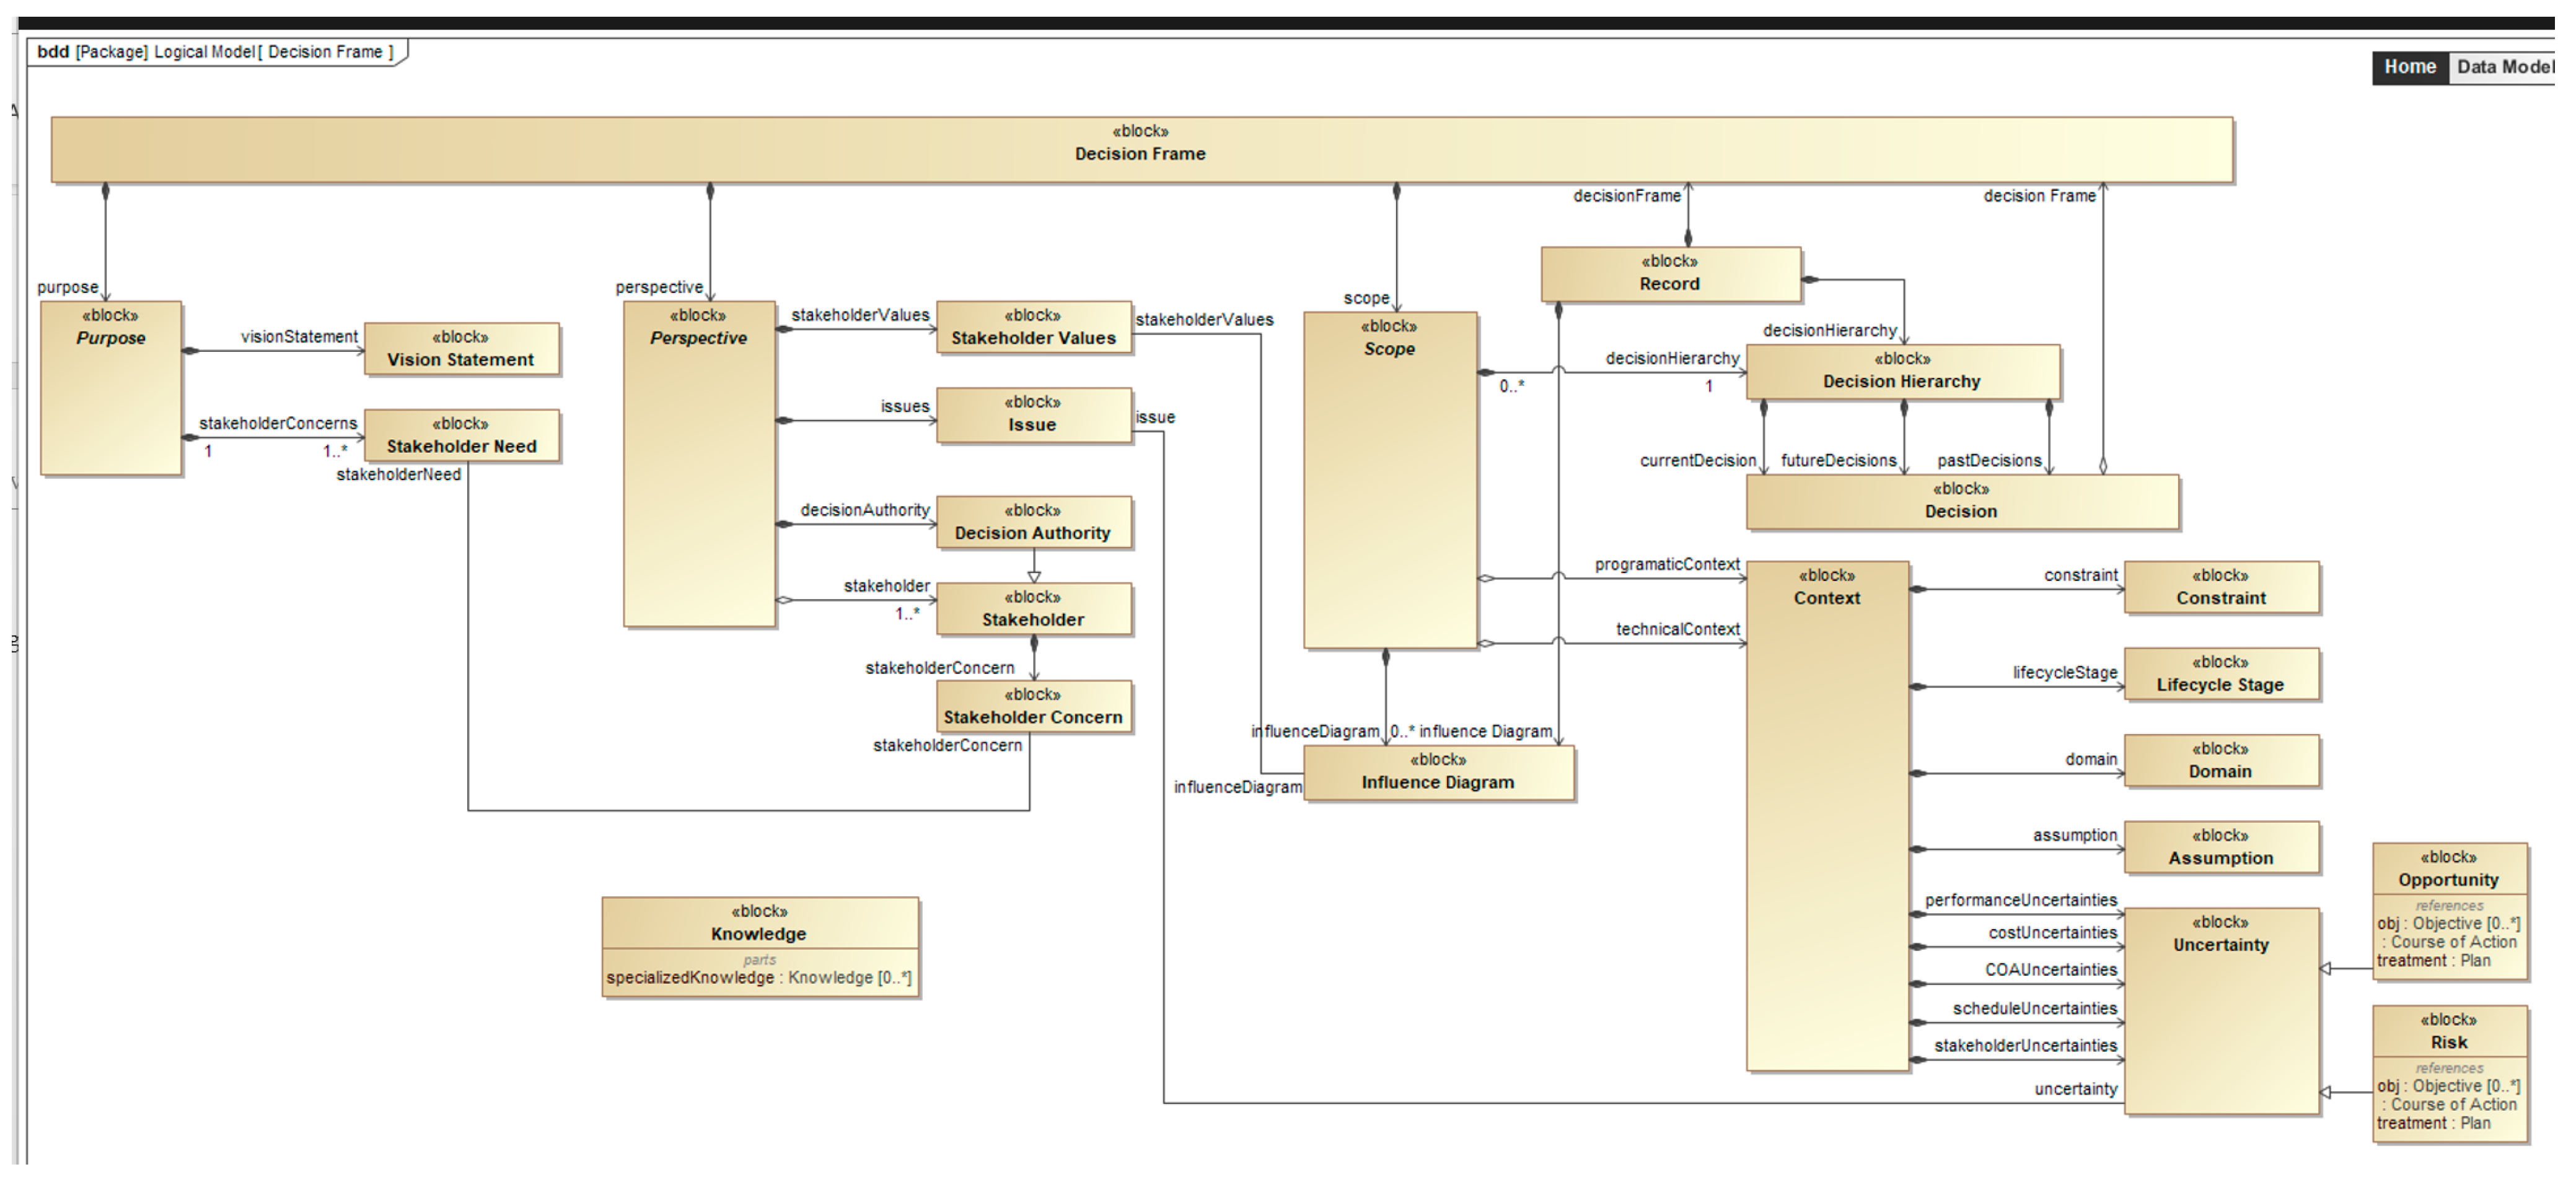
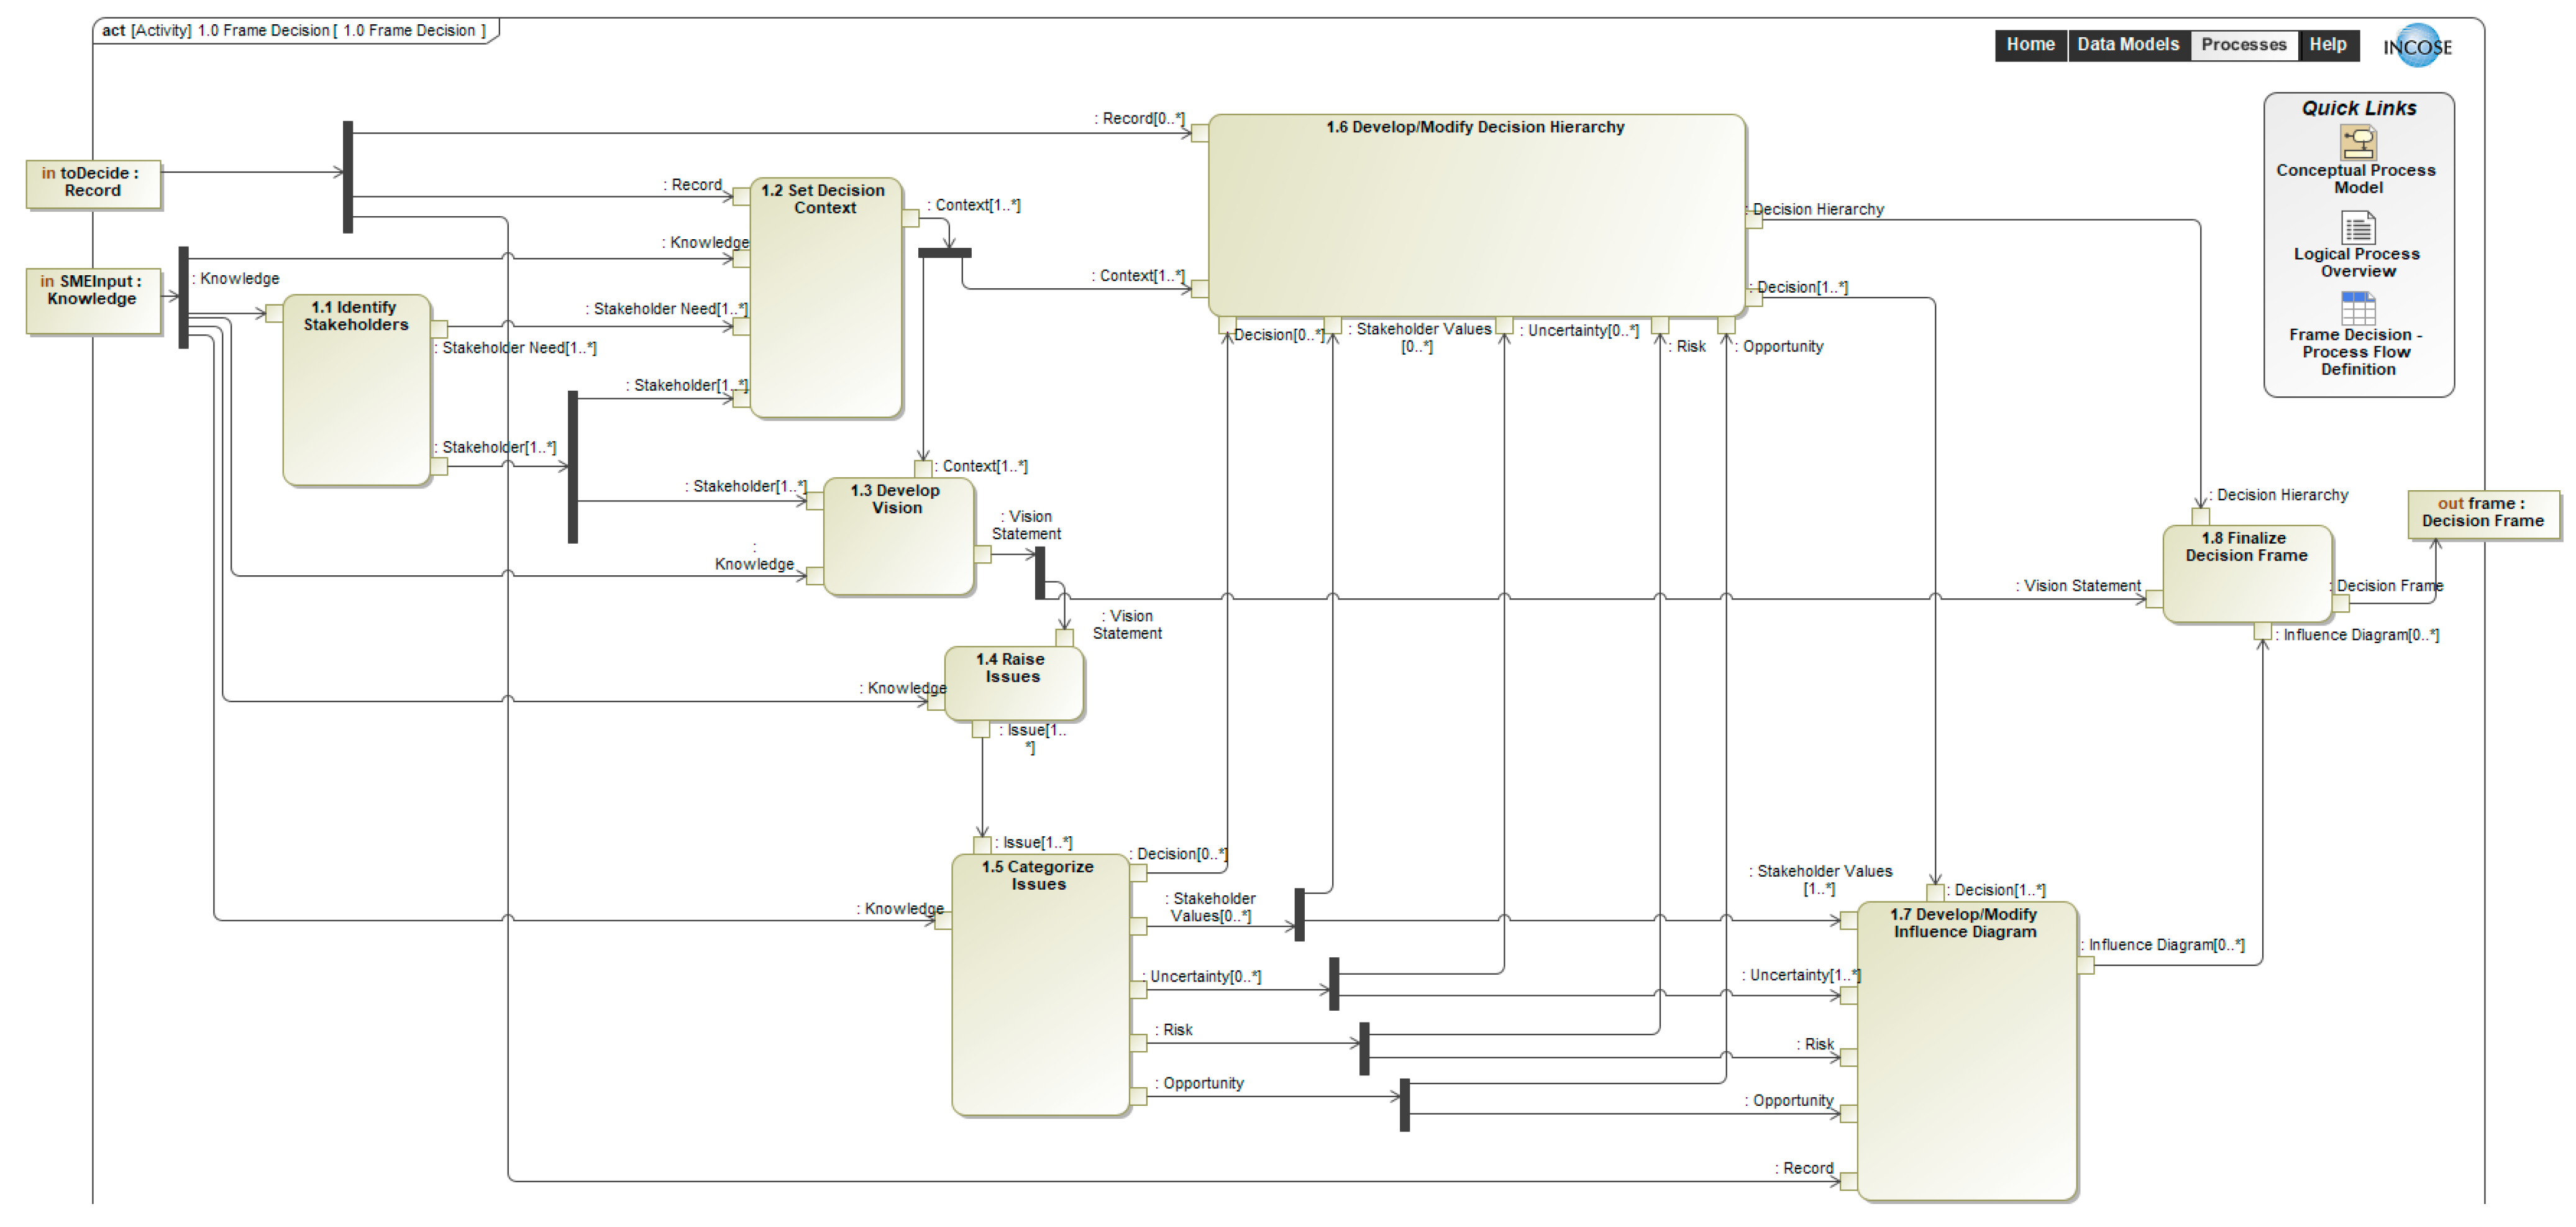
3.2.1. Step 1: Frame Decision
- Decision authority. The stakeholder(s) with ultimate decision gate authority to approve and implement a system solution.
- Client. The person(s) or organization(s) that solicit systems decision support for a project or program.
- Owner. The person(s) or organization(s) responsible for proper and purposeful system operation.
- User. The person(s) or organization accountable for proper and purposeful system operation.
- Consumer. The person(s) or organization(s) that realizes direct or indirect benefits from the products or services provided by the system or its behavior.
- Collaborator. The person(s) or organization(s) external to the system boundary that are virtually or physically connected to the system, its behaviors, its input, or output and who realize benefits, costs, and/or risks resulting from the connection.
- Technological. Availability of “off-the-shelf” technology. Technical, cost, and schedule risks of innovative technologies.
- Economic. Economic factors such as a constrained program budget within which to complete a system development and impacts on the economic environment within which the system operates.
- Political. Political factors such as external interest groups impacted by the system and governmental bodies that provide financing and approval.
- Legal. National, regional and community legal requirements such as safety and emissions regulations, codes, and standards.
- Health and Safety. The impact of a system on the health and safety of humans and other living beings.
- Social. The impact on the way that humans interact.
- Security. Securing the system and the products, and services from harm by potential threats.
- Ecological. Positive and negative impacts of the system on a wide range of ecological elements.
- Cultural. Considerations that constrain the form and function of the system.
- Historical. Impact on historical landmarks and facilities.
- Moral/ethical. Moral or ethical issues that arise in response to the question: “Are we doing the right thing here?”
- Organizational. Positive and negative impacts on the organization that is charged with making the decision.
- Emotional. Personal preferences or emotional issues of decision makers or key stakeholders regarding the system of interest or potential system solutions.
- What are we going to do?
- Why are we doing this?
- How will we know that we have succeeded?
- Decisions. Issues suggesting choices that can be made as part of the decision.
- Uncertainties. Issues suggesting uncertainties that should be considered when making the decision.
- Values. Issues that refer to the measures with which decision alternatives should be compared.
- Other. Issues not belonging to the other categories, such as those referring to the decision process itself.
- An arrow that enters a decision represents information that is available at the time the decision is taken.
- An arrow leading into a chance node represents a probabilistic dependency (or relevance) on the node from which the arrow is drawn.
- An arrow leading into a calculated or value node represents a functional relevance to the receiving node from which the arrow is drawn. In this instance, the receiving node is calculated as a function of all the nodes that have arcs leading into the receiving node.
- No loops: It must not be possible to return to any node in the diagram by following arrows in the direction that they point.
- One value measure: There must be one final value node that has no arrows leading out of it and that represents the single value measure or objective that is maximized to determine the optimal set of decisions.
- No forgetting: Any information known when a decision is made is assumed to be known when a subsequent decision is made.
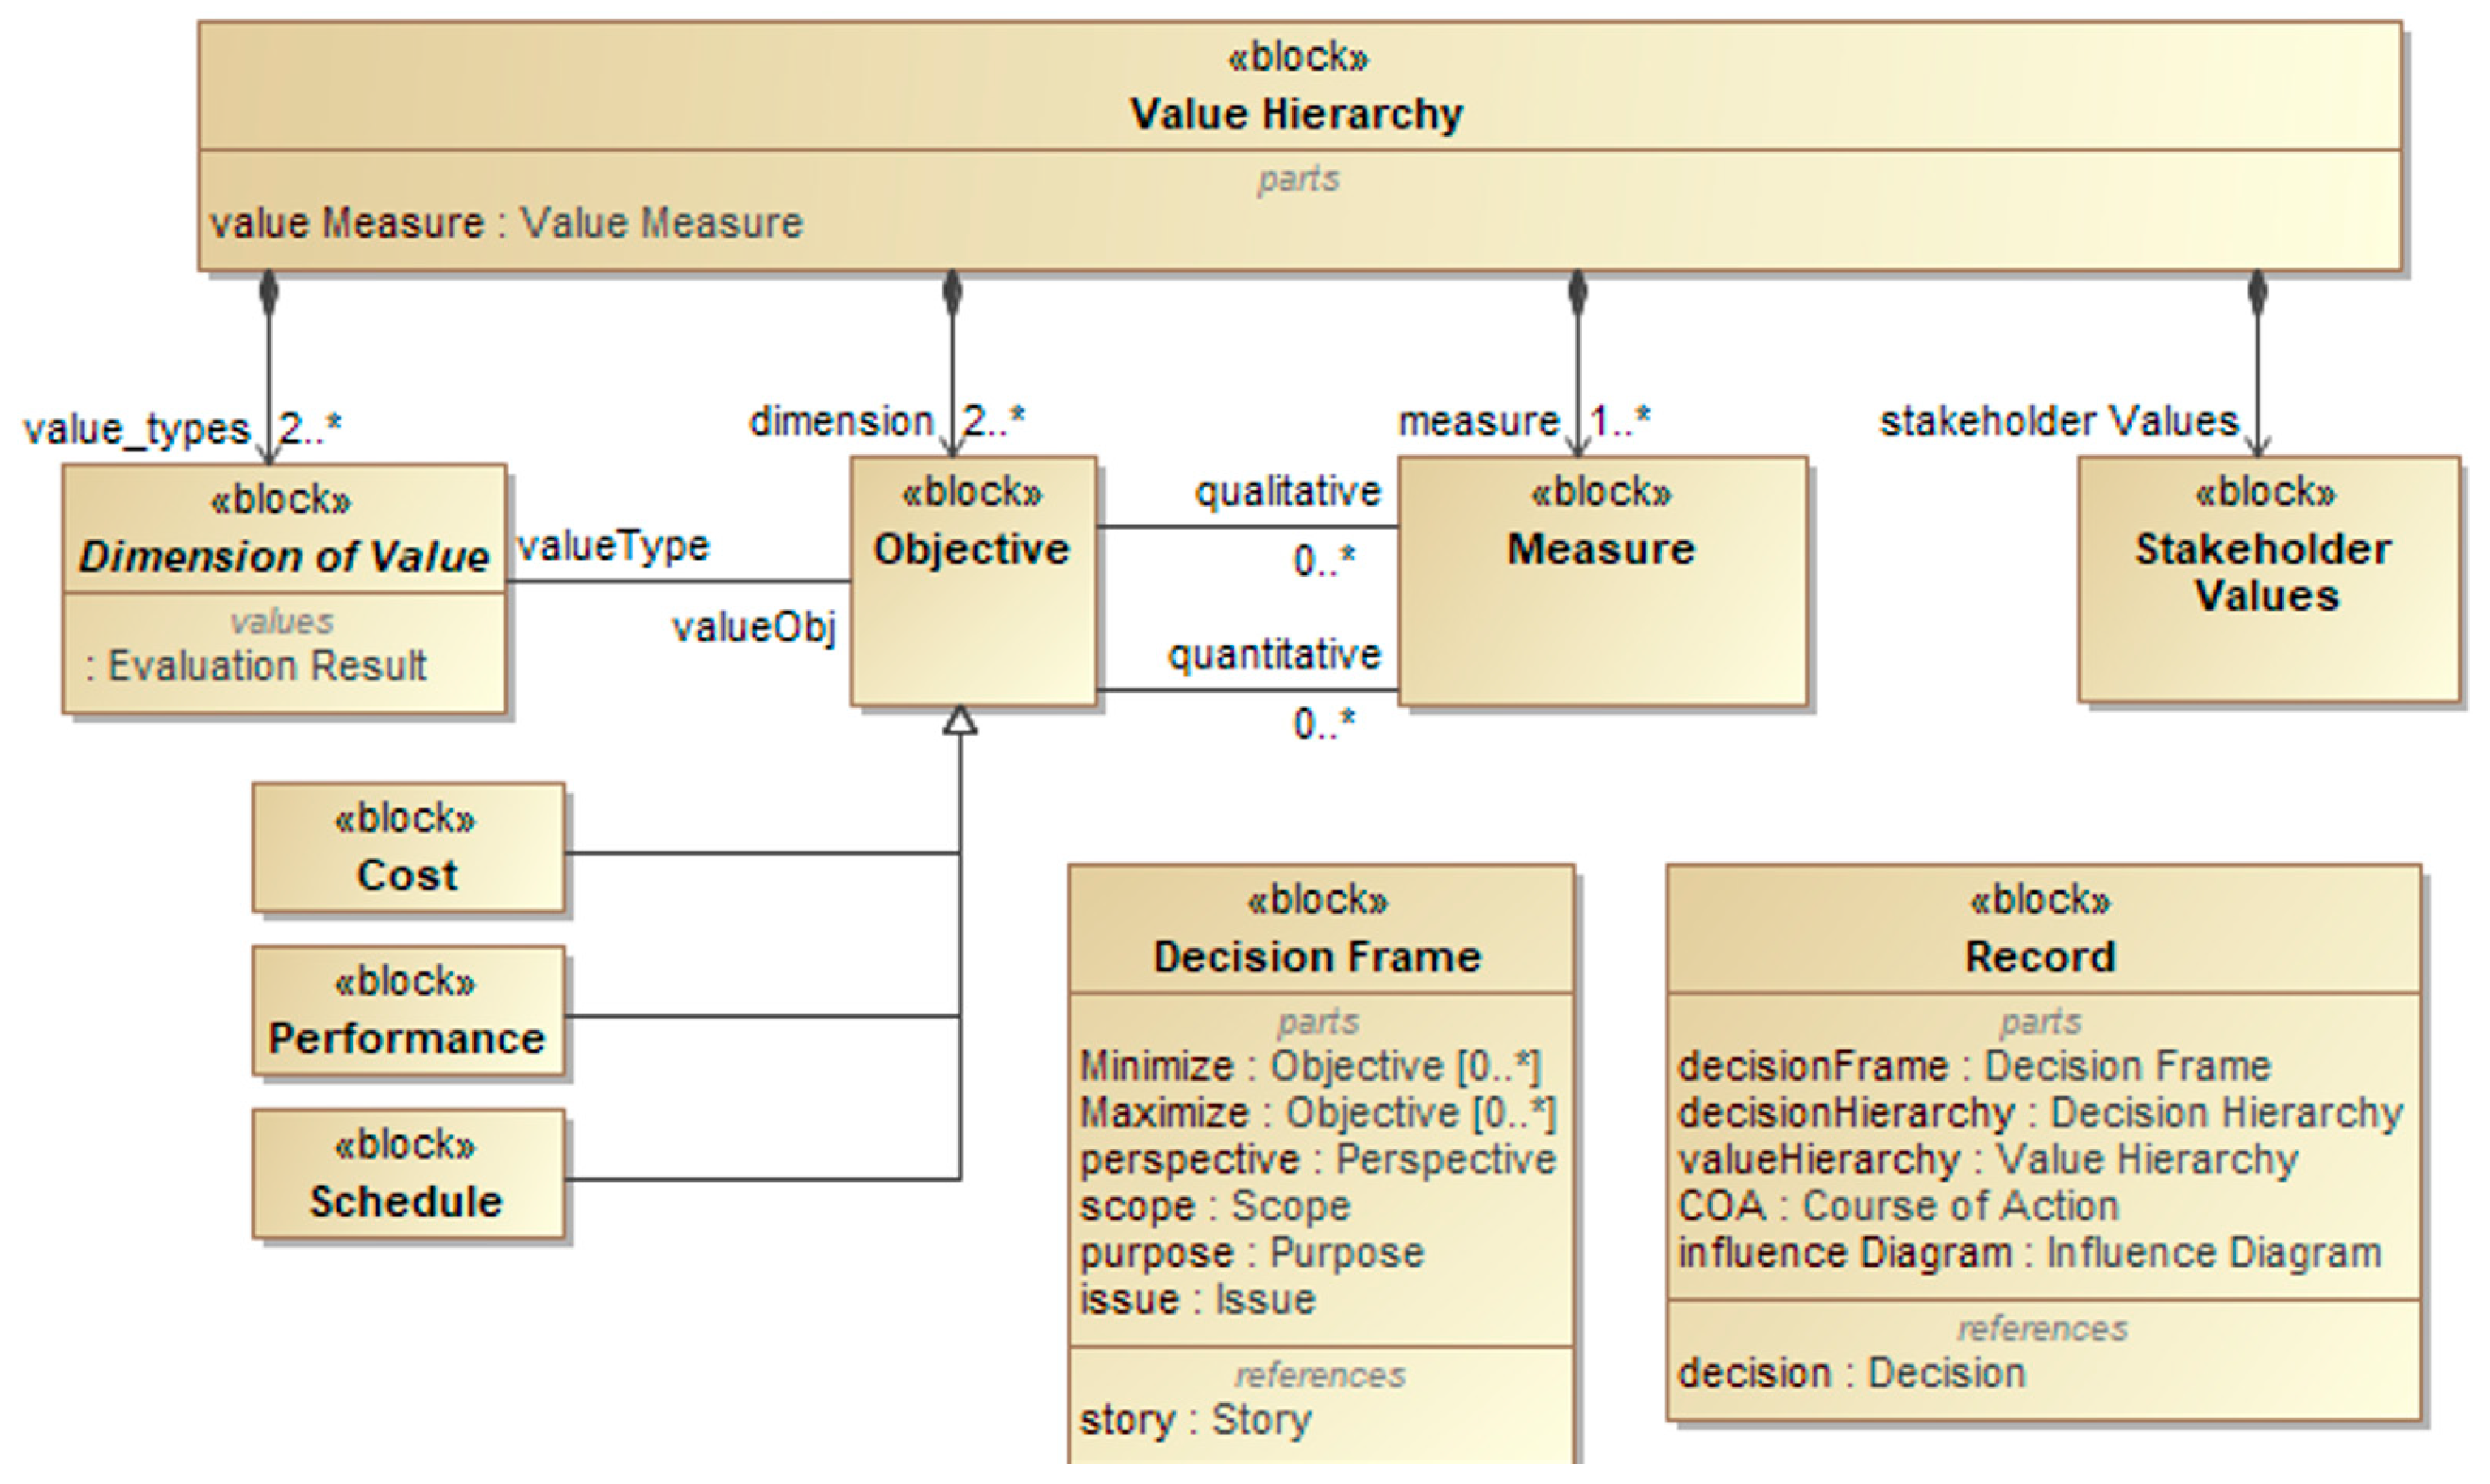
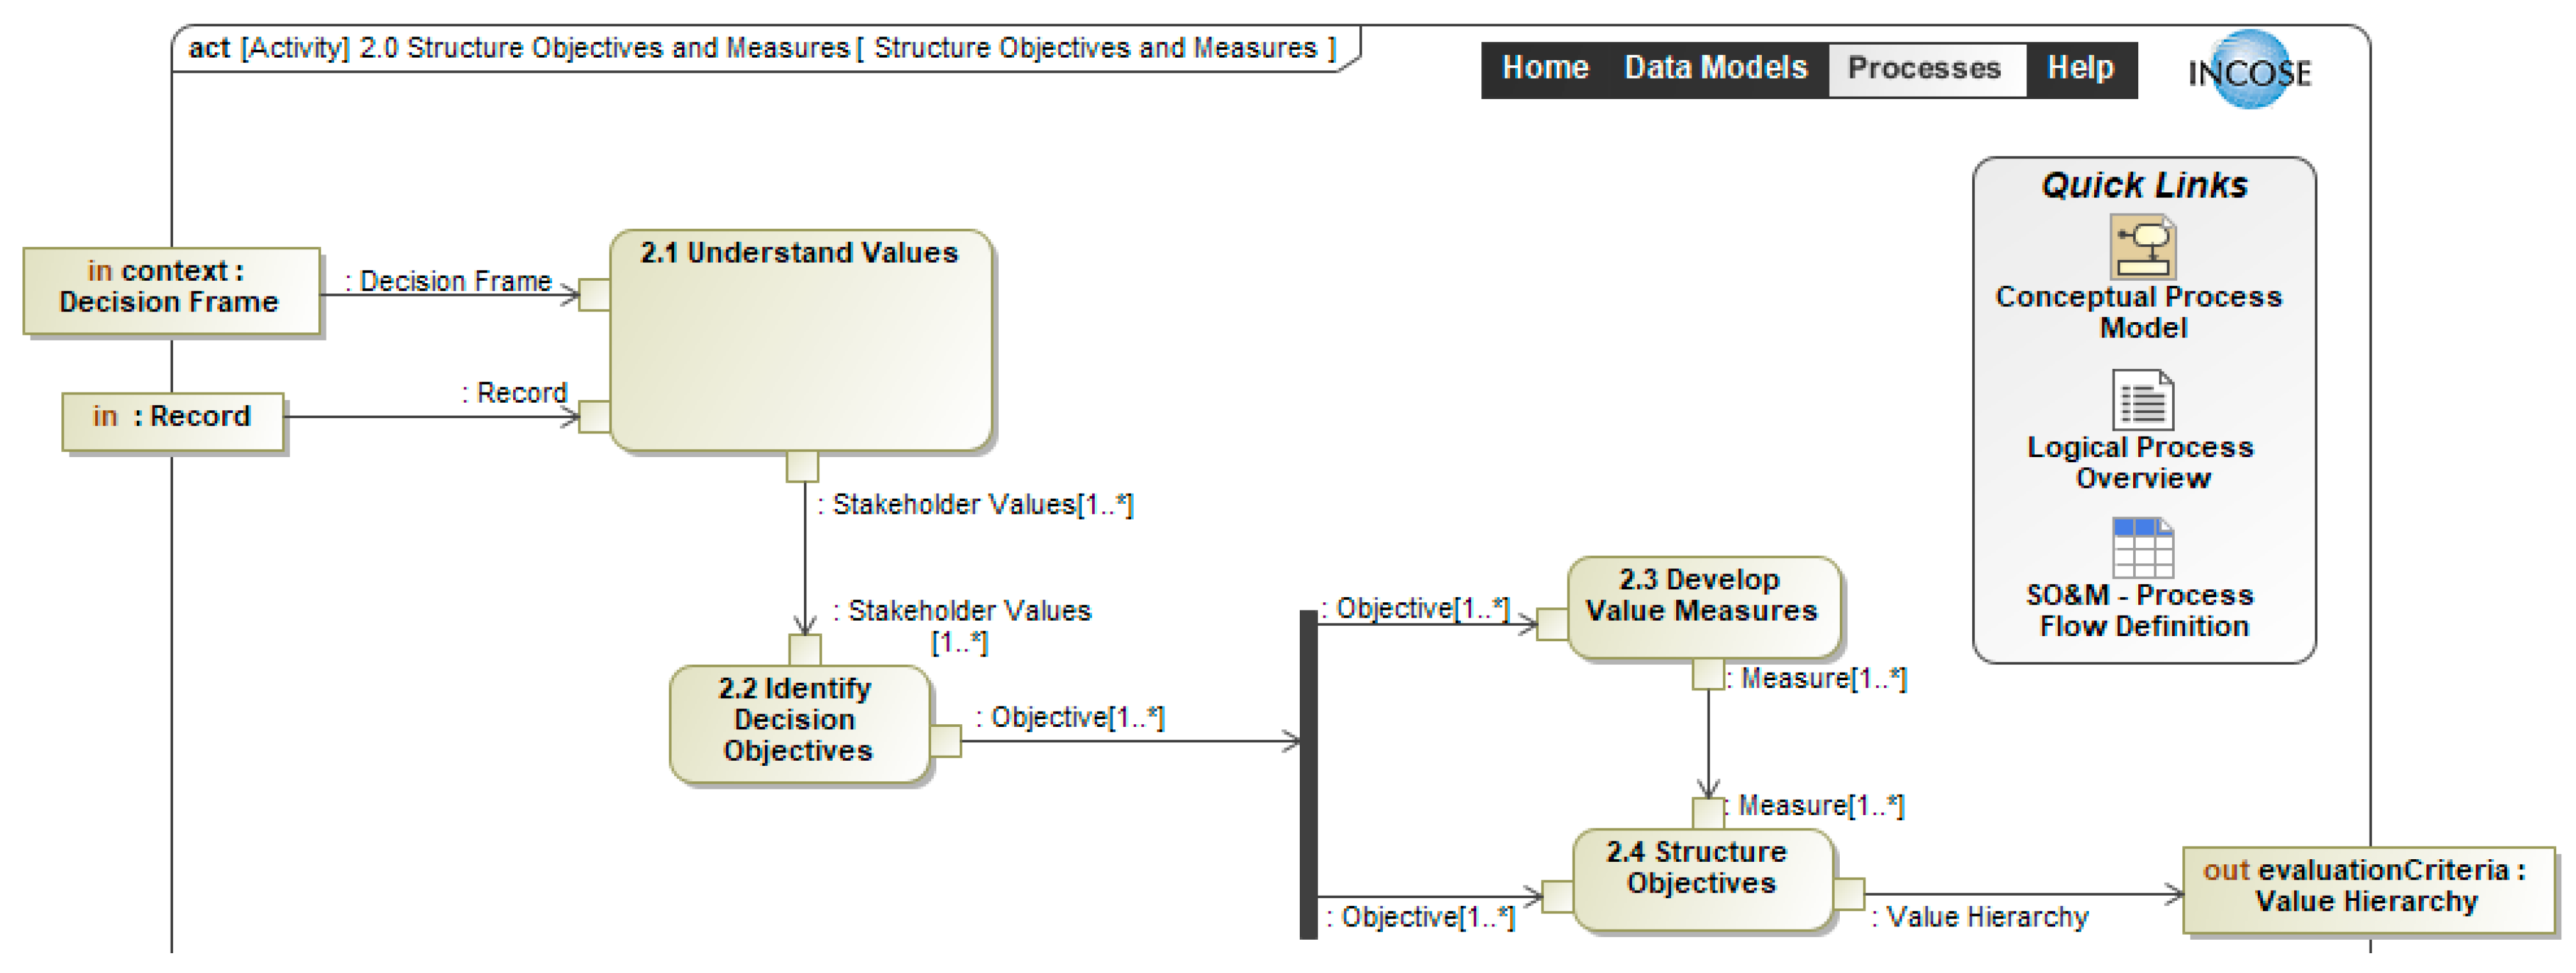
3.2.2. Step 2: Structure Objectives and Measures
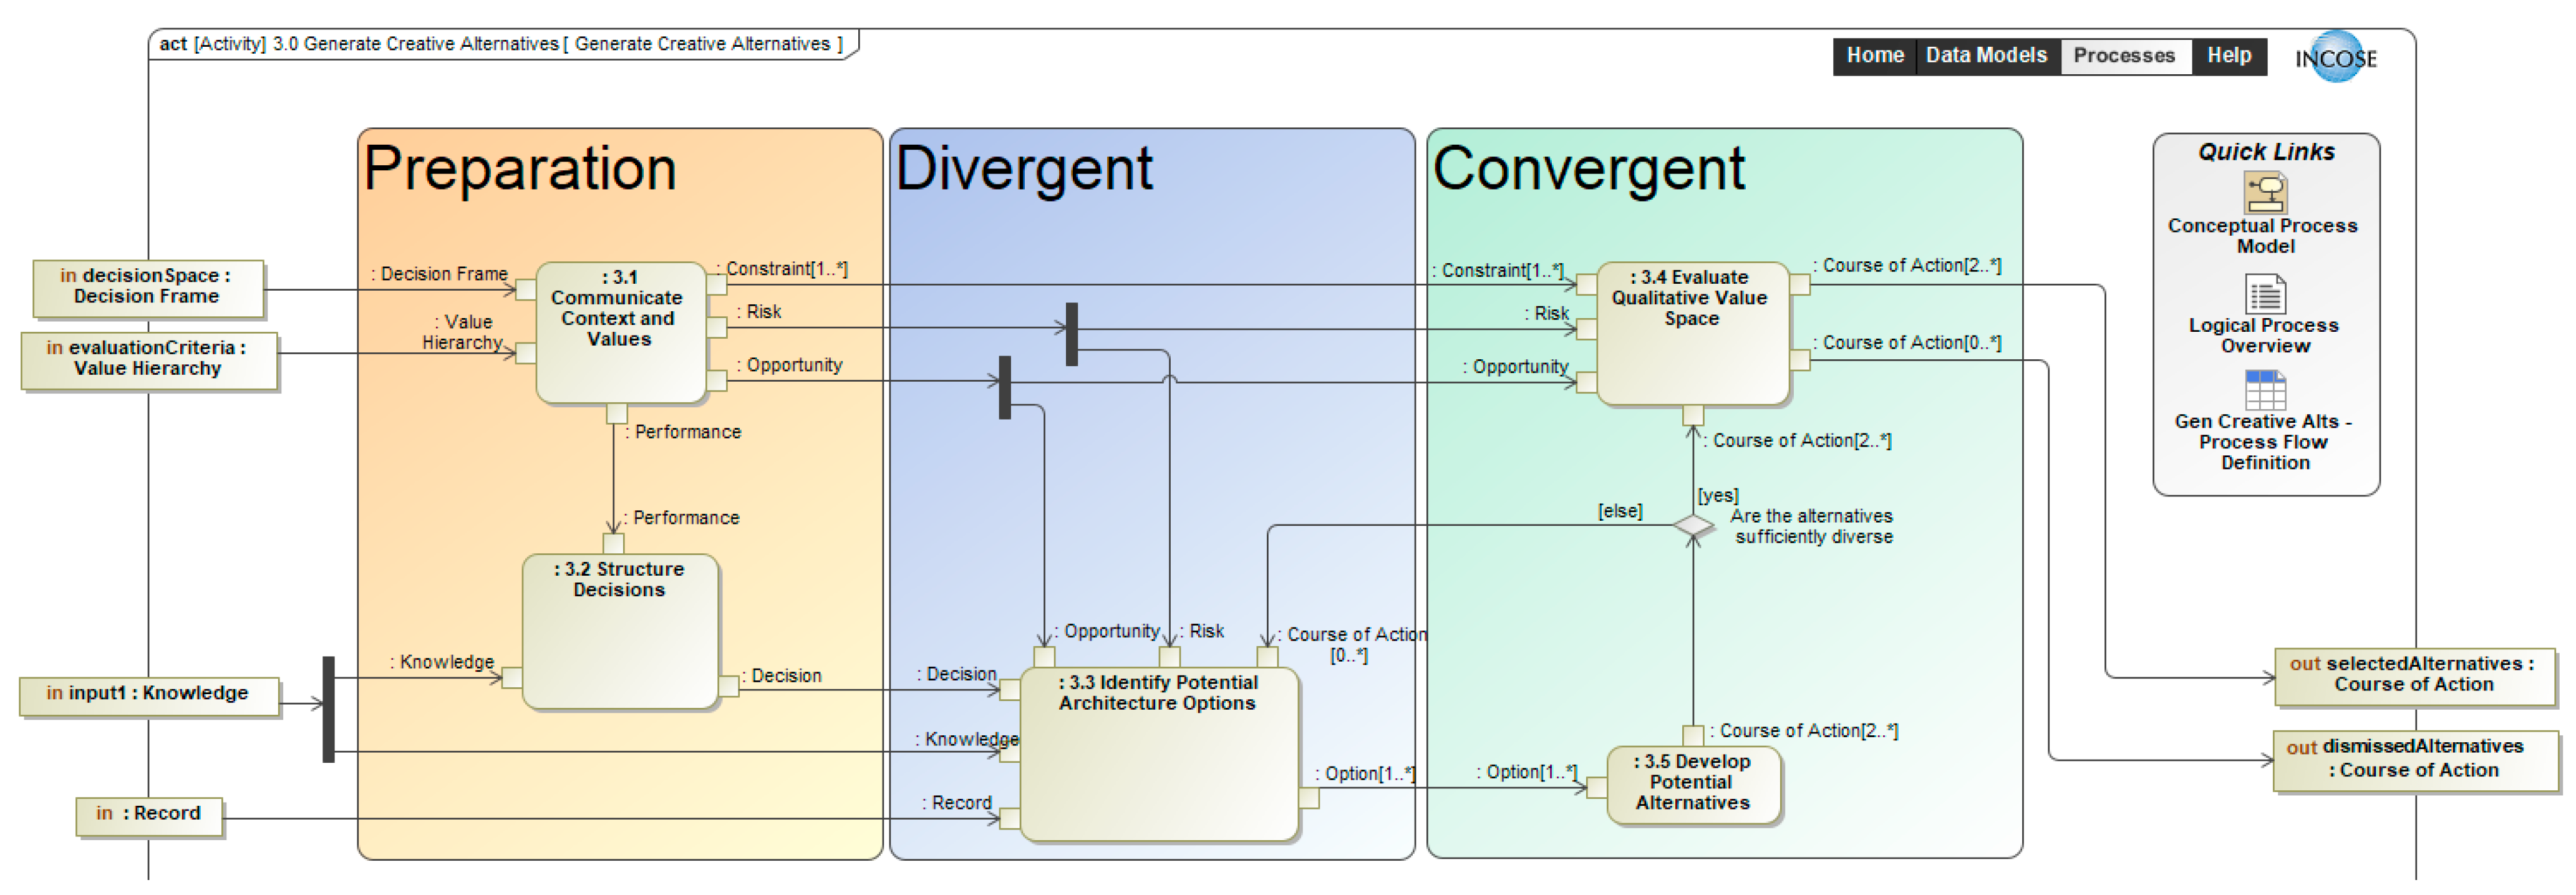
3.2.3. Step 3: Generate Creative Alternatives
- Specifying the meaning of the fundamental objective by defining value measures can suggest alternatives.
- Identifying means that contribute to the achievement of the value measures can also indicate potential alternatives.
3.2.4. Step 4: Identify Areas of Uncertainty
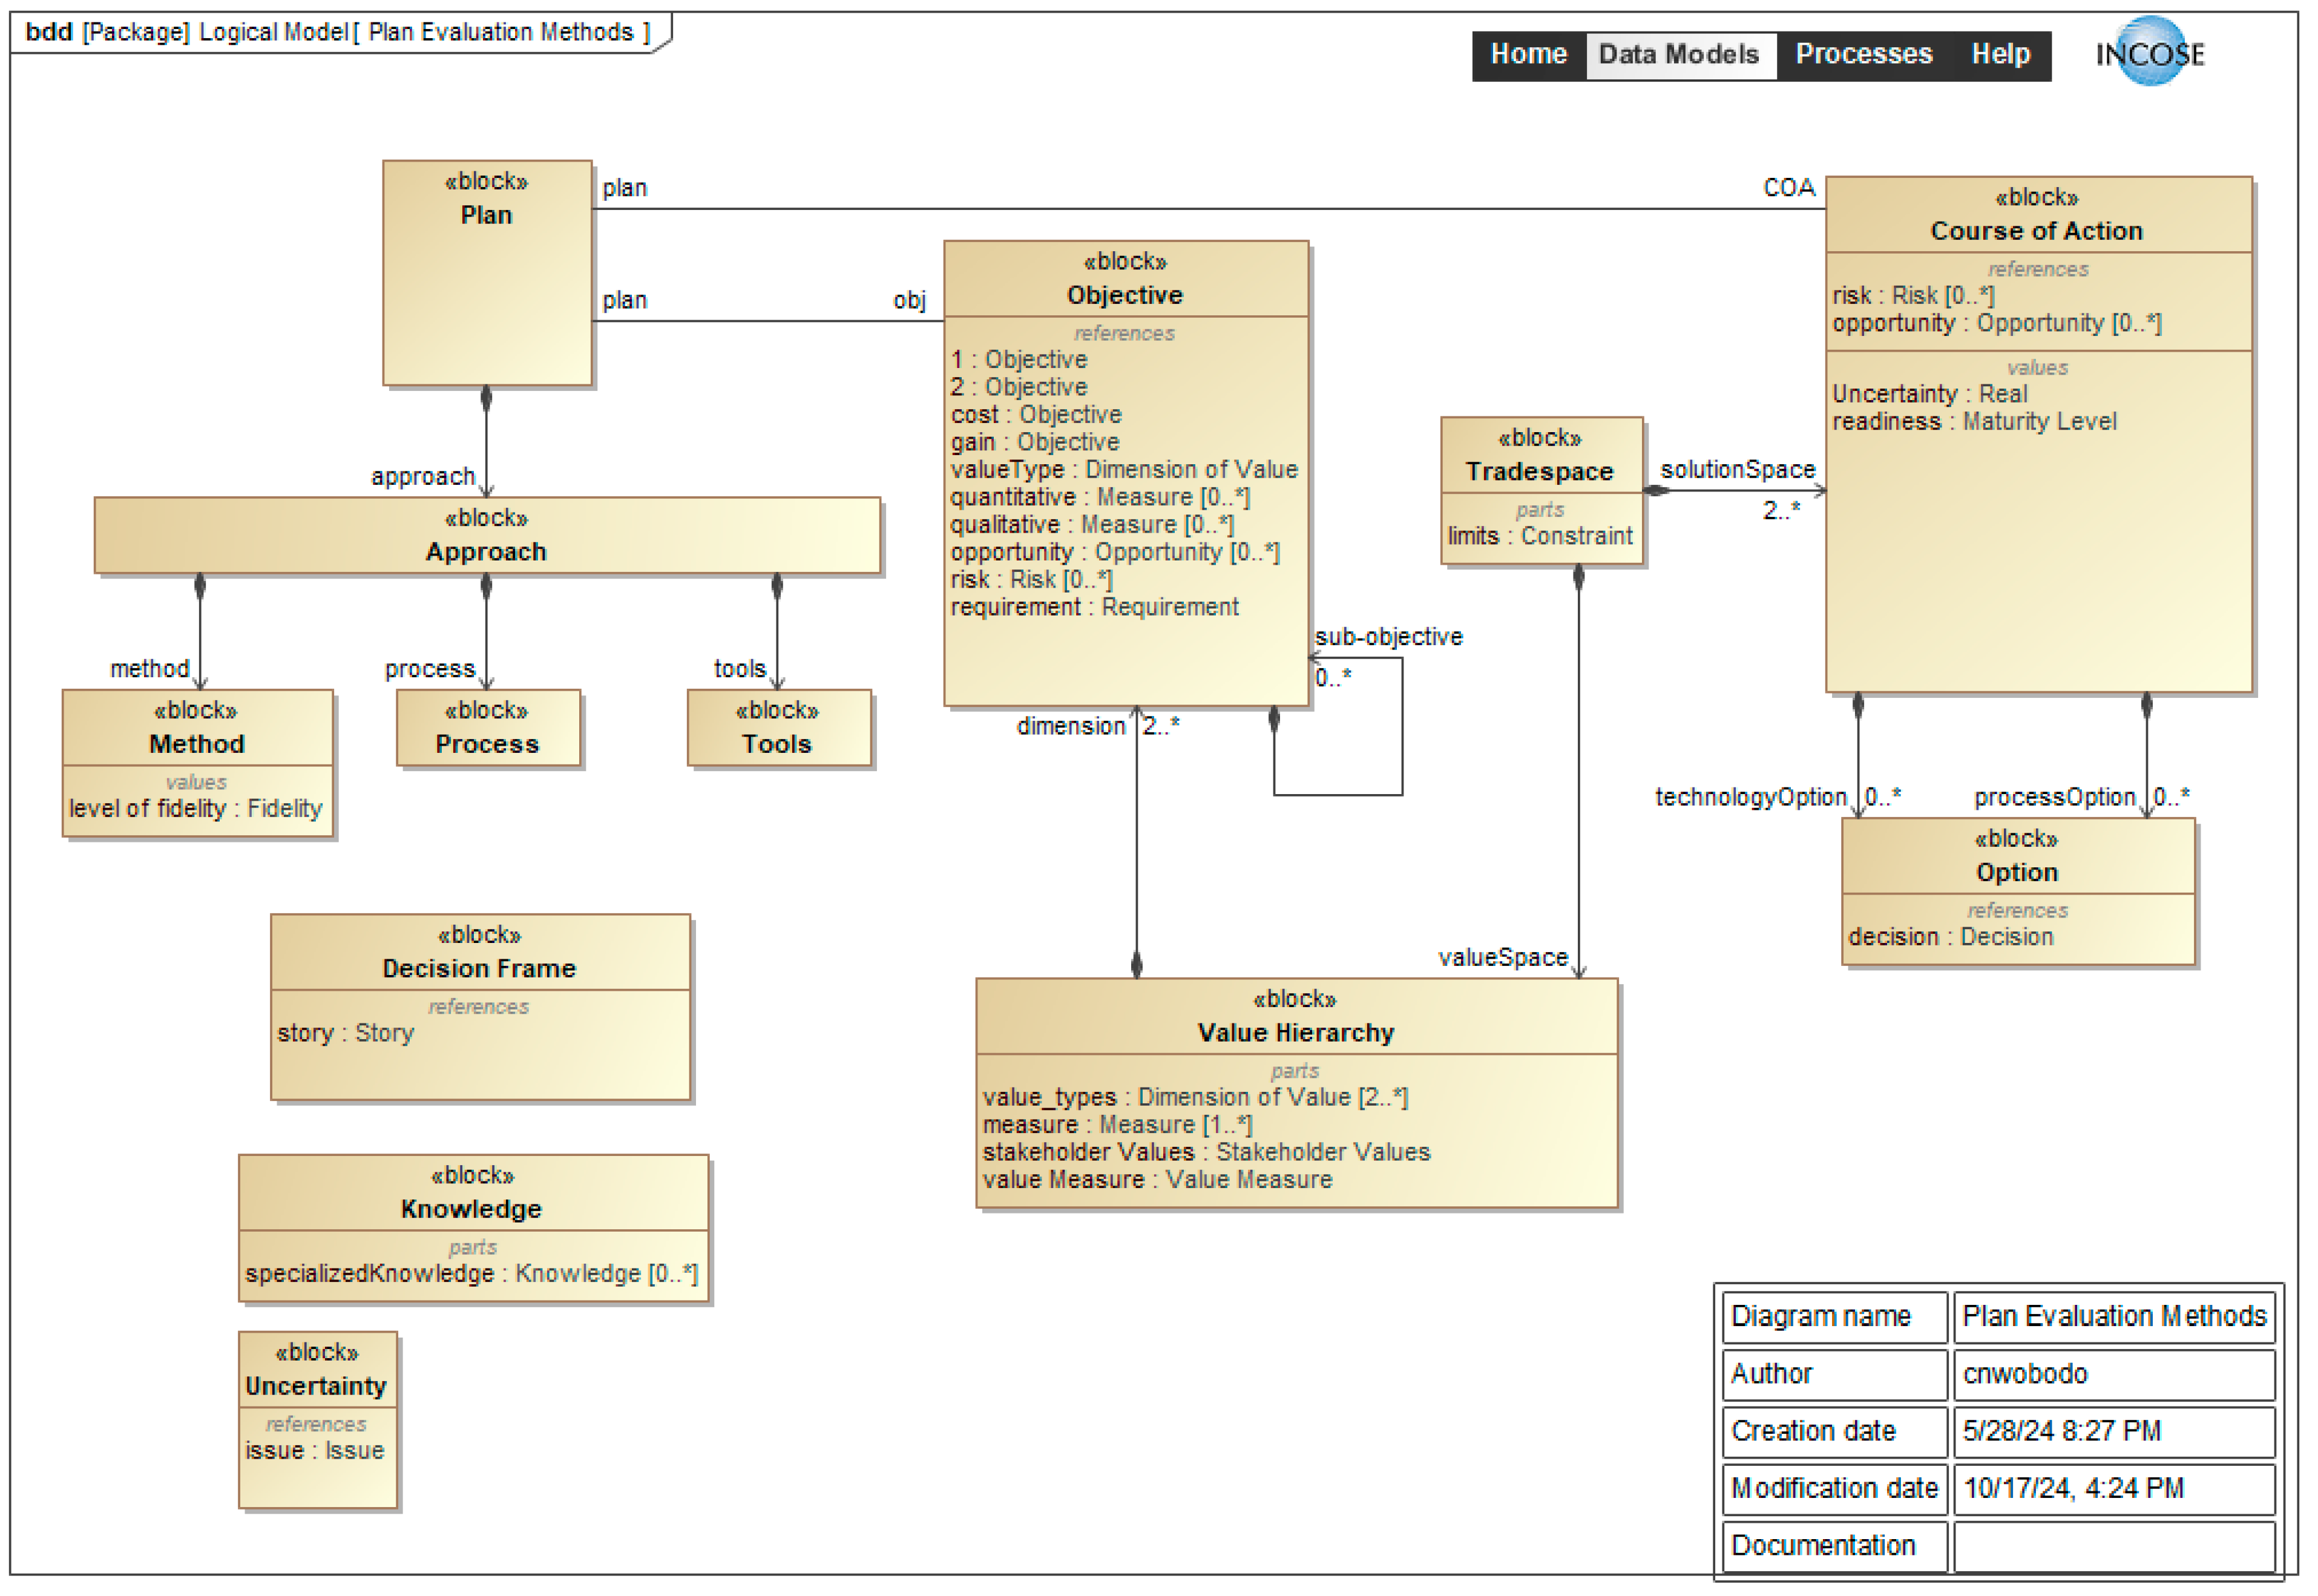
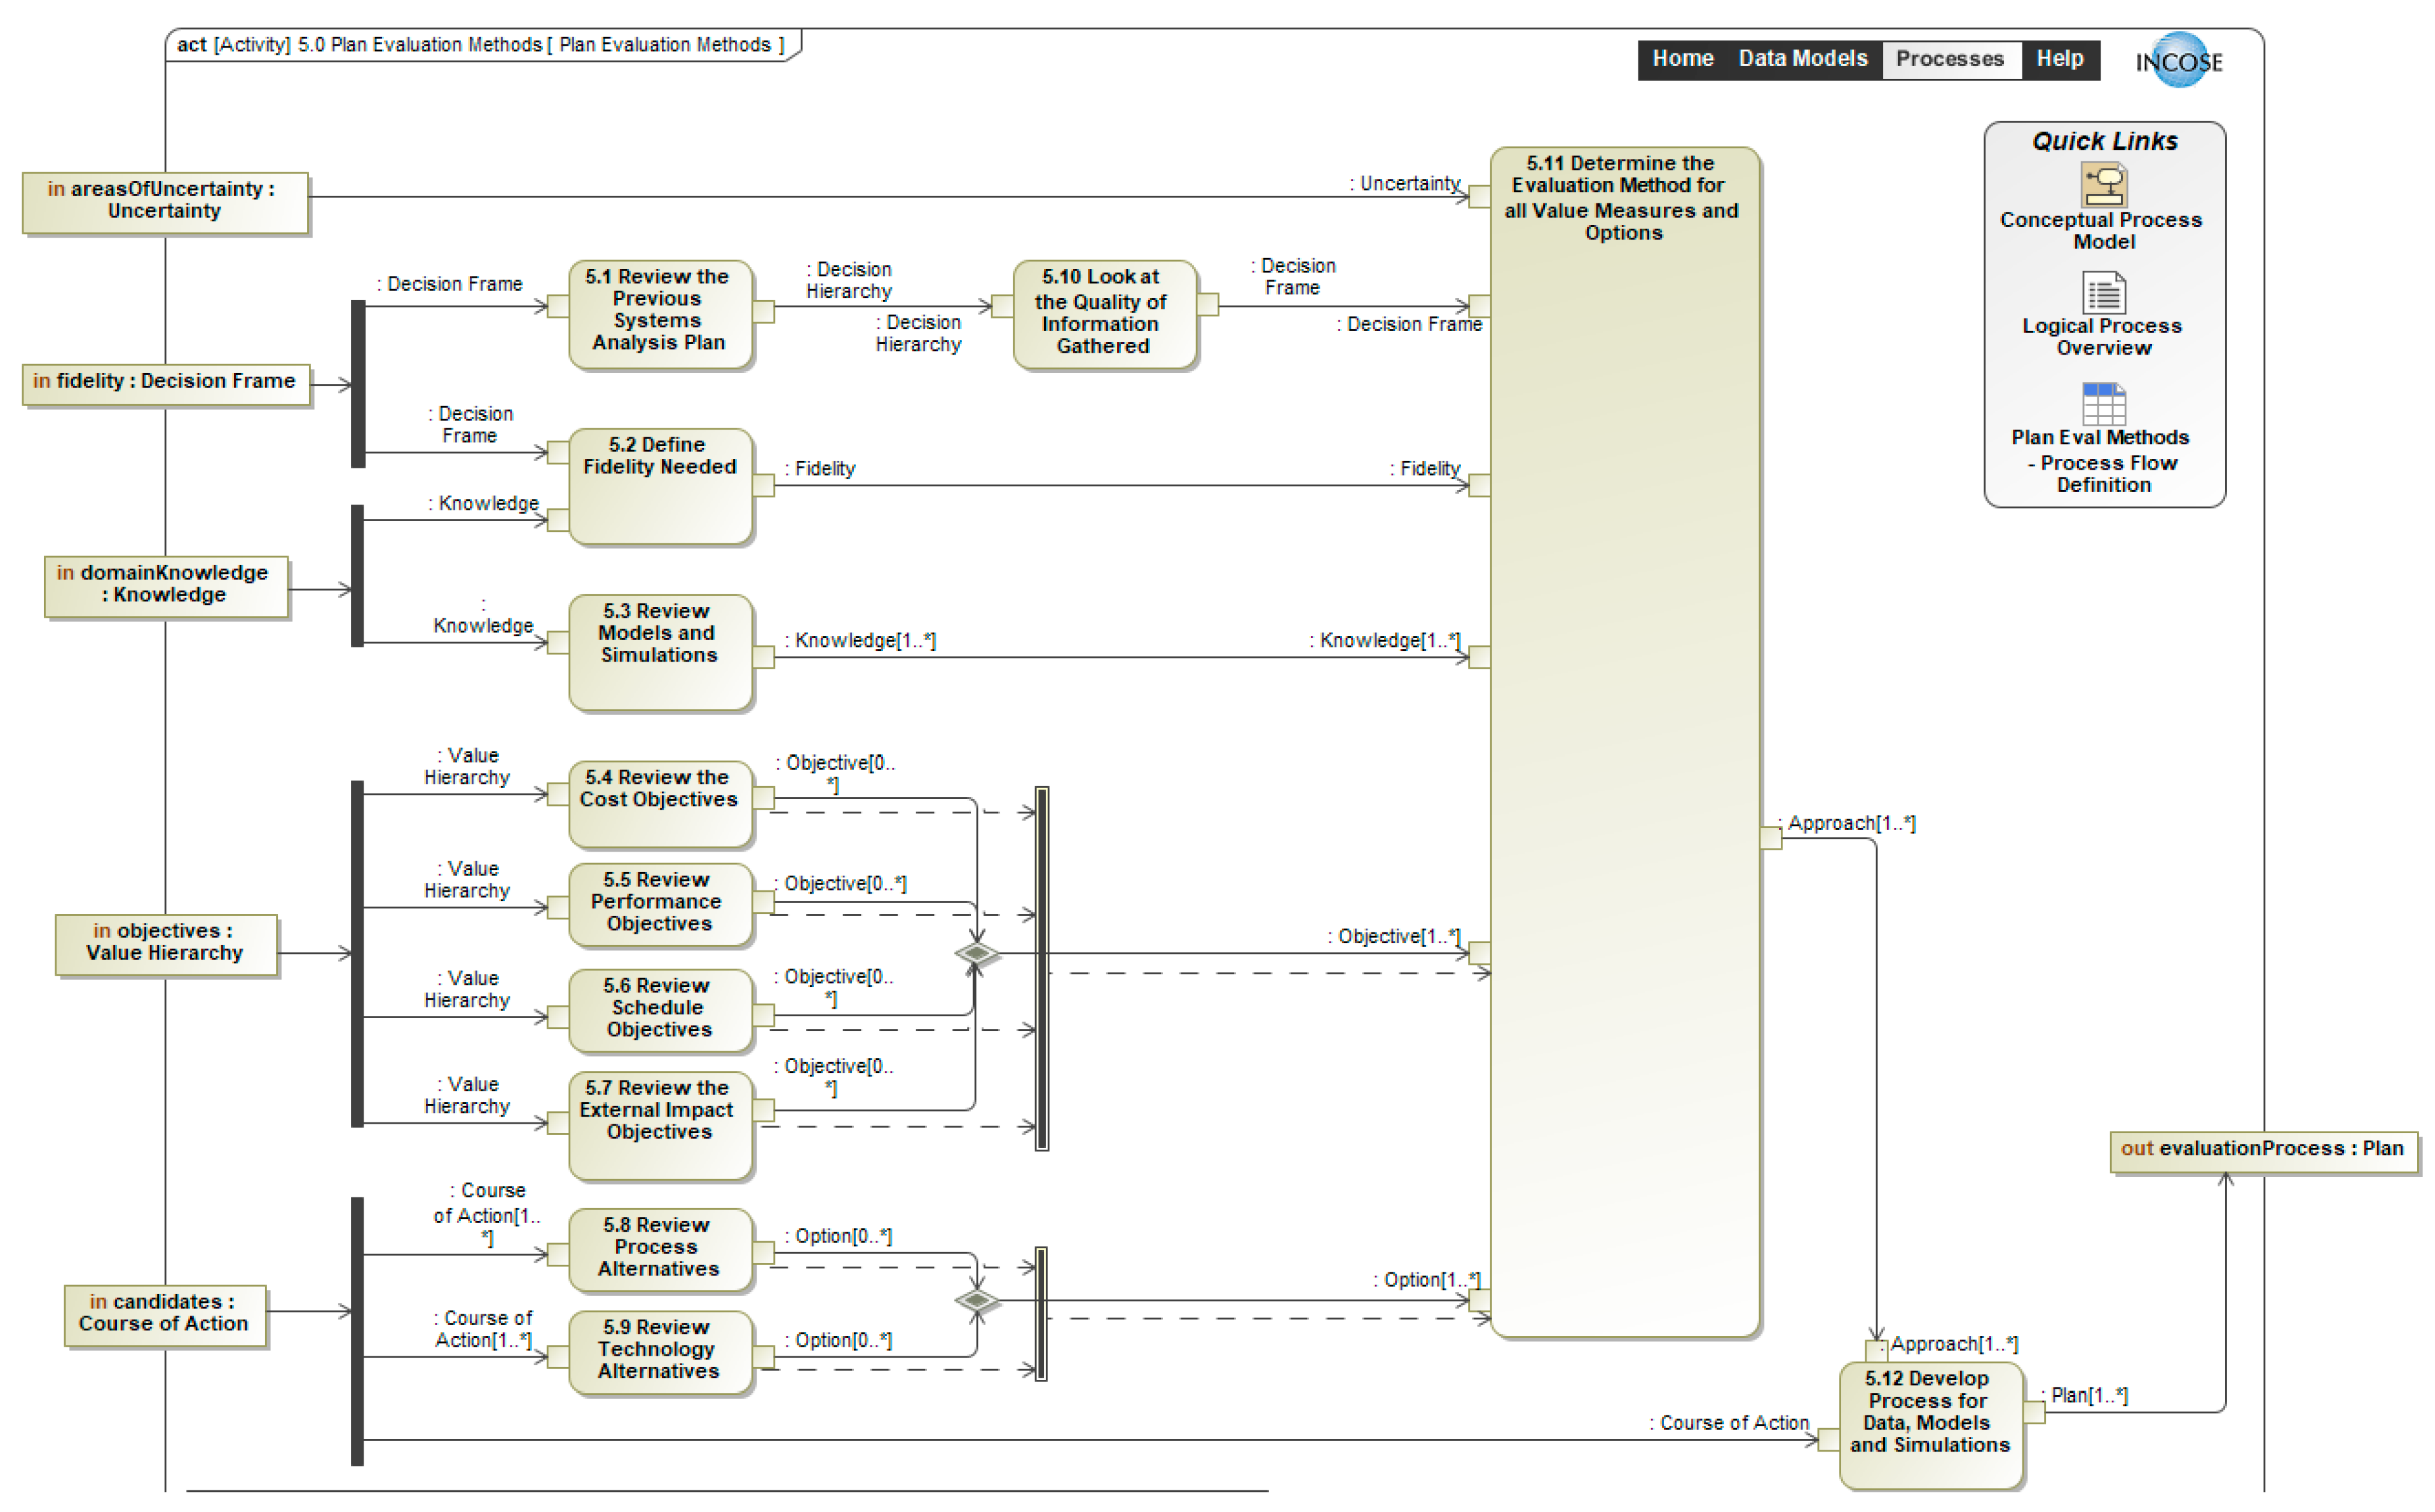
3.2.5. Step 5: Plan Evaluation Methods
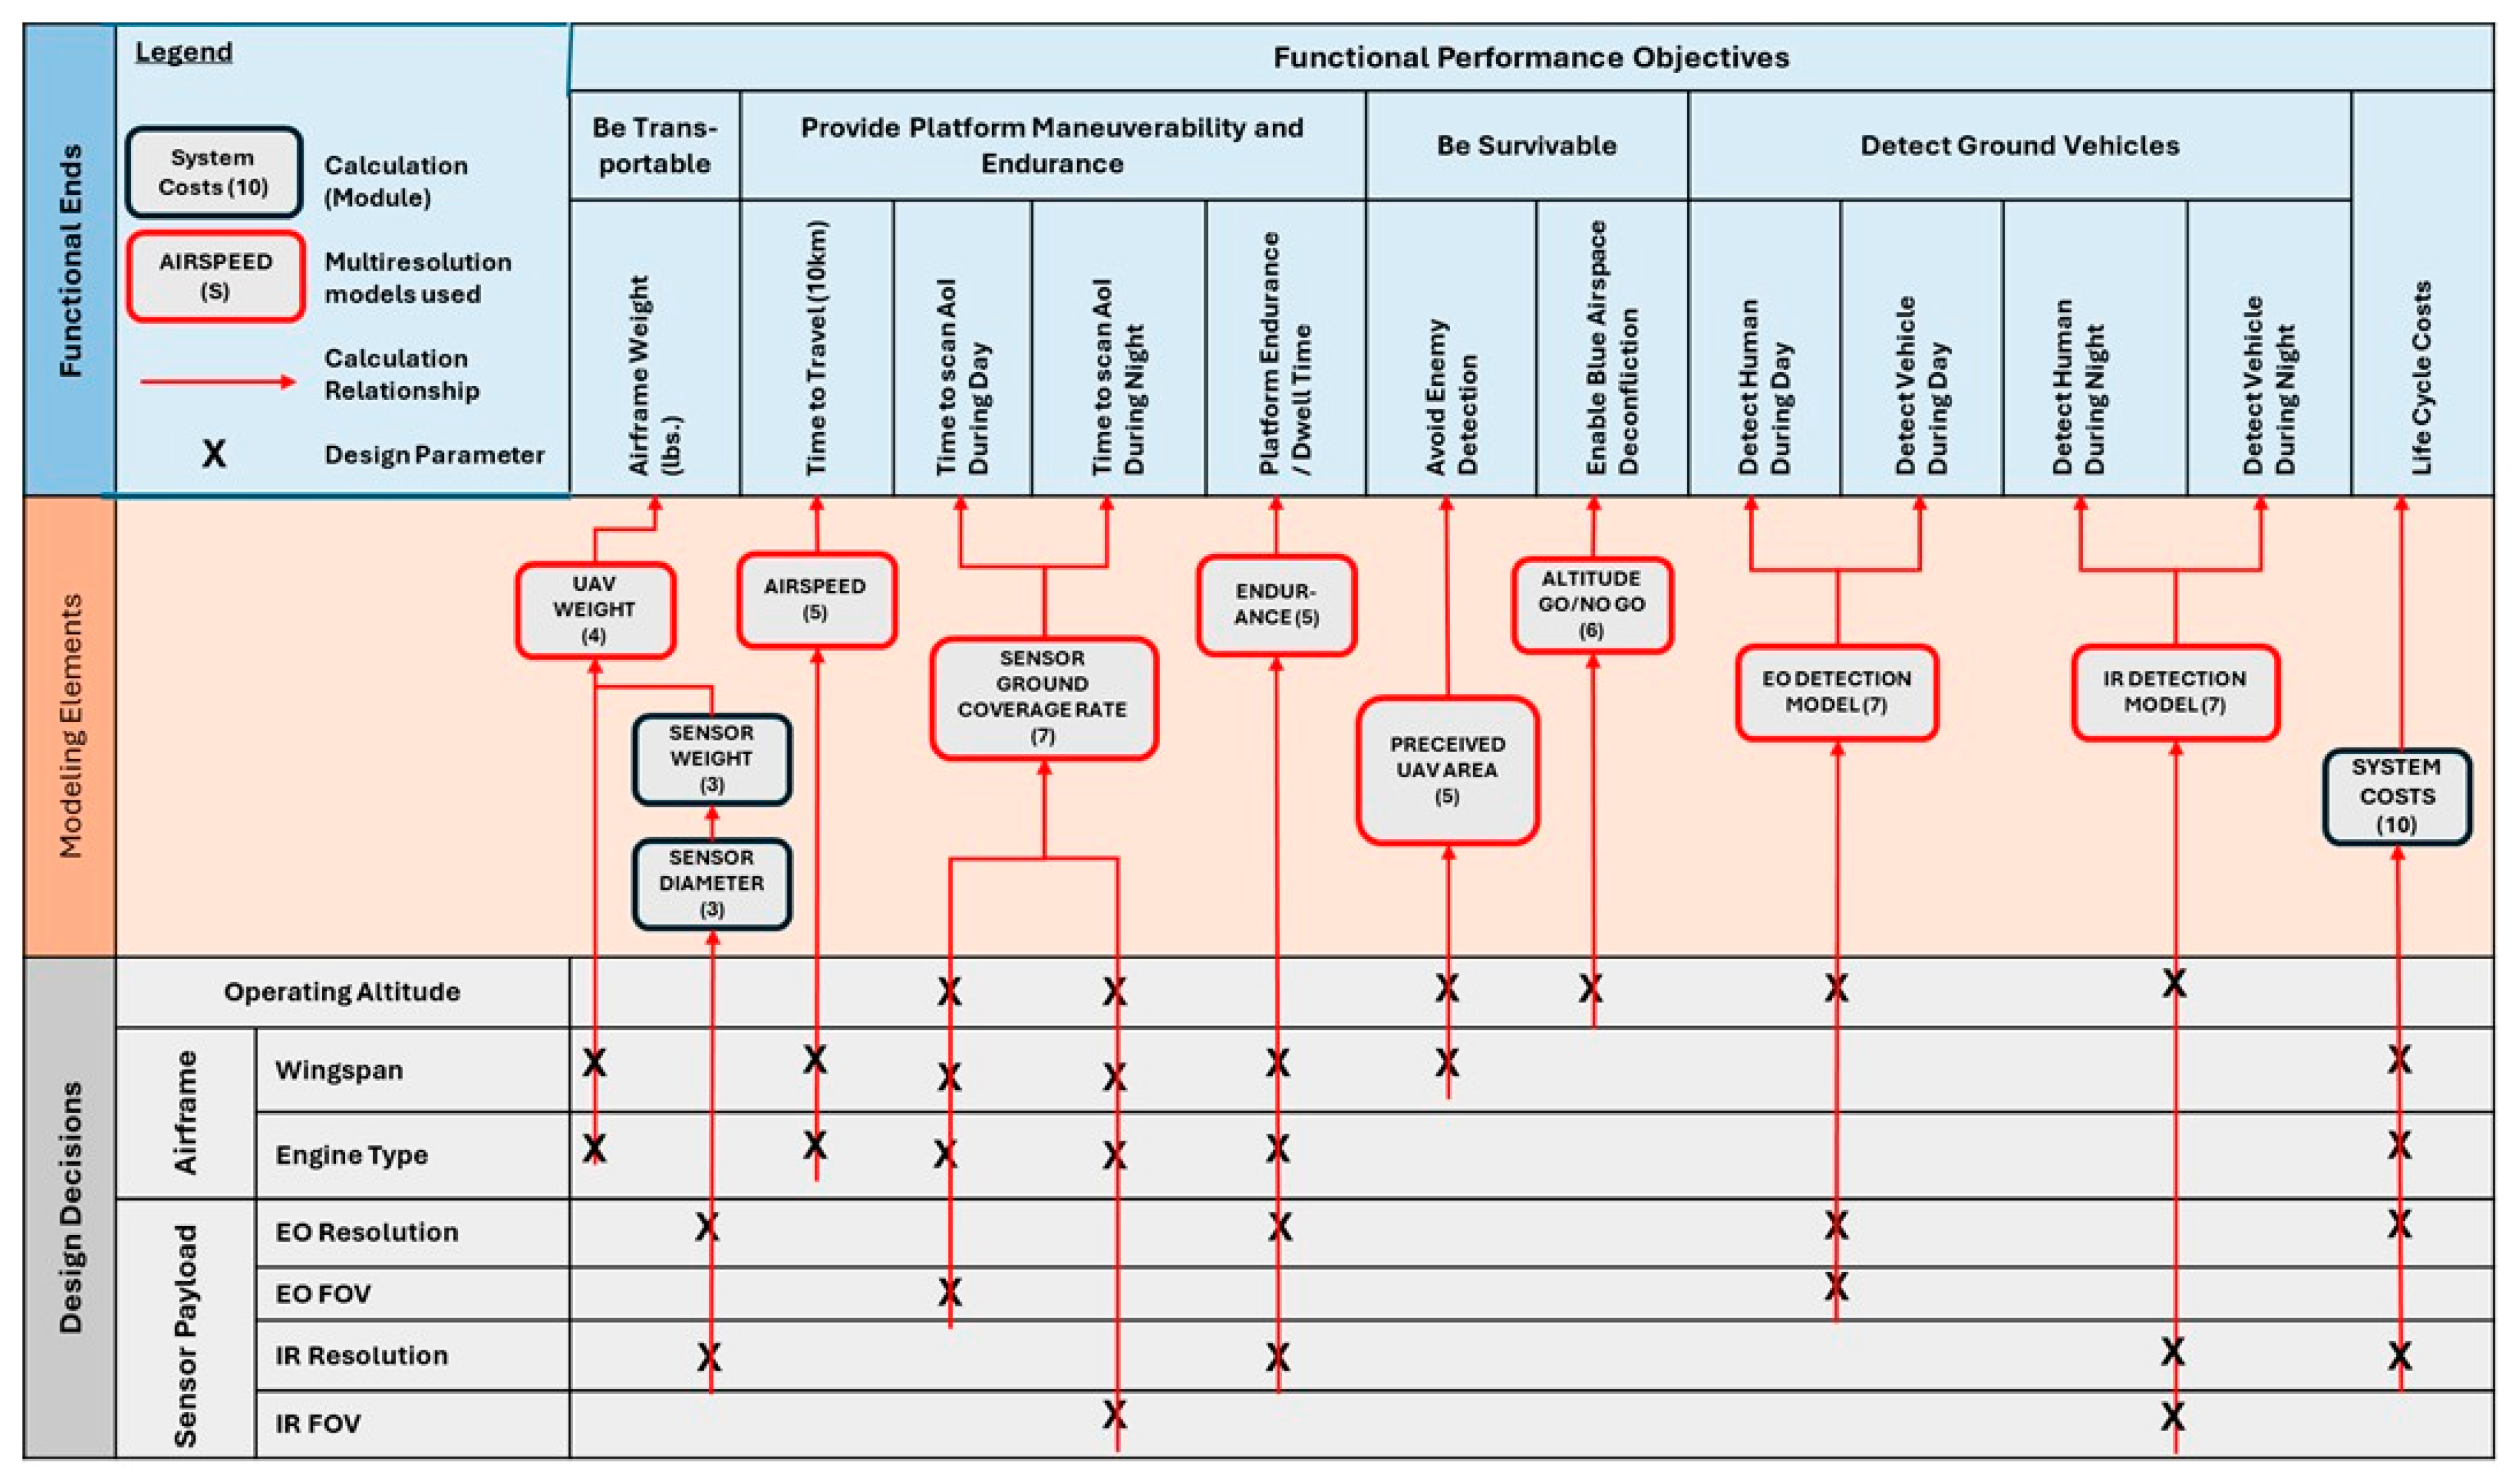
- Mobility & Survivability: Be transportable, maneuverable, and capable of enduring missions while avoiding detection.
- Detection Capabilities: Detect ground vehicles and humans both day and night.
- Efficiency Metrics: Optimize life cycle costs, airframe weight, travel time, scanning time, platform endurance, and blue airspace deconfliction.
- Modeling elements and design decisions influence how the objectives are met. They include:
- Design Decisions: Airframe type, wingspan, engine type, sensor payload, EO/IR resolution and field-of-view, and operating altitude.
- Modeling Techniques: Use of multiresolution models and detection models (EO and IR).
- Calculation relationships visually map how key parameters contribute to system costs and performance metrics. They include:
- Design Decisions: Airframe type, wingspan, engine type, sensor payload, EO/IR resolution and field-of-view, and operating altitude.
- Modeling Techniques: Use of multiresolution models and detection models (EO and IR).
- Analytical Specificity or Breadth;
- Access to Data;
- Execution Performance;
- Visualization Capability;
- Data Scientist Skillset;
- Vendor Pricing;
- Team Budget;
- Sharing and Collaboration.
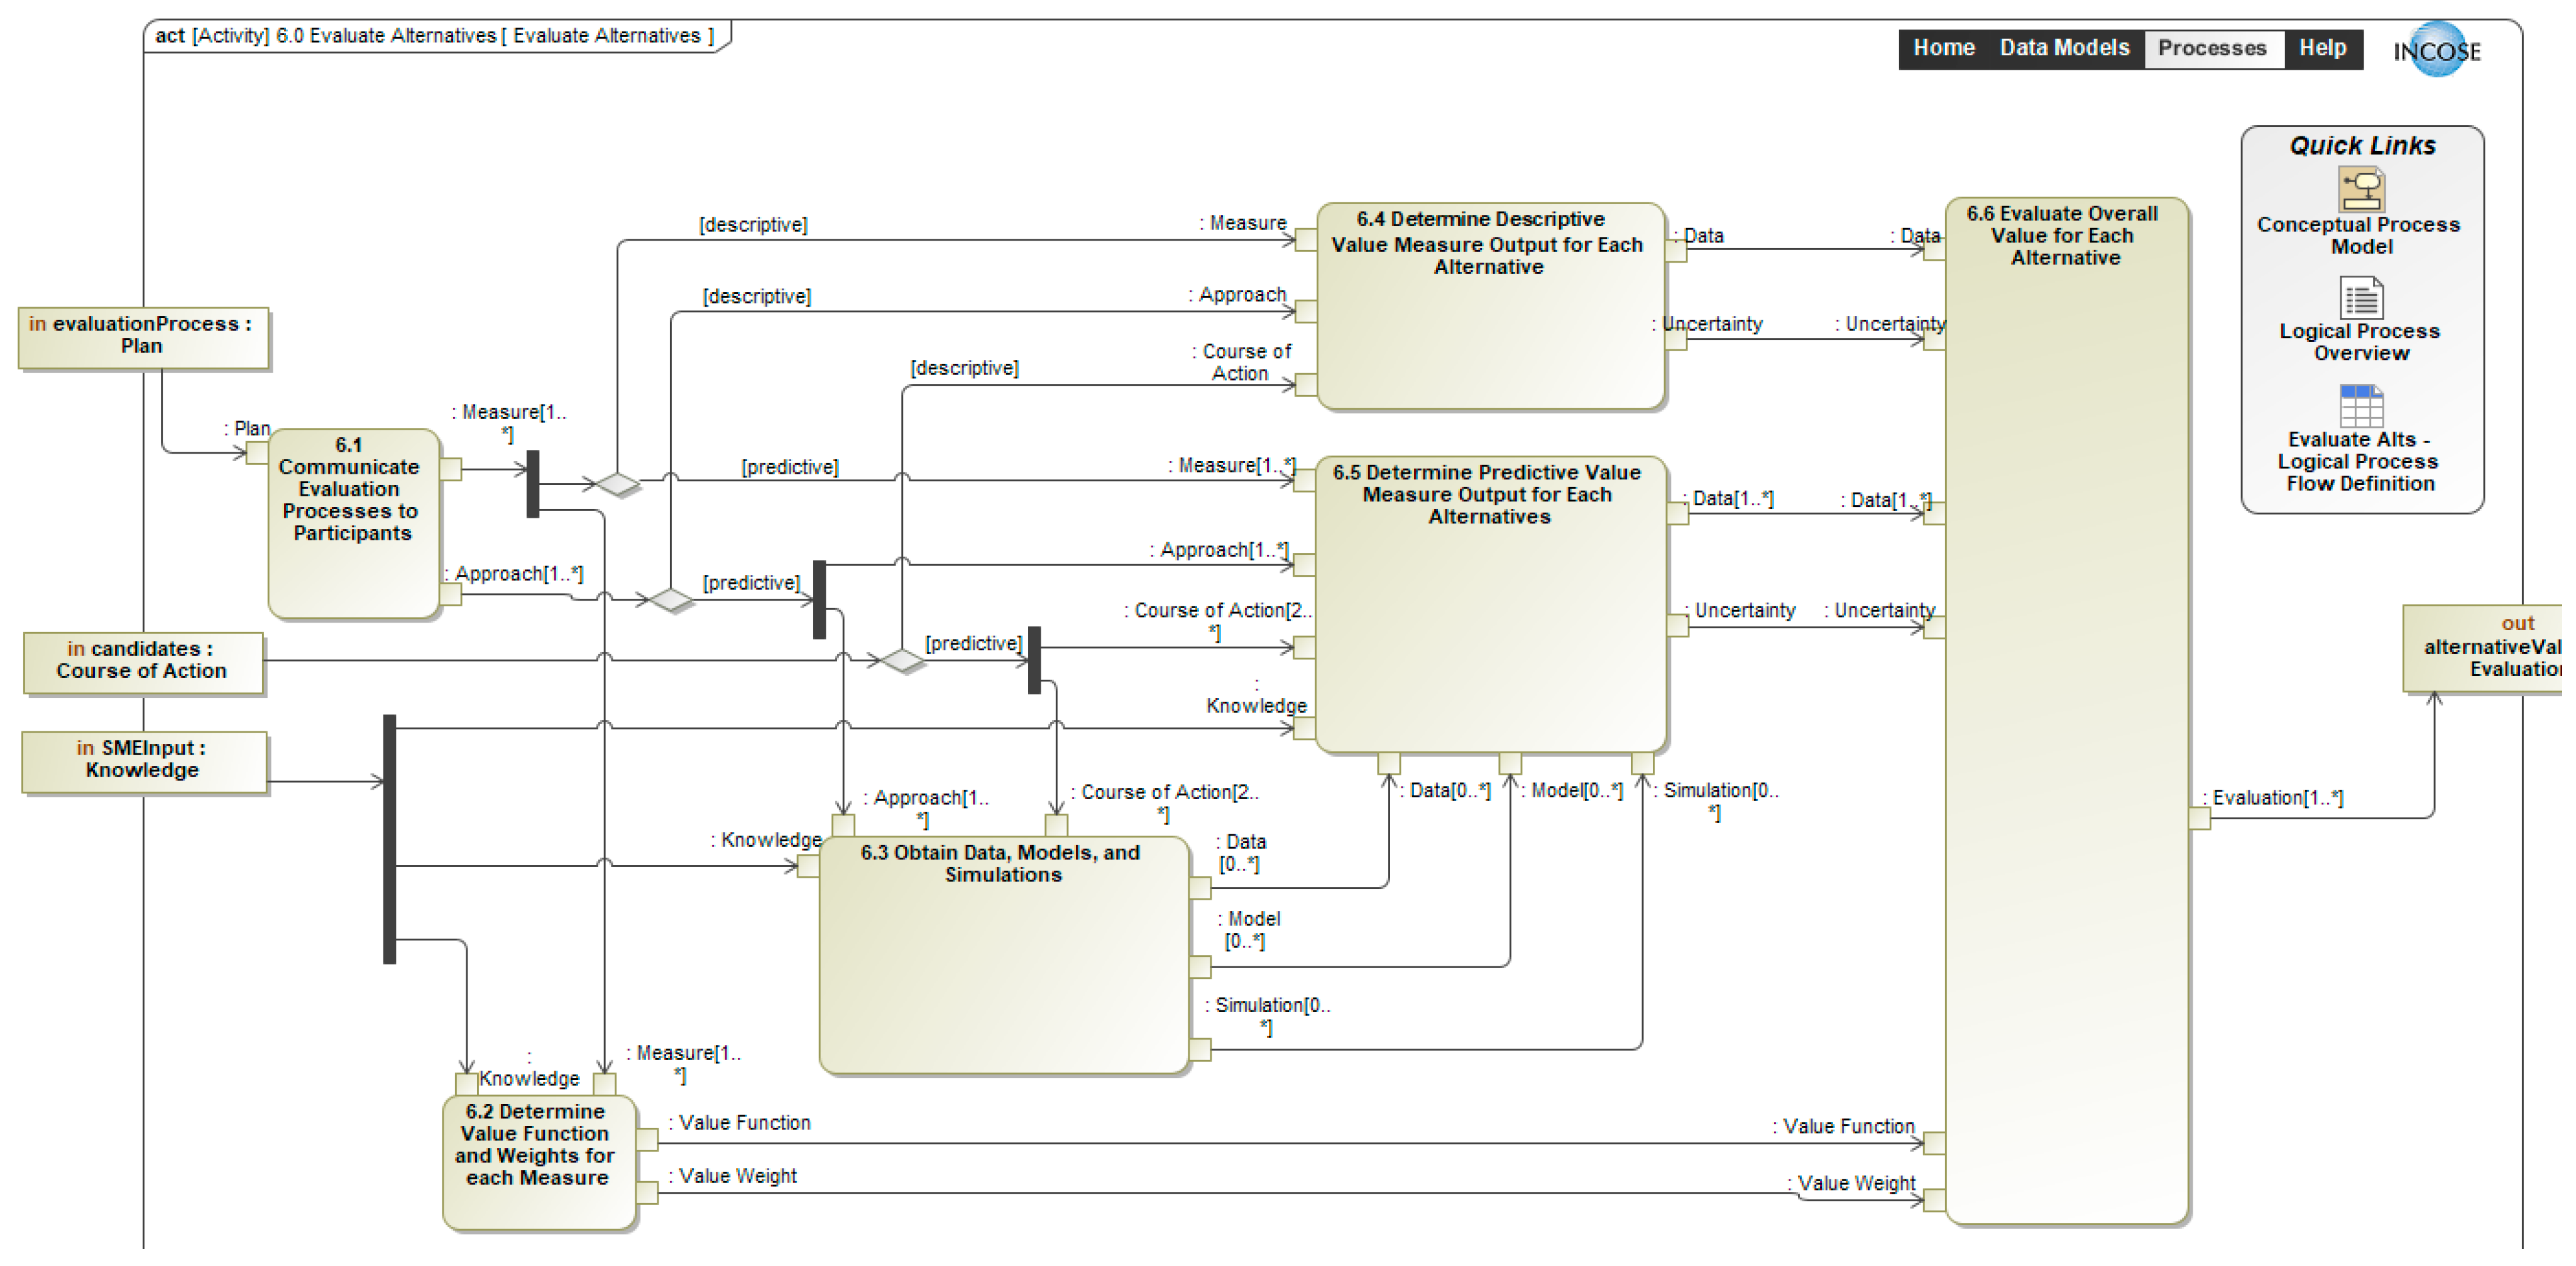
3.2.6. Step 6: Evaluate Alternatives
- and the swing weights are normalized.
3.2.7. Step 7: Improve Alternatives
- A risk is a potential future event or condition that may have a negative effect on achieving program objectives for cost, schedule, and performance. A risk is defined by (1) the likelihood that an undesired event or condition will occur and (2) the consequences, impact, or severity of the undesired event, were it to occur. An issue is an event or condition with negative effect that has occurred (such as a realized risk) or could occur that should be addressed.
- An opportunity offers potential future benefits to the program’s cost, schedule, or performance baseline.
3.2.8. Step 8: Assess Trade-Offs
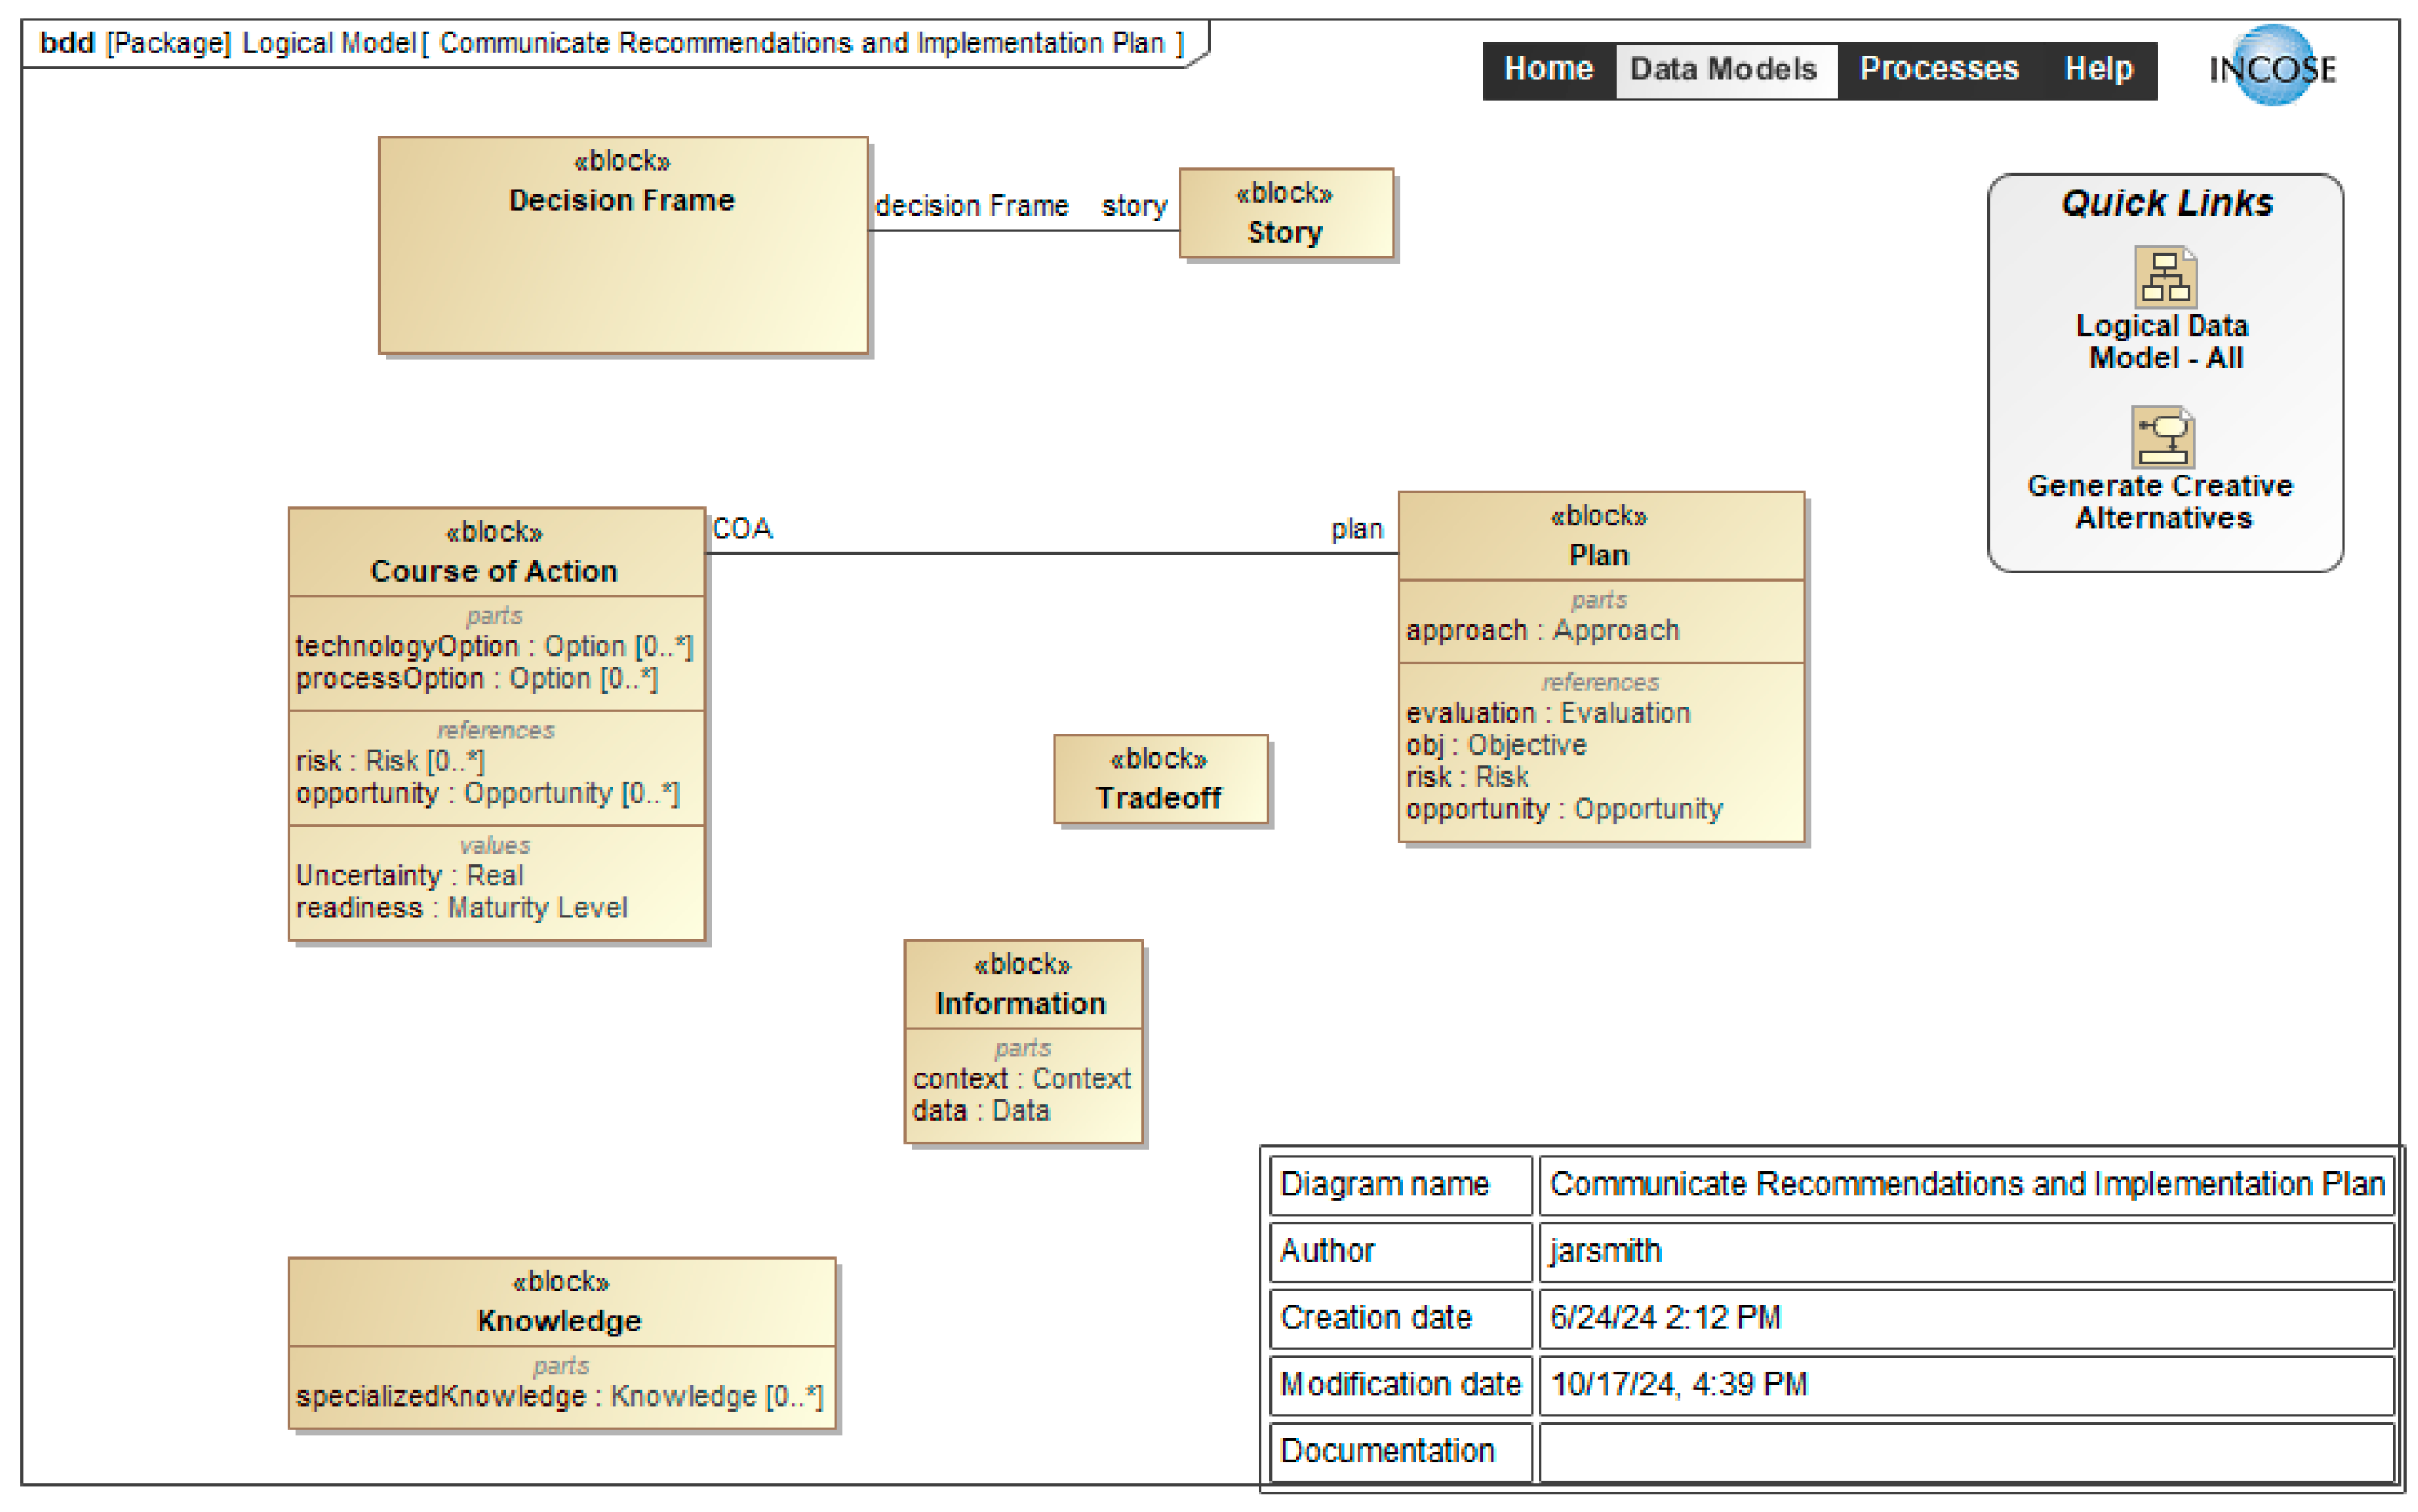
3.2.9. Step 9: Communicate Recommendations and Implementation Plan
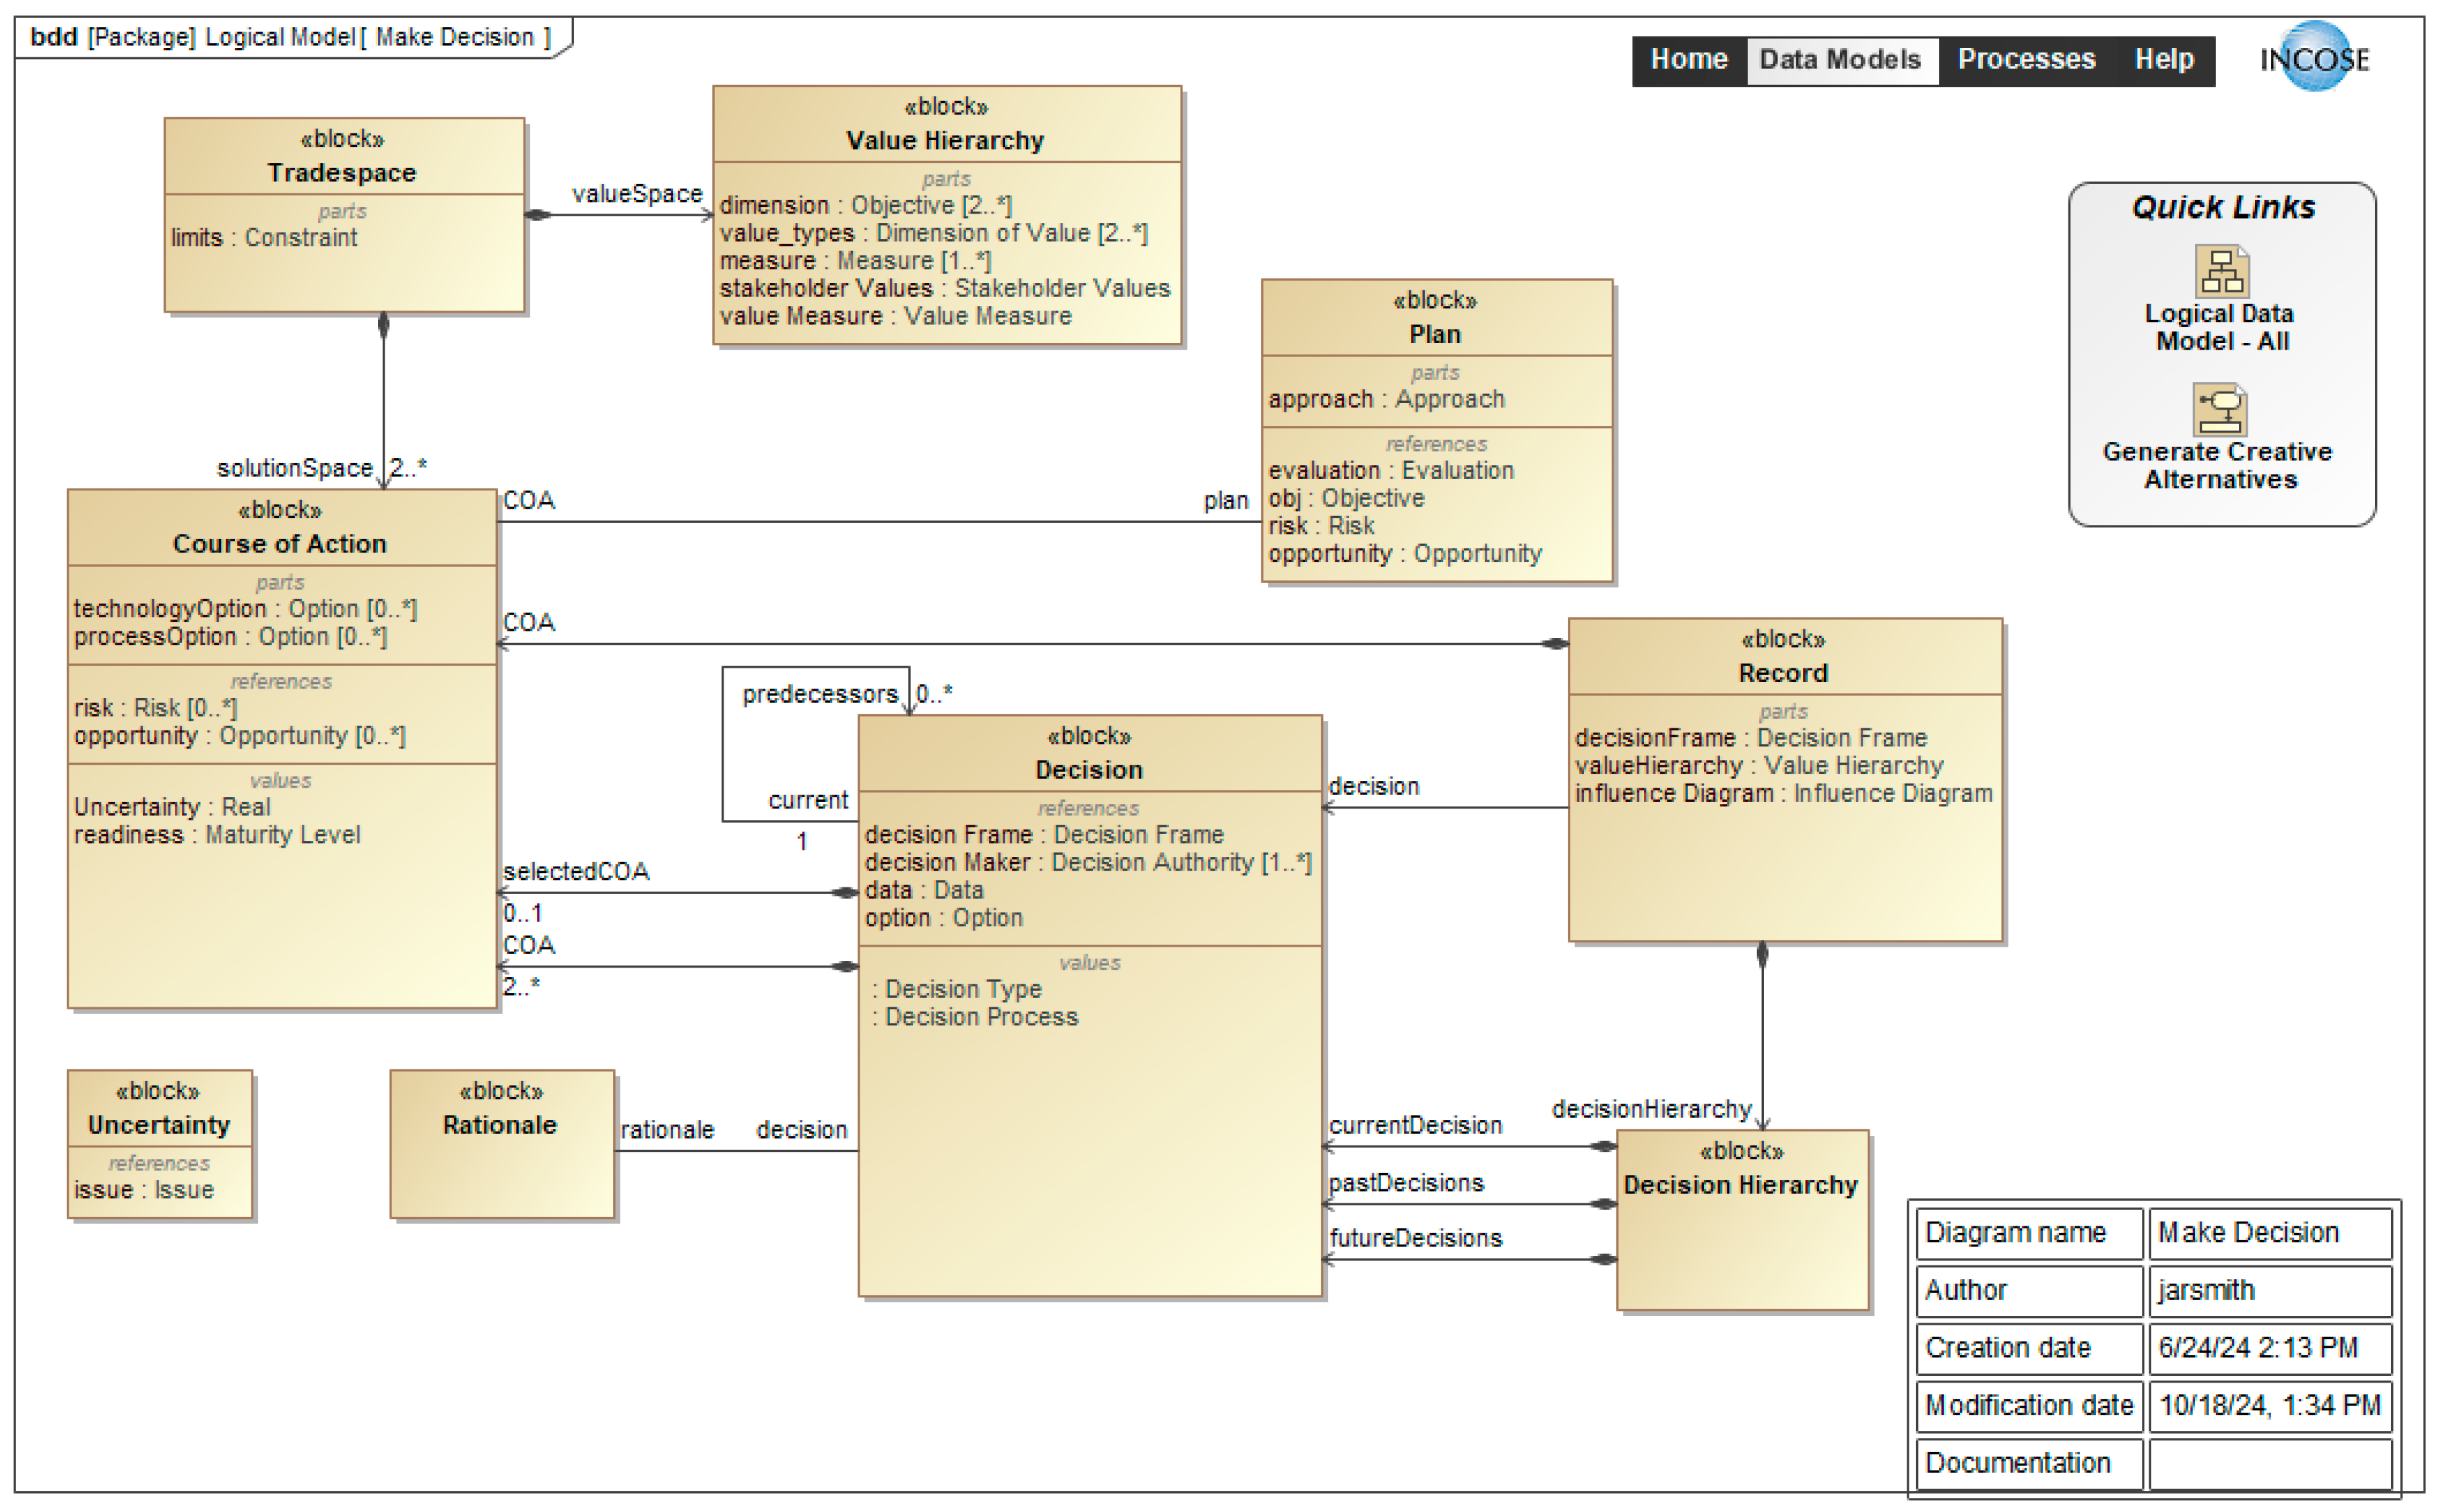
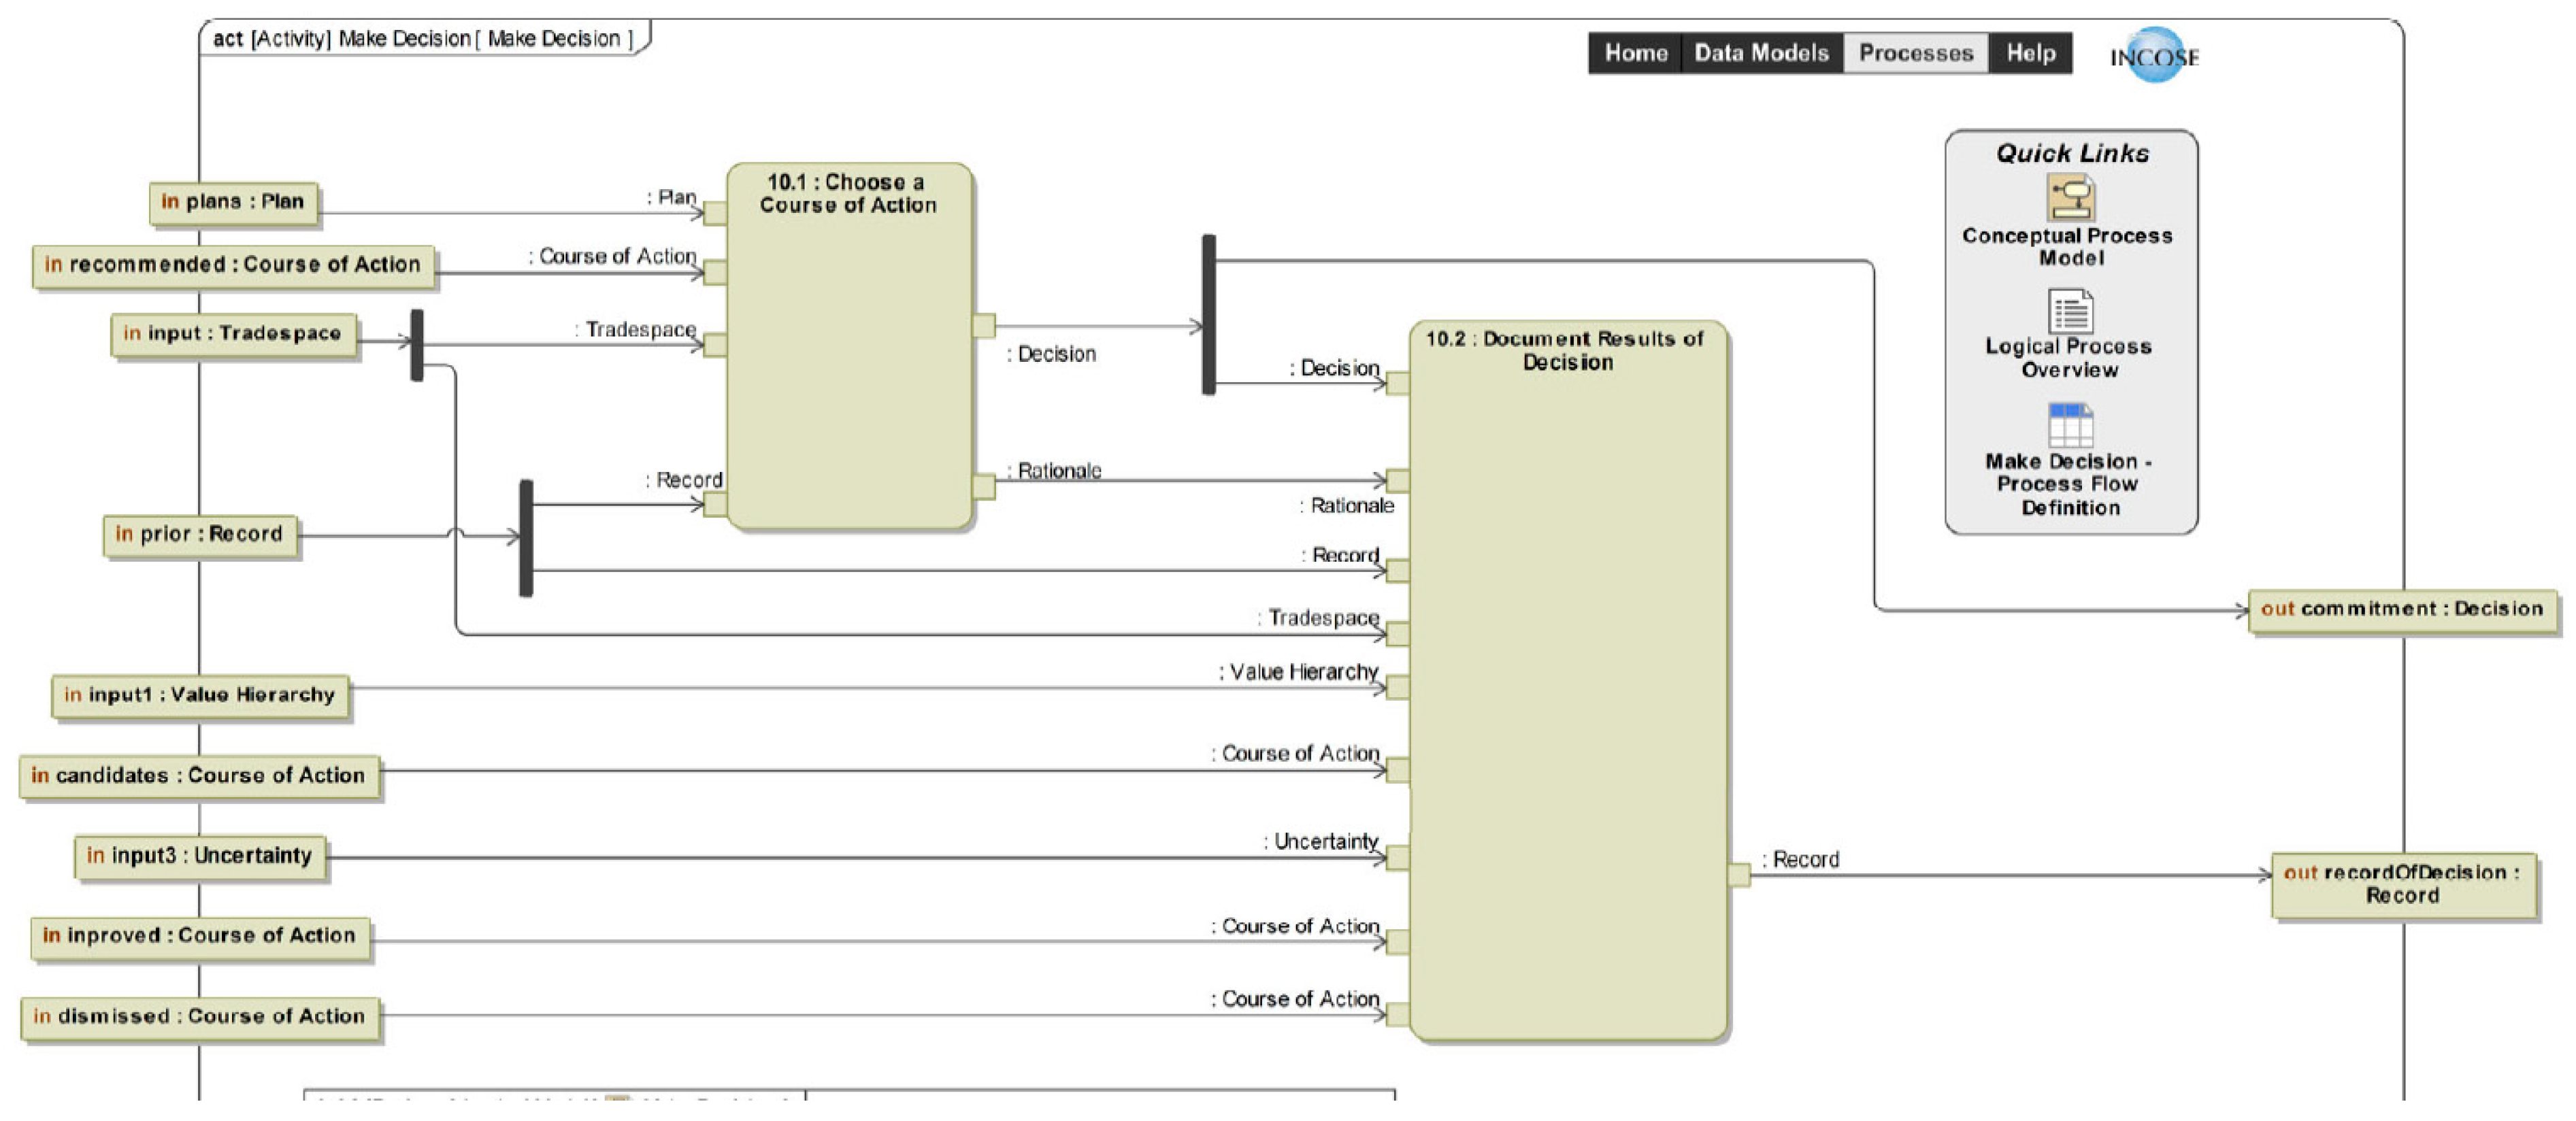
3.2.10. Step 10: Make Decision
- Decision Hierarchy: Decision-makers are busy. It is important to identify the major decisions that have been made, the decision(s) to be made and major future decisions. It may be necessary to review the decision frame.
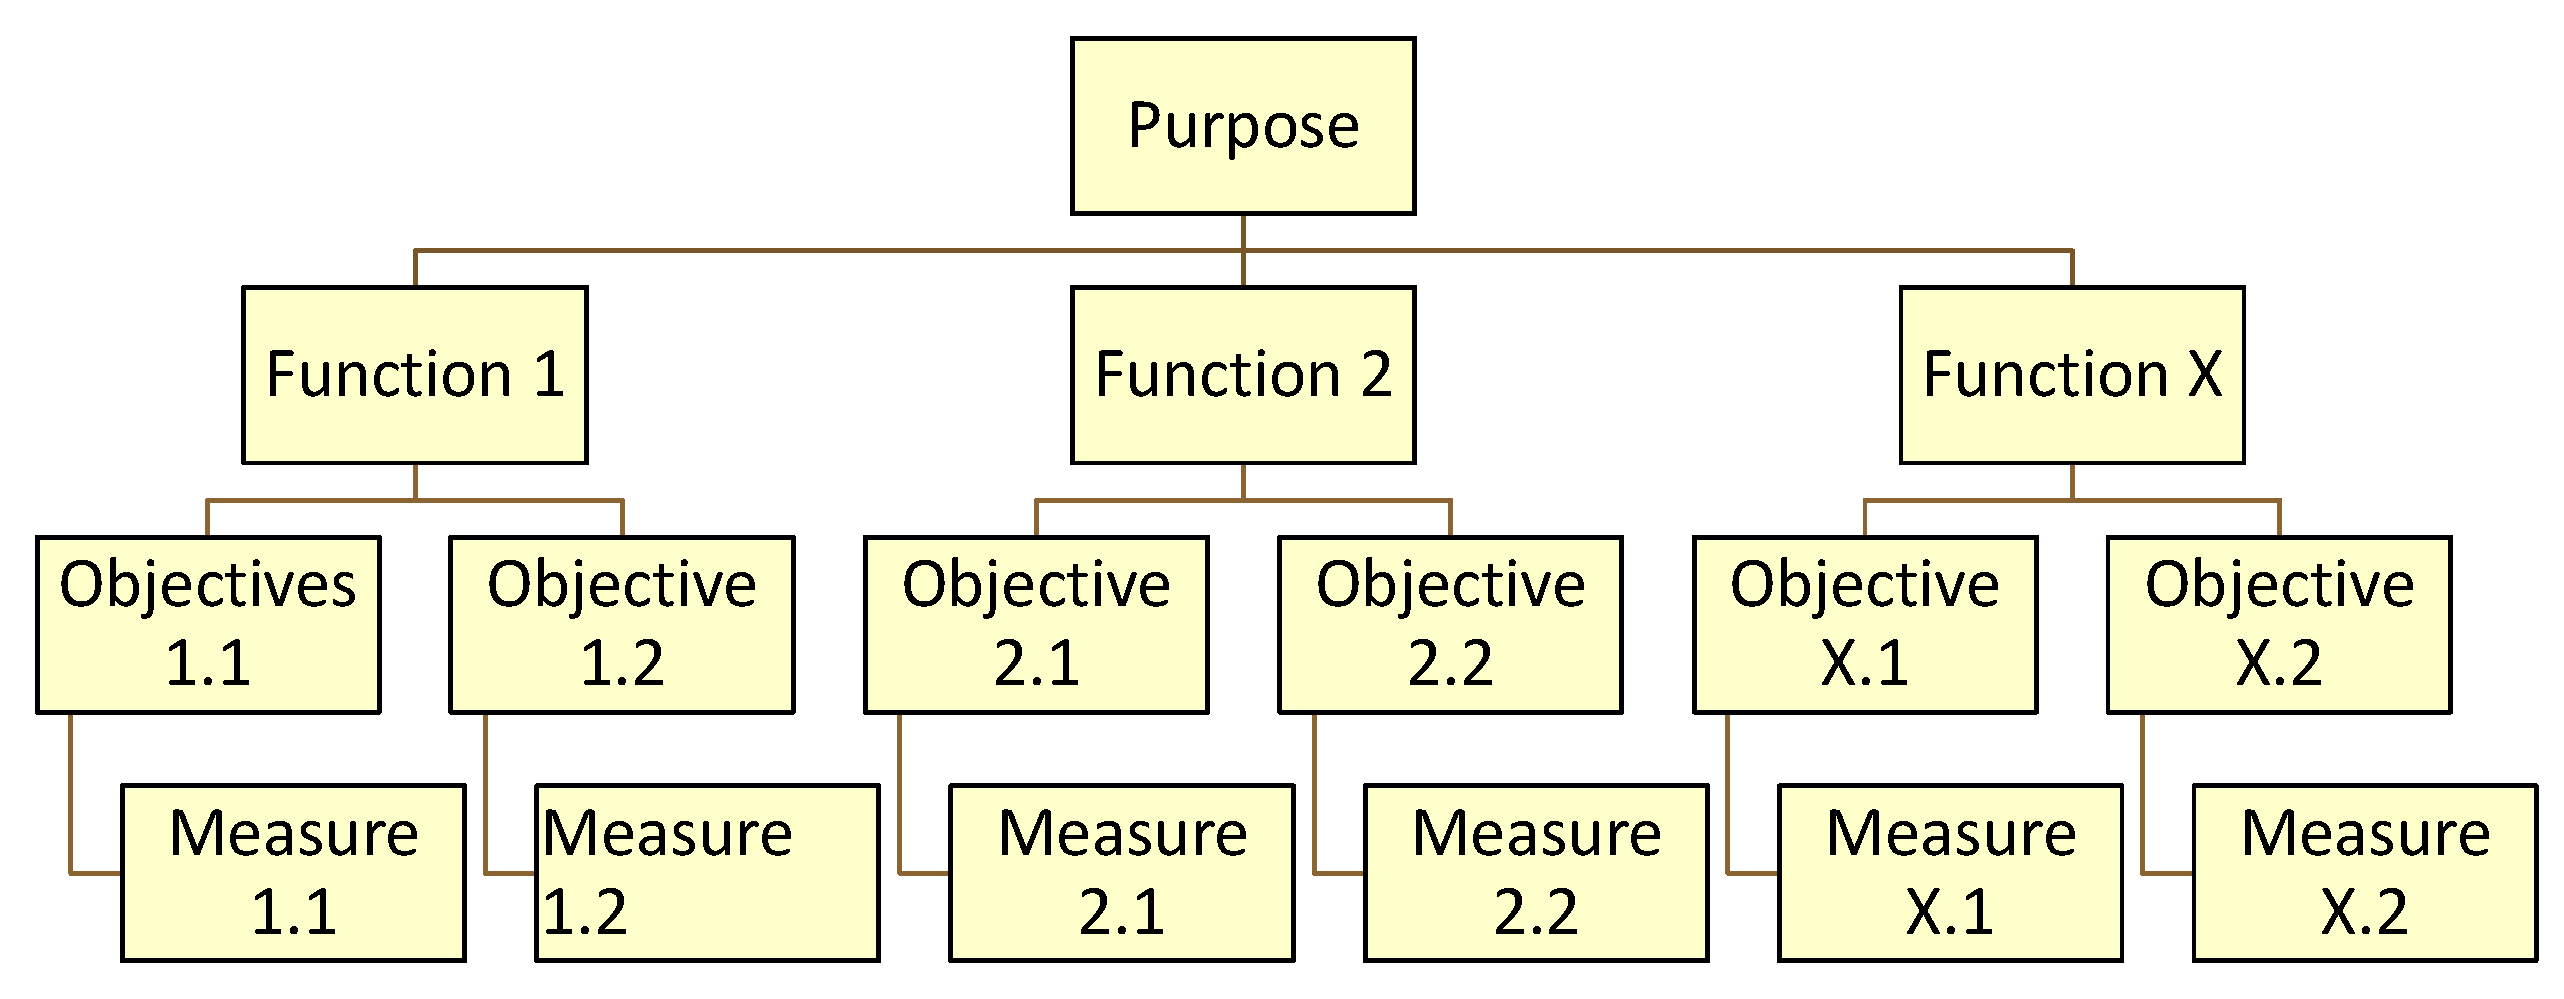
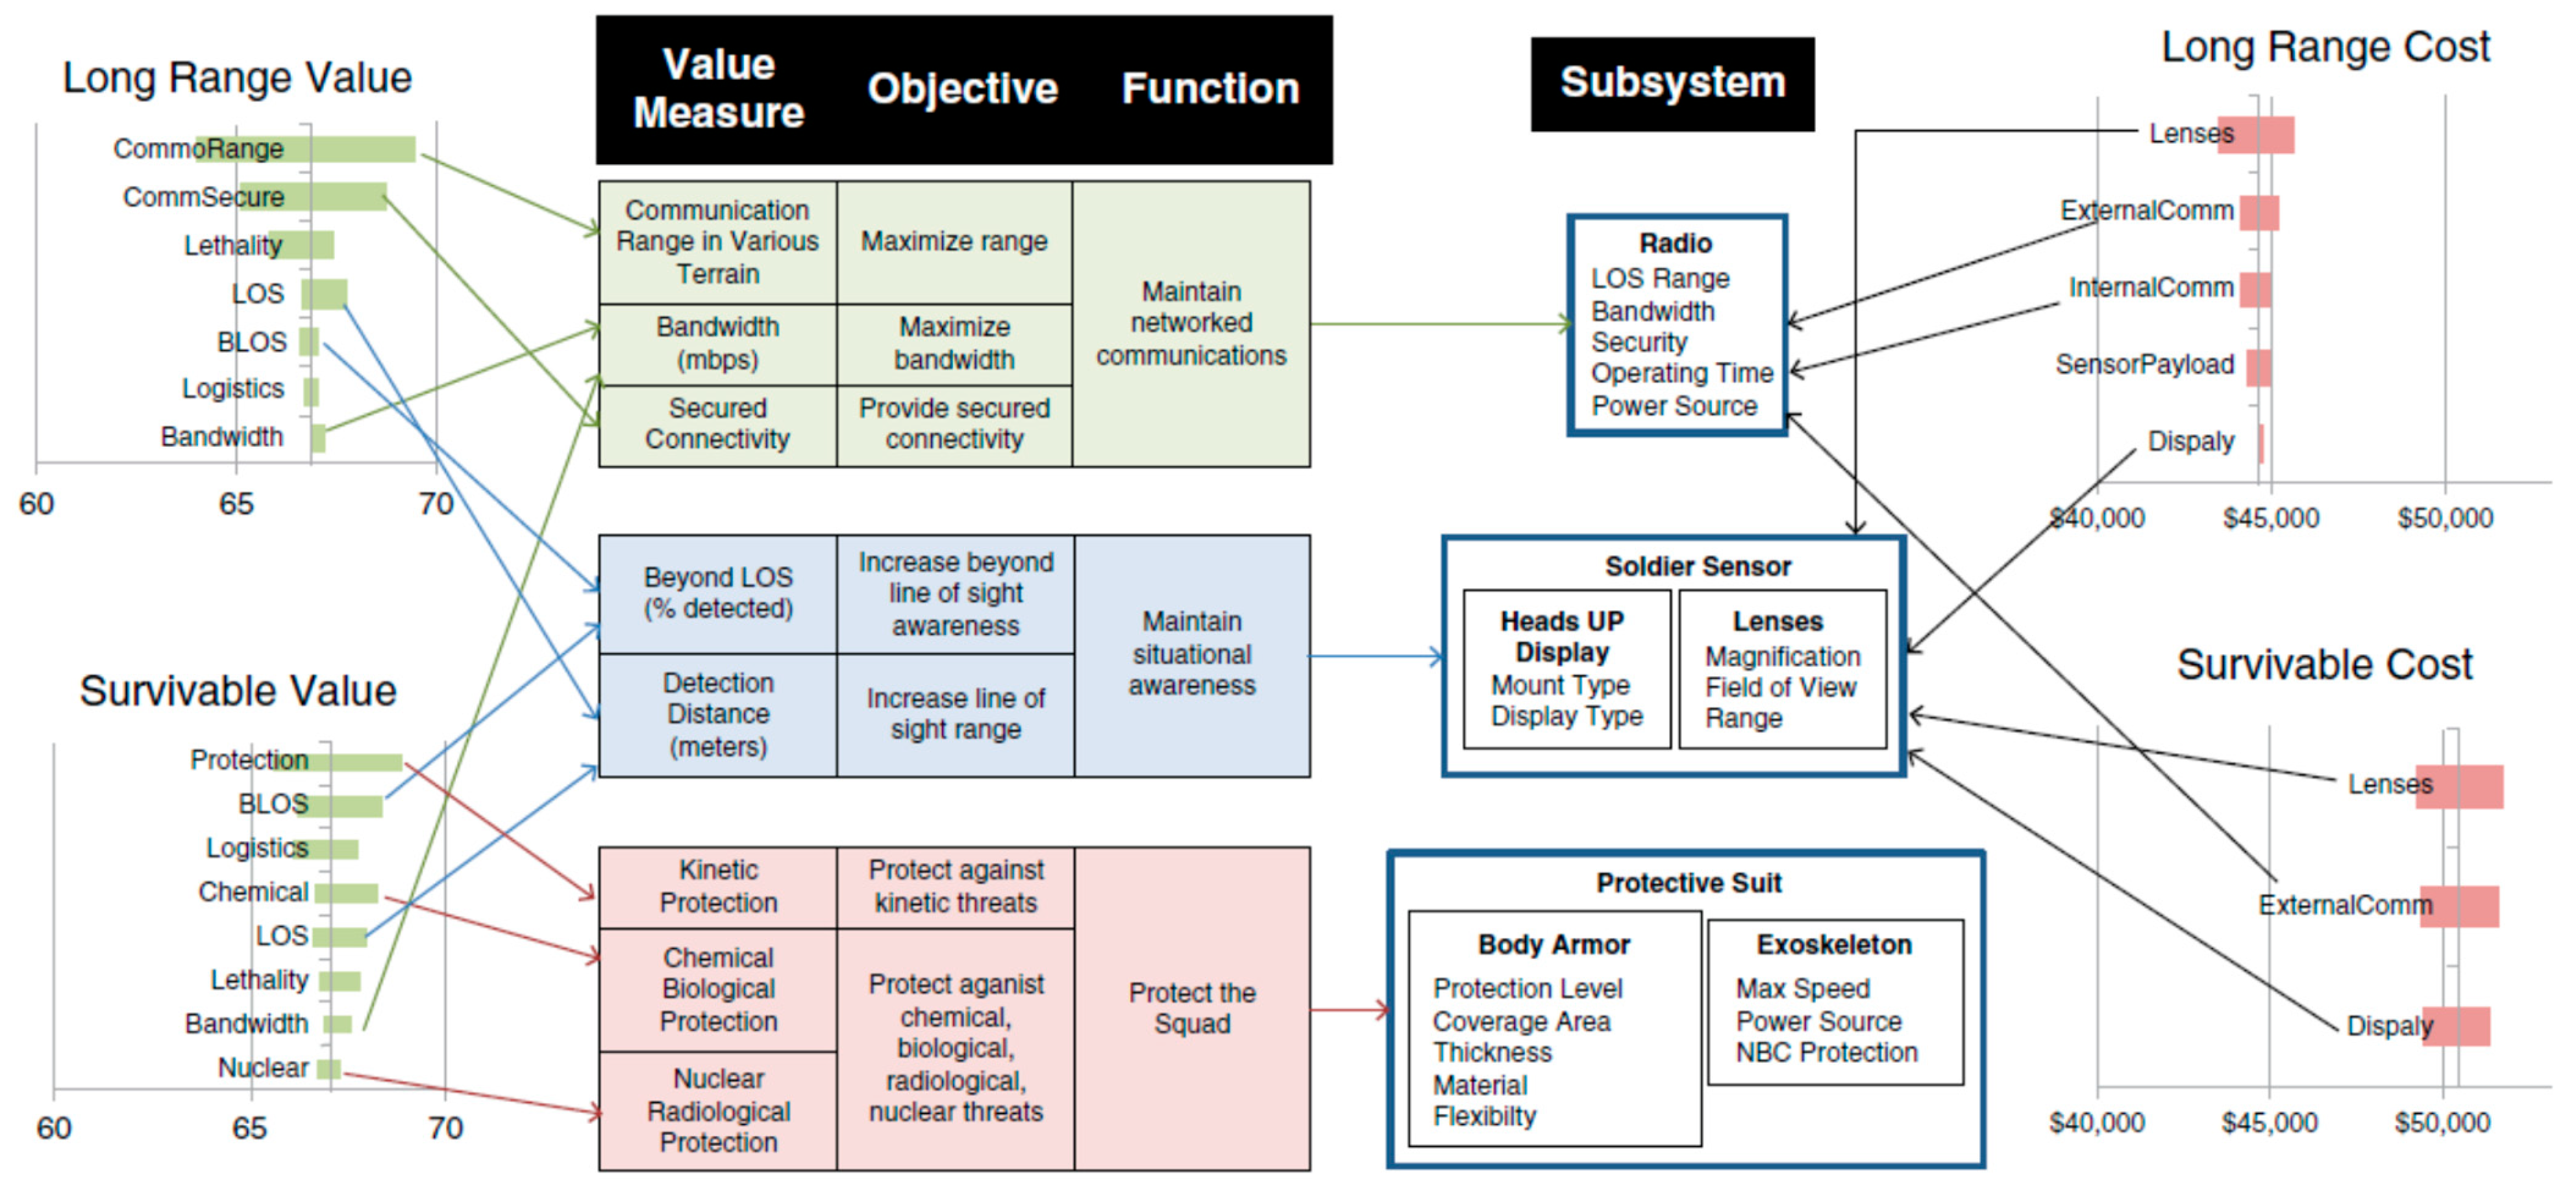
- Value Hierarchy: The system objectives include performance, cost, and schedule. The value hierarchy includes the performance objectives and value measures.
- Major Requirements: Decision-makers may want to verify the recommended COA that meets the major system requirements.
- Courses of Action (COAs): The decision-makers and key stakeholders need to understand the COAs that were identified and evaluated. It is common that decision-makers or key stakeholders have preferences for one or more COAs. They may distrust the systems analysis or not decide if their preferred COA is not included.
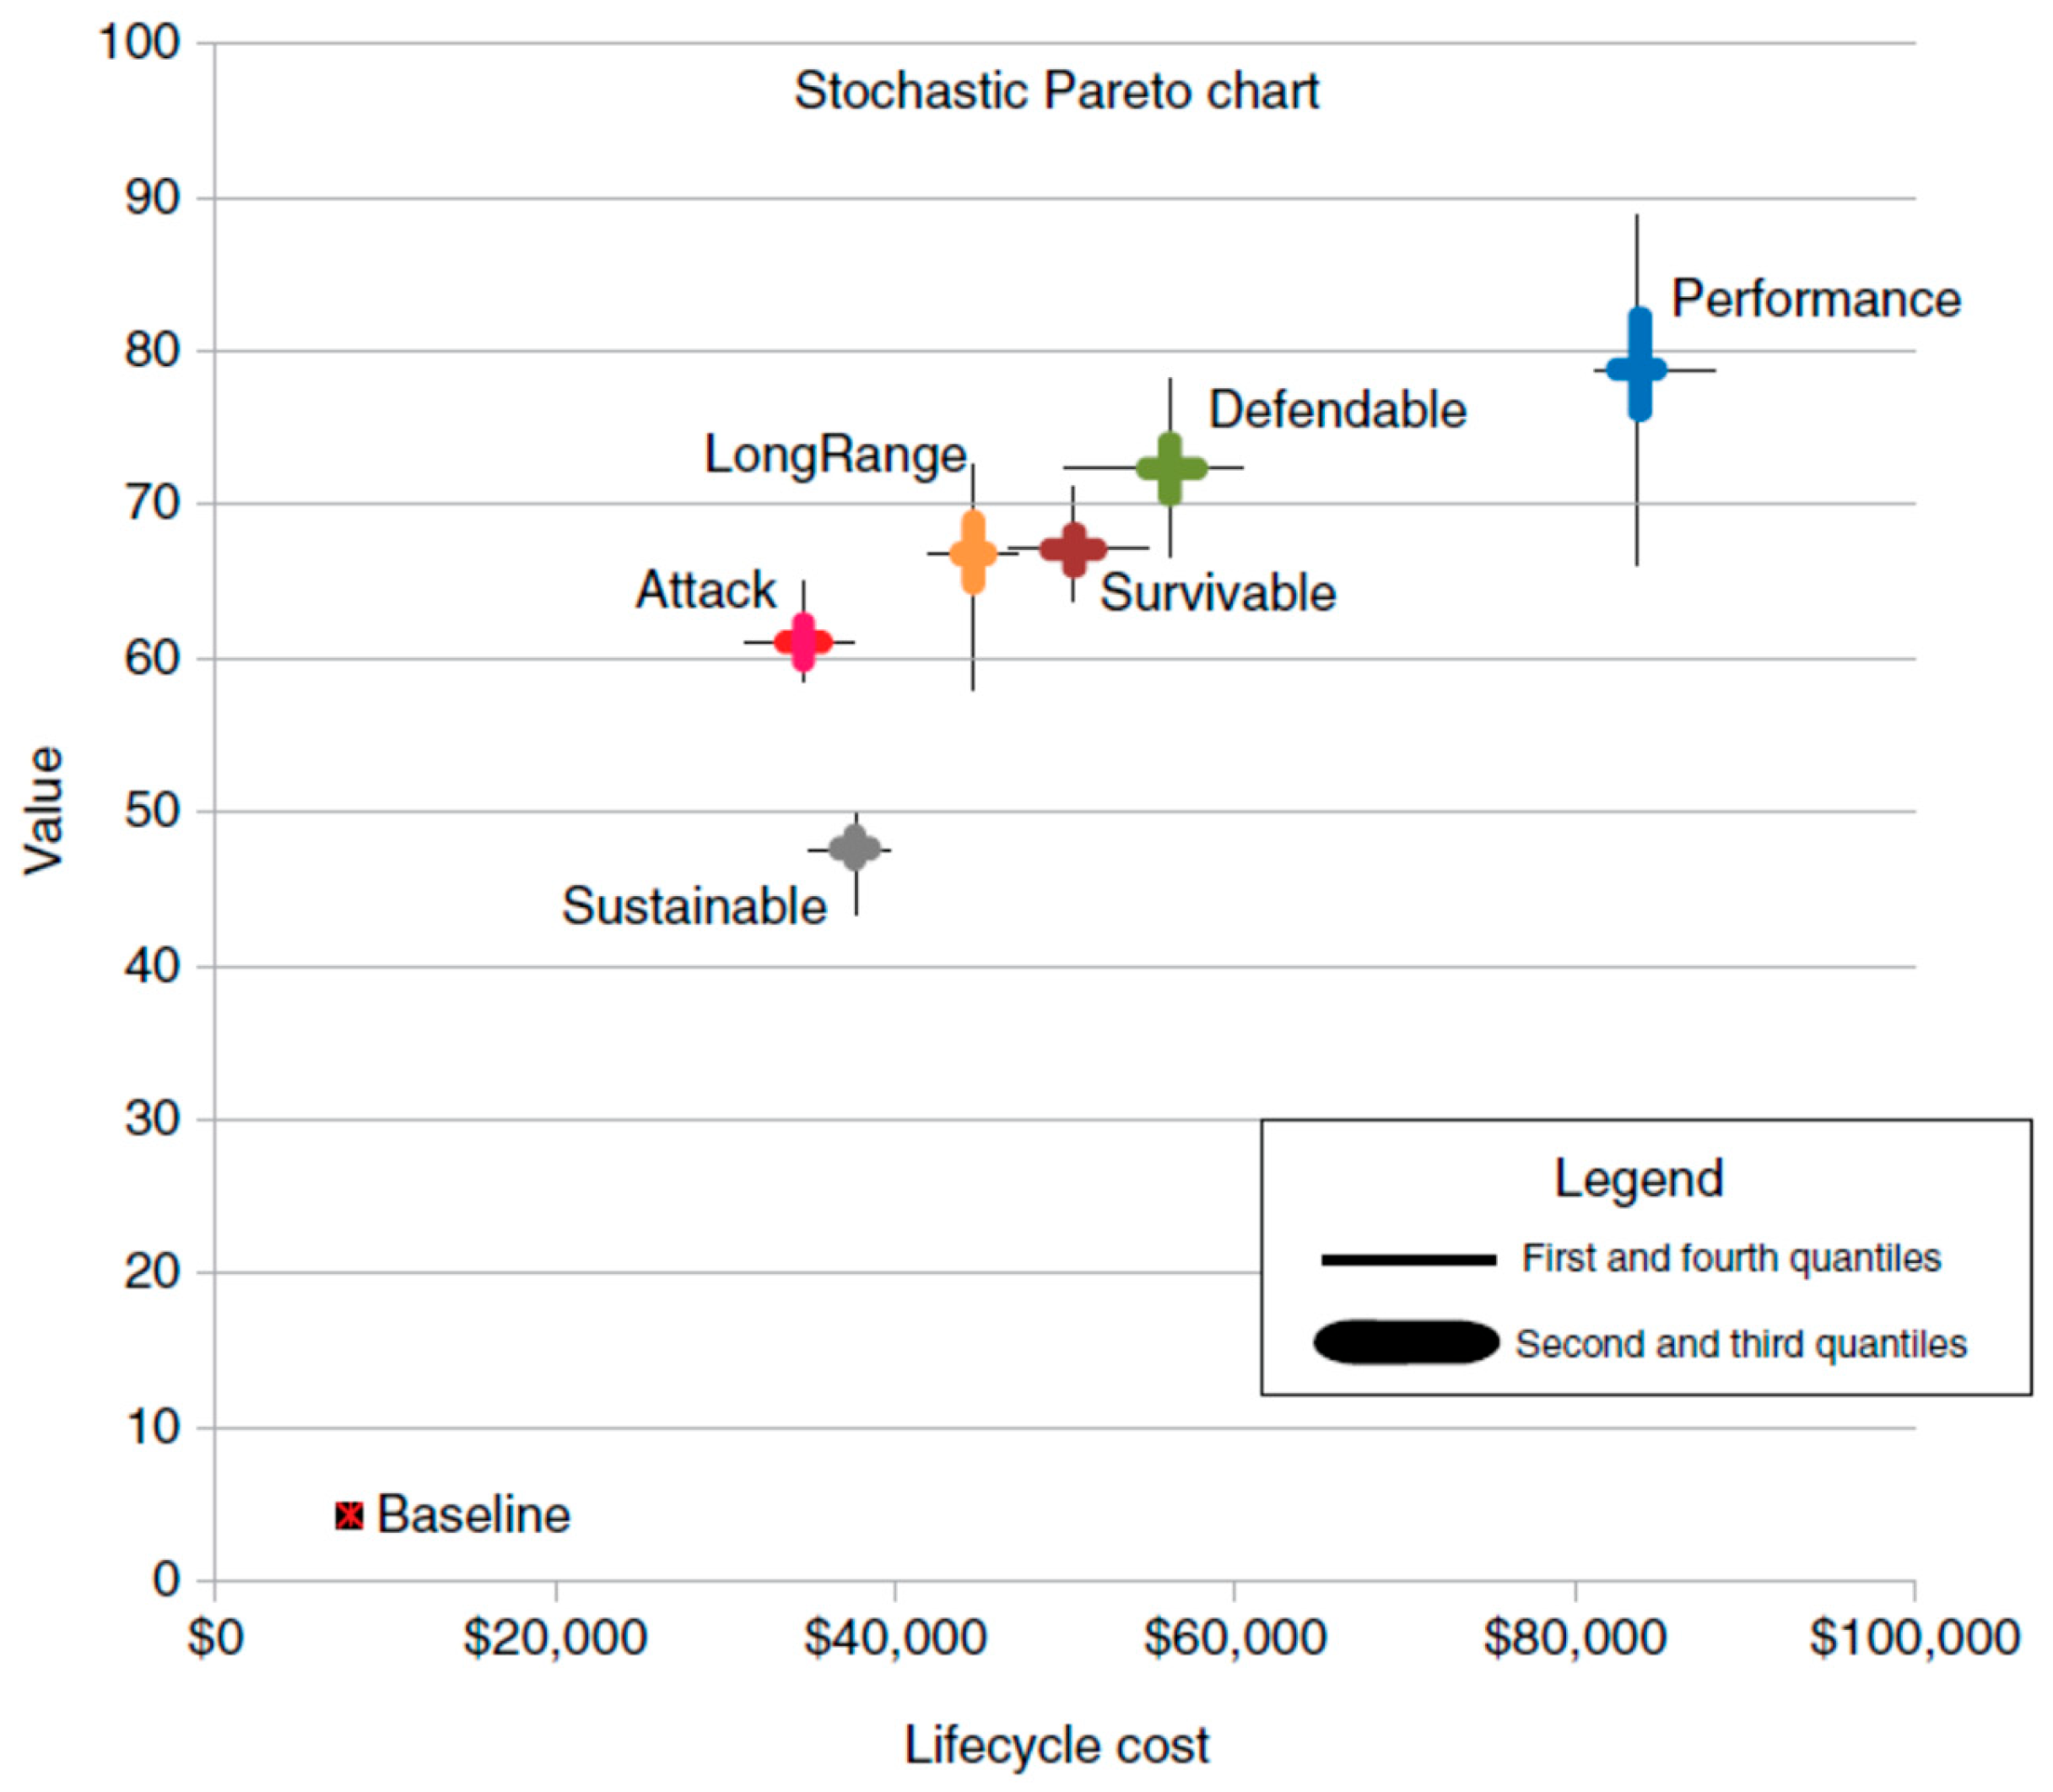
- Tradespace: The decision-makers and key stakeholders are usually interested in knowing the COA tradespace, the dominated COAs and the trade-offs between the non-dominated COAs. Decision-makers and key stakeholders typically want to know why their preferred COAs are not recommended.
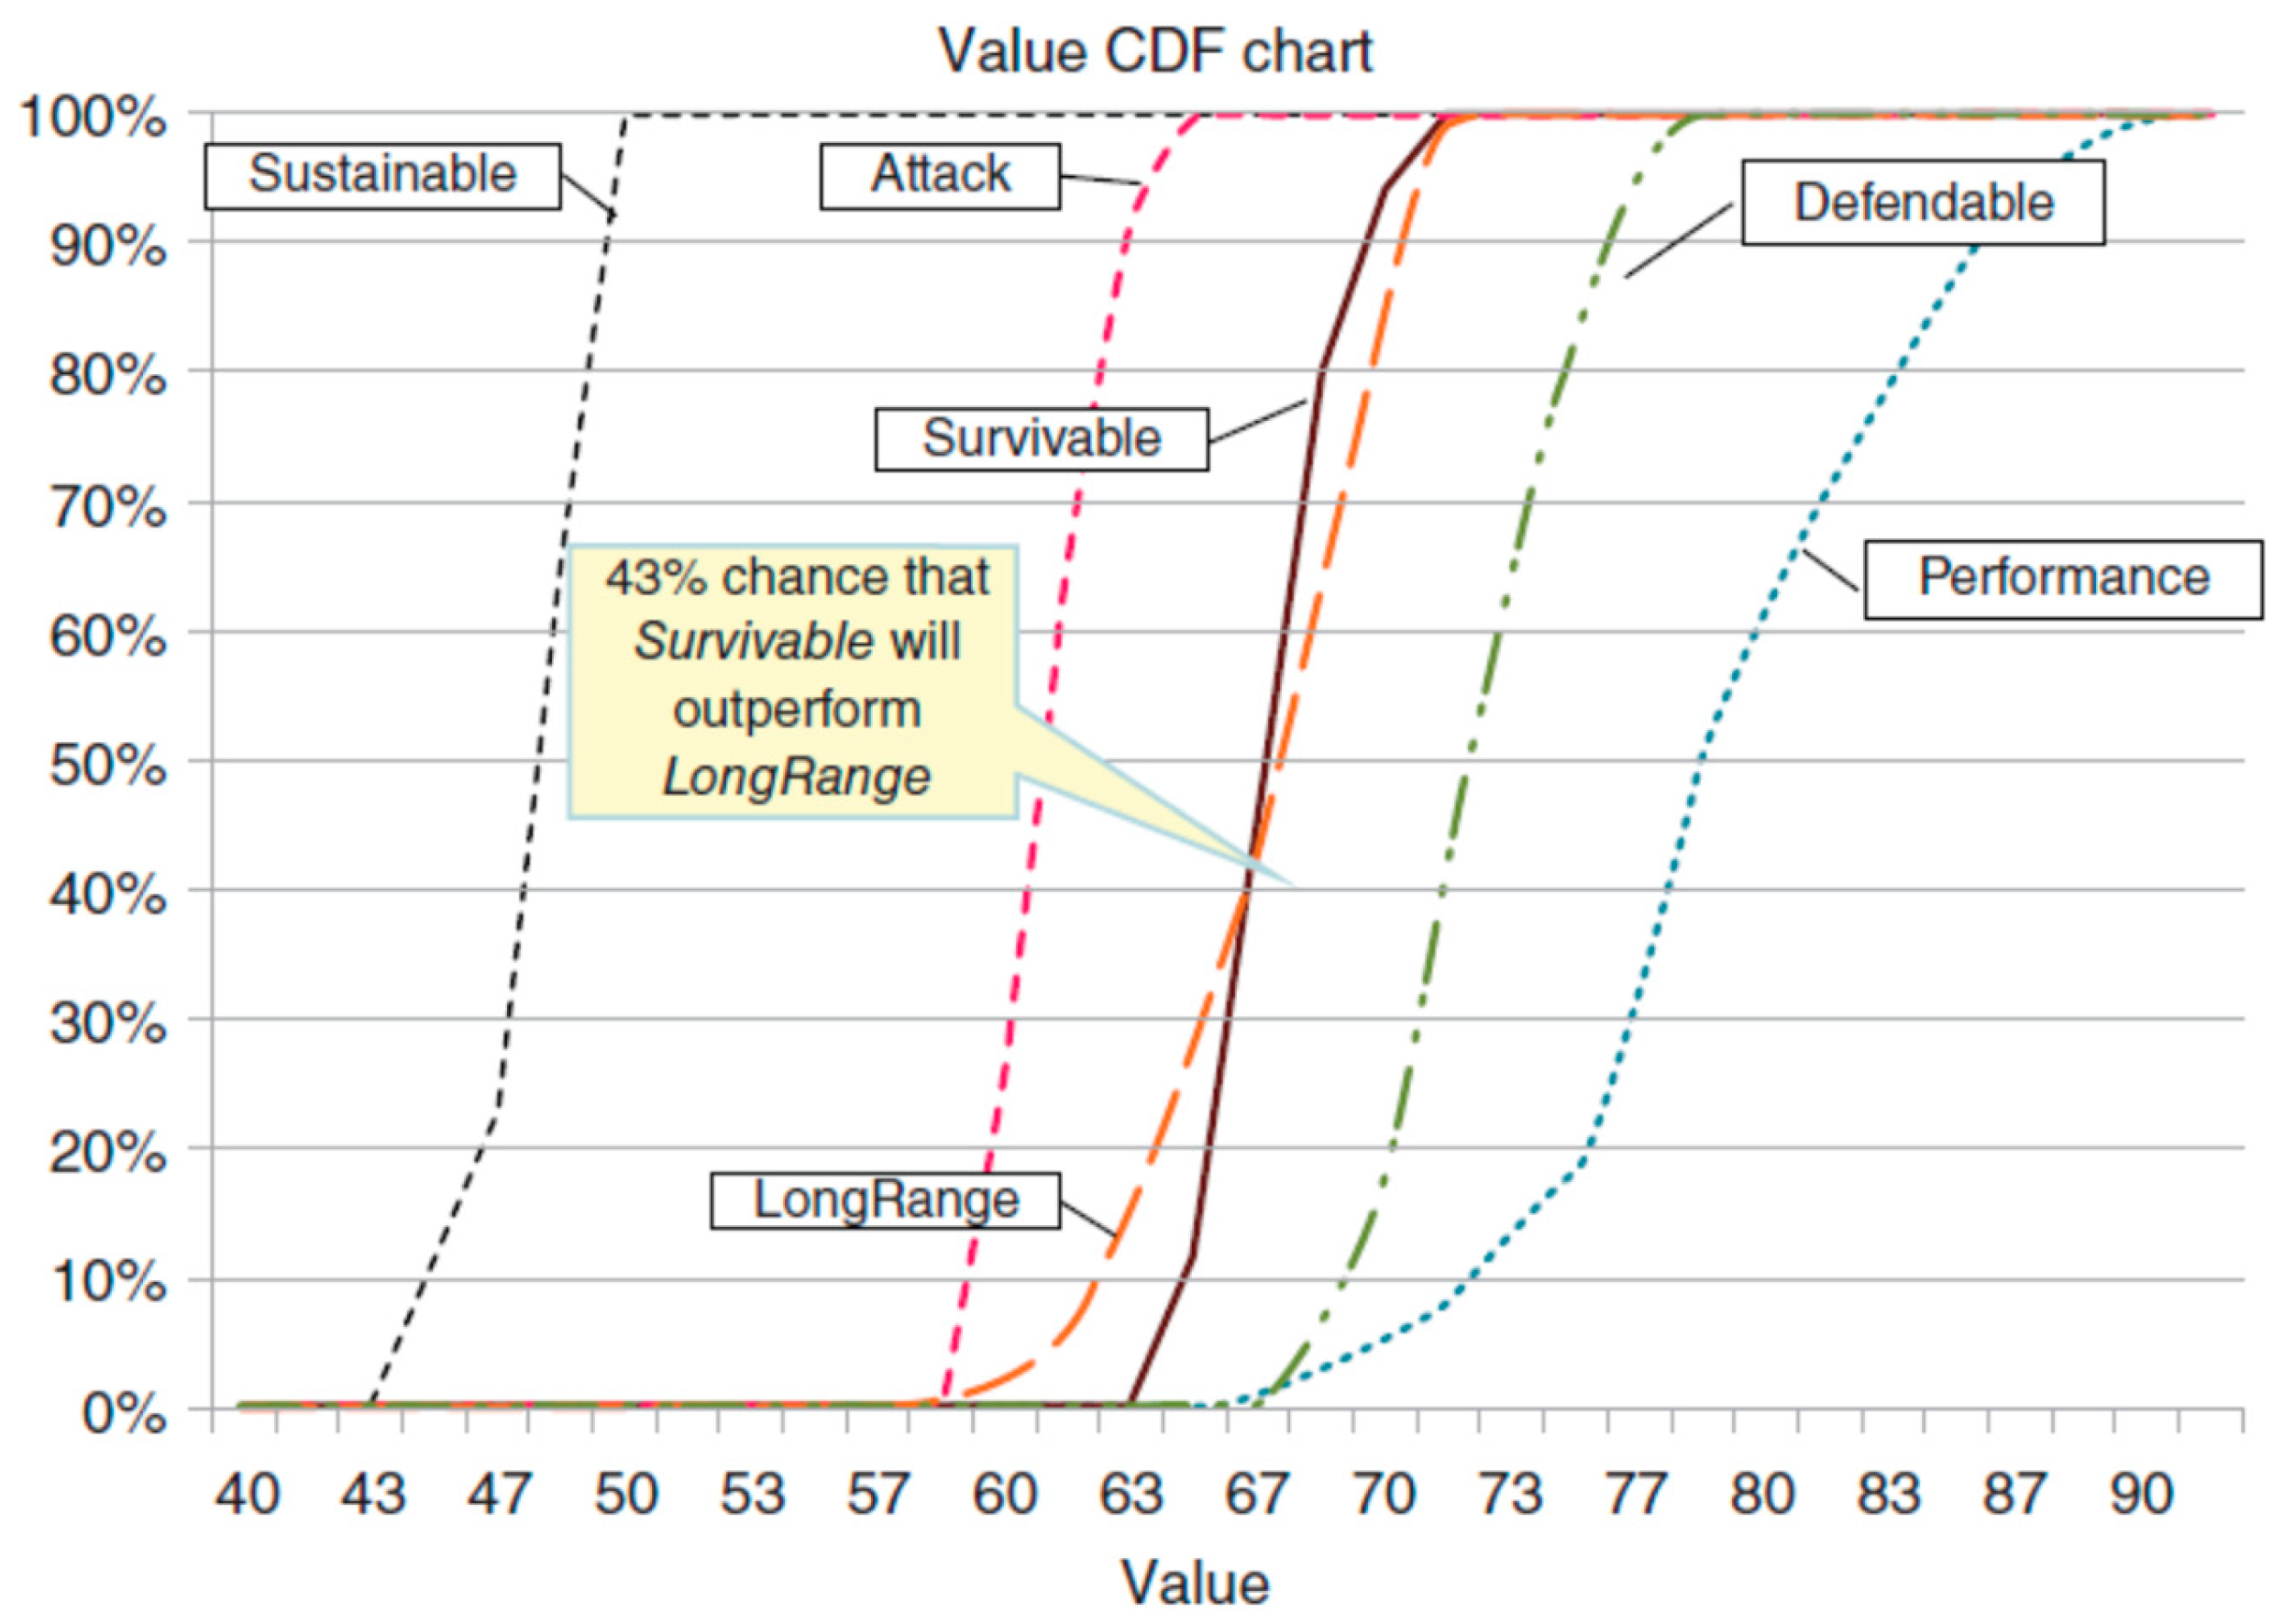
- Uncertainty: Decision-makers and key stakeholders know that system development involves many uncertainties (See Step 4). They will want to understand the major remaining uncertainties that create future risks and opportunities.
- Decision (Selected COA): The recommended COA, the rationale for the decision, and the estimated cost, schedule, and performance of that COA.
- (Decision) Rationale: A clear and concise summary of the non-dominated COAs and the rationale for the recommended COA.
- (Implementation) Plan: The implementation plan usually includes the key program personnel, responsibilities, milestones, major risks, and risk reduction activities.
- (Decision) Record: The decision record should include the decision made and the rationale for that decision. The record may include other DADM data based on organizational and program requirements.
4. Discussion
Author Contributions
Funding
Data Availability Statement
Acknowledgments
Conflicts of Interest
Abbreviations
| Abbreviation | Description |
| CDF | Cumulative Distribution Function |
| COA | Course of Action |
| DADM | Decision Analysis Data Model |
| DAMA | Data Management Association |
| DAWG | INCOSE Decision Analysis Working Group |
| DMBoK | Data Management Body of Knowledge |
| INCOSE | International Council on Systems Engineering |
| ISO | International Organization for Standardization |
| MBSE | Model Based Systems Engineering |
| MOE | Measure of Effectiveness |
| MOP | Measure of Performance |
| SEBoK | Systems Engineering Body of Knowledge |
| SH | Stakeholder |
| SME | Subject Matter Expert |
| SysML | Systems Modeling Language |
Appendix A. DADM Definitions

| Term | Definition |
|---|---|
| Analysis | A detailed examination of anything complex in order to understand its elements, essential features, or their relationships [57]. |
| Approach | The taking of preliminary steps toward a particular purpose [57]. |
| Assumption | A factor in the planning process that is considered to be true, real, or certain, without proof or demonstration [56]. |
| Baseline | An agreed-to description of the attributes of a product at a point in time, which serves as the basis for defining change [1]. |
| Component | A constituent part [57]. |
| Conceptual | The highest level of data organization that outlines entities and relationships without implementation details. [32] |
| Conceptual Data Model | Provides a framework for understanding data requirements, expressed in terms of entities and relationships to identify necessary representations [32]. |
| Conceptual Process | An abstract representation outlining the high-level steps and functions involved in a given process [34]. |
| Configuration Management | A discipline applying technical and administrative direction and surveillance to: identify and document the functional and physical characteristics of a configuration item, control changes to those characteristics, record and report change processing and implementation status, and verify compliance with specified requirements [34]. |
| Constraint | A limiting factor that affects the execution of a project, program, portfolio, or process [56]. |
| Context | An external view of a system must introduce elements that specifically do not belong to the system but do interact with the system. This collection of elements is called the system environment or context [1]. |
| Cost | Cost is a key system attribute. Life Cycle Cost is defined as the total cost of a system over its entire life [1]. |
| Course of Action | A means available to the decision maker by which the objectives may be attained [58]. |
| Current Condition | A state of physical fitness or readiness for use [57]. |
| Data | System element that can be implemented to fulfill system requirements [1]. |
| Data Element | The smallest units of data that have meaning within a context typically representing a single fact or attribute [32]. |
| Data Model | A conceptual representation of the data structures that are required by a database, defining how data is connected, stored, and retrieved [32]. |
| Decision | An irrevocable allocation of resources [59]. |
| Decision Authority | The stakeholder(s) with ultimate decision gate authority to approve and implement a system solution [37]. |
| Decision Frame | A collection of artifacts that answer the question: “What problem (or opportunity) are we addressing?” That is comprised of three components: (1) our purpose in making the decision; (2) the scope, what will be included and excluded; and (3) our perspective including, our point of view, how we want to approach the decision, what conversations will be needed, and with whom [38]. |
| Decision Hierarchy | The specific decisions at hand are divided into three groups: (1) those that have already been made, which are taken as given; (2) those that need to be focused on now, and (3) those that can be made either later or separately [38]. |
| Decision Management | The methods and processes involved in making informed and effective decisions regarding actions and strategies [1]. |
| Descriptive Data | What happened, e.g., historical data [60] |
| Dimension of Performance | A quantitative measure characterizing a physical or functional attribute relating to the execution of a process, function, or activity [1]. |
| Dimensions of Value | The three most common dimensions of value are performance, financial/cost, and schedule [54]. |
| Evaluation | Determination of the value, nature, character, or quality of something or someone [57]. |
| External Impacts | Influences or effects originating outside a specific system or entity, which can be positive, negative, or neutral, and significantly impact the behavior and outcomes of the system [61]. |
| Function | A function is defined by the transformation of input flows to output flows, with defined performance [34]. |
| Influence Diagram | An influence diagram is a network representation for probabilistic and decision analysis models. The nodes correspond to variables which can be constants, uncertain quantities, decisions, or objectives [40]. |
| Information | Knowledge obtained from investigation, study, or instruction [57]. |
| Integration | A process that combines system elements to form complete or partial system configurations in order to create a product specified in the system requirements [34]. |
| Interface | A shared boundary between two systems or system elements, defined by functional characteristics, common physical characteristics, common physical interconnection characteristics, signal characteristics or other characteristics [1]. |
| Issue | A current condition or situation that may have an impact on the project objectives [56]. |
| Iteration | The action or process of repeating [57]. |
| Knowledge | A mixture of experience, values and beliefs, contextual information, intuition, and insight that people use to make sense of new experiences and information [56]. |
| Life Cycle | The stages through which a system progresses from conception through retirement [33]. |
| Life Cycle Cost | Total cost of a system over its entire life [1]. |
| Lifecycle Stage | A period within the lifecycle of an entity that relates to the state of its description or realization [1]. |
| Logical | A framework detailing how data elements will relate and interact, focusing on attributes and data integrity without physical storage considerations [32]. |
| Logical Data Model | An expanded version of the conceptual model detailing entities, attributes, and relationships while remaining agnostic to physical storage [32]. |
| Logical Process | A detailed specification of the sequence and interactions of activities in a process without concern for its implementation [34]. |
| MBSE | Model Based Systems Engineering, an approach that uses models to support systems engineering processes [34]. |
| Measure | A variable to which a value is assigned as the result of the process of experimentally obtaining one or more quantity values that can reasonably be attributed to a quantity [62]. |
| Method | A way, technique, or process of or for doing something [57]. |
| Model | A physical, mathematical, or otherwise logical representation of a system, entity, phenomenon, or process [63]. |
| Model-based | An approach that uses models as the primary means of communication and information exchange in systems development [34]. |
| Modularity | Degree to which a system or computer program is composed of discrete components such that a change to one component has minimal impact on other components [34]. |
| Objective | Something toward which work is to be directed, a strategic position to be attained, a purpose to be achieved, a result to be obtained, a product to be produced, or a service to be performed [56]. |
| Opportunity | potential future benefits to the program’s cost, schedule, and/or performance baseline [47]. |
| Performance | A quantitative measure characterizing a physical or functional attribute relating to the execution of a process, function, activity, or task [1]. |
| Perspective | A mental view or prospect [57]. |
| Physical | Specifies the actual implementation of the data model in a database, including tables, columns, data types, and constraints [32]. |
| Physical Data Model | Translates the logical data model into a physical database schema, specifying how data is stored and accessed, including database tables and field specifications [47]. |
| Plan | A proposed means of accomplishing something [56]. |
| Predictive Data | Data that predicts future probabilities and trends, finds relationships in data [64]. |
| Prescriptive Data | Identifies and evaluates potentially new ways to operate, targets business objectives, balances all constraints [64]. |
| Process | A set of interrelated or interacting activities that transforms inputs into outputs [33]. |
| Process Option | A set of interrelated or interacting activities that transforms inputs into outputs [1]. |
| Processes | Sets of related tasks that lead to a specific outcome, often organized in a sequential manner [33]. |
| Purpose | What the system is for, and why the different stakeholders are willing to participate in the system lifecycle [65]. |
| Rationale | An explanation of controlling principles of opinion, belief, practice, or phenomena [57]. |
| Redundancy | In fault tolerance, the presence of auxiliary components in a system to perform the same or similar functions as other elements for the purpose of preventing or recovering from failures [34]. |
| Requirement | Statement that identifies a product or process operational, functional, or design characteristic or constraint, which is unambiguous, testable or measurable, and necessary for product or process acceptability [1]. |
| Responsibility | Something for which one is responsible [57]. |
| Risk | potential future event or condition that may have a negative effect on achieving program objectives for cost, schedule, and performance. Risks are defined by (1) the probability (greater than 0, less than 1) of an undesired event or condition and (2) the consequences, impact, or severity of the undesired event, were it to occur [47]. |
| Scalability | The ability of something, especially a computer system, to adapt to increased demands [34]. |
| Scenario | A set of actions/functions representing the dynamic of exchanges between the functions allowing the system to achieve a mission or a service [34]. |
| Schedule | A procedural plan that indicates the time and sequence of each operation [57]. |
| Scope | The goals, processes, resources, facilities, activities, outputs and outcomes an organization is responsible for [34]. |
| Simulation | A model that behaves or operates like a given system when provided a set of controlled inputs [66]. |
| Stakeholder | A stakeholder in an organization is any group or individual who can affect or is affected by the achievement of the organization’s objectives [67]. |
| Stakeholder Concern | Matter of interest or importance to a stakeholder [33]. |
| Stakeholder Need | Needs are well-formed textual statements of expectations for an entity stated in a structured, natural language from the perspective of what the stakeholders need the entity to do, in a specific operational environment, communicated at a level of abstraction appropriate to the level at which the entity exists [68]. |
| Stakeholder Values | Values of a stakeholder. See values and stakeholder. |
| Story | An account of incidents or events [57]. |
| Strategy | An adaptation or complex of adaptations (as of behavior, metabolism, or structure) that serves or appears to serve an important function in achieving evolutionary success [57]. |
| Subsystem | A system that is part of a larger system [57]. |
| SysML | Systems Modeling Language, a visual modeling language used to specify, analyze, and design systems [34]. |
| System | A system is an arrangement of parts or elements that together exhibit behavior or meaning that the individual constituents do not [34]. |
| System Architecture | The fundamental concepts or properties of an entity in its environment and governing principles of the realization and evolution of the entity and its related life cycle processes [1]. |
| System Element | A member of a set of elements that constitutes a system. A system element is a discrete part of a system that can be implemented to fulfill specified requirements. A system element can be hardware, software, data, humans, processes (e.g., processes for providing service to users), procedures (e.g., operator instructions), facilities, materials, and naturally occurring entities (e.g., water, organisms, minerals), or any combination [34]. |
| System Environment | The surroundings (natural or man-made) in which the system-of-interest is utilized and supported; or in which the system is being developed, produced or retired [1]. |
| Technology Option | Technology is “a manner of accomplishing a task especially using technical processes, methods, or knowledge. Option is “an alternative course of action” [57]. |
| Tools | (1) software product that provides support for software and system life cycle processes [69] (2) something tangible, such as a template or software program, used in performing an activity to produce a product or result [56]. |
| Trade-off | A situation where one must balance benefits against costs or risks in decision-making processes [57]. |
| Trade-off | Decision-making actions that select from various alternatives based on net benefit to stakeholders., e.g., to make a trade-off [1]. |
| Tradespace | A tradespace is a multidimensional space that defines the context for the decision, defines bounds to the regional of interest, and enables Pareto optimal solutions for complex, multiple stakeholder decisions [55]. |
| Uncertainty | The state, even partial, of deficiency of information related to understanding or knowledge of an event, its consequence, or likelihood [33]. |
| Use Case | Description of the behavioral requirements of a system and its interaction with a user [34]. |
| Validation | Confirmation, through the provision of objective evidence, that the requirements for a specific intended use or application have been fulfilled [1]. |
| Value | Regard that something is held to deserve; the importance, worth, or usefulness of something to somebody [70]. |
| Value Function | A function that converts a value measure to a normalized value [54]. |
| Value Hierarchy | The functional value hierarchy is a combination of the functional hierarchy from systems engineering and the objectives hierarchy from decision analysis [43]. |
| Value Measure | A metric that measures the attainment of an objective that we care about [54]. |
| Value Weight | The swing weight assigned to a value measure in the additive value model [54]. |
| Verification | Confirmation, through the provision of objective evidence, that specified requirements have been fulfilled [1]. |
| Vision Statement | A vision statement is an effective way to make sure that there is agreement on the purpose of the decision among the decision makers and key stakeholders. The vision statement answers three questions: What are we going to do? Why are we doing this? How will we know that we have succeeded? [39] |
Appendix B. Block Definition Diagrams for the Logical Process Model


References
- Walden, D.D.; Shortell, T.M.; Roedler, G.J.; Delicado, B.A.; Mornas, O.; Yew-Seng, Y.; Endler, D. (Eds.) Systems Engineering Handbook: A Guide for System Life Cycle Processes and Activities, 5th ed.; INCOSE Systems Engineering Handbook; Wiley: Hoboken, NJ, USA, 2023; ISBN 978-1-119-81430-6. [Google Scholar]
- Systems Engineering Vision 2025; International Council on Systems Engineering: San Diego, CA, USA, 2021.
- MIL-STD-499B; Systems Engineering. Department of Defense: Washington, DC, USA, 1994.
- 6.8 Decision Analysis. In NASA Systems Engineering Handbook; NASA: Washington, DC, USA, 2019.
- Bass, L.; Clements, P.C.; Kazman, R. Software Architecture in Practice, 2nd ed.; SEI series in software engineering; Addison-Wesley: Boston, MA, USA, 2003; ISBN 9786612433177. [Google Scholar]
- Integrated Computer Aided Manufacturing (ICAM) Architecture; Materials Laboratory (AFWAL/MLTC), AF Wright Aeronautical Laboratories (AFSC): Wright-Patterson AFB, OH, USA, 1981.
- FIPS PUB 183; Integration Definition for Function Modeling (IDEFO). National Institute of Standards and Technology: Washington, DC, USA, 1993.
- FIPS PUB 184; Integration Definition for Function Modeling (IDEF1). National Institute of Standards and Technology: Washington, DC, USA, 1993.
- Williams, T.J. The Purdue Enterprise Reference Architecture. Comput. Ind. 1994, 24, 141–158. [Google Scholar] [CrossRef]
- ANSI/ISA-95.00.01-2025; Enterprise-Control System Integration—Part 1: Models and Terminology. International Society of Automation: Durham, NC, USA, 2025.
- ANSI/ISA-95.00.02-2018; Enterprise-Control System Integration—Part 2: Objects and Attributes for Enterprise-Control System Integration. International Society of Automation: Durham, NC, USA, 2018.
- ANSI/ISA-95.00.03-2013; Enterprise-Control System Integration—Part 3: Activity Models of Manufacturing Operations Management. International Society of Automation: Durham, NC, USA, 2013.
- ANSI/ISA-95.00.04-2018; Enterprise-Control System Integration—Part 4: Objects and Attributes for Manufacturing Operations Management Integration. International Society of Automation: Durham, NC, USA, 2018.
- ANSI/ISA-95.00.05-2018; Enterprise-Control System Integration—Part 5: Business-to-Manufacturing Transactions. International Society of Automation: Durham, NC, USA, 2018.
- ANSI/ISA-95.00.06-2014; Enterprise-Control System Integration—Part 6: Messaging Service Model. International Society of Automation: Durham, NC, USA, 2014.
- ANSI/ISA-95.00.07-2017; Enterprise-Control System Integration—Part 7: Alias Service Model. International Society of Automation: Durham, NC, USA, 2017.
- ANSI/ISA-95.00.08-2020; Enterprise-Control System Integration—Part 8: Information Exchange Profiles. International Society of Automation: Durham, NC, USA, 2020.
- Long, J.E. Relationships Between Common Graphical Representations Used in System Engineering; Intonational Council on Systems Engineering: San Diego, CA, USA, 1995; Volume 5, pp. 973–979. [Google Scholar]
- Unified Modeling Language Version 2.5.1. Available online: https://www.omg.org/spec/UML/2.5.1 (accessed on 1 July 2025).
- Business Process Model and Notation (BPMN) Version 2.0.2. Available online: https://www.omg.org/spec/BPMN (accessed on 2 May 2025).
- Fitch, J.A. A Decision Network Framework for Vehicle Systems Engineering. SAE Tech. Pap. 2005. [Google Scholar] [CrossRef]
- Mendonza, P.; Fitch, J. Integrating System Models around Decisions. INCOSE Int. Symp. 2013, 23, 213–227. [Google Scholar] [CrossRef]
- OMG Systems Modeling Language (OMG SysML) Version 1.7. Available online: https://www.omg.org/spec/SysML/1.7/ (accessed on 14 April 2025).
- Decision Model and Notation Version 1.5. Available online: https://www.omg.org/spec/DMN/1.5 (accessed on 14 April 2025).
- Schindel, B.; Dove, R. Introduction to the Agile Systems Engineering Life Cycle MBSE Pattern. INCOSE Int. Symp. 2016, 26, 725–742. [Google Scholar] [CrossRef]
- Buede, D.M.; Miller, W.D. The Engineering Design of Systems: Models and Methods, 3rd ed.; Wiley: Hoboken, NJ, USA, 2016; ISBN 978-1-119-02790-4. [Google Scholar]
- INCOSE International Symposium: Volume 34, Issue 1. Available online: https://incose.onlinelibrary.wiley.com/toc/23345837/2024/34/1 (accessed on 16 April 2025).
- Case Management Model and Notation (CMMN) Version 1.1. Available online: https://www.omg.org/spec/CMMN/1.1 (accessed on 16 April 2025).
- Davis, P. Appendix C: Composability. In Defense Modeling, Simulation, and Analysis: Meeting the Challenge; The National Academies Press: Washington, DC, USA, 2006; pp. 74–80. ISBN 9786610604517. [Google Scholar]
- Specking, E.; Parnell, G.S.; Pohl, E.; Buchanan, R. Article Early Design Space Exploration with Model-Based System Engineering and Set-Based Design. Systems 2018, 6, 45. [Google Scholar] [CrossRef]
- Fang, Z.; Zhao, X.; Li, F. Architecture Design Space Generation via Decision Pzattern-Guided Department of Defense Architecture Framework Modeling. Systems 2024, 12, 336. [Google Scholar] [CrossRef]
- Data Management Association. Data Management Body of Knowledge (DMBOK), 2nd ed.; Technics Publications: Basking Ridge, NJ, USA, 2017; ISBN 978-1-63462-247-9. [Google Scholar]
- ISO/IEC/IEEE International Standard 15288-2023; Systems and Software Engineering—System Life Cycle Processes. IEEE: New York, NY, USA, 2023; ISBN 1-5044-9665-5.
- SEBoK Editorial Board. The Guide to the Systems Engineering Body of Knowledge (SEBoK); v 2.11; The Trustees of the Stevens Institute of Technology: Hoboken, NJ, USA, 2024. [Google Scholar]
- Pinon Fischer, O.J.; Matlik, J.F.; Schindel, W.D.; French, M.O.; Kabir, M.H.; Ganguli, J.S.; Hardwick, M.; Arnold, S.M.; Byar, A.D.; Lewe, J.-H.; et al. Digital Twin: Reference Model, Realizations, and Recommendations. Insight 2022, 25, 50–55. [Google Scholar] [CrossRef]
- SYSTEM ENGINEERING LABORATORY. 2025. Available online: https://www.incose.org/learn/se-laboratory (accessed on 3 June 2025).
- Driscoll, P.J.; Parnell, G.S.; Henderson, D.L. Decision Making in Systems Engineering and Management, 3rd ed.; John Wiley & Sons: Hoboken, NJ, USA, 2022; ISBN 978-1-119-90140-2. [Google Scholar]
- Spetzler, C.S.; Winter, H.; Meyer, J. Decision Quality: Value Creation from Better Business Decisions; Wiley: Hoboken, NJ, USA, 2016; ISBN 1-119-14469-8. [Google Scholar]
- Parnell, G.S.; Tani, S.N. Frame the Decision Opportunity. In Handbook of Decision Analysis; Parnell, G.S., Bresnick, T.A., Tani, S.N., Johnson, E.R., Eds.; John Wiley & Sons, Inc.: Hoboken, NJ, USA, 2025. [Google Scholar]
- Shachter, R.D. Probabilistic Inference and Influence Diagrams. Oper. Res. 1988, 36, 589–604. [Google Scholar] [CrossRef]
- Instructor Companion Site. Available online: https://bcs.wiley.com/he-bcs/Books?action=resource&bcsId=10076&itemId=111902790X&resourceId=40177 (accessed on 28 March 2025).
- Keeney, R.L. Value-Focused Thinking: A Path to Creative Decisionmaking; Harvard University Press: Cambridge, MA, USA, 1992; ISBN 978-0-674-03940-7. [Google Scholar]
- Parnell, G.S.; Bresnick, T.A.; Johnson, E.R. Craft the Decision Objectives and Value Measures. In Handbook of Decision Analysis; Parnell, G.S., Bresnick, T.A., Tani, S.N., Johnson, E.R., Eds.; John Wiley & Sons, Inc.: Hoboken, NJ, USA, 2013; pp. 127–148. [Google Scholar]
- Kenley, C.R.; Whitcomb, C.; Parnell, G.S. Developing and Evaluating Alternatives. In Trade-Off Analytics; Parnell, G.S., Ed.; Wiley: New York, NY, USA, 2017; pp. 257–295. [Google Scholar]
- Kirkwood, C.W. Strategic Decision Analysis: Multiobjective Decision Analysis with Spreadsheets; Duxbury Press: Belmont, CA, USA, 1997. [Google Scholar]
- Bresnick, T.A.; Parnell, G.S. Decision Analysis Soft Skills. In Handbook of Decision Analysis; Parnell, G.S., Bresnick, T.A., Tani, S.N., Johnson, E.R., Eds.; John Wiley & Sons, Inc.: Hoboken, NJ, USA, 2025. [Google Scholar]
- Office of the Executive Director for Systems Engineering and Architecture. Office of the Under Secretary of Defense for research and Engineering. Department of Defense Risk, Issue, and Opportunity (RIO) Management Guide for Defense Acquisition Programs. Washington, DC, USA. 2023. Available online: https://www.dau.edu/sites/default/files/2023-10/DoD%20RIO%20Management%20Guide%2009-2023.pdf (accessed on 26 March 2025).
- ISO/IEC/IEEE 16085:2021; Systems and Software Engineering—Life Cycle Processes—Risk Management. ISO: Geneva, Switzerland, 2021.
- Parnell, G.; Shallcross, N.; Pohl, E.; Phillips, M. Role of Decision Analysis in MBSE. In Handbook of Model-Based Systems Engineering; Madni, A., Augustine, N., Seivers, M., Eds.; Springer Nature: Cham, Switzerland, 2023; pp. 119–150. [Google Scholar]
- Cilli, M.; Parnell, G.S. Understanding Decision Management. In Trade-Off Analytics: Creating and Exploring the System Tradespace; Parnell, G.S., Ed.; John Wiley & Sons Inc.: Hoboken, NJ, USA, 2017; pp. 155–231. ISBN 978-1-119-23755-6. [Google Scholar]
- Brown, G.G. Modeling. In INFORMS Analytics Body of Knowledge; Cochran, J.J., Ed.; John Wiley and Sons, Inc.: Hoboken, NJ, USA, 2018; pp. 155–230. ISBN 978-1-119-50591-4. [Google Scholar]
- Kempf, K.G. Getting Started with Analytics. In INFORMS Analytics Body of Knowledge; Cochran, J.J., Ed.; John Wiley and Sons, Inc.: Hoboken, NJ, USA, 2018; pp. 31–48. ISBN 978-1-119-50591-4. [Google Scholar]
- MacCallum, A.D.; Parnell, G.S.; Savage, S. An Integrated Model for Trade-Off Analysis. In Trade-Off Analytics: Creating and Exploring the System Tradespace; Parnell, G.S., Ed.; John Wiley & Sons Inc.: Hoboken, NJ, USA, 2017; pp. 297–336. ISBN 978-1-119-23755-6. [Google Scholar]
- Parnell, G.S.; Bresnick, T.A.; Tani, S.N.; Johnson, E.R. (Eds.) Handbook of Decision Analysis, 1st ed.; John Wiley & Sons, Inc.: Hoboken, NJ, USA, 2025. [Google Scholar]
- Parnell, G.S. Trade-Off Analytics: Creating and Exploring the System Tradespace; John Wiley & Sons Inc.: Hoboken, NJ, USA, 2017; ISBN 978-1-119-23755-6. [Google Scholar]
- Project Management Institute. A Guide to the Project Management Body of Knowledge (PMBOK® Guide), 7th ed.; Project Management Institute: Newtown Square, PA, USA, 2021; ISBN 978-1-62825-664-2. [Google Scholar]
- Merriam-Webster Dictionary. Available online: https://www.merriam-webster.com/ (accessed on 26 March 2025).
- Heylighen, F.; Joslyn, C.; Turchin, V. Course of Action. Available online: http://pespmc1.vub.ac.be/ASC/COURSE_ACTIO.html (accessed on 26 March 2025).
- Howard, R.A. The Foundations of Decision Analysis. IEEE Trans. Syst. Sci. Cybern. 1968, 4, 211–219. [Google Scholar] [CrossRef]
- Keenan, P.T.; Owen, J.H.; Schumacher, K. Introduction to Analytics. In INFORMS Analytics Body of Knowledge; Cochran, J.J., Ed.; John Wiley and Sons, Inc.: Hoboken, NJ, USA, 2018; pp. 1–30. ISBN 978-1-119-50591-4. [Google Scholar]
- External Impacts. Available online: https://www.google.com/search?q=external+impacts (accessed on 26 March 2025).
- ISO/IEC Guide 99:2007; International Vocabulary of Metrology—Basic and General Concepts and Associated Terms (VIM). ISO: Geneva, Switzerland, 2007.
- DoD 5000.59-M; DoD Modeling and Simulation (M&S) Glossary. US Department of Defense: Washington, DC, USA, 1998.
- Cochran, J.J. (Ed.) INFORMS Analytics Body of Knowledge; Wiley series in operations research and management science; Wiley: Hoboken, NJ, USA, 2019; ISBN 1-119-50592-5. [Google Scholar]
- Blockley, D.I.; Godfrey, P. Doing It Differently: Systems for Rethinking Construction; Thomas Telford: London, UK, 2000; ISBN 0-7277-2748-6. [Google Scholar]
- SO/IEC/IEEE 24765:2017; Systems and Software Engineering—Vocabulary. ISO: Geneva, Switzerland, 2017.
- Freeman, R.E. Strategic Management: A Stakeholder Approach; Pitman series in business and public policy; Pitman: Boston, MA, USA, 1984; ISBN 0-273-01913-9. [Google Scholar]
- Ryan, M.; Wheatcraft, L. Guide to Writing Requirements, 4th ed.; International Council on Systems Engineering: San Diego, CA, USA, 2023; ISBN 978-1-93707-05-4. [Google Scholar]
- ISO/IEC 15474-1:2002; Information Technology—CDIF Framework. ISO: Geneva, Switzerland, 2002.
- Martin, J.N. Overview of an Emerging Standard on Architecture Evaluation—ISO/IEC 42030. INCOSE Int. Symp. 2017, 27, 1139–1156. [Google Scholar] [CrossRef]


| Year Introduced | Pattern, Model, or Architecture |
|---|---|
| 1981 | Integrated Computer-Aided Manufacturing (ICAM) Architecture [6] |
| 1993 | Integration Definition for Functional Modeling (IDEF0) [7] Integration Definition for Information Modeling (IDEF1) [8] |
| 1994 | Purdue Enterprise Reference Architecture [9] |
| 1995 | ISA-95: Enterprise-Control System Integration [10,11,12,13,14,15,16,17] |
| 1995 | Relationships Between Common Graphical Representations Used in System Engineering [18] |
| 1997 | Unified Modeling Language (UML) [19] |
| 2004 | Business Process Model and Notation [20] |
| 2005 | Decision Network Framework [21,22] |
| 2007 | Systems Modeling Language (SysML) [23] |
| 2015 | Decision Model and Notation [24] |
| 2016 | Agile Systems Engineering Life Cycle Model (ASELCM) MBSE Pattern [25] |
| Step | Purpose | Common Methods |
|---|---|---|
| 1.0 Frame Decision | Identify the purpose and scope of the decision in the context of the system life cycle. | Problem Definition, Opportunity Definition, Influence Diagram, Stakeholder Analysis, Use Cases, Scenarios, Systems Thinking |
| 2.0 Structure Objectives and Measures | Identify the decision objectives and the measures that will be used to assess achievement of the objectives before we develop the alternatives. | Value Hierarchy, Objectives Hierarchy, Value Tree, Requirements Analysis |
| 3.0 Generate Creative Alternatives | Develop creative alternatives that span the decision space of feasible alternatives including innovative technologies and new production, service, and delivery processes. | Zwicky’s Morphological Box, Structured Creativity Techniques, Optimization, Set-Based Design, Pugh Method, TRIZ |
| 4.0 Identify Areas of Uncertainty | Identify uncertainties to understand potential risks and opportunities and allow decision-makers to evaluate choices more accurately. | Risk and Opportunity Analysis, Influence Diagram, Scenario Analysis |
| 5.0 Plan Evaluation Methods | Plan evaluation methods to identify the data, the models, simulations, process flow, resources and time required to perform an alternative assessments that biases and enhances the reliability of the analysis. | Assessment Flow Diagram, Systems Engineering Management Plan |
| 6.0 Evaluate Alternatives | Implement the alternative evaluation plan to assess the performance, value, cost, and schedule of the alternatives. | Deterministic Analysis, Probabilistic Analysis, Portfolio Analysis, Benefit Cost Analysis, Modeling, Simulation, and Analysis, Optimization, Systems Analysis, Risk Analysis, Mission Analysis, Life Cycle Cost Analysis, Scheduling |
| 7.0 Improve Alternatives | Use the evaluation information to improve the alternatives by increasing value and reducing risk. | Value-Focused Thinking, Risk Analysis, Risk Management, Systems Thinking, Systems Analysis, Optimization |
| 8.0 Assess Trade-offs | Assess the value trade-offs including performance, value, cost, and schedule trade-offs. | Tradespace, Trade-off Analysis, Systems Analysis, Pareto Analysis, Cost as an Independent Variable |
| 9.0 Communicate Recommendations and Implementation Plan | Communicate the trade-offs, recommendation(s), and implementation plan to the system decision maker (s) for their decision. | System Decision, Solution Implementation, Implementation Schedule |
| 10. Make the Decision | Make the decision and document the rationale. | Decision Record |
| Step | Tailoring and Reuse Guidance | Impact of Not Doing |
|---|---|---|
| 1.0 Frame Decision | The decision(s) should be clearly identified in each life cycle stage or decision point. It is usually helpful to begin with the decisions made in the previous life cycle stage and identify revised and additional decisions. | The system may be developed for the wrong problem, not take advantage important opportunities, or not address stakeholder concerns. |
| 2.0 Structure Objectives and Measures | The value hierarchy should be updated based on the current information in each stage. New objectives and measures may be needed based on latest information about the problem and the system. | The alternative design and evaluation will not focus on the decisionmaker and stakeholder objectives. This may lead to rework and schedule delays. |
| 3.0 Generate Creative Alternatives | It is important to generate creative alternatives that span the decision space. The alternatives may include previous alternatives and new alternatives to increase value and/or reduce risk. | The decision can only be as good as the best alternative. Poor alternatives lead to poor decisions. |
| 4.0 Identify Areas of Uncertainty | The sources of uncertainty will vary in each life cycle stage. Some uncertainties will be resolved, and new risks and opportunities will be identified. | Systems are designed for years and sometimes decades. There are many uncertainties. If they are not considered, rework will be required. |
| 5.0 Plan Evaluation Methods | As better information becomes available on the system alternatives in the life cycle, higher fidelity evaluation methods can be used. | The lack of an alternative evaluation plan to obtain appropriate fidelity evaluation methods for the life cycle stage can lead to rework and schedule delays. |
| 6.0 Evaluate Alternatives | The alternative evaluations should be updated based on new alternatives, new uncertainties, improved evaluation methods, and updated data. | Poor evaluation can lead to rework, schedule delays, or system cancelation. |
| 7.0 Improve Alternatives | It is important to improve the alternatives using the information from the alternative evaluations. Value gaps can be identified and filled. Risk can be mitigated, and new opportunities can be addressed. | Not improving the alternatives before the decision can result in less value, more risk, and rework. |
| 8.0 Assess Trade-offs | Once the alternatives have been improved, the next step is to update the value, performance, cost, and schedule trade-offs. The impacts on other systems and stakeholders should also be considered. | Unless there is one alternative that dominates all the others, there will be trade-offs between the alternatives that decision makers may not consider. |
| 9.0 Communicate Recommendations and Implementation | The systems engineers (system analysts) should communicate the trade-offs, recommendation(s), and implementation plan to the system decision maker (s) for their decision using the organization’s recommended decision process. | Without clear and concise communication of the recommendations, the best decision may not be made or be actionable. |
| 10.0 Make the Decision | Record the decision and rationale using organizational procedures. | Without records, we lose traceability of past decisions and rationale. |
| Type | Direct | Proxy |
|---|---|---|
| Natural | 1 | 3 |
| Constructed | 2 | 4 |
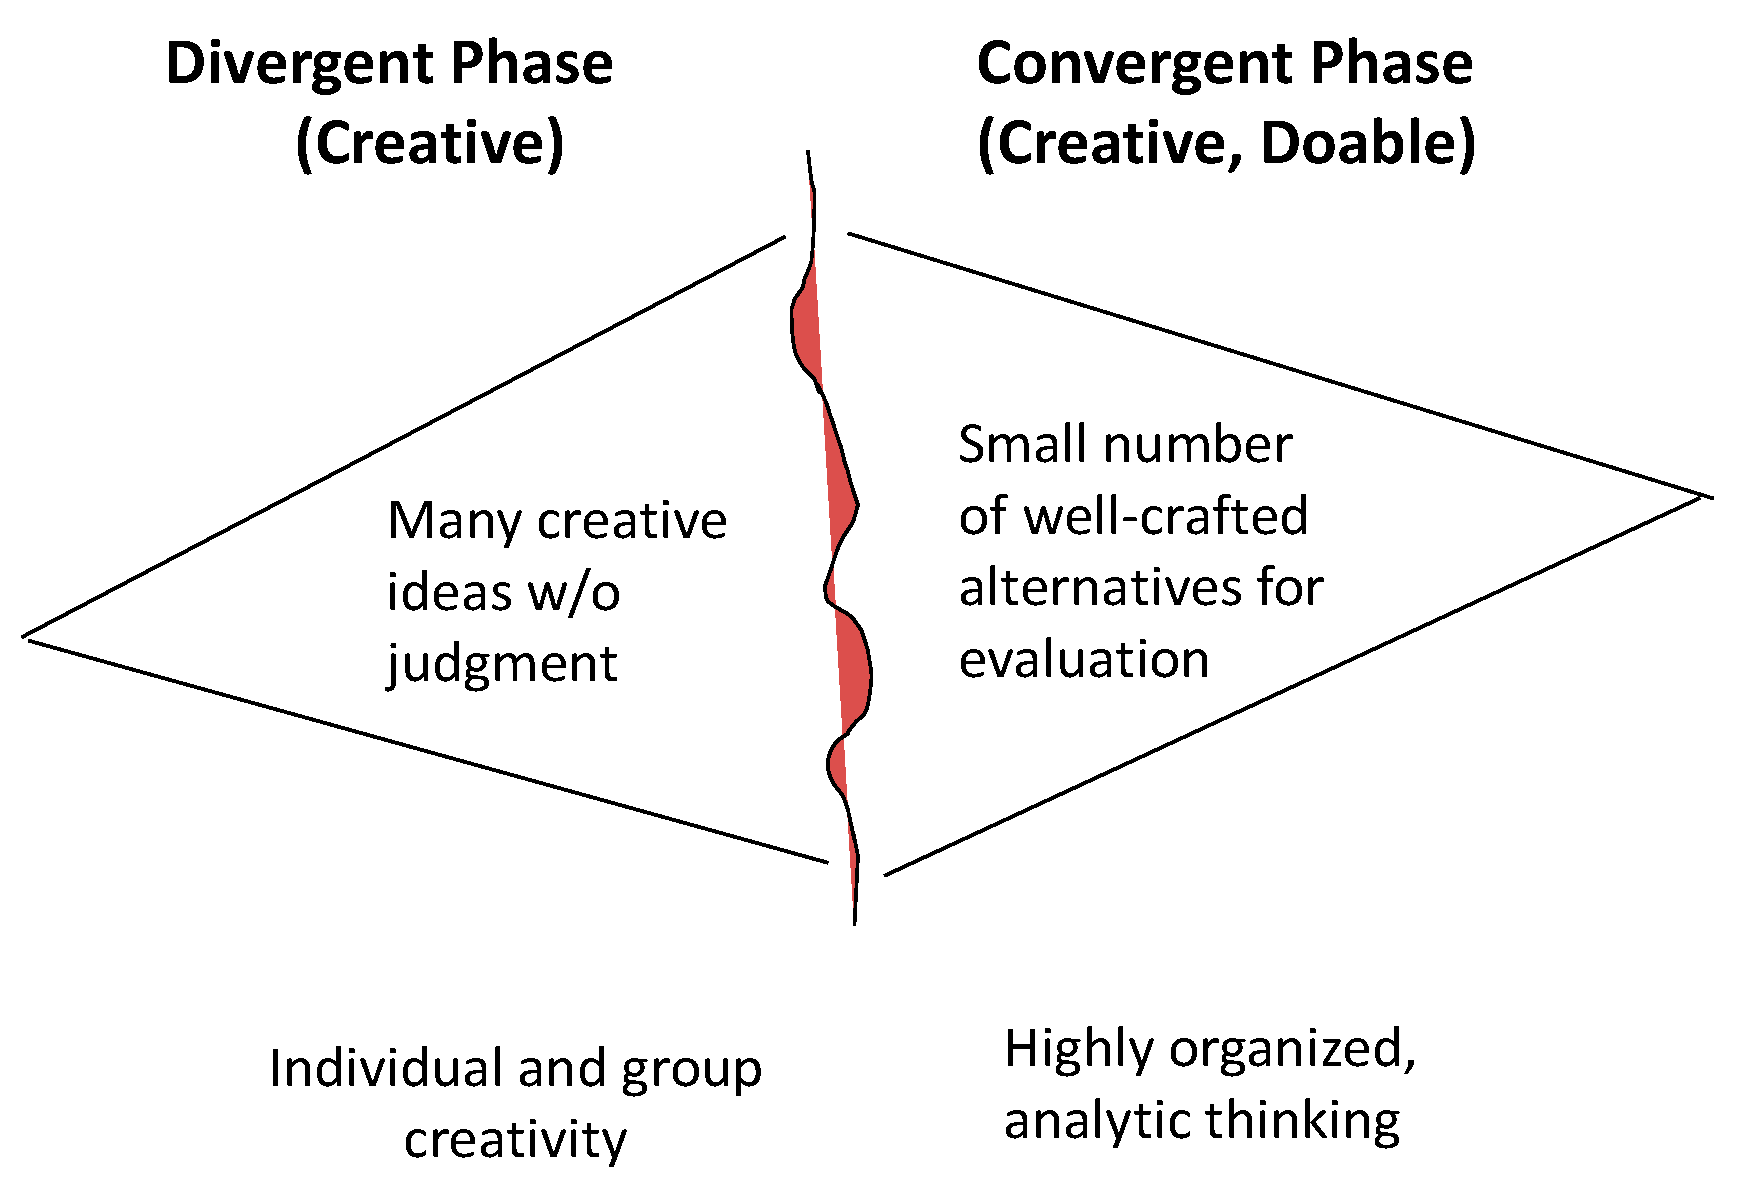
| Technique [44] | Recommended Life Cycle Stage | Divergent Phase | Convergent Phase |
|---|---|---|---|
| Optimization methods | All stages | Use constraints to define the decision space | Use optimization to identify the best alternatives. |
| Set-Based Design [45] | Concept and design | Use sets to define the decision space | Eliminate the poorer performing sets. |
| Structured Creativity Methods | All stages | Develop many ideas | Convergence after creativity. |
| Zwicky Morphological Box | All stages | Develop many ideas (can be function-based) | Do not consider unreasonable or physically unachievable alternatives. |
| Pugh Method | Concept and design stages | Nominal group technique for individual reflection Improves concepts in group setting by attacking the negatives and improving the positives, which can lead to hybrid concepts | Allows for eliminating worst concepts, especially after they have been studied for positive features that might be incorporated into other concepts. |
| TRIZ | Concept and design stages | Defines the problem by a set of functional requirements. Models the problem by defining a set of resources that play a role in achieving the functional requirements or detract from achieving the functional requirements | Focuses search for alternative to a set of solutions based on historical patent data. Identifies which solutions among a set of 76 standard solutions, or high-level concepts, can be applied to meet each requirement. Uses 40 inventive and 4 separation principles to further reduce the number of alternatives. |
| Sources of Uncertainty | Illustrative Issues | 4.1 SH | 4.2 Performance | 4.3 Schedule | 4.4 Cost | 4.5 Other | 4.6 COAs |
|---|---|---|---|---|---|---|---|
| Business/ Mission | Changes in markets/threats, vision, and strategies | X | X | X | X | X | |
| Context and Environment | Economic disruptions (e.g., recession), disruptive technologies, adverse publicity, changes to law or policies | X | X | X | X | X | |
| Management | Organization culture, investment management experience and expertise, mature baselining (technical, cost, schedule) and cost estimating processes. | X | X | X | X | X | |
| Requirements | Unclear or changing user needs | X | X | X | X | X | |
| Technological | New technologies and integration with systems and infrastructure | X | X | X | X | ||
| Project Management | Resource availability, changing need dates, concurrent development, design processes, manufacturing processes, production capabilities, and supply chain issues | X | X | X | X | X | |
| Human Factors | User acceptance, resistance to change | X | X | X | X | X | X |
| Operations and Logistics | Affordability, system sustainability, reliability, security, maintenance, supply chain | X | X | X | X |
| Buzzard I | Cardinal I | Robin I | ||
 |  |  | ||
| Subsystem | Component | Design Choice | Design Choice | Design Choice |
| Air Vehicle | ||||
| Propulsion System | Electric 300 W | Electric 300 W | Piston 2.5 HP | |
| Energy Source | Li-Ion Battery | Li-S Battery | JP-8 | |
| Prop Size and Location | 18″ Rear | 20″ Rear | 26″ Front | |
| Wingspan | 5′ | 6′ | 8′ | |
| Wing Configuration | Canard | Conventional | Conventional | |
| Fin Configuration | Inverted V | Twin Boom | H Tail | |
| Actuators | Electromagnetic | Electromagnetic | Hydraulic | |
| Airframe Material | Graphite Epoxy | Graphite Epoxy | Fiberglass Epoxy | |
| Autopilot | Semi-Auto | Remotely Piloted | Remotely Piloted | |
| Launch Mechanism | Hand | Hand | Tensioned Line | |
| Landing Mechanism | Belly | Belly | Net | |
| ISR Collecting Payload | ||||
| Sensor Actuation | Fixed | Fixed | Pan-tilt | |
| EO Imager | 4 MP | 4 MP | 8 MP | |
| IR Imager | 320 × 240 MWIR | 320 × 240 MWIR | 1280 × 720 MWIR and LWIR cooled | |
| Communication Links | ||||
| Command and Control Link | Fixed VHF | Fixed VHF | Fixed VHF | |
| Payload Data Link | Fixed VHF | Fixed VHF | Elect. Steered Phased Array Ka | |
| Ground Elements | ||||
| Antenna | Dipole | Dipole | Dipole | |
| Computer | Laptop | Smartphone | Laptop | |
| User Input Device | Keyboard | Joystick | Keyboard | |
| Power | Battery + Spare | Battery + Spare | Battery + Gen. | |
| Data Element | Rationale |
|---|---|
| Knowledge | The foundation for the use of DADM on the system of interest is to inform a major decision in the life cycle stage is the knowledge of SMEs and SHs. |
| Information | One of the major purposes of a development program is to identify and obtain the information required to make a sound investment decision. |
| Decision Frame | You should begin with a review and update of the decision frame. Decision-makers are busy. It is important to identify the major decisions that have been made, the purpose of the current decision(s), and the decision(s) to be made and major future decisions. The need for the system should be reverified. |
| Courses of Action (COAs) | The decision-makers and key stakeholders need to understand the COAs that were identified and evaluated. It is common that decision-makers or key stakeholders have preferences for one or more COAs. They may distrust the systems analysis or not decide if their preferred COAs are not included. |
| Trade-offs | The analysis in Step 8.0 provides the basis for defining the tradespace and identifying the trade-offs. The decision-makers and key stakeholders are usually interested in knowing the trade-offs between the non-dominated COAs. Decision-makers and key stakeholders typically want to know why their preferred COAs are not included in the analysis. |
| Determine Decision Insights | The decision insights include the following:
|
| Recommended COA | The key data for the recommended COA is the estimated cost, schedule, and performance. This would also include a comparison of the recommended COA’s potential to satisfy the major requirements. |
| Communicate Decision Story to Stakeholders | A clear and concise summary of the non-dominated COAs and the rationale for the recommended COA compared to the other non-dominated alternatives. |
| Implementation Plan | The implementation plan usually includes the recommended COA, decision story, key program milestones, major risks, and risk reduction roles, responsibilities, and activities. |
| Life Cycle Stage | Illustrative Decisions | Data Availability |
|---|---|---|
| Concept Stage | Assess Technology Opportunity/Initial Business Case
| Descriptive data on existing systems. Predictive data using low fidelity models for new concepts Predictive data on new technologies and concepts using low fidelity models |
Create Solution Class Alternatives and Select Preferred COA
| ||
| Development Stage | Select/Define System Elements
| Descriptive data on existing system elements Predictive data on new system elements and the system using high fidelity models Development test data in later parts of the stage |
Select/Design Verification and Validation Methods
| ||
| Production Stage | Develop Production Plans
| Initial operational test and evaluation data Descriptive production quality data |
| Utilization and Support Stages | Utilization decisions
| Operational and logistics descriptive data Predictive data using high fidelity operational and logistics models |
| Retirement Stage | Retirement Plan
| Operational and logistics descriptive data Predictive data using high fidelity operational and logistics models |
Disclaimer/Publisher’s Note: The statements, opinions and data contained in all publications are solely those of the individual author(s) and contributor(s) and not of MDPI and/or the editor(s). MDPI and/or the editor(s) disclaim responsibility for any injury to people or property resulting from any ideas, methods, instructions or products referred to in the content. |
© 2025 by the authors. Licensee MDPI, Basel, Switzerland. This article is an open access article distributed under the terms and conditions of the Creative Commons Attribution (CC BY) license (https://creativecommons.org/licenses/by/4.0/).
Share and Cite
Parnell, G.S.; Kenley, C.R.; Clark, D.; Smith, J.; Salvatore, F.; Nwobodo, C.; Davis, S. Decision Analysis Data Model for Digital Engineering Decision Management. Systems 2025, 13, 596. https://doi.org/10.3390/systems13070596
Parnell GS, Kenley CR, Clark D, Smith J, Salvatore F, Nwobodo C, Davis S. Decision Analysis Data Model for Digital Engineering Decision Management. Systems. 2025; 13(7):596. https://doi.org/10.3390/systems13070596
Chicago/Turabian StyleParnell, Gregory S., C. Robert Kenley, Devon Clark, Jared Smith, Frank Salvatore, Chiemeke Nwobodo, and Sheena Davis. 2025. "Decision Analysis Data Model for Digital Engineering Decision Management" Systems 13, no. 7: 596. https://doi.org/10.3390/systems13070596
APA StyleParnell, G. S., Kenley, C. R., Clark, D., Smith, J., Salvatore, F., Nwobodo, C., & Davis, S. (2025). Decision Analysis Data Model for Digital Engineering Decision Management. Systems, 13(7), 596. https://doi.org/10.3390/systems13070596