Abstract
Talent significantly influences urban technological innovation and sustainable economic development. Enhancing urban talent competitiveness (UTC) necessitates a systemic perspective on upgrading and optimizing the combination of both tangible and intangible resources, such as economic vitality, livability, and social harmony, which is a typical configurational issue. This paper utilizes empirical data from 96 Chinese cities and applies an innovative grey quantitative comparative analysis (GQCA) method to investigate the impact and mechanisms of different urban talent ecology (UTE) on talent competitiveness. The findings reveal that there are no bottleneck factors constraining UTC within the sample, interactions, and couplings among six urban talent elements that generated 30 distinct UTEs. By calculating the possibility of each UTE achieving talent competitiveness, it was found that 16 UTEs, characterized by vibrant business-led development, comprehensive development and integrated leadership, regional development leadership, and economy-led international innovation, lead to high UTC. Conversely, 14 UTEs result in low UTC. These findings were further validated through fuzzy set qualitative comparative analysis (fsQCA) for robustness testing. Finally, the study offers policy recommendations for urban talent strategies from both short-term and long-term perspectives.
1. Introduction
Talent is a key resource for countries and regions [1] and is needed for modern economies to grow and maintain their competitive advantage [2]. In this study, talent refers to high-value human capital categorized into two measurable groups: (1) human experts (HE)—individuals with advanced credentials (e.g., PhDs, professional certifications) validating specialized expertise, and (2) high-skilled professionals (HSPs)—those with demonstrable technical/skill-based competencies (e.g., data scientists, engineers). This aligns with contemporary urban talent literature) [1,3], where talent attraction metrics prioritize credentials, skills, and economic contributions over innate traits. In knowledge-based economies, attracting and retaining talent is paramount [4].
Overall, urban talent competitiveness (UTC) refers to a city’s comprehensive capacity and level of advantage in attracting various types of talent, including HE and HSPs [3]. Globally, UTC is enhanced through the development of attractive talent acquisition policies [5]. For example, London has established a headhunting system centered around research institutions to recruit world-renowned scientists who have achieved substantial research outcomes and exert significant influence across various fields. The government invests over GBP 2.2 million annually in this initiative, yielding remarkable results [6]. In fact, many internationally renowned cities leverage their unique advantages and development needs to attract global talent essential for urban growth through a variety of strategies. New York City attracts highly skilled knowledge migrants through attractive welfare policies, such as reducing housing burdens for immigrants [7]; Singapore’s “Global Talent Pass” program prioritizes cross-border mobility, reflecting the role of global connectivity identified in our framework [8]; Tokyo, Japan places a strong emphasis on the emotional integration of international migrants, continuously enhancing social support systems to improve the overall well-being of foreign residents [9]; Sydney, Australia attracts a significant number of skilled migrants by offering a livable cultural environment and abundant employment opportunities [10]; Abu Dhabi, the capital of Dubai, has attracted a large number of skilled migrants due to its relatively high-income levels and convenient visa policies [8]. Each city’s criteria for talent selection also vary, but they typically combine academic credential screening with skill-based assessments as the basis for talent recruitment [6].
Various regions and cities in China have introduced policies to improve their UTC [11]. In fact, UTC is by no means a single condition at work but rather a complex system consisting of a series of socioeconomic securities [12], policy development support, and other conditions at work [13,14]. Thus, how to optimize the combination of various urban resources from a systemic perspective to enhance UTC has become an urgent issue in current urban talent work [15,16]. This is precisely the core perspective of the urban talent ecology (UTE) theory [6]. UTE conceptually captures the systematic interactions among urban conditions—such as economic, social, and infrastructural factors—that attract highly educated and highly skilled populations [11,14]. We clarify that cities are effectively enhancing their UTC through quantifiable indicators, such as educational attainment, skill migration patterns, and innovation indices [17].
In terms of research methods, the commonly used methods are qualitative methods, such as the interview method [18], and quantitative methods, such as the entropy value method, regression analysis method [12], and so on. However, these methods are reductionist insofar as they only explore the net effects of one or a few variables. This results in information overload and oversimplifications [19], making it difficult to clarify the causal logic behind complex phenomena [20]. Configuration theory is holistic and more suitable for studying concurrent causation [21]. Some studies have explored UTC from a configurational perspective using qualitative comparative analysis (QCA) [22].
However, this method still has some limitations [23]: (i) Over-reliance on deterministic binary outcomes, failing to capture probabilistic realities [24,25]; (ii) Vulnerability to threshold sensitivity, which generates contradictory case classifications [26,27]; (iii) Inherent inability to quantify configuration efficacy [21]. These constraints hinder the broader application of configurational analysis in urban talent studies [28,29]. Specifically: (1) current frameworks lack the capacity to model how graded condition interactions affect UTC probabilities; (2) policymakers face difficulties in prioritizing interventions when multiple configurations coexist due to the absence of comparative metrics. To address these gaps, we propose grey quantitative comparative analysis (GQCA)–a novel methodology [30] that (i) quantifies configuration effectiveness through possibility degrees; (ii) resolves case contradictions via grey relational clustering; (iii) enables resource allocation benchmarking through dynamic configuration efficacy ranking.
We employ a novel GQCA approach to explore UTE that generates high UTC. For representative findings, we selected 96 cities in consideration of the administrative level of the cities (municipalities, provincial capitals, and prefecture-level cities); the region where the cities are located, covering the vast majority of provinces and cities in eastern, central, and western China; the degree of development of the cities, including the different degrees of development of first-, second-, and third-tier cities; and the scale of the cities, including megacities, large cities, medium-sized cities, etc. The cities were comparatively analyzed using the fsQCA method. Based on the configurational perspective, our study aimed to answer the following questions: What kind of UTE configuration generates high UTC? What is the possibility that each UTE configuration will generate high UTC? And does the proposed GQCA overcome the limitations of fsQCA.
The contributions of this paper are as follows: (1) This paper empirically identifies the multiple configuration pathways linking UTE to UTC. Previous research has largely relied on exploratory case studies of one or a few cities, often emphasizing the unique characteristics of these cities, making it difficult to generalize findings to other urban settings. By analyzing 96 cities across different regions and development levels in China, this paper empirically tests the multiple configuration pathways of UTC. It identifies 16 configurations that can lead to high UTC and 14 configurations that result in low UTC, aiding urban policymakers in selecting appropriate development strategies based on local conditions. (2) The paper uncovers the complex interactions among elements within UTE and the possibility of achieving UTC. Prior research has primarily focused on the linear impacts of one or two conditions, overlooking the multidimensionality of talent needs and the intricate interactions among urban resources. Through the analysis of sample cities, this study finds that the coupling and interaction of six selected antecedent conditions form 30 distinct UTEs. It also calculates the possibility of each UTE achieving UTC, providing urban managers with insights to focus on key weaknesses and rapidly enhance UTC. (3) This paper employs grey quantitative comparative analysis (GQCA) [30] as a new tool for addressing the complexities of UTE. While previous configurational studies using fsQCA have yielded deterministic results that often conflict with real-world observations, GQCA enables the analysis of the possibility of achieving specific outcomes. This method enhances configurational comparisons through quantitative analysis, providing a robust approach to tackling the complexities of UTC.
The remainder of this paper is organized as follows. Section 2 provides a literature review of the UTC and UTE, and it develops propositions. Section 3 introduces traditional QCA and the novel GQCA. Section 4 employs the GQCA to empirically examine the impact and mechanisms of UTE on UTC and conducts empirical tests using fsQCA. Section 5 discusses research conclusions, theoretical implications, managerial implications, and future prospects.
2. Literature Review
2.1. Urban Talent Ecology and UTC
UTC is a barometer of urban development and a source of motivation for urban development and innovation [31]. From the point of view of the time of publication of the paper and the emergence of new methods, this also shows the increase in the importance of talent and the extensive attention it has received in recent years [12,32,33]. Regarding the theoretical constructs affecting regional talent competitiveness, scholars have explored and proposed theories, including the push–pull theory [34], comfort object theory [33], UTE theory [22], and other multiple theoretical hypotheses.
The theory of UTE refers to the organic complex composed of talent groups and their diverse living environments within a certain spatial and temporal scope [35]. In the era of knowledge economies, the essence of talent competition lies in competition among talent ecological environments [5]. UTE theory incorporates multiple influencing factors of UTC into the same analytical framework [17], which is the theoretical basis of our study on the causal configuration state of UTC from the perspective of the system.
However, there is still no consensus among scholars regarding the constituent elements and dimensional classifications of the urban talent ecosystem. Existing studies present divergent frameworks: for example, some scholars analyze the topic from five dimensions—economic environment, innovation environment, life-service environment, socio-cultural environment, and natural-geographical environment [11]; others conduct research based on five key components—economic development, technological innovation, cultural education, livability, and public services [17]. These discrepancies reveal two critical theoretical deficiencies. First, although existing literature commonly emphasizes internal factors such as economy, innovation, and living conditions, it generally overlooks the dynamic interactions between the region and external systems. For instance, the business environment, particularly one underpinned by institutional infrastructure, reflects a region’s connectivity with global talent markets [4]. Similarly, global connectivity indicates a city’s position within the global knowledge network for talent [2]. Second, there is a systematic neglect of social support variables in the process of talent localization. Social harmony, for example, plays a crucial role in influencing talent mobility and retention intentions [36].
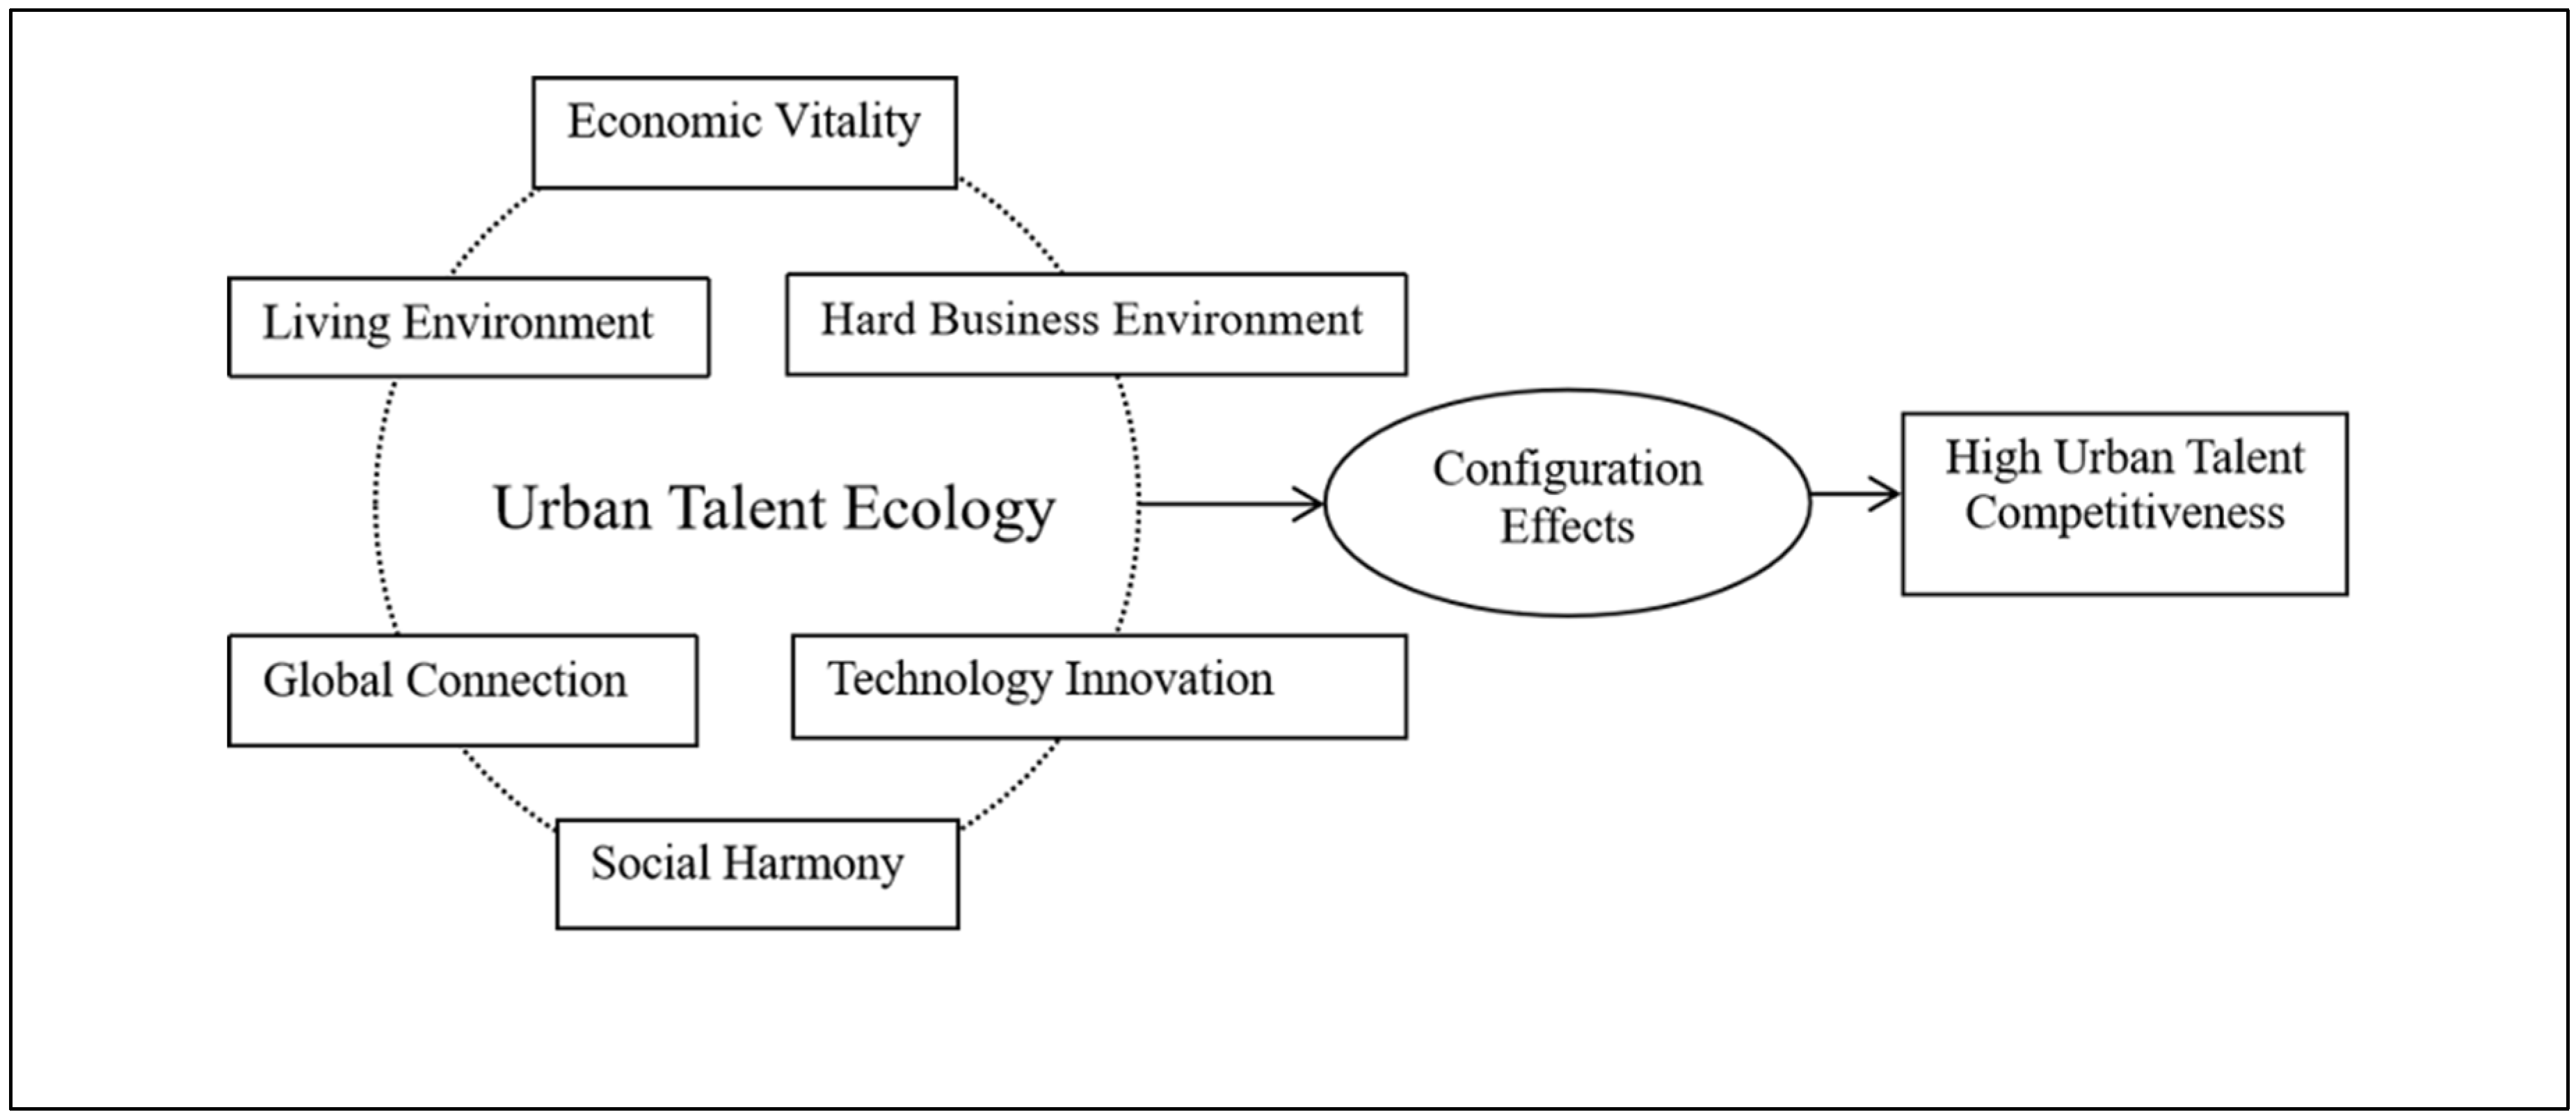
Therefore, building upon a comprehensive review of existing research, this study establishes a theoretical framework comprising six dimensions across three levels: internal foundations (competitiveness of economic vitality, competitiveness of living environments, competitiveness of technological innovation), external connections (competitiveness of a hard business environment, competitiveness of global connectivity), and social embeddedness (competitiveness of social harmony). The categorization of dimensions is displayed in Table 1. Based on this framework, we proceed with our analysis. At the same time, the use of the term competitiveness when applied to environments—such as the competitiveness of living environments or social harmony—is inherently metaphorical. It denotes a region’s relative capacity to attract and retain resources, including talent, by offering favorable conditions [21]. To mitigate abstraction, we operationalize this metaphor through six empirically measurable dimensions (Table 1).

Table 1.
Categorization of dimension.
2.2. The Single-Dimensional Effect of UTE
2.2.1. Competitiveness of Economic Vitality
On the one hand, talent agglomeration promotes the rapid development of a city’s economy. Economic vitality is the foundation of a city’s talent ecology. The economic environment is the embodiment of a city’s competitiveness and material wealth, and it is the material support and guarantee for the development of talent [32]. Cities with a high level of economic development provide more job opportunities for talent and promote the accumulation of talent capital and its effectiveness [37]. Existing studies have also shown that regions with developed economies and high employment levels are the primary choice for employment and settlement by the new generation of highly educated migrants [38], and the economic opportunities offered are still the major means of attracting young talent [39].
Proposition 1.
High economic vitality generates high UTC.
2.2.2. Competitiveness of a Hard Business Environment
A hard business environment is the prerequisite foundation of the business environment, and the infrastructure development it provides, such as convenient transportation, abundant electricity, and better network services, is the basic guarantee for attracting and retaining talent to work and live [17]. It is an important part of the convenience of urban environments. For instance, commuting time has a significantly negative impact on subjective well-being [4].
Proposition 2.
Hard business environments generate high UTC.
2.2.3. Competitiveness of Living Environments
The living environment is an important factor for attracting talent [33]. Living environments, first and foremost, include a good natural ecological environment. A good natural ecological environment in the city helps to maintain the physical and mental health of talent, while pollution problems risk the health of individuals, which in turn leads to the out-migration of talent [40] and inhibits their innovative vitality. As such, talent increasingly emphasizes environmental quality issues. The living environment also includes the human environments in terms of residential medical care, housing, consumption level, culture, and sports, etc., which are influential factors affecting the willingness of talent to migrate and settle down. For example, studies have shown that both the nature of housing and housing expenditure have a positive impact on the settlement of talent [12,45]. High levels of medical care can significantly influence the city as a choice for talent [45], and a suitable consumption level can enhance people’s happiness. Young, talented individuals are more willing to live in places with more cultural, sports, and consumer facilities [41].
Proposition 3.
High living environments generate high UTC.
2.2.4. Competitiveness of Social Harmony
Social harmony includes a city’s history and culture, social security, social equity, and social openness. The government maintains public order and social security, which is the basic guarantee for the enhancement of urban modernity [36]. Research shows that harmonious and accepting social attitudes, as well as lower integration costs, have a significantly positive impact on talent attraction, and the perception and evaluation of governance effects on social security and social equity are also important dimensions in the decision to stay [6,44]. Overall, social harmony triggered by an individual’s sense of identity and belonging to a city has a positive effect on the attraction and retention of talent [46].
Proposition 4.
High social harmony generates high UTC.
2.2.5. Competitiveness of Technology Innovation
Talent has a key impact on regional innovation [42], and the technological innovation environment affects the ability of a region to attract talent [6,47]. Developed countries and regions tend to emphasize investment in science and technology innovation and provide better platforms for researchers. Investment in science and technology innovation can have an important impact on the overall innovation capacity and innovation atmosphere of a region. It can enhance job satisfaction and work efficiency [13,32]. Some Chinese research also shows that technology and innovation are major factors influencing inter-provincial talent mobility in China [40].
Proposition 5.
High science and technology innovation generates high UTC.
2.2.6. Competitiveness of Global Connection
Global connectivity mainly refers to how closely the host city is connected to other cities around the world. At present, with the accelerated evolution of economic globalization, economics and trade, science, and technology among different countries is becoming more frequent [4]. The global connection of talent is becoming increasingly close, and studies have already shown that cross-border cooperation opportunities are an important factor influencing the flow of talent [2] and play an increasingly important role [43]. Several existing studies on the attractiveness of cities for talent have not considered this emerging and important antecedent condition.
Proposition 6.
High global connectivity generates high UTC.
2.3. The Synergistic Effects of Multiple Dimensions of UTE
Beyond isolated impacts, synergistic couplings between ecological dimensions are critical for UTC optimization. For instance: (i) Economy–environment nexus: High economic vitality amplifies talent retention only when coupled with superior living environments [15,33]. (ii) Policy complementarity: Global connectivity boosts innovation effectiveness when supported by robust technological infrastructure, as seen in Shenzhen’s talent acceleration zones [6]. (iii) Threshold effects: Social harmony becomes non-substitutable when hard business environments exceed critical thresholds [14]. Yet extant literature predominantly examines these synergies through reductionist lenses, neglecting configurational dynamics [28]. This gap necessitates our GQCA approach to model nonlinear interdependencies.
In conclusion, from the perspective of configuration, we use GQCA, mainly focusing on how the six UTE dimensions connect to realize high UTC and the complex mechanism of their interaction. A theoretical model is shown in Figure 1.
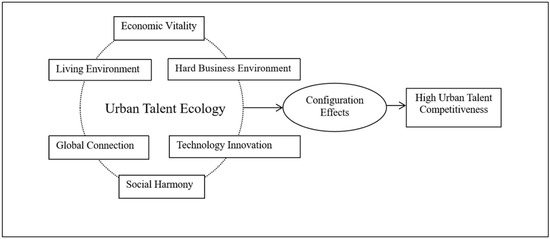
Figure 1.
Analytical model: Configuration effect of UTE on UTC.
3. Methodology
Configurational analysis investigates the causal complexity behind outcome emergence [21,48] and is gaining prominence in systems research [49]. While traditional qualitative comparative analysis (QCA) handles combinatorial causality, its crisp-set variant (csQCA) suffers from information loss during dichotomization [50]. Fuzzy-set QCA (fsQCA) mitigates this by preserving continuous data through membership calibration [0, 1] [51]. Nevertheless, fsQCA and the established fsQCA software (e.g., the most commonly used and mature software for the fsQCA method—fsQCA 3.0.) still require arbitrary thresholds for truth table analysis (consistency/coverage metrics), potentially reintroducing information loss and contradictory results [25,27]. To overcome these limitations, we employ grey quantitative comparative analysis (GQCA) [30]. This novel approach replaces membership functions with possibility functions, calibrating all variables to continuous possibility degrees [0, 1] without dichotomization. GQCA quantifies configuration efficacy via (1) grey clustering decision coefficients—resolving case contradictions; (2) configuration outcome contribution values—enabling direct comparison of path effectiveness. The methodological comparison between fsQCA and GQCA is illustrated in Table 2.
Table 2.
The methodological comparison between fsQCA and GQCA.
We focus on sufficient relationships between antecedents and UTC. First, GQCA measures the possibility degree of each configuration yielding high UTC. Second, fsQCA robustness tests verify method reliability. Third, necessity analysis identifies critical bottleneck factors constraining UTC.
4. Empirical Research
4.1. Data Sources, Measurement and Calibration
Data related to the conditional variable cities were derived from “China’s Urban Competitiveness Report No. 19 on Super and Mega Cities: Healthy Benchmarks and Ideal Benchmarks” [52]. The report analyzed the comprehensive economic competitiveness and sustainable competitiveness of 291 Chinese cities in 2021 in a number of dimensions, including the living environment competitiveness, the hard business environment competitiveness, the economic vitality competitiveness, the social harmony competitiveness, the technological innovation competitiveness, and the global connections competitiveness. Information on the above elemental indicators mainly came from the Urban and Research Center of the Chinese Academy of Social Sciences (CASS), whose data sources are mainly authoritative statistical agencies, international research institutions, and webcrawler data. Data of the outcome variable UTC came from “China City Talent Attractiveness Ranking: 2022” [53], which covered the talent competitiveness of China’s top 100 cities in 2021 and analyzed the characteristics of mobile talent through cross-city job search data with the help of the Zhilian Recruitment job search platform. These two databases were matched, and 96 cities with complete data were used as study cases. In addition, we qualitatively analyzed the configurations found by GQCA by combining the cities’ authoritative media reports and official government websites.
Measurement of outcome variables: To measure the UTC, the talent competitiveness index was used. The index considers the percentage of talent inflow, the percentage of net talent inflow, the percentage of talent inflow of fresh graduates, the percentage of talent inflow of those with a master’s degree or higher, per capita disposable income, and net population inflow. The index reflects the ability of a city to attract and retain talent and the city’s attractiveness to young college students and highly educated talent [53]. The higher the value of the talent attractiveness index, the higher the talent attractiveness of the region.
Measurement of variable conditions: Operationalization of metaphorical ‘competitiveness’ concepts for talent ecology dimensions. Indicators derived from Ni et al. (2021) [52] and CASS databases translate systemic properties into measurable variables. Example: Living environment competitiveness aggregates eight sub-indices (e.g., climate comfort, healthcare density), transforming abstract “livability advantage” into quantitative benchmarks. The higher the score, the stronger the competitiveness of the region. The specific measurements are as follows:
- (1)
- The living environment competitiveness is evaluated in eight aspects: history and culture of the city, medical and health institutions, climate comfort, environmental excellence, the consumption level of the citizens, cost of living, health and leisure facilities, and cultural facilities.
- (2)
- The hard business environment competitiveness is evaluated in six aspects, namely, accessibility of transportation, abundance of electricity, speed of network information transmission, accessibility of aviation, an index of airport facilities, and an index of natural disasters.
- (3)
- The economic vitality competitiveness is evaluated in five aspects, namely, the city’s ease of doing business index, an index of property rights protection, an index of the proportion of young talent, the economic growth rate, and labor productivity.
- (4)
- The social harmony competitiveness is evaluated in six aspects, namely, the city’s historical and cultural index, social security index, social equity index, housing index, openness index, and medical and health institutions index.
- (5)
- The technological innovation competitiveness is evaluated in five aspects, namely, the patent application index, academic paper index, scientific and technological enterprise index, university index, and cultural facilities index of a city.
- (6)
- The global connection competitiveness is evaluated in five aspects, namely, air connectivity, network connectivity, researchers’ connectivity, financial enterprises’ connectivity, science and technology enterprises’ connectivity, and shipping connectivity.
Variable Calibration: We used a direct method to calibrate the variables to fuzzy sets. Since UTE and UTC are newly published measurements that lack external and theoretical standards, in the fsQCA, referring to previous studies [54], we set three calibration points—full membership, the crossover point, and full non-membership—for the six conditional variables and one outcome variable (the talent competitiveness index). These three points, respectively, correspond to the upper (75%), median, and lower (25%) quartiles of the descriptive statistics of the sample. Non-high talent attractiveness was calibrated by taking the non-set of high talent attractiveness. The calibration anchors and descriptive statistics of each variable are shown in Table 3. In the GQCA, the same values as in the fsQCA method are taken, i.e., the calibration points for the maximum possible degree, crossover point, and maximum impossible degree of the six conditional variables and one outcome variable as the upper (75%), median, and lower (25%) quartiles of the descriptive statistics of the sample of the case, respectively. The calibration anchor points and descriptive statistics for each variable are detailed in Table 4.
Table 3.
Pooling, calibration, and descriptive statistics.
Table 4.
Possibility, calibration, and descriptive statistics.
4.2. GQCA Configuration Analysis
For a comparison with fsQCA, the equal weight method is adopted. Specifically, the clustering weight of each variable condition is 0.167. The total value of the grey configuration outcome contribution, the sum of the grey decision clustering coefficients, the grey configuration outcome contribution values, and the possibility degree of grey configuration outcome contribution values are shown in Appendix A. Table 5 shows the identification of the condition variables that produce the outcome.
Table 5.
Comparison of the possibility of contributing values to the GQCA grey cluster configuration results with fsQCA.
GQCA determines the value of the possibility of different configurations to produce the outcome, which is conducive to the comparison of the configurations at the same time. As a new case to produce the outcome for prediction, a fitness table is shown in Appendix B, reflecting the fit. We used the coefficient of determination to characterize the goodness of fit of the outcome, which has the value of 0.82860, which is a good degree of fit.
We identified the configuration pathways to achieve high UTC, that is, the corresponding grey configurations from GT1 to GT16 in Table 5, and the degree of possibility that each configuration pathway can achieve high UTC using the two configuration comparison analysis methods of fsQCA and GQCA. These were analyzed in detail with the four highest grey configurations of UTC, namely, GT1, GT2, GT3, and GT4.
- (1)
- GT1: Business-led vibrant development. Configuration GT1 consists of high living environment competitiveness, high hard business environment competitiveness, high economic vitality competitiveness, low social harmony competitiveness, high-tech innovation competitiveness, and high global connection competitiveness. Its possibility degree of generating high UTC is 1, which corresponds to the configurations identified by fsQCA in T3 (high living environment competitiveness, high economic vitality competitiveness, and high-tech innovation competitiveness as the dominant grouping, supplemented by high hard business environment competitiveness, and high global connection competitiveness). This configuration aligns strongly with the concept of an “innovation ecosystem” driven by market forces and external linkages. High economic vitality and a robust hard business environment create ample career opportunities and reduce operational friction for businesses and skilled professionals alike [55]. Strong technological innovation capacity fosters a dynamic high-tech sector, attracting talent-seeking cutting-edge work environments [2]. High global connectivity further enhances this ecosystem by facilitating knowledge spillovers, international collaboration, and access to global talent pools, acting as a key pull factor according to the push-pull theory of migration [34,42]. While social harmony competitiveness is currently lower in this configuration, the potent combination of economic opportunity, technological advancement, global integration, and foundational business infrastructure appears to provide sufficient compensatory advantages for attracting talent, particularly those highly mobile professionals prioritizing career advancement and exposure to global markets [14]. Zhuhai, a special economic zone in China and an emerging city has recently benefited from the development of the Guangdong–Hong Kong–Macao Greater Bay Area and the Hengqin–Guangdong–Macao Deep Cooperation Zone. Its infrastructure and economic environment have continuously improved, positioning it as a hub for science, innovation, and internationalization. As a result, Zhuhai has attracted a substantial influx of talent. Official reports indicate that Zhuhai’s highly educated population is growing rapidly; nearly 30% of its residents hold tertiary education qualifications. This continuous upgrading of the talent pool enhances the city’s attractiveness. As a major center for economic, cultural, and technological innovation exchange, London offers an attractive natural environment. Although it does not stand out in terms of social harmony, it remains an ideal destination for many knowledge-based and skilled migrants [6].
- (2)
- GT2: Comprehensive development and integrated leadership. Configuration GT2 consists of high living environment competitiveness, high business environment competitiveness, high economic vitality competitiveness, high social harmony competitiveness, high-tech innovation competitiveness, and high global connection competitiveness. Hence, it is named comprehensive development and integrated leadership. Its possibility of generating high UTC is one. This corresponds to configuration T1 (high living environment competitiveness, high business environment competitiveness, and high social harmony competitiveness as the dominant configuration, supplemented by high economic vitality competitiveness), configuration T2 (high living environment competitiveness, high economic vitality competitiveness, high-tech innovation competitiveness as the dominant configuration, supplemented by high social harmony competitiveness), configuration T3, and configuration T4 (high hard business environment, high economic vitality competitiveness, and high global connection competitiveness as the dominant configuration, supplemented by high-tech connection competitiveness), as identified by fsQCA. This represents a state of comprehensive, synergistic development, embodying the pinnacle of UTE effectiveness. It signifies embeddedness within multiple supportive structures simultaneously. The high living environment and social harmony competitiveness fulfill talent’s essential needs for quality of life, safety, belonging, and social well-being, acting as crucial retention factors and aligning with comfort object theory [56]. Concurrently, the strong economic vitality, hard business environment, technological innovation, and global connectivity provide unparalleled opportunities for professional growth, business development, knowledge creation, and global engagement. This holistic excellence creates strong institutional legitimacy and agglomeration economies, making these cities natural magnets for diverse talent segments, as predicted by theories of regional competitiveness and cumulative advantage [1]. The representative cities are Beijing, Shanghai, Shenzhen, Guangzhou, Hangzhou, Chengdu, Suzhou, Nanjing, Wuhan, Changsha, Xi’an, Qingdao, etc. These are all first- or second-tier cities at the head of the list, with major economic indicators such as GDP and per capita GDP at the forefront of the country and a strong economic foundation. For example, Shanghai is the economic center of China. These cities have relatively well-developed infrastructure in terms of transportation, electricity, networks, health and recreation, and consumption. For example, Beijing, Shanghai, Chengdu, and other cities are important hubs of China’s high-speed railroad network. These cities have a unique urban culture and high medical, healthcare, and education levels. For example, a large proportion of China’s first-class universities are located in these cities. The proportion of third-class hospitals is also higher than in other cities, and most of these cities have been selected as national civilized cities. These cities have superior research and innovation policy support and broad practice platforms. The government has a high level of urban governance, and the degree of internationalization is relatively high, among the highest in China. Therefore, they have always been the most important choices for gathering talent. New York City in the United States and Tokyo also fall into this category. As a world-class metropolis, they have become the global hub for talent inflows, leveraging its advantages in economic income, technological innovation, and quality of life [7,9].
- (3)
- GT3: Regional development leadership. Configuration GT3 consists of high living environment competitiveness, high hard business environment competitiveness, high economic vitality competitiveness, high social harmony competitiveness, high-tech innovation competitiveness, and low global connected competitiveness. Its possibility degree of generating a high city talent environment is 0.990, corresponding to configurations T1 and T2 identified by fsQCA. Its high UTC outcome demonstrates a viable alternative path through strong regional anchoring and internal ecosystem completeness. Despite lower global connectivity, the potent combination of high living environment, robust business infrastructure, vigorous economic activity, social stability (high social harmony), and significant technological innovation capacity fosters a highly self-sufficient and attractive talent ecosystem within its regional context [57]. Talent is drawn to the opportunities for stable career growth, good living conditions, local innovation impact, and a strong sense of community, factors that may resonate more strongly with individuals seeking a deep integration into the local socioeconomic fabric rather than necessarily prioritizing international exposure. This resonates with aspects of UTE theory emphasizing the importance of a supportive localized environment for talent growth [5]. Foshan, a major manufacturing hub in the Pearl River Delta, exemplifies this. Its exceptional domestic industry strength, vibrant local innovation scene (patents, labs, high-tech firms), and rich local cultural/recreational offerings create a powerful regional draw, proving that deep regional specialization and internal ecosystem vitality can compensate for limitations in global prominence. Abu Dhabi, the capital of Dubai, exemplifies this phenomenon. Although the city itself is not particularly prominent in terms of global connectivity, it has long served as a key regional hub for talent migration by leveraging its strengths in economic development and infrastructure [8].
- (4)
- GT4: Economy-led international innovation. Configuration GT4 consists of low living environment competitiveness, high hard business environment competitiveness, high economic vitality competitiveness, low social harmony competitiveness, high-tech innovation competitiveness, and high global connection competitiveness. Its possibility degree of generating high UTC is 0.998, but fsQCA does not identify whether the configuration produces high UTC. Configuration GT4 presents a counter-intuitive case: achieving high UTC despite low levels in the traditionally crucial areas of living environment and social harmony competitiveness. Its success relies on an exceptionally strong combination of internationalized economic and innovation drivers. High economic vitality and a superior hard business environment provide powerful economic opportunities and operational efficiency. High technological innovation capacity fosters cutting-edge research and development activities. High global connection is paramount here, facilitating access to global markets, capital, and knowledge networks, acting as the linchpin for this configuration [2,4]. This potent triad (economy, innovation, global links) appears to create such strong professional and advancement potential for specific talent segments, particularly those in internationally oriented high-tech industries and global business functions, that they are willing to tolerate deficiencies in more livability or broader social integration aspects, at least in the short-to-medium term. This finding aligns with the push-pull theory, where powerful economic and career advancement pull factors (especially involving global dimensions) can outweigh negative push factors related to living discomfort or weaker social cohesion [34]. Xiamen, a Special Economic Zone historically centered on foreign trade and high-tech exports, serves as a prime example. Its strategic role as a gateway for external engagement, strong global connectivity, and emphasis on developing high-end industrial clusters create a highly attractive environment for overseas-returning talents and professionals whose career anchors are primarily rooted in international involvement and cutting-edge economic sectors [58]. This situation bears a striking resemblance to that of Singapore. Despite its appeal, however, local perceptions that the growing influx of foreign migrants is negatively impacting employment opportunities have led to increasing social hostility toward immigrants, thereby undermining social harmony. Nevertheless, Singapore remains a significant hub for talent inflows [8].
In fact, the UTE that generate high levels of UTC are centered around sustainable development goals (SDG). At the level of individual antecedent conditions, hard business environment competitiveness, living environment competitiveness, social harmony competitiveness, and economic vitality competitiveness all support SDG 8 (decent work). Technological innovation competitiveness and global connection competitiveness contribute to SDG 9 (industry/innovation). Furthermore, all indicators play a role in advancing the achievement of SDG 11 (sustainable cities). This is also highly aligned with the current concept of smart city development, which emphasizes enhancing overall urban competitiveness—including UTC—through digital and intelligent technologies by continuously optimizing both the hard infrastructure and the soft environment [59].
The grey configurations classified from GT1 to GT4 are all first and second-tier cities in China. Among them, due to the outstanding performance of GT2 in all six aspects and its high UTC, this configuration will become the ideal path choice for various cities, undoubtedly. However, resources are always limited. If we cannot meet the resource investment in all six aspects and reduce the investment in social harmony competitiveness (GT1), it will not reduce the overall UTC; in addition, reducing resource investment in global connection competitiveness (GT3) will not have a significant negative impact on the overall UTC. If it is difficult to improve the living environment competitiveness (GT6) in the short term, the expenditure on improving social harmony competitiveness (GT4) can be reduced at the same time. In this state, the overall UTC is higher than that of only reducing the living environment competitiveness. Therefore, in the long run, we can gradually promote the joint improvement of both. Similarly, if the competitiveness of the hard business environment is a short-term shortcoming that cannot be supplemented (GT9), the investment in improving global connection competitiveness can be appropriately reduced (GT5).
We also analyzed the urban talent ecosystems that generate non-high UTC, namely, the grey configurations GNT1 to GNT14 in Table 5. First, the grey configurations GNT1, GNT2, and GNT3 are the least likely to produce high UTC, with a possibility degree of 0.010. The GNT1 configuration indicates that it is very unlikely to have high talent attraction when only high global connectivity competitiveness is available, and all other factor conditions are at low levels (corresponding to the NT2 and NT3 configurations of fsQCA). The representative case is Jining. The grey configuration GNT2 shows that it is very unlikely to generate high UTC when only the living environment and economic vitality are emphasized, and the level of other factors is very low (corresponding to the NT1 configuration of fsQCA). The representative case is Zunyi. Grey configuration GNT3 shows that focusing only on the living environment with low levels of other factors is also very unlikely to generate high UTC (corresponding to the NT1 configuration of fsQCA), as represented by the cases of Qinhuangdao, Yuxi, Longyan, and Liuzhou.
4.3. Robustness Analysis
To verify the robustness of the GQCA analysis results, we further conduct configurational analysis using fsQCA and compare these results with those obtained from the GQCA analysis. We used fsQCA3.0 software to analyze the configurations of UTE that lead to high and non-high UTC separately. These different configurations denote different UTEs that achieve the same outcome (high or non-high UTC). The groupings were also named according to the configuration theorizing process [21].
We first tested the necessary conditions using the fsQCA. As shown in Table 6, the consistency of the necessity of individual conditions is generally low (<0.9). That is, there are no necessary UTE conditions to generate high UTC. In other words, this finding confirms that no single UTE dimension acts as a strictly necessary condition universally constraining the achievement of high UTC across all cities. This absence of bottleneck factors underscores the fundamental tenet of configurational theory: multiple combinations of conditions can equivalently lead to the same outcome.
Table 6.
Necessity test for individual conditions of the fsQCA approach.
We set the raw consistency threshold at 0.8, the PRI consistency threshold at 0.70, and the case frequency threshold at 1. Due to the lack of evidence and theory on the exact direction in which environmental conditions influence outcomes, we conducted counterfactual analyses assuming that the presence or absence of a single talent ecosystem condition contributes to high UTC. The core conditions of each solution were identified by comparing the nested relationships between the intermediate and parsimonious solutions. Conditions that appear in both the intermediate and parsimonious solutions are the core conditions of that solution, and conditions that appear only in the intermediate solution are the edge conditions [21]. The results are shown in Table 7.
Table 7.
Configurations of high talent attraction and non-high talent attraction implemented in fsQCA.
It can be seen that for the condition variables that produce the outcome, the outcome of the fsQCA is basically completely included in the results of GQCA, with two exceptions: a subset of configuration T1 that produces high UTC (high living environment competitiveness, high hard business environment competitiveness, high economic vitality competitiveness, high social harmony competitiveness, non-high technology innovation competitiveness, and high global connection competitiveness—called configuration T11); and a subset of configuration NT5 that generates non-high UTC (non-high living environment competitiveness, high hard business environment competitiveness, non-high economic vitality competitiveness, high social harmony competitiveness, non-high technology innovation competitiveness, and high global linkage competitiveness—called configuration NT51). We re-analyzed these configurations in the case of Quanzhou, a city that supports the T11 configuration in fsQCA, and the case of Hohhot, a city that supports the NT51 configuration. Table 8 shows the cases of Quanzhou and Hohhot. Quanzhou had a UTC of 0.410 < 0.500, which was in the range of low UTC, although its configuration was T11, so it does not support the results of fsQCA but does support the results of GQCA. The same was true for Hohhot; although the configuration was NT51, its UTC was 0.540 > 0.500, which belongs to the range of high UTC and does not support the results of the analysis of fsQCA yet does support the results of GQCA. It can be seen that the two methods (fsQCA and GQCA) for the configuration of the analysis process of the divergence of the two groupings both support the results of the analysis of GQCA.
Table 8.
Situation analysis of Hohhot and Quanzhou (calibrated values).
The contradictions between the fsQCA analysis results and actual case scenarios can be attributed to the threshold settings used during the configurational analysis process, specifically the original consistency threshold, PRI consistency threshold, and case frequency threshold. The binarization of data through these thresholds leads to a loss of information, causing some cases that actually produce the target outcome to be misclassified as non-target outcomes due to not meeting a particular threshold criterion. This is a frequent criticism leveled at fsQCA [27].
To verify the robustness of the GQCA analysis results, we further examine the impact of different clustering weight assignments on the goodness of fit of the GQCA outcomes and predictions. In addition to the equal-weight method, we used three multi-attribute decision-making methods—grey decision-making trial and evaluation laboratory (grey DEMATEL), GDANP, and GRA—and entropy weighting to analyze the weights and calculate the specific coefficients of determination, as shown in Table 9. It can be seen that the grey DEMATEL method has the highest goodness of fit and that entropy weights has the lowest goodness of fit.
Table 9.
Assignment results and goodness-of-fit.
5. Conclusions and Future Works
5.1. Conclusions
The UTE is the result of the interplay of various urban resources and should be examined from a configurational perspective to understand its complex mechanisms on UTC. Traditional configurational comparison methods, such as qualitative comparative analysis (QCA), often encounter issues where analysis results contradict reality; therefore, through the novel GQCA approach, we analyzed the talent competitiveness of 96 cities in China. The study found that the interaction and coupling of six antecedent conditions generated 30 distinct configurational pathways among the sample cities. Among these, 16 types of UTEs that may generate high UTC, such as business-led vibrant development, comprehensive development and integrated leadership, regional development leadership, and economy-led international innovation. We also identified 14 types of urban talent ecologies that may generate low UTC, and we calculated the degree of possibility of high UTC for each UTE. We conducted robustness checks using the fsQCA method.
To explicitly address the research propositions formulated earlier (Section 2.2), we present a summary of our findings concerning each proposition: (1) Proposition 1 (High economic vitality generates high UTC): This proposition is partially supported. While high economic vitality was a common feature across several highly effective configurations (e.g., GT1, GT2, GT3, and GT4), the absence of any single necessary condition (including economic vitality) and the presence of paths like GT7 suggest that while important, very high economic vitality is not strictly indispensable for high UTC in all contexts. However, low economic vitality strongly predicts non-high UTC (as seen in many GNT configurations); (2) Proposition 2 (hard business environments generate high UTC): This proposition holds to a similar extent. Although high hard business environment competitiveness is a prevalent core element across most of the key high-UTC configurations identified (GT1, GT2, GT3, and GT4), its absence does not entirely preclude the emergence of pathways leading to high UTC (as indicated by GT5, GT9, and GT11, among others); (3) Proposition 3 (high living environments generate high UTC): This proposition is supported under specific conditions. High living environments are central to configurations like GT2 and GT3. However, configuration GT4 demonstrates high UTC is possible even with low living environment competitiveness when compensated by exceptionally strong economic vitality, technological innovation, and global connectivity. Conversely, its absence strongly features in many non-high UTC paths; (4) Proposition 4 (high social harmony generates high UTC): This proposition is not consistently supported by our findings. While desirable and present in the ideal GT2 configuration and effective GT3 configuration, configurations like GT1 and GT4 achieved high UTC despite low social harmony competitiveness. This indicates social harmony is not a universally necessary driver and can be compensated by compelling strengths in other areas (e.g., economics, global links, technology). Its absence alone is not a critical bottleneck; (5) Proposition 5 (high science and technology innovation generate high UTC): This proposition is largely supported. High technological innovation competitiveness serves as a core element in many high-UTC configurations (e.g., GT1 to GT7). Its absence is a defining characteristic of non-high UTC pathways, as observed in numerous GNT configurations. The findings confirm its critical role as a key attractor for talent; (6) Proposition 6 (High global connectivity generates high UTC): This proposition is conditionally supported. It is crucial for the success of configurations like GT1 and GT4. However, configuration GT3 demonstrates that high UTC is achievable without high global connectivity if regional strengths and internal ecosystem completeness are sufficiently robust. Its importance depends heavily on the specific configuration; it acts as a crucial enhancer but is not an absolute requirement in all contexts.
At the same time, our analysis confirms the core proposition of the UTE-UTC relationship: it is fundamentally configured rather than driven by isolated prerequisites. The absence of any universally necessary (i.e., non-substitutable bottleneck) condition (as evidenced by necessity tests in Table 6) reinforces this configurational perspective. However, specific conditions (e.g., technological innovation in GT1-GT4, global connectivity in GT4, economic vitality in GT1) consistently emerge as core causal elements within the identified high-performing configurations (Table 5), signifying their crucial, albeit contextual, importance for generating high UTC.
Finally, by analyzing the complex influence of talent ecologies on the level of UTC in Chinese cities, our study offers theoretical and practical insight for enhancing UTC and promoting the high-quality development of talent.
5.2. Theoretical Implications
This study makes three key theoretical advances to configurational theory and UTE literature:
- (1)
- Extending configuration theory: By developing GQCA, we resolve long-standing methodological limitations in analyzing probabilistic causal complexity (e.g., threshold sensitivity in fsQCA). This introduces a possibility-oriented framework capable of quantifying configuration efficacy—a theoretical breakthrough enabling dynamic benchmarking of resource allocation paths in socio-ecological systems [21,28].
- (2)
- Refining UTE dimensions: Empirical validation of the tripartite framework (internal foundations—external connections—social embeddedness) theorizes previously neglected dynamics: (1) Global connectivity as an institutional conduit for knowledge spillovers [2]; (2) social harmony as a nonlinear moderator of talent retention [36]. This redefines urban talent ecosystems as multilevel adaptive systems rather than static aggregates.
- (3)
- Refining talent mobility theory: Identification of 16 distinct configurations demonstrates that high UTC can emerge even with low social harmony (GT1 and GT4 configurations) when compensated by economic/global innovation. This nuances push-pull theory [34] by showing talent prioritizes professional ecosystem affordances over social comforts in knowledge-economy hubs—a contingency previously untheorized [60]. Global connectivity switches from peripheral (GT3) to core (GT1) based on economic-technological coupling. This result establishes cities as complex adaptive systems [15] where talent competitiveness emerges from nonlinear resource recombination.
5.3. Managerial Implications
- (1)
- Systematic optimization of resource allocation: City managers should adopt a systemic approach to optimize resource allocation. Enhancing UTC requires a comprehensive optimization of economic vitality, livability, and social harmony. Improvements in only one aspect are insufficient to achieve sustainable competitive advantages. Enhancing infrastructure such as transportation, housing, healthcare, and education will improve the quality of life and make the city an attractive place to live, thereby enhancing its appeal to talent.
- (2)
- Enhance business environment and innovation climate: City managers should further optimize the business environment and strengthen the innovation climate. Building a vibrant business environment and robust innovation capabilities involves encouraging collaboration and exchange among businesses, promoting the flow of knowledge and technology, and fostering an ecosystem that supports innovation. Simplifying administrative procedures and providing one-stop services will improve the business environment, attract more companies and investments, create more job opportunities and development spaces, and ultimately help attract and retain talent.
- (3)
- Focus on talent quantity, structure, and quality: City managers should prioritize the quantity, structure, and quality of talent. Developing multilevel policies for talent introduction and cultivation should include both attracting high-end talent and nurturing local talent through education and training to enhance the overall workforce quality. It is essential not only to attract high-level talent but also to emphasize the diversity of talent, including individuals with different disciplinary backgrounds, experiences, and skills, to promote cross-disciplinary innovation and problem-solving capabilities.
5.4. Future Works
Although the proposed GQCA overcomes many shortcomings of traditional fsQCA as a new approach, there are still many aspects that need to be improved.
First, we only examined cross-sectional data on the UTC of Chinese cities in 2021 and did not consider changes in the time dimension. Therefore, the next step is to explore how GQCA, as a quantitative analysis method, can be used for the dynamic analysis of panel data. In future research, we will analyze the evolution of urban ecologies that generate high UTC.
Second, we evaluated GQCA predictions based on the coefficient of determination R2 as an indicator of the goodness-of-fit. The next step is to optimize this by developing a way to evaluate the indicators of the prediction effects of the GQCA approach.
Third, although the tripartite UTE framework (“internal foundations–external connections–social embeddedness”) and GQCA methodology proposed to demonstrate considerable theoretical universality, and comparative analyses with metropolitan hubs such as London, New York, Singapore, and Tokyo have been incorporated, the empirical investigation remains constrained by limitations in metric comparability, policy context heterogeneity, and data acquisition barriers. Consequently, the inclusion of globally significant regions in the experimental validation constitutes a critical area for methodological refinement in future research.
Author Contributions
Conceptualization: P.J. and Z.D.; methodology: P.J. and Z.D.; validation: P.J. and Z.D.; formal analysis: Z.D.; investigation: R.Z. and Y.S.; data curation: Z.D. and R.Z.; writing—original draft: P.J., Z.D. and Y.S.; writing—review and editing: P.J. and Y.S.; visualization: R.Z.; supervision: P.J.; project administration: P.J.; funding acquisition: P.J. All authors have read and agreed to the published version of the manuscript.
Funding
This research was funded by the Humanities and Social Sciences Foundation of the Ministry of Education, China (Grant No. 22YJC840012) and the Graduate Science Research Fund of the School of Business, Shandong University (Grant No. SXY2025001).
Data Availability Statement
All data utilized in this study are from publicly available.
Conflicts of Interest
The authors declare no conflicts of interest. The funders had no role in the design of the study; in the collection, analyses, or interpretation of data; in the writing of the manuscript; or in the decision to publish the results.
Appendix A
Table A1.
(a) Grey configuration outcome contribution values. (b) Grey configuration outcome contribution values.
Table A1.
(a) Grey configuration outcome contribution values. (b) Grey configuration outcome contribution values.
| (a) | ||||||||||||||||
| Grey Configuration | GT1 | GT2 | GT3 | GT4 | GT5 | GT6 | GT7 | GT8 | GT9 | GT10 | GT11 | GT12 | GT13 | GT14 | GT15 | GT16 |
| Total value of the contribution of the grey configuration outcome. | 63.246 | 1242.090 | 41.420 | 40.067 | 26.048 | 135.131 | 63.085 | 27.104 | 59.938 | 50.117 | 22.451 | 43.393 | 73.243 | 43.649 | 21.574 | 22.132 |
| Sum of cluster coefficients for grey-counting. | 0.862 | 23.358 | 0.908 | 0.938 | 0.678 | 3.563 | 1.707 | 0.747 | 1.702 | 1.738 | 0.785 | 1.523 | 2.577 | 1.537 | 0.782 | 0.817 |
| Grey configuration outcome contribution value. | 73.400 | 53.175 | 45.600 | 42.700 | 38.400 | 37.923 | 36.964 | 36.300 | 35.223 | 28.830 | 28.600 | 28.486 | 28.425 | 28.405 | 27.600 | 27.100 |
| Possibility of contributing values to the grey configuration outcome. | 1.000 | 1.000 | 0.990 | 0.980 | 0.950 | 0.950 | 0.930 | 0.920 | 0.900 | 0.620 | 0.610 | 0.600 | 0.600 | 0.600 | 0.540 | 0.510 |
| (b) | ||||||||||||||||
| Grey Configuration | GNT14 | GNT13 | GNT12 | GNT11 | GNT10 | GNT9 | GNT8 | GNT7 | GNT6 | GNT5 | GNT4 | GNT3 | GNT2 | GNT1 | ||
| Total value of the contribution of the grey configuration outcome. | 61.158 | 21.516 | 93.776 | 20.167 | 37.982 | 21.294 | 42.408 | 36.581 | 37.441 | 17.820 | 511.751 | 69.067 | 17.220 | 17.034 | ||
| Sum of cluster coefficients for grey-counting. | 2.300 | 0.815 | 3.610 | 0.782 | 1.482 | 0.842 | 1.715 | 1.552 | 1.615 | 0.785 | 23.047 | 3.342 | 0.840 | 0.835 | ||
| Grey configuration outcome contribution value. | 26.590 | 26.400 | 25.977 | 25.800 | 25.635 | 25.300 | 24.728 | 23.576 | 23.183 | 22.700 | 22.205 | 20.668 | 20.500 | 20.400 | ||
| Possibility of contributing values to the grey configuration outcome. | 0.440 | 0.410 | 0.340 | 0.320 | 0.290 | 0.250 | 0.180 | 0.090 | 0.070 | 0.050 | 0.040 | 0.010 | 0.010 | 0.010 | ||
Note 1: is living environment competitiveness; 2 is hard business environment competitiveness; 3 is economic vitality competitiveness; 4 is social harmony competitiveness; 5 is technology innovation competitiveness; and 6 is global connections competitiveness.
Appendix B
Table A2.
Table of GQCA fitted predicted and actual values.
Table A2.
Table of GQCA fitted predicted and actual values.
| Cities | Predicted Value | Real Value | Cities | Predicted Value | Real Value | Cities | Predicted Value | Real Value |
|---|---|---|---|---|---|---|---|---|
| Beijing | 1.000 | 1.000 | Huizhou | 0.030 | 0.790 | Wuhu | 0.000 | 0.100 |
| Shanghai | 1.000 | 1.000 | Zhoushan | 0.160 | 0.780 | Xuzhou | 0.000 | 0.070 |
| Shenzhen | 1.000 | 1.000 | Nanchang | 0.990 | 0.730 | Jiangmen | 0.030 | 0.070 |
| Guangzhou | 1.000 | 1.000 | Shenyang | 0.360 | 0.730 | Luoyang | 0.000 | 0.060 |
| Hangzhou | 1.000 | 1.000 | Dalian | 1.000 | 0.650 | Yinchuan | 0.010 | 0.060 |
| Chengdu | 1.000 | 1.000 | Yantai | 0.990 | 0.610 | Jiayuguan | 0.030 | 0.060 |
| Suzhou | 1.000 | 1.000 | Guiyang | 0.050 | 0.610 | Wuhai | 0.040 | 0.050 |
| Nanjing | 1.000 | 1.000 | Langfang | 0.050 | 0.600 | Tangshan | 0.000 | 0.050 |
| Wuhan | 1.000 | 1.000 | Zhenjiang | 0.000 | 0.600 | Lanzhou | 0.000 | 0.050 |
| Changsha | 1.000 | 1.000 | Nanning | 0.720 | 0.590 | Panzhihua | 0.020 | 0.040 |
| Xi’an | 1.000 | 1.000 | Changchun | 0.080 | 0.560 | Putian | 0.020 | 0.040 |
| Wuxi | 1.000 | 0.990 | Taiyuan | 0.810 | 0.550 | Mianyang | 0.000 | 0.030 |
| Qingdao | 1.000 | 0.990 | Hohhot | 0.030 | 0.540 | Panjin | 0.010 | 0.030 |
| Foshan | 0.980 | 0.990 | Sanya | 0.020 | 0.540 | Yibin | 0.030 | 0.030 |
| Jinan | 0.990 | 0.990 | Dongying | 0.130 | 0.510 | Jinchang | 0.040 | 0.020 |
| Dongguan | 1.000 | 0.990 | Weihai | 0.040 | 0.510 | Xinyu | 0.040 | 0.020 |
| Ningbo | 1.000 | 0.990 | Shijiazhuang | 0.120 | 0.470 | Daqing | 0.020 | 0.020 |
| Zhengzhou | 1.000 | 0.990 | Urumqi | 0.060 | 0.410 | Meishan | 0.030 | 0.020 |
| Xiamen | 0.970 | 0.980 | Quanzhou | 0.030 | 0.410 | Deyang | 0.030 | 0.020 |
| Hefei | 0.850 | 0.970 | Yangzhou | 0.980 | 0.350 | Jingdezhen | 0.020 | 0.020 |
| Hefei | 0.920 | 0.970 | Lishui | 0.010 | 0.330 | Qinhuangdao | 0.020 | 0.020 |
| Jinhua | 0.780 | 0.960 | Ordos | 0.200 | 0.330 | Ningde | 0.000 | 0.020 |
| Tianjin | 0.850 | 0.950 | Haikou | 0.010 | 0.320 | Yuxi | 0.000 | 0.010 |
| Jiaxing | 0.350 | 0.950 | Quzhou | 0.010 | 0.320 | Longyan | 0.000 | 0.010 |
| Changzhou | 0.990 | 0.950 | Weifang | 0.010 | 0.270 | Xuancheng | 0.030 | 0.010 |
| Zhuhai | 1.000 | 0.940 | Taizhou | 0.020 | 0.250 | Xiangtan | 0.000 | 0.010 |
| Shaoxing | 0.510 | 0.920 | Maanshan | 0.370 | 0.250 | Lianyungang | 0.000 | 0.010 |
| Wenzhou | 0.990 | 0.900 | Zibo | 0.040 | 0.210 | Liuzhou | 0.000 | 0.010 |
| Taizhou | 0.760 | 0.880 | Baotou | 0.010 | 0.210 | Zunyi | 0.000 | 0.010 |
| Huzhou | 0.030 | 0.860 | Zhuzhou | 0.000 | 0.190 | Jining | 0.000 | 0.010 |
| Fuzhou | 1.000 | 0.800 | Keramayi | 0.250 | 0.100 | Binzhou | 0.040 | 0.010 |
| Nantong | 0.990 | 0.790 | Linyi | 0.000 | 0.100 | Xinxiang | 0.030 | 0.010 |
References
- Farndale, E.; Beamond, M.; Corbett-Etchevers, I.; Xu, S. Accessing host country national talent in emerging economies: A resource perspective review and future research agenda. J. World Bus. 2022, 57, 101256. [Google Scholar] [CrossRef]
- Verginer, L.; Riccaboni, M. Talent goes to global cities: The world network of scientists’ mobility. Res. Policy 2021, 50, 104127. [Google Scholar] [CrossRef] [PubMed]
- Czaika, M.; Parsons, C.R. The Gravity of High-Skilled Migration Policies. Demography 2017, 54, 603–630. [Google Scholar] [CrossRef]
- Jiang, X.; Fu, W.; Li, G. Can the Improvement of Living Environment Stimulate Urban Innovation?—Analysis of High-Quality Innovative Talents and Foreign Direct Investment Spillover Effect Mechanism. J. Clean. Prod. 2020, 255, 120212. [Google Scholar] [CrossRef]
- Yang, Z.; Pan, Y. Human capital, housing prices, and regional economic development: Will “vying for talent” through policy succeed? Cities 2020, 98, 102577. [Google Scholar] [CrossRef]
- Luo, J.; Zhu, K. The Influential Factors on the Attraction of Outstanding Scientific and Technological Talents in Developed Cities in China. Sustainability 2023, 15, 6214. [Google Scholar] [CrossRef]
- Favilukis, J.; Mabille, P.; Van Nieuwerburgh, S. Affordable Housing and City Welfare. Rev. Econ. Stud. 2023, 90, 293–330. [Google Scholar] [CrossRef]
- Ewers, M.C.; Khattab, N.; Babar, Z.; Madeeha, M. Skilled migration to emerging economies: The global competition for talent beyond the West. Globalizations 2022, 19, 268–284. [Google Scholar] [CrossRef]
- Khatiwada, J.; Muzembo, B.A.; Wada, K.; Ikeda, S. The effect of perceived social support on psychological distress and life satisfaction among Nepalese migrants in Japan. PLoS ONE 2021, 16, e0246271. [Google Scholar] [CrossRef]
- Laukova, D.; Bernard, A.; Nguyen, T.; Sigler, T. The role of visa class in the location choices of immigrants in Australia at the regional and neighbourhood scales. J. Popul. Res. 2022, 39, 201–231. [Google Scholar] [CrossRef]
- Zhang, B.; Ding, J. Analysis of the impact of China’s talent ecosystem on the agglomeration effect of highly educated talents. Res. Manag. 2022, 43, 24–33. [Google Scholar]
- Wang, Y.; Zhu, Z.; Wang, Z.; Xu, Q.; Zhou, C. Household registration, land property rights, and differences in migrants’ settlement intentions—A regression analysis in the Pearl River Delta. Land 2021, 11, 31. [Google Scholar] [CrossRef]
- Yeh, X.; Chen, W. Research on the comprehensive attractiveness of China’s cities to scientific and technological innovation talents—Construction and empirical evidence of evaluation index system based on the theory of comfort objects. Res. Sci. 2019, 08, 1375–1384. [Google Scholar] [CrossRef]
- Kravariti, F.; Johnston, K. Talent management: A critical literature review and research agenda for public sector human resource management. Public Manag. Rev. 2020, 22, 75–95. [Google Scholar] [CrossRef]
- Huang, Y.; Li, K.; Li, P. Innovation ecosystems and national talent competitiveness: A country-based comparison using fsQCA. Technol. Forecast. Soc. Change 2023, 194, 122733. [Google Scholar] [CrossRef]
- Kumar, S.; Sahoo, S.; Lim, W.M.; Kraus, S.; Bamel, U.K. Fuzzy-set qualitative comparative analysis (fsQCA) in business and management research: A contemporary overview. Technol. Forecast. Soc. Change 2022, 178, 121599. [Google Scholar] [CrossRef]
- Li, Z.; Zhang, M. What kind of macro-ecological environment affects the concentration of scientific and technological talents: A qualitative comparative analysis of fuzzy sets based on 31 provinces in mainland China. Sci. Technol. Prog. Countermeas. 2022, 39, 131–139. [Google Scholar] [CrossRef]
- Fran, D.; Richard, S. Where does all the talent flow? Migration of young graduates and nongraduates, Canada 1996–2001. Can. Geogr./Le Géographe Can. 2010, 54, 305–323. [Google Scholar]
- Papamitsiou, Z.; Pappas, I.O.; Sharma, K.; Giannakos, M.N. Utilizing Multimodal Data Through fsQCA to Explain Engagement in Adaptive Learning. IEEE Trans. Learn. Technol. 2020, 13, 689–703. [Google Scholar] [CrossRef]
- Glaesser, J. Analysing causal asymmetry: A comparison of logistic regression and Qualitative Comparative Analysis (QCA). Int. J. Soc. Res. Methodol. 2023, 27, 289–300. [Google Scholar] [CrossRef]
- Furnari, S.; Crilly, D.; Misangyi, V.F.; Greckhamer, T.; Fiss, P.C.; Aguilera, R.V. Capturing causal complexity: Heuristics for configurational theorizing. Acad. Manag. Rev. 2021, 46, 778–799. [Google Scholar] [CrossRef]
- Ran, J.; Cheng, H. A study on the configuration path to enhance the attractiveness of urban talents from the perspective of talent ecology—Based on the fuzzy set qualitative comparative analysis method. J. Chongqing Univ. (Soc. Sci. Ed.) 2023, 29, 151–164. [Google Scholar]
- Arel-Bundock, V. The Double Bind of Qualitative Comparative Analysis. Sociol. Methods Res. 2022, 51, 963–982. [Google Scholar] [CrossRef]
- Cooper, B.; Glaesser, J. Exploring the robustness of set theoretic findings from a large n fsQCA: An illustration from the sociology of education. Int. J. Soc. Res. Methodol. 2016, 19, 445–459. [Google Scholar] [CrossRef]
- Thiem, A.; Mkrtchyan, L. Case-to-factor Ratios and Model Specification in Qualitative Comparative Analysis. Field Methods 2024, 36, 52–68. [Google Scholar] [CrossRef] [PubMed]
- Kraus, S.; Ribeiro-Soriano, D.; Schussler, M. Fuzzy set qualitative comparative analysis (fsQCA) in entrepreneurship and innovation research–The rise of a method. Int. Entrep. Manag. 2018, 14, 15–33. [Google Scholar] [CrossRef]
- Ide, T.; Mello, P.A. QCA in International Relations: A Review of Strengths, Pitfalls, and Empirical Applications. Int. Stud. Rev. 2022, 24, viac008. [Google Scholar] [CrossRef]
- Du, Y.Z.; Li, J.X.; Liu, Q.C.; Zhao, S.T.; Chen, K.W. Configuration Theory and QCA Methods from a Complex Dynamic Perspective: Research Progress and Future Directions. Manag. World 2021, 37, 180–197+12–13. [Google Scholar] [CrossRef]
- Niessen, C. Longitudinal QCA: Integrating Time Through Change-Based Intervals (CBIs) and a Flexible Lag Condition (FLC). Sociol. Methods Res. 2023, 53, 1846–1872. [Google Scholar] [CrossRef]
- Dong, Z.H.; Jiang, P.; Dai, Z.L.; Chi, R. What kind of urban brand ecology attracts talent best? Grey configuration analysis of 98 Chinese cities. Grey Syst.-Theory Appl. 2024, 14, 770–788. [Google Scholar] [CrossRef]
- Nasi, G.; Choi, H.; Cucciniello, M.; Christensen, R.K. A systematic literature review of city competitiveness: A 30-year assessment and future agenda for public administration. Public Manag. Rev. 2022, 25, 1562–1586. [Google Scholar] [CrossRef]
- MacLachlan, I.; Gong, Y. Community formation in talent worker housing: The case of Silicon Valley talent apartments, Shenzhen. Urban Geogr. 2023, 44, 707–728. [Google Scholar] [CrossRef]
- Fan, Q.D.; Li, X.F.; Li, H. Crowd Gathering and Thermal Comfort Research in Different Park Shading Spaces. Sustainability 2022, 14, 2687. [Google Scholar] [CrossRef]
- Lin, S.Y.; Liu, J. Has excess epidemic prevention changed Chinese students’ willingness to study abroad: Three rounds of the same volume survey based on the new “push-pull” theory. Humanit. Soc. Sci. Commun. 2023, 10, 662. [Google Scholar] [CrossRef]
- Shen, Y.; Li, B. Policy coordination in the talent war to achieve economic upgrading: The case of four Chinese cities. Policy Stud. 2022, 43, 443–463. [Google Scholar] [CrossRef]
- Olya, H.; Kim, N.; Kim, M.J. Climate change and pro-sustainable behaviors: Application of nudge theory. J. Sustain. Tour. 2023, 32, 1077–1095. [Google Scholar] [CrossRef]
- Hsieh, C.T.; Hurst, E.; Jones, C.I.; Klenow, P.J. The Allocation of Talent and US Economic Growth. Econometrica 2019, 87, 1439–1474. [Google Scholar] [CrossRef]
- Liu, Y.; Deng, W.; Song, X. Influence factor analysis of migrants’ settlement intention: Considering the characteristic of city. Appl. Geogr. 2018, 96, 130–140. [Google Scholar] [CrossRef]
- Li, Q.; Xie, Z. Spatial Distribution of Young Mobile Talents and Influencing Factors of Willingness to Stay-Based on 2017 National Mobile Population Dynamic Monitoring Data. Econ. Geogr. 2020, 40, 27–35. [Google Scholar]
- Xu, N.; Guo, J. Research on the macro-influencing factors of scientific and technological talent mobility. Res. Sci. 2019, 37, 414–421+461. [Google Scholar]
- Agag, G.; Abdelmoety, Z.H.; Eid, R. Understanding the Factors Affecting Travel Avoidance behavior During the COVID-19 Pandemic: Findings From a Mixed Method Approach. J. Travel Res. 2023, 63, 858–882. [Google Scholar] [CrossRef]
- Xu, H. Report on the Competitiveness of Chinese Cities. No. 19, Megacities, Megacities: Health Benchmarks and Ideal Benchmarks; China Social Sciences Press: Beijing, China, 2021. [Google Scholar]
- Meyers, M.C.; van Woerkom, M.; Paauwe, J.; Dries, N. HR managers’ talent philosophies: Prevalence and relationships with perceived talent management practices. Int. J. Hum. Resour. Manag. 2020, 31, 562–588. [Google Scholar] [CrossRef]
- Kaplan, S.; Fisher, Y. The role of the perceived community social climate in explaining knowledge-workers staying intentions. Cities 2021, 111, 103105. [Google Scholar] [CrossRef]
- Li, K.; Qin, Y.; Wu, J. Recent housing affordability in urban China: A comprehensive overview. China Econ. Rev. 2020, 59, 101362. [Google Scholar] [CrossRef]
- Yan, Y.; Ye, N. Identity and Participation—A Study on the Logic of Community Public Cultural Life of Urban Residents. Sociol. Res. 2019, 34, 147–170+245. [Google Scholar]
- Zhang, M.; Yan, X. Does informal homeownership reshape skilled migrants’ settlement intention? Evidence from Beijing and Shenzhen. Habitat Int. 2022, 119, 102495. [Google Scholar] [CrossRef]
- Greener, I. Tolerance in QCA: Moving debates on design, calibration, analysis, and interpretation in QCA forward in macrocomparative resarch. Int. J. Soc. Res. Methodol. 2023, 27, 189–201. [Google Scholar] [CrossRef]
- Ravndal, J.A. A social scientific introduction to set theory and Qualitative Comparative Analysis (QCA). Tidsskr. Samfunnsforskning 2023, 64, 22–44. [Google Scholar] [CrossRef]
- Schneider, C.Q.; Rohlfing, I. Case Studies Nested in Fuzzy-set QCA on Sufficiency: Formalizing Case Selection and Causal Inference. Sociol. Methods Res. 2016, 45, 526–568. [Google Scholar] [CrossRef]
- Dou, Z.X.; Sun, Y.M. System Identification of Enterprise Innovation Factor Combinations-A Fuzzy-Set Qualitative Comparative Analysis Method. Systems 2024, 12, 53. [Google Scholar] [CrossRef]
- Ni, P.F.; Xu, H.D.; Hou, Q.H.; Guo, J.; Guo, J.H. China Urban Competitiveness Report No. 19: Megacities and Super Cities—Health Benchmarks and Ideal Benchmarks; China Social Sciences Press: Beijing, China, 2021. [Google Scholar]
- Ren Zeping’s Team. China Urban Talent Attraction Ranking: 2022. Zhaopin Recruitment Zeping Macro. 2022. Available online: https://finance.sina.com.cn/zl/china/2022-05-17/zl-imcwipik0221829.shtml (accessed on 8 October 2023).
- Greckhamer, T.; Furnari, S.; Fiss, P.C.; Aguilera, R.V. Studying configurations with qualitative comparative analysis: Best practices in strategy and organization research. Strateg. Organ. 2018, 16, 482–495. [Google Scholar] [CrossRef]
- Gu, H.Y.; Wang, J.H.; Ling, Y.K. Economic geography of talent migration and agglomeration in China: A dual-driver framework. China Econ. Rev. 2024, 86, 102180. [Google Scholar] [CrossRef]
- Yu, Z.L.; Zhang, H.; Tao, Z.L.; Liang, J.S. Amenities, economic opportunities and patterns of migration at the city level in China. Asian Pac. Migr. J. 2019, 28, 3–27. [Google Scholar] [CrossRef]
- Lian, X.L.; Liu, Z.L. Inclusive policy environment or quality of life: Understanding city preferences of young talents based on a discrete choice experiment with university students in China. Int. J. Urban Sci. 2025, 1–20. [Google Scholar] [CrossRef]
- Liu, Y.; Huang, C.Y.; Zhang, F.F.; Ma, H.T. Locational preferences of high-level overseas talent returning to China: Evidence from microdata analysis. Popul. Space Place 2023, 29, e2650. [Google Scholar] [CrossRef]
- Marchesani, F.; Masciarelli, F.; Bikfalvi, A. Smart city as a hub for talent and innovative companies: Exploring the (dis) advantages of digital technology implementation in cities. Technol. Forecast. Soc. Change 2023, 193, 122636. [Google Scholar] [CrossRef]
- Wei, H.; Wei, Z. Research on the Synergy of Regional Innovation System of Beijing-Tianjin-Hebei: Based on Policy Text. Urban Stud. 2023, 30, 91–99. [Google Scholar]
Disclaimer/Publisher’s Note: The statements, opinions and data contained in all publications are solely those of the individual author(s) and contributor(s) and not of MDPI and/or the editor(s). MDPI and/or the editor(s) disclaim responsibility for any injury to people or property resulting from any ideas, methods, instructions or products referred to in the content. |
© 2025 by the authors. Licensee MDPI, Basel, Switzerland. This article is an open access article distributed under the terms and conditions of the Creative Commons Attribution (CC BY) license (https://creativecommons.org/licenses/by/4.0/).