Article

Pathway to Smart Aviation: Identifying and Prioritizing Key Factors for Smart Aviation Development Using the Fuzzy Best–Worst Method

School of Aeronautics, Shandong Jiaotong University, Jinan 250357, China
*
Author to whom correspondence should be addressed.
Systems 2025, 13(4), 291; https://doi.org/10.3390/systems13040291
Submission received: 17 February 2025 / Revised: 31 March 2025 / Accepted: 14 April 2025 / Published: 15 April 2025
(This article belongs to the Section Systems Practice in Social Science)

Abstract

:
Smart aviation has received significant attention from various stakeholders in China as its advancement holds crucial implications for the aviation industry, and there is a growing need for aviation authorities to assess the extent of its development. The evaluation of smart aviation development processes rely on various factors that reflect the smart aviation development level, and these factors could help pave the way for the successful development of smart aviation. However, few studies have focused on the identification and prioritization of the key factors for smart aviation development, especially considering the uncertain nature of the problem. To this end, this study employs the grounded theory and the fuzzy best–worst method (BWM) to identify and prioritize the factors for smart aviation development. Through the utilization of grounded theory, 37 factors are determined to be critical for smart aviation development. Then, the fuzzy BWM is employed to evaluate and prioritize the identified factors considering their importance. The findings of this study reveal that the 4D track development level, proportion of R&D investment, and data resources sharing degree are the most influential factors for smart aviation development. By integrating grounded theory, fuzzy sets, and BWM, this study identifies and prioritizes the significant factors for smart aviation for the first time. In general, the outcomes of this study hold the potential to guide practitioners in focusing on the pivotal factors that contribute to smart aviation development.

1. Introduction

Civil aviation plays a pivotal role in modern transportation, particularly in facilitating passenger travel. In recent decades, the integration of advanced technologies, such as the Internet of Things (IoT), artificial intelligence (AI), and cloud computing, has propelled the evolution of smart aviation [1,2,3]. The increasing demand for air travel, coupled with the exponential growth of passenger volume, has driven the need for advanced technological solutions to enhance operational efficiency. The advent of digitization has fundamentally transformed the aviation landscape, giving rise to smart aviation as a comprehensive approach to modernizing aviation systems. By leveraging innovative digital technologies, smart aviation not only improves operational efficiency, safety, and security but also significantly enhances passenger satisfaction through more personalized and efficient services [4,5]. Consequently, the concept of smart aviation represents a transformative opportunity to revolutionize aerospace engineering and elevate passenger experience to unprecedented levels.
In China, smart aviation is increasingly seen as a strategic pathway for future development in the aviation sector. It is defined as the adoption and integration of emerging digital and intelligent technologies—such as AI, big data analytics, IoT, and cloud computing—into aviation operations and passenger service management with the primary goal of improving efficiency and passenger experience, which reflects the Chinese aviation industry’s commitment to leveraging technological innovation to streamline operations while also prioritizing the needs and expectations of passengers. To achieve this transformation, various stakeholders, including airports, air traffic control, and regulatory authorities, have actively pursued initiatives aimed at the widespread adoption of smart aviation practices. As smart aviation continues to develop, assessing its impact and identifying the critical factors that influence its progress have become essential tasks for the Chinese aviation authorities [6,7].
When conducting assessments of smart aviation, multiple factors need to be taken into consideration, making it a complex multi-criteria decision-making (MCDM) problem, particularly in the presence of uncertainty and subjectivity [8,9,10,11]. Previous studies have addressed MCDM problems in aviation. For example, Markatos and Pantelakis [12] combined the analytic hierarchy process (AHP) with a weighted addition model, and introduced a novel MCDM method that considers different aspects for assessing aircraft. Chai and Zhou [13] investigated a sustainable alternative aviation fuel selection problem, and presented a comprehensive MCDM framework that integrated a comprehensive criteria system, interval-valued triangle fuzzy numbers (IVTFNs) and TOPSIS methods for selecting sustainable alternative aviation fuel from four alternative aviation fuels. Focusing on assessing and comparing aircraft for sustainable aviation, Lee et al. [14] introduced an integrated MCDM approach that combined the decision-making trial and evaluation laboratory (DEMATEL), analytic network processes (ANPs), and zero-one goal programming (ZOGP) for green aviation fleet program management strategy selection. Tsafarakis et al. [15] proposed a novel MCDM method based on ordinal regression to measure passenger satisfaction, considering 24 factors across six aspects. These studies highlight the crucial aspect of identifying decision factors in MCDM for aviation, as the decision-making process can be influenced by numerous factors. However, limited research has been conducted on the identification and evaluation of decision factors specifically for smart aviation. Given the involvement of multiple stakeholders, properly identifying and evaluating these factors holds great significance, which could help determine key factors that can be used to assess the progress of smart aviation and support its development in China.
Numerous research studies have explored the identification and evaluation of various factors in different fields [16,17,18,19]. For instance, Malek and Desai [20] identified 39 barriers to sustainable manufacturing through a literature review, and employed the best–worst method (BWM) to evaluate and prioritize these barriers, highlighting economic and managerial barriers as the most obstructive barriers. In the software industry, Rafi et al. [21] focused on the implementation of DevOps (development and operations units) and identified eighteen DevOps security challenges, and they evaluated and prioritized these challenges using the PROMETHEE approach. Singh et al. [22] proposed a novel approach for analyzing environmental Lean Six Sigma enablers, where 30 enablers were identified through importance-index analysis and the corrected item minus total correlation method, and the enablers were ranked using the BWM, with strategic-based enablers identified as the leading factors followed by environmental-based enablers. Similarly, Ikram et al. [23] identified 26 barriers for the integrated management system (IMS) implementation, where the AHP is combined with the grey TOPSIS method to evaluate and rank different barriers, with economic and implementation sub-barriers identified as the most significant barriers. However, there is a lack of research focusing specifically on the prioritization of factors for smart aviation. This study aims to address this gap by studying the identification and prioritization of factors for smart aviation. The primary emphasis of this study is on how these technological advancements help improve operational efficiency within aviation processes and significantly enhance passenger experience through personalized, seamless, and efficient services. The following research questions are developed to tackle this problem:
RQ1: What specific operational factors significantly influence improvements in operational efficiency and passenger experience in smart aviation development?
RQ2: How can these influential factors be effectively prioritized to understand their impact clearly and systematically?
RQ3: What are the key factors that most strongly enhance operational efficiency and passenger experience in the context of smart aviation?
To address these research questions, several challenges need to be addressed. Firstly, the identification of factors for smart aviation development relies on extracting relevant information from various documents, including regulations, recommendations, and internal memos, and effectively navigating these sources and discerning the key factors from them poses a significant challenge. Secondly, many factors involved in smart aviation development may exhibit interconnectedness or interdependencies, and it is important to capture and account for these relationships while evaluating and prioritizing the factors. Additionally, the information provided by experts, who play a crucial role in this process, can be subjective or uncertain, and finding appropriate methods to capture and incorporate uncertainty into the evaluation process is another critical challenge.
Considering the above challenges and research gaps, the motivations for this study are as follows:
(1) Smart aviation is considered the forefront of aviation development in China, making it crucial to effectively evaluate the progress of smart aviation. However, due to the absence of a comprehensive evaluation index system for smart aviation development, there is a need to identify and prioritize the factors that are significant to smart aviation development. This study aims to provide valuable references for the development of smart aviation in China.
(2) Limited research on smart aviation development factors makes it challenging to solely rely on previous studies for their identification. Consequently, a more systemic approach is required to accurately capture and determine the key factors. This study aims to adopt such an approach to ensure a comprehensive and accurate identification of factors for smart aviation development.
(3) Given the multiple factors involved in smart aviation development, traditional pairwise comparisons using the AHP can lead to an overwhelming number of comparisons. Therefore, an effective approach that represents the comparison information among different factors with fewer pairwise comparisons is needed. This study aims to utilize a more effective and efficient methodology for factor prioritization.
(4) The prioritization of factors relies on expert judgments, which can be subjective, linguistic, and uncertain in nature, and representing such complex and uncertain information using crisp numbers is insufficient. Therefore, there is a need for a more reliable and flexible approach to represent the uncertain judgments of experts. This study aims to address this challenge by employing appropriate techniques to capture and incorporate the uncertainties in expert judgments.
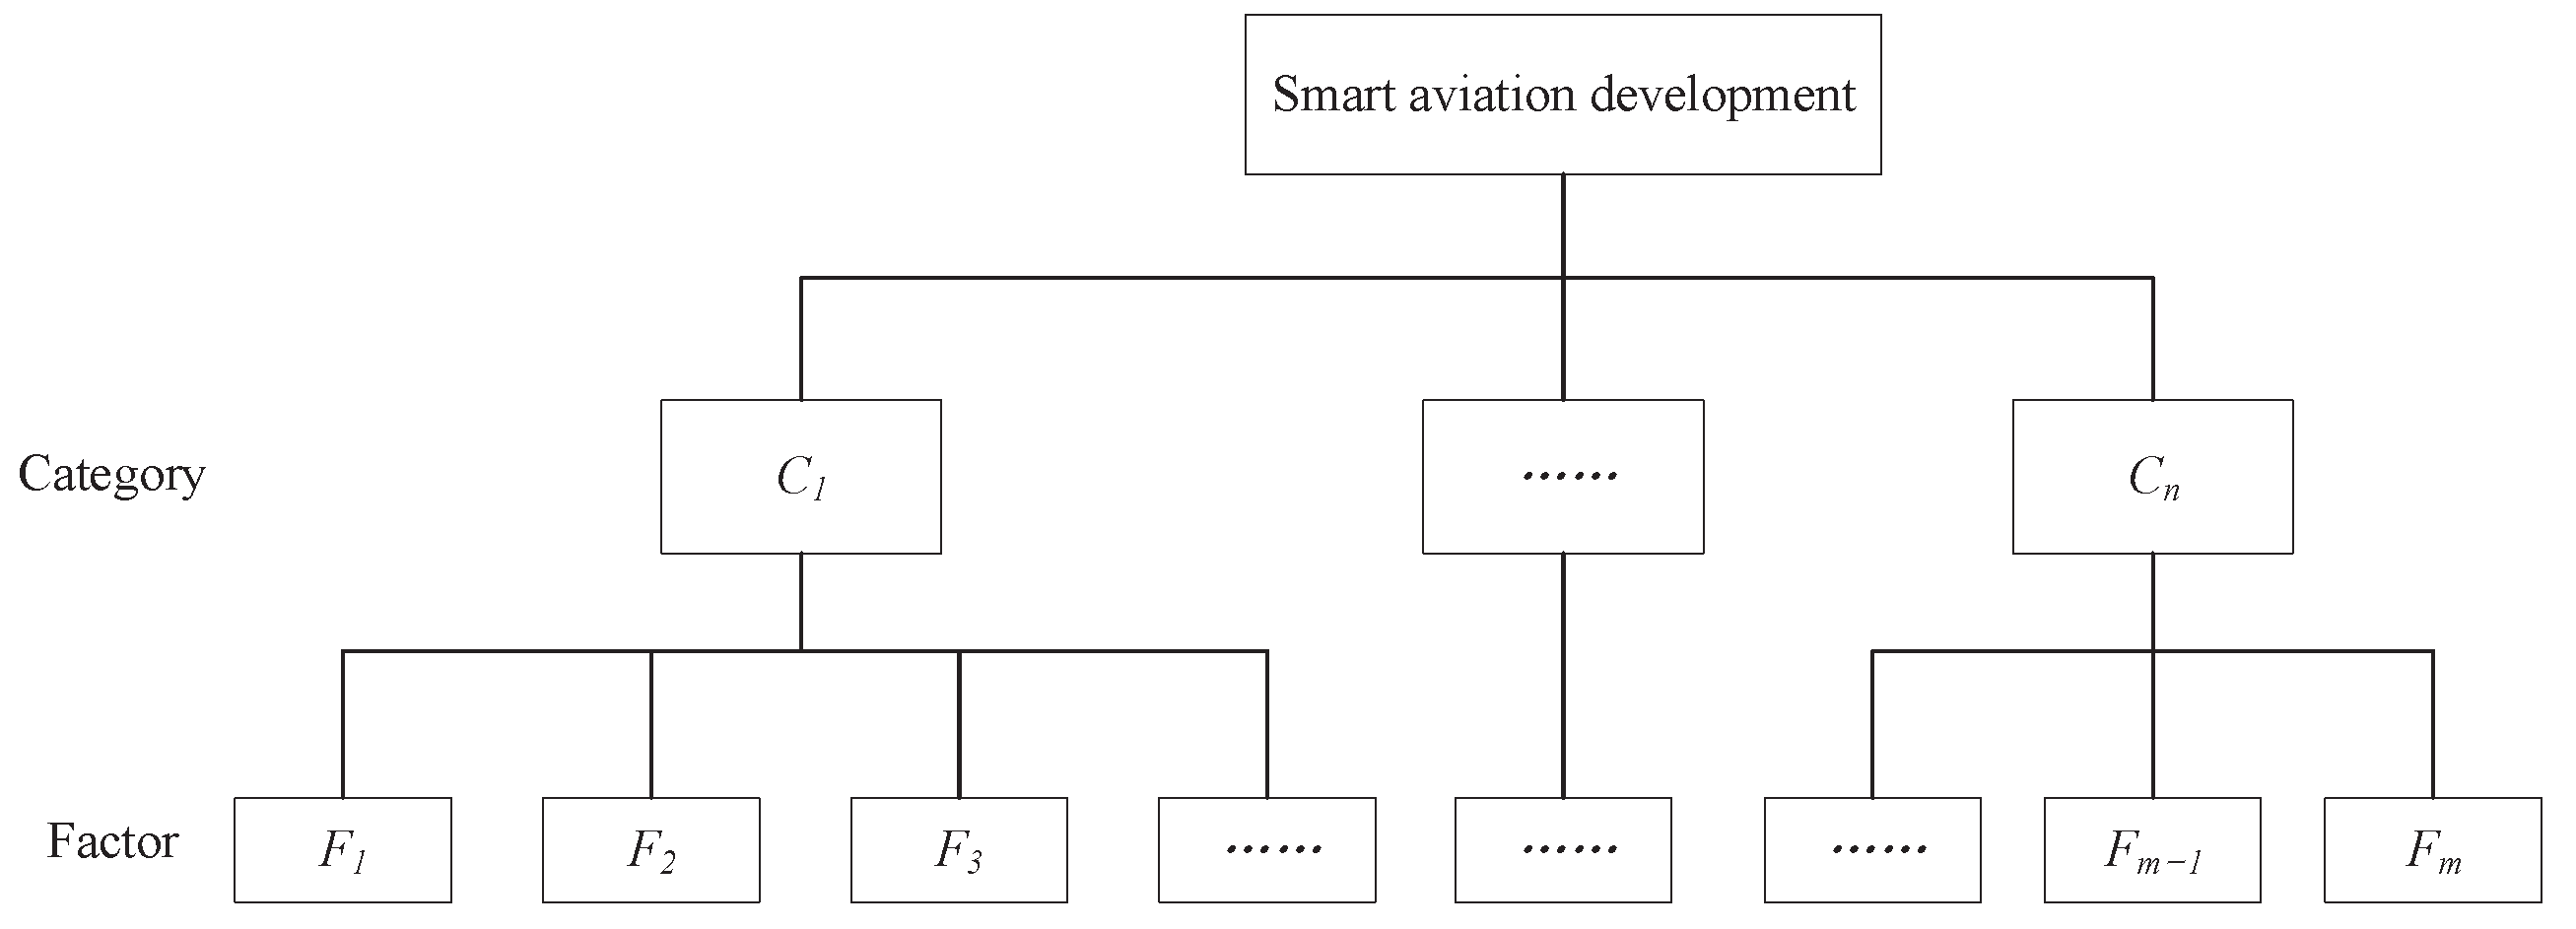
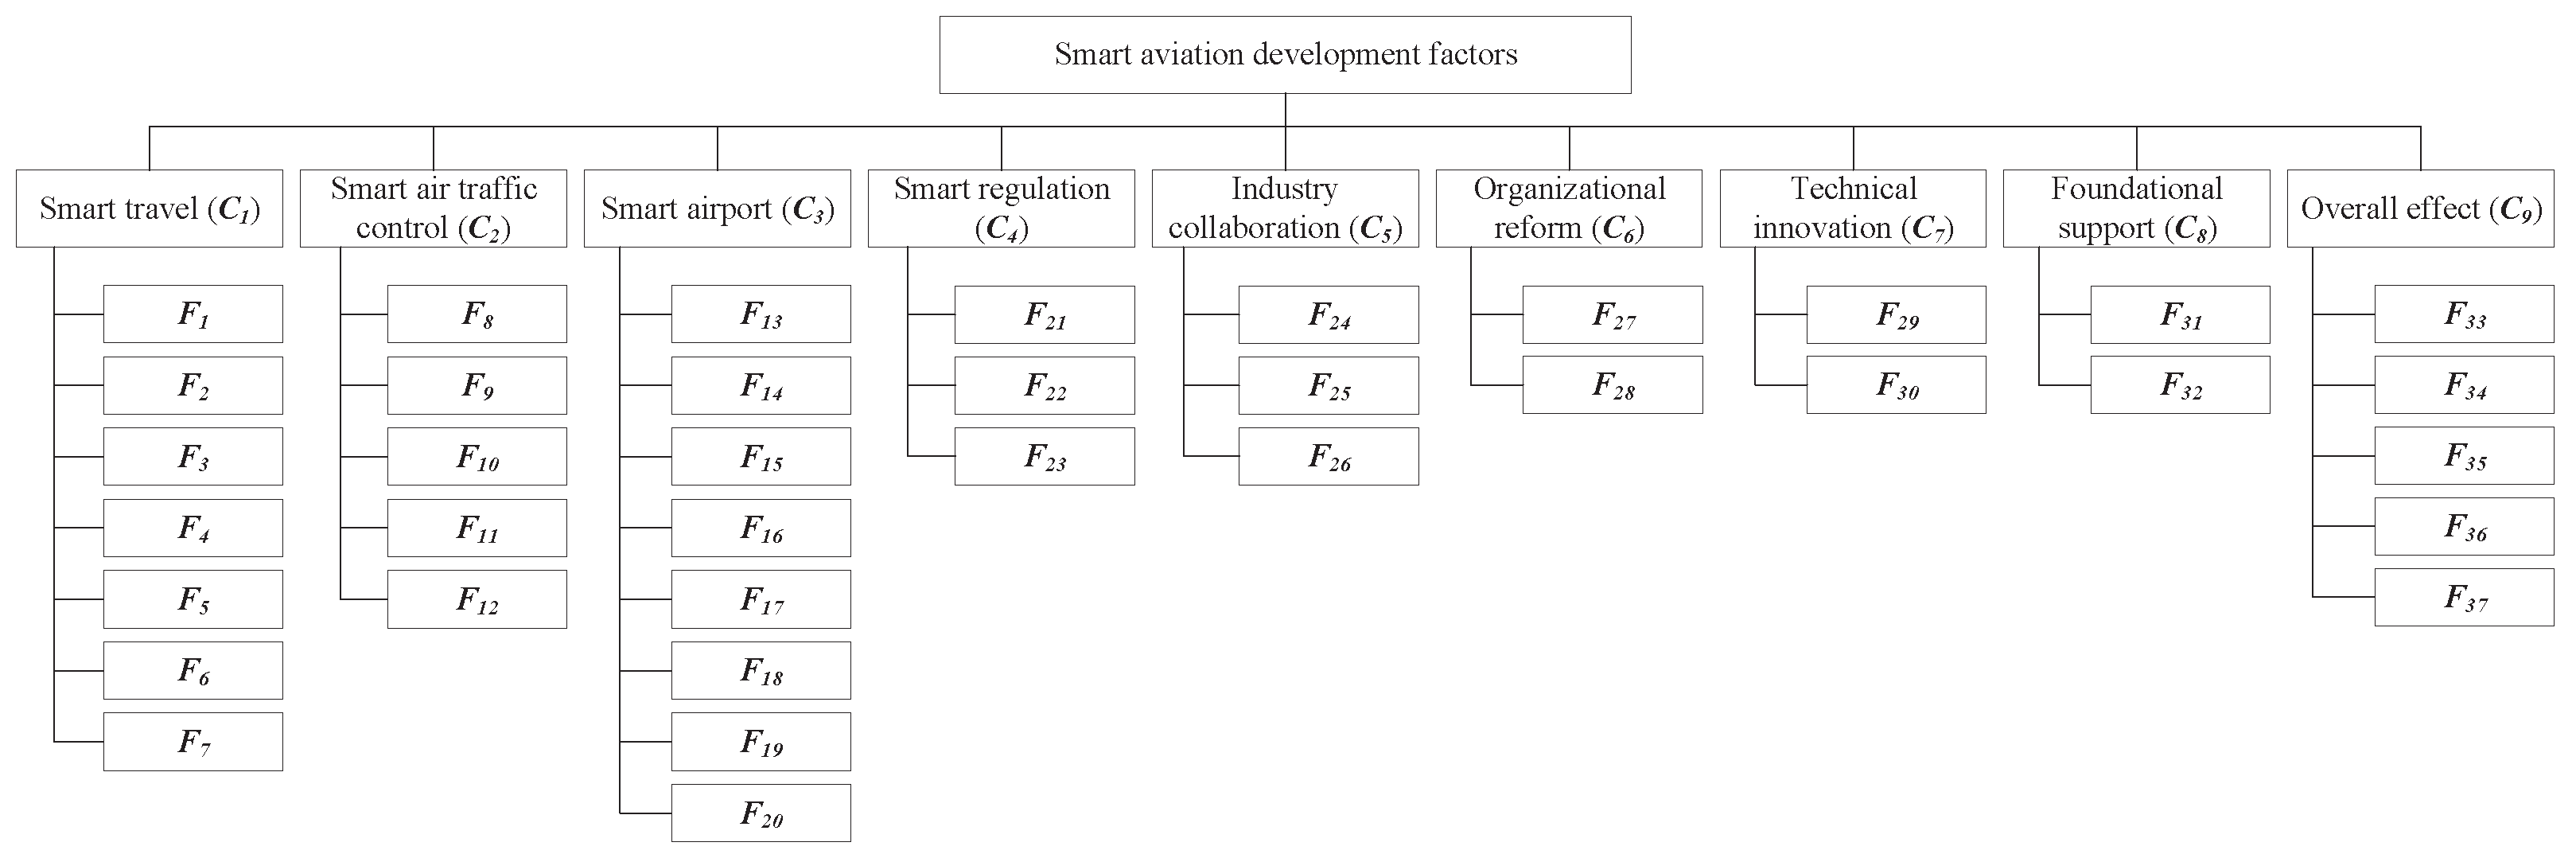
Based on the aforementioned motivations, this paper presents an integrated decision approach based on grounded theory, fuzzy sets, and the best–worst method (BWM) to identify and prioritize factors for smart aviation development in China. By employing this approach, a total of 37 factors are identified and categorized into 9 categories through grounded analysis. These factors serve as a comprehensive and standardized framework to guide smart aviation development in China.
Furthermore, according to the judgments provided by experts, the fuzzy BWM is utilized to assign weights to the identified factors. Through this evaluation process, all 37 factors are ranked, enabling the determination of the most influential factors for smart aviation development. This prioritization of factors aids practitioners and decision-makers in focusing their efforts on the most critical aspects during the development of smart aviation. The main contributions of this study are as follows:
(1) Through grounded analysis, this study successfully identifies and categorizes 37 factors that play a significant role in smart aviation development. These factors provide a standardized foundation and support for the development of smart aviation in China.
(2) By employing the fuzzy BWM and incorporating expert judgments, this study ranks all 37 factors based on their weights. This ranking enables the prioritization of the factors, offering valuable insights to practitioners and decision-makers regarding the prioritization of factors during the development of smart aviation.
The remainder of this paper is organized as follows. Section 2 describes the detailed research process of this study. Section 3 presents the results of this study, and Section 4 provides further analysis. Finally, some concluding remarks are given in Section 5.

2. Research Framework

In this section, the research framework of this study is presented, which mainly consists of two phases: the identification of factors based on grounded theory and the prioritization of factors based on fuzzy BWM. The process of the research framework is presented in Figure 1, detailed as follows.

2.1. Identification of Factors for Smart Aviation

Analyzing the factors that influence smart aviation is a complex task, given the interrelationships between these factors. Additionally, the limited existing research on smart aviation further complicates the identification of relevant factors from previous studies. In order to address these challenges and accurately identify the factors that impact smart airport development, this study employs grounded theory analysis based on a comprehensive review of relevant documents [24,25,26,27,28].
Step 1: Factor identification
In this study, the first step includes breaking down the collected information in order to compare different incidents and identify similarities and differences. During this process, various labels are determined by analyzing the initial collected information to describe the development level of smart aviation. Subsequently, as different labels often demonstrate interconnections, grouping similar labels helps identify different concepts that collectively reflect specific aspects of smart aviation development. Thus, the factors are discerned by analyzing the interrelationships among the associated concepts, and the factors are identified by analyzing related concepts for smart aviation.
Step 2: Category identification
After identifying the initial factors, the categories are determined in this step, where the identified initial categories are further refined into core categories. In this stage, the basic information obtained from the initial coding is categorized into core categories based on the analysis of the factors identified during the initial coding stage. As different factors may exert similar influences on smart aviation development, these factors can be considered to share similar characteristics and grouped together to generate more general and abstract core categories. By identifying core categories, which represent different aspects of smart aviation, a deeper understanding of the overall structure and essential elements of smart aviation development can be achieved.
Step 3: Relationship determination
After determining the factors and categories, it is crucial to produce a grounded and explanatory result that accurately reflects the gathered information. To achieve this, advanced coding is conducted to identify the relationships among the factors and categories identified in the previous steps. During advanced coding, concepts that have reached the category stage become more abstract and represent collective stories or patterns observed from the initial information. These concepts are further synthesized into highly conceptual terms, and the relationships between the factors and the categories are established.
In this study, the storyline technique introduced by Birks and Mills [29] is utilized to determine the relationships between the factors and the categories, where a hierarchical structure that represents the connections and dependencies among the factors and categories is established. The hierarchical structure, as shown in Figure 2, provides a visual representation of factors influencing smart aviation development.

2.2. Factors for Smart Aviation Development

Through the grounded theory analysis conducted in this study, 37 factors are identified in total, categorized into nine categories. These categories encompass various aspects of smart aviation development, which include smart travel, smart air traffic control, smart airport, smart regulation, industry collaboration, organizational reform, technical innovation, foundational support, and overall effect, as shown in Table 1.

2.3. Method

2.3.1. Fuzzy Set

Fuzzy set theory is one of the most widely used knowledge representation methods for its ability to handle uncertainty in human knowledge [30], and it has found wide application in MCDM problems [31]. In fuzzy set theory, linguistic terms are represented using fuzzy numbers, and a membership function is used to map these fuzzy numbers to corresponding values between 0 and 1. Among different types of fuzzy numbers, the triangular fuzzy number is the most commonly used. It is defined as a triplet A ˜ = ( l , m , u ) , where l, m, and u represent the lower, middle, and upper values, respectively. The membership function μ A ˜ of a triangular fuzzy number is defined as follows:
μ A ˜ = 0 x < l x l m l l x < m u x u m m x < u 0 x u
where l, m, and u are the lower, medium, and upper values of the fuzzy number. Figure 3 shows the corresponding triangular fuzzy number.
Let A ˜ i = ( l i , m i , u i ) and A ˜ j = ( l j , m j , u j ) be two triangular fuzzy numbers and λ be a real number; then, there is
A ˜ i + A ˜ j = ( l i + l j , m i + m j , u i + u j ) A ˜ i A ˜ j = ( l i l j , m i m j , u i u j ) A ˜ i × A ˜ j = ( l i × l j , m i × m j , u i × u j ) λ × A ˜ i = ( λ × l i , λ × m i , λ × u i ) A ˜ i λ = l i λ , m i λ , u i λ

2.3.2. Best–Worst Method

The best–worst method (BWM) is a novel decision-making method that utilizes the pairwise comparisons among the best factor to other factors and other factors to the worst factor to determine the importance and priority of different factors [32]. Compared with other decision-making methods such as the AHP, the BWM could achieve higher consistency with fewer pairwise comparisons, thus reducing the computation cost [33,34,35]. The process of BWM is as follows:
Step 1: Determine the problem
In the first step, the set of factors F = { F 1 , F 2 , , F n } is determined for the problem, where each factor represents a decision element. Normally, the hierarchical structure is used for complex problems.
Step 2: Determine the best and the worst factors
Unlike other methods such as AHP and DEMATEL, the BWM is carried out based on the pairwise comparisons of the best factor against other factors and other factors against the worst factor. Thus, the best factor F B and the worst factor F W are determined in this step.
Step 3: Conduct pairwise comparisons
Based on the best and the worst factors, the pairwise comparisons of the best factor against other factors and other factors against the worst factor can be determined, and the best-to-others vector B O = [ a B 1 , a B 2 , , a B n ] and the others-to-worst vector O W = [ a 1 W , a 2 W , , a n W ] are determined. It is worth noting that the elements in these vectors are normally a number between one and nine, where higher value indicates higher superiority.
Step 4: Rank the factors
In this step, the optimal weight vector ω = ( ω 1 , ω 2 , , ω m ) can be computed by solving the following programming model:
min max i ω B ω i a B i , ω i ω W a i W s . t . i = 1 n ω i = 1 0 ω i 1
Then, the factors can be ranked according to their weights.

2.3.3. Factor Prioritization Approach

To prioritize the identified factors for smart aviation development, this study utilizes the fuzzy BWM to handle the uncertain judgments provided by the experts in this study, as it is well suited for capturing the uncertainty inherent in the judgments of experts [36,37]. Unlike the classical BWM, which deals with crisp numbers, the fuzzy BWM incorporates fuzzy set theory to handle the uncertainty in expert judgments. By using linguistic terms and fuzzy numbers, the fuzzy BWM allows for more flexible and accurate representation of the experts’ subjective judgments. This method enables the modeling and analysis of complex decision-making problems involving uncertainty, ambiguity, and vagueness.
Compared with other commonly used MCDM techniques—such as AHP, TOPSIS, or fuzzy DEMATEL—the fuzzy best–worst method offers distinct advantages. First, it significantly reduces the number of pairwise comparisons required, which minimizes the cognitive burden on experts. Second, it provides higher consistency in decision-making due to the structured pairwise comparison between the best and worst factors. Third, integrating fuzzy logic enables better handling of linguistic uncertainty and expert subjectivity, which are common in smart aviation evaluations. These features make fuzzy BWM a particularly appropriate and efficient method for this study.
For this problem, let F = { F 1 , F 2 , , F n } be the factors for smart aviation development; the procedure of the factor prioritization approach is summarized as follows.
Step 1: Determine the best and the worst factors
Firstly, by analyzing the factors, the most importance factor is determined as the best factor, and the least importance factor is identified as the worst factor.
Step 2: Determine the best-to-other vector
To represent the preference of the best factor ( F B ) towards another factor F i , a triangular fuzzy number f ˜ B i = ( f B i l , f B i m , f B i h ) is used. This fuzzy number captures the degree of preference or importance of F B relative to F i , where f B i l represents the lower value, f B i m represents the middle value, and f B i h represents the upper value of the fuzzy preference degree, and the fuzzy best-to-others vector is obtained as
B O ˜ = [ f ˜ B 1 , f ˜ B 2 , , f ˜ B n ]
It should be noted that to facilitate evaluation, the experts are asked to provide their preference in the form of linguistic terms, namely, “Equally important (EI)”, “Weakly important (WI)”, “Fairly Important (FI)”, “Very important (VI)”, and “Absolutely important (AI)”. These linguistic terms are then converted into corresponding triangular fuzzy numbers, as shown in Table 2.
Clearly, there is f ˜ B B = ( 1 , 1 , 1 ) .
Step 3: Determine the others-to-worst vector
Similarly, the fuzzy others-to-worst vector is obtained as
O W ˜ = [ f ˜ 1 W , f ˜ 2 W , , f ˜ n W ]
where f ˜ i W = ( f i W l , f i W m , f i W h ) denotes the preference of the factor F i over the worst factor F W , and f ˜ W W = ( 1 , 1 , 1 ) .
Step 4: Calculate the optimal weights
In fuzzy BWM, the optimal weights should satisfy the condition such that ω B / ω i f ˜ B i and ω i / ω W f ˜ i W for i = 1 , 2 , , n . Thus, the optimal weights are obtained when the maximum absolute differences ω B ω i f ˜ B i and ω i ω W f ˜ i W are minimum, which can be represented by the following optimization problem:
min max i ω B ω i f ˜ B i , ω i ω W f ˜ i W s . t . i = 1 n ω i = 1 0 ω i 1
Equation (5) is equivalently expressed by the following form:
min ε s . t . ω B f ˜ B i ω i ε ω i f ˜ i W ω W ε i = 1 n ω i = 1 0 ω i 1
which can be written as
min ε s . t . ω B ε f ˜ B i ω i ω B + ε f ˜ B i ω i ω i ε f ˜ i W ω W ω i + ε f ˜ i W ω W i = 1 n ω i = 0 0 ω i 1
By converting the fuzzy constraints into corresponding crisp equivalents, Equation (7) is transformed into the following problem:
min ε s . t . ω B ε f B i m + ( 1 α ) f B i u ω i ω B + ε f B i m ( 1 α ) f B i l ω i ω i ε f i W m + ( 1 α ) f i W u ω W ω i + ε f i W m ( 1 α ) f i W l ω W i = 1 n ω i = 0 0 ω i 1
where α ( 0 α 1 ) is the possibility level.
Clearly, as Equation (8) is a typical linear optimization problem, a unique optimal weight ( ω 1 , ω 2 , , ω n ) and ε could be obtained for any given α .
Step 5: Determine the consistency ratio
In BWM, the consistency ratio (CR) is a measure used to assess the consistency degree of the pairwise comparison matrix. It helps to evaluate the reliability of the judgments made by the experts. In fuzzy BWM, the CR is computed by
C R = ε ζ
where max ζ is the consistency index, as listed in Table 3.

3. Results

In this section, the identified factors for smart aviation development are prioritized using the proposed approach. The identified categories and factors are represented using the hierarchical structure, as illustrated in Figure 4.

Prioritization of the Factors

Step 1: Best and worst factors determination
In this case, the identified categories are considered as separate layers, and for each category, the corresponding factors are evaluated to determine their local weights. The global weights are then calculated by considering the importance of the category. Based on the experts’ opinions, smart airport ( C 3 ) is determined to be the most important category and thus determined to be the best element and organizational reform ( C 6 ) is determined the least important category and is determined to be the worst element. Similarly, the best and worst elements for all nine categories are determined, as listed in Table 4.
Step 2: Best-to-others vectors determination
To evaluate the relative importance of different factors for smart aviation development, pairwise comparisons are carried out. In this study, the judgments of experts on the pairwise comparisons between the best element and other elements, as well as other elements and the worst element, were collected through a questionnaire survey.
The survey instrument (Appendix A) contained detailed questions regarding factor prioritization, designed using standard fuzzy BWM pairwise comparison formats. The experts were selected based on predefined criteria (detailed in Appendix B), ensuring representativeness in smart aviation domains, academic qualifications, and industry experience.
In total, 23 valid responses were collected from experts from Civil Aviation University of China, Northwestern Polytechnical University, Shandong Airlines, etc., for analysis, where five linguistic terms are used to represent the judgments of the experts, as listed in Table 2.
Since there were 23 experts providing their opinions in this study, it is necessary to combine the judgments and obtain comprehensive best-to-others and others-to-worst vectors by aggregating the opinions of the experts. Hence, the aggregated fuzzy preference degree is calculated using a weighted average operator as follows:
P ˜ = 1 n i = 1 n λ i p ˜ i
where n is the number of experts (in this case, n = 23 ), p i is the fuzzy preference degree of the ith expert, and λ i is the weight of the ith expert. Due to the different backgrounds of the experts, the weights of the experts are determined considering their title and experience as follows:
λ i = H i k = 1 n H k
where H i is the weight score of the ith expert and is computed based on Table 5.
To calculate the fuzzy preference degree of the best factor over other factors, the judgments provided by the experts are combined using the weighted average operator. Since there are 10 groups of factors, there are 10 fuzzy best-to-others vectors.
The fuzzy preference relations are presented in Table 6, Table 7, Table 8, Table 9, Table 10, Table 11, Table 12, Table 13, Table 14 and Table 15. Each table represents the fuzzy preference degrees of the best factor over other factors within a specific category or the overall goal, and the fuzzy preference degrees are represented using triangular fuzzy numbers, as explained earlier.
For instance, for C 4 , the best-to-others vector is as follows:
B O ˜ = [ f ˜ 41 , f ˜ 42 , f ˜ 43 ] = [ ( 1.0000 , 1.0000 , 1.0000 ) , ( 1.7727 , 2.0909 , 2.4272 ) , ( 2.1439 , 2.5545 , 2.9681 ) ]
By converting the linguistic terms of different experts into triangular fuzzy numbers and aggregating these numbers, the best-to-others vectors are obtained, which could be used to compute the weights of different factors for smart aviation development.
Step 3: Others-to-worst vectors determination
Similarly, the fuzzy preference degree of other factors to the worst factor is obtained by combining the judgments of the experts, and the others-to-worst vectors are constructed. The others-to-worst vectors are listed in Table 6, Table 7, Table 8, Table 9, Table 10, Table 11, Table 12, Table 13, Table 14 and Table 15.
For instance, for C 4 , the others-to-worst vector is as follows:
O W ˜ = [ f ˜ 1 , f ˜ 2 , f ˜ 3 ] = [ ( 2.2015 , 2.6090 , 3.0545 ) , ( 1.8666 , 2.2818 , 2.7227 ) , ( 1.0000 , 1.0000 , 1.0000 ) ]
Step 4: Consistency ratio calculation
The consistency test is an important step to ensure the reliability of the judgments provided by the experts in the BWM. A CR value less than 0.1 is generally considered acceptable, indicating good consistency. In this study, the CR values of the results are found to be less than 0.1, which suggests that the judgments of the experts are consistent and reliable for the calculation of optimal weights.
Step 5: Local weight calculation
The local weight represents the relative importance of the factor over other factors in the same layer. Hence, the local weights of the factors are determined first. To compute the local weights within each category, the optimization model is constructed based on the best-to-others and others-to-worst vectors by using Equation (8). For instance, the optimization model for calculating the local weights of factors within category C 4 is constructed as follows:
min ε s . t . ω B ε [ 1.0000 + 1.0000 ( 1 α ) ] ω 21 ω B ε [ 2.0909 + 2.4272 ( 1 α ) ] ω 22 ω B ε [ 2.5545 + 2.9681 ( 1 α ) ] ω 23 ω B + ε [ 1.0000 1.0000 ( 1 α ) ] ω 21 ω B + ε [ 2.0909 1.7727 ( 1 α ) ] ω 22 ω B + ε [ 2.5545 2.1439 ( 1 α ) ] ω 23 ω 21 ε [ 2.6090 + 3.0545 ( 1 α ) ] ω W ω 22 ε [ 2.2818 + 2.7227 ( 1 α ) ] ω W ω 23 ε [ 1.0000 + 1.0000 ( 1 α ) ] ω W ω 21 + ε [ 2.6090 2.2015 ( 1 α ) ] ω W ω 22 + ε [ 2.2818 1.8666 ( 1 α ) ] ω W ω 23 + ε [ 1.0000 1.0000 ( 1 α ) ] ω W i = 1 3 ω i = 1 , 0 ω i 1 ( i = 1 , 2 , 3 )
It is worth noting that as F 21 and F 23 are determined as the best and the worst factors, respectively, there are ω B = ω 21 and ω W = ω 23 . In this case, α is set to 0.5 .
By solving the above model, the local weight vector of the factors in C 4 can be obtained as ω = ( 0.4121 , 0.3383 , 0.2496 ) T . From the results, it can be observed that the weight of the best factor, i.e., C 21 , is clearly higher than other factors, whereas the weight of the worst factor, i.e., C 23 , is lower than other factors. By applying the fuzzy BWM to calculate the local weights of all 37 factors, the relative importance of the factors are obtained. The results of the local weights for each factor within its category are presented in Table 16. These weights reflect the importance of each factor within its category and provide insights into their relative contributions to smart aviation development.
Step 6: Global weight calculation
By calculating the global weights of the factors, the overall importance of each factor for smart aviation development can be determined. After obtaining the local weights of the factors, the global weights of the factors are computed by multiplying the local weights of the factors with the weights of their respective categories, which denote the overall importance of each factor for smart aviation development. The calculated global weights of the factors are shown in Table 16.
From Table 16, it can be observed that factor F 8 has the highest global weight of 0.0418, indicating its significance for smart aviation development. On the other hand, factor F 35 has the lowest global weight of 0.0152, suggesting it has relatively less impact on smart aviation development compared to other factors.
By ranking the factors based on their global weights, the relative importance and significance of each factor for smart aviation development can be determined. The ranking order of the factors is presented in Table 17.
From Table 17, it can be observed that factor F 8 (4D track development level) is ranked the highest among all factors, indicating that intelligent air traffic control is considered the most important factor in the adoption of smart aviation. Other factors such as F 29 (Proportion of R&D investment), F 31 (Data resources sharing degree), F 28 (Innovation degree of smart aviation policy system), F 21 (All-in-one service rate), and F 19 (Intelligent construction technology application level) are also ranked highly, suggesting their significant contributions to smart aviation development. On the other hand, factor F 35 (Flight cancellation rate) is ranked last among all 37 factors, indicating that it is considered to have the least impact on smart aviation development compared to other factors. The ranking of the factors provides valuable insights for practitioners and decision-makers, highlighting the most important factors to focus on in order to effectively develop and adopt smart aviation.

4. Evaluation and Discussion

4.1. Comparison Analysis

In this study, the fuzzy BWM is adopted to evaluate and rank different factors, which can more effectively and efficiently determine the weights of factors with fewer pairwise comparisons and higher consistency. In this section, comparisons between AHP, BWM, and fuzzy BWM are presented to show the advantages of the adopted approach.

4.1.1. Comparison of BWM and AHP

In the AHP approach, the evaluation process is based on the pairwise comparisons of all factors and it has some significant limitations, specifically, the following: (1) The pairwise comparison information creates a significant burden for the experts as it requires n ( n 1 ) / 2 pairwise comparisons for n factors, whereas BWM only requires 2 n 3 pairwise comparisons. (2) The AHP requires higher computation power as it requires the aggregation and computation of all the pairwise information collected from the experts [38]. (3) The AHP has lower consistency due to the large amount of pairwise comparisons, especially when the number of factors is large.
Compared with AHP, BWM addresses these limitations by reducing the number of pairwise comparisons required and improving the consistency of the evaluation process. By using structured comparisons and considering the best and worst factors, BWM achieves a more efficient and reliable evaluation compared to AHP. The reduced number of pairwise comparisons in BWM not only alleviates the burden on experts but also simplifies the computational complexity of the method. Moreover, the higher consistency observed in BWM can enhance the robustness and validity of the evaluation results. The use of best and worst elements in BWM helps establish a clear reference point for comparison, leading to more consistent judgments from experts. Based on previous studies, BWM has demonstrated its effectiveness in various domains [39,40,41]. The lower computation cost and higher consistency of BWM make it a preferred choice for large-scale evaluation problems where the number of factors is significant.
Therefore, in the context of smart aviation development, where a comprehensive evaluation of numerous factors is required, BWM offers a practical and reliable approach to prioritize the factors.

4.1.2. Comparison of BWM and Fuzzy BWM

The BWM has certain limitations in dealing with uncertainty and subjectivity in pairwise comparisons. The use of a crisp nine-point scale may not fully capture the imprecise nature of experts’ judgments, and can lead to some limitations, specifically, the following: (1) The BWM is mostly used for crisp cases where the information provided by the experts are crisp numbers. (2) The ranking calculated using the BWM may be imprecise. (3) The judgments of experts could impact the results and bring uncertainty in the evaluation process. Additionally, the judgments provided by experts can introduce uncertainty and impact the evaluation process.
The fuzzy BWM, on the other hand, addresses these limitations by extending the BWM to handle uncertainty and subjectivity more effectively. The fuzzy BWM is designed to accommodate linguistic judgments and capture the ambiguity and imprecision inherent in human knowledge and decision-making processes. By using fuzzy numbers to represent linguistic terms and considering the uncertainty in experts’ judgments, fuzzy BWM provides a more adequate framework for modeling and evaluating uncertain scenarios. In fuzzy BWM, linguistic judgments expressed by experts under uncertainty can be effectively transformed into fuzzy numbers, allowing for a more accurate representation of imprecise information. This enables a more comprehensive evaluation that considers the uncertainty and subjectivity in the experts’ judgments. Compared to the conventional BWM, the fuzzy BWM provides a preferable approach to handle uncertain evaluations, such as capturing ambiguity and imprecision that cannot be accurately expressed using crisp numbers. It enhances the robustness and reliability of the evaluation process by considering the uncertainties associated with experts’ judgments and providing more accurate and comprehensive results.
Table 18 summarizes the features of the fuzzy BWM in comparison with AHP and classical BWM. As can be seen from Table 18, while AHP requires n ( n 1 ) / 2 comparisons, BWM and fuzzy BWM require only 2 n 3 , improving efficiency and consistency. Additionally, fuzzy BWM uniquely supports uncertainty modeling through fuzzy numbers, offering a more realistic representation of expert judgment compared to crisp scales. Therefore, in the context of smart aviation development, where uncertainty and subjectivity are common in evaluating factors, fuzzy BWM is a suitable approach to address these challenges and provide a more robust and accurate assessment.

4.2. Discussion

Based on the integration of grounded theory, fuzzy sets, and BWM, this study has made significant progress in identifying and evaluating important factors for smart aviation development. The findings from this research contribute to answering the following research questions:
(1) RQ1: What specific operational factors significantly influence improvements in operational efficiency and passenger experience in smart aviation development?
(2) RQ2: How can these influential factors be effectively prioritized to understand their impact clearly and systematically?
(3) RQ3: What are the key factors that most strongly enhance operational efficiency and passenger experience in the context of smart aviation?

4.2.1. Research Question 1

The primary aim of this study is to identify specific operational factors that significantly influence improvements in operational efficiency and passenger experience within the context of smart aviation development. To achieve this, grounded theory is employed to systematically extract and categorize the critical factors directly from data sources, including policy documents, expert interviews, and industry reports. The grounded theory approach is particularly suitable for exploring emerging and complex topics like smart aviation, as it allows the construction of conceptual frameworks based on real-world evidence without preconceived assumptions.
The results of this approach led to the identification of 37 factors, which are further organized into nine distinct categories, which enhances the theoretical robustness of this study by offering a structured lens through which to examine the multifaceted nature of smart aviation. The factors are not merely listed but systematically grouped to reflect their thematic relevance, thereby enabling a comprehensive and organized examination of each factor within its category.
The empirical analysis conducted through the expert questionnaire further validates these factors, ensuring their practical relevance. The inclusion of a diverse group of experts provided valuable insights into the importance and prioritization of the identified factors, thereby strengthening the credibility of the findings. By focusing specifically on factors related to operational efficiency and passenger experience, this study provides actionable insights for stakeholders aiming to optimize smart aviation strategies. The identified factors serve as a guideline for industry practitioners and policymakers to focus on key areas, such as 4D flight tracking and data sharing, that directly influence efficiency improvements and enhanced passenger services.

4.2.2. Research Question 2

To evaluate and rank the identified factors, the study employs the fuzzy BWM. The choice of this method is driven by its advantages in handling linguistic uncertainty and reducing the inconsistency typically associated with pairwise comparisons. Unlike traditional methods such as AHP or TOPSIS, fuzzy BWM minimizes the cognitive load on experts by reducing the number of comparisons required while simultaneously enhancing consistency, and it is particularly useful when evaluating factors related to smart aviation, where expert judgments are often subjective and uncertain.
The application of fuzzy BWM enables the systematic calculation of both local and global weights of the identified factors. The use of linguistic terms for pairwise comparisons facilitates more accurate and realistic assessments from experts, who might find precise numerical evaluations challenging in a complex domain. The linguistic inputs are transformed into triangular fuzzy numbers, which effectively captured the uncertainty inherent in expert opinions.
By aggregating the expert judgments through a weighted calculation method, this study ensures that the influence of each factor is accurately reflected. The combination of grounded theory for factor identification and fuzzy BWM for prioritization represents a novel and rigorous approach to tackling the multi-dimensional challenges of smart aviation development. The prioritized list of factors not only highlights the most impactful elements but also offers a structured approach to strategic decision-making. This integration significantly contributes to the field by providing a robust framework for evaluating the critical factors of smart aviation under uncertainty.

4.2.3. Research Question 3

The findings revealed the most and least influential factors for smart aviation development. Among the nine categories, the category “smart airport” emerged as the most significant, indicating that developing smart airport technologies and infrastructure is crucial for advancing smart aviation, and it aligns with the current global trend of digitizing airport operations to enhance efficiency and passenger experience.
The top-ranked factors within this category and others include 4D track development level ( F 8 ), proportion of R&D investment ( F 29 ), data resources sharing degree ( F 31 ), and innovation in the smart aviation policy system ( F 28 ). These factors highlight the critical role of technological advancements, continuous research investment, data integration, and adaptive regulatory frameworks in the successful implementation of smart aviation initiatives. The focus on data-driven decision-making and innovative policy frameworks aligns with the socio-technical systems theory, where technical and organizational components must evolve concurrently to achieve sustainable innovation.
Conversely, factors such as total labor productivity ( F 36 ), safety supervision level ( F 5 ), and flight cancellation rate ( F 35 ) are ranked lower. Although these factors contribute to the broader concept of smart aviation, their relatively lower impact suggests that efficiency and passenger experience are more directly driven by technological integration and regulatory support. This finding underscores the importance of prioritizing digital and data-centric innovations over traditional performance metrics when formulating smart aviation strategies.
These insights provide practical guidance for aviation stakeholders, enabling them to concentrate efforts on the most impactful factors. By adopting the prioritization framework presented in this study, industry practitioners can make informed decisions about resource allocation and strategic planning, thereby advancing smart aviation development in a targeted and efficient manner.

4.3. Theoretical Implications

This study contributes to the theoretical understanding of smart aviation by introducing an integrated framework that combines grounded theory and the fuzzy best–worst method (BWM), offering a novel approach for identifying and prioritizing critical development factors under uncertainty. Grounded theory serves as a rigorous qualitative foundation for extracting factors directly from real-world documents and expert insights, thus ensuring that the factor structure reflects the dynamic and multifaceted nature of smart aviation. Unlike previous studies that rely solely on pre-defined frameworks or purely quantitative models, this research builds a conceptual structure grounded in empirical realities, contributing to theory-building in the domain of digital aviation transformation.
From a methodological standpoint, the integration of fuzzy set theory into BWM allows for the representation of linguistic and subjective expert judgments, enhancing the realism and robustness of multi-criteria evaluation in uncertain environments. This advancement is theoretically significant in contexts like smart aviation, where decision-making often involves ambiguity, stakeholder diversity, and limited quantitative data. The use of fuzzy BWM thus extends the methodological toolbox available to scholars in aviation systems, operations research, and decision sciences.
Furthermore, the study contributes to the theoretical literature on technology adoption and system innovation by offering a multi-dimensional view of smart aviation development, encompassing not only technological factors but also regulatory innovation, organizational reform, foundational support, and outcome performance. The prioritization results highlight the theoretical relevance of data integration, innovation capacity, and digital infrastructure as central drivers of smart aviation, aligning with broader systems theory and innovation diffusion frameworks. By mapping and ranking 37 factors across nine categories, this study lays the groundwork for future research to model causal relationships, test hypotheses, and generalize findings across international contexts.

4.4. Managerial Implications

The results of this study offer important managerial insights for stakeholders involved in planning and implementing smart aviation initiatives. The prioritized factors reveal that enhancing operational efficiency and improving the passenger experience are central to smart aviation development, with technological enablers such as 4D flight tracking, investment in research and development, and data resource sharing emerging as the most influential contributors. This suggests that decision-makers among civil aviation authorities, airlines, and airports should strategically allocate resources to accelerate the adoption of intelligent air traffic management, integrated data systems, and innovative regulatory mechanisms.
The factor rankings also highlight the significance of institutional and policy-level innovation in enabling digital transformation. Managers and policymakers should recognize that smart aviation is not solely a technological challenge but also an organizational and regulatory one. In particular, the prominence of regulatory innovation and cross-sector collaboration as key factors implies that coordinated efforts among stakeholders—including regulators, airlines, airport operators, and technology vendors—are essential to overcome structural barriers and drive systemic change.
Moreover, the application of fuzzy BWM provides a practical decision-support tool for aviation managers who must navigate uncertainty and diverse stakeholder interests. By reducing the cognitive burden on experts and offering consistent results with fewer comparisons, this method facilitates more efficient strategic planning. While this study relies on expert judgments, it also opens the door for future validation using real-world operational data, enabling managers to combine qualitative assessments with quantitative performance metrics. Such integration could further refine prioritization strategies and strengthen the alignment between technological investments and performance outcomes in smart aviation.

4.5. Limitations and Future Research Directions

While this study presents a comprehensive analysis of the key factors influencing smart aviation development using a robust methodological framework, several limitations warrant consideration. Addressing these limitations in future research could significantly enhance the generalizability and robustness of the findings.
First, this study’s expert panel mainly consisted of academics with extensive experience in aviation systems, technology adoption, and decision-making. While these experts provided valuable insights, the limited representation of industry stakeholders—such as regulatory agencies, airlines, and airport operators—may limit the breadth of perspectives captured. Industry practitioners may prioritize different aspects, such as operational efficiency or safety management, compared to academic experts. Future studies should aim to incorporate a more diverse panel, including professionals from regulatory bodies, airline management, and airport operations, to capture a broader range of practical insights and priorities.
Second, although the fuzzy BWM method effectively handles linguistic uncertainty and subjectivity in expert judgments, the results are inherently influenced by the qualitative nature of the expert evaluations. While fuzzy BWM is advantageous for reducing comparison inconsistency and managing ambiguity, it lacks empirical validation through quantitative data. Future research could enhance the robustness of the findings by triangulating expert-based rankings with real-world data. For instance, empirical validation could be performed through regression analysis or machine learning techniques, examining the measurable impacts of highly ranked factors, such as 4D flight tracking and investment in R&D, on smart aviation performance indicators.
Third, this study primarily focuses on evaluating factors related to enhancing operational efficiency and passenger experience. While these are core components of smart aviation development, other dimensions, such as environmental sustainability and cybersecurity, were not comprehensively addressed. Incorporating these additional perspectives could offer a more holistic view of smart aviation. Moreover, this study is context-specific, primarily reflecting the developmental status and challenges of smart aviation in China. Adapting the framework to different geopolitical and economic contexts could offer valuable comparative insights, particularly in countries with distinct aviation infrastructures or regulatory environments.
Finally, while this study systematically prioritizes factors using expert judgments, it does not fully capture the dynamic interactions between factors over time. Smart aviation development is an evolving process influenced by technological advances, regulatory changes, and shifting market demands. Future research could explore dynamic modeling techniques, such as system dynamics or agent-based modeling, to simulate the evolving interactions between critical factors. Additionally, integrating expert feedback through iterative Delphi methods could further refine the factor prioritization as the field of smart aviation continues to evolve.

5. Conclusions

In this study, 37 key factors from nine categories for smart aviation development are identified and evaluation, and an integrated factor evaluation approach based on grounded theory and fuzzy BWM is presented, which offers a comprehensive and systematic method for identifying, evaluating, and ranking key factors in smart aviation development. The use of grounded theory helps to ensure that the identified factors are grounded in relevant documents and empirical analysis, while the fuzzy BWM allows for the consideration of uncertainty and subjectivity in expert judgments. By incorporating the opinions and judgments of experts, the evaluation process becomes more robust and representative of the industry’s perspective. The fuzzy BWM enables the determination of weights for the factors, both within their respective categories and in relation to the overall smart aviation development. This helps to prioritize the factors and provide guidance to practitioners in terms of where to allocate their efforts and resources for improving smart aviation.
The identification of key factors for smart aviation development, as well as their prioritization, contributes to the understanding of the factors that play a significant role in the successful adoption and development of smart aviation. This knowledge can inform decision-making processes, strategic planning, and resource allocation in the industry. Overall, the integrated factor evaluation approach presented in this study fills a gap in the literature by providing a systematic and comprehensive method for evaluating and prioritizing factors in the context of smart aviation development. The findings of this study offer valuable insights and practical implications for industry practitioners, policymakers, and researchers involved in the field of smart aviation.
Nevertheless, there are some potential limitations to this study. First, the sample size of the questionnaire survey may indeed affect the generalizability of the findings. While the sample size of 23 experts is considered representative, it is important to acknowledge that a larger sample size would provide more robust results and enhance the validity of the identified factors. Therefore, future validation efforts could incorporate perspectives from governmental regulatory bodies, airport operators, airline managers, and industry consultants to obtain a comprehensive and nuanced understanding of smart aviation development priorities. Second, though the fuzzy sets used in this study can provide effective means for representing uncertain and subjective judgments, they could be insufficient for some complex cases, and the utilization of other uncertain knowledge representation techniques could be studied in the future.

Author Contributions

Conceptualization, F.G. and W.H.; methodology, F.G.; validation, F.G. and W.H.; investigation, F.G.; writing—original draft preparation, F.G.; writing—review and editing, W.H. All authors have read and agreed to the published version of the manuscript.

Funding

This study was supported in part by the Shandong Provincial Natural Science Foundation under Grant No. ZR2023QF148, and in part by the Shandong Province Higher Education Youth Innovation Team Development Plan under Grant No. 2024KJH008.

Data Availability Statement

Data will be made available on request.

Conflicts of Interest

The authors declare no conflicts of interest.

Appendix A. Expert Questionnaire for Factor Prioritization

1. Introduction and Instructions
Dear Expert,
Thank you for participating in this expert evaluation study on smart aviation development. This questionnaire is part of a research project aimed at identifying and prioritizing the key factors contributing to the development of smart aviation in China. The fuzzy best-worst method (BWM) is adopted to quantify expert judgments under uncertainty.
You are asked to evaluate and compare factors within nine main categories and at the category level using linguistic terms. Please provide your judgments based on your professional experience and knowledge of the smart aviation field. All responses are strictly confidential and will be used for academic purposes only.
Table A1. Linguistic Scale for Comparisons.
Linguistic TermTriangular Fuzzy Number
Equally important (EI)(1, 1, 1)
Weakly important (WI)(2/3, 1, 3/2)
Fairly Important (FI)(3/2, 2, 5/2)
Very important (VI)(5/2, 3/7/2)
Absolutely important (AI)(7/2, 4, 9/2)
2. Part 1: Category-Level Comparison
Step 1: Select the most important (Best) and least important (Worst) category:
  • C1: Smart Travel
  • C2: Smart Air Traffic Control
  • C3: Smart Airport
  • C4: Smart Regulation
  • C5: Industry Collaboration
  • C6: Organizational Reform
  • C7: Technical Innovation
  • C8: Foundational Support
  • C9: Overall Effect
Best Category: ______
Worst Category: ______
Step 2: Best-to-Others Comparison
Evaluate the importance of the Best category compared to others:
Compared CategoriesLinguistic Preference
Best vs. C1 ____________
Best vs. C2 ____________
Best vs. C3 ____________
Best vs. C4 ____________
Best vs. C5 ____________
Best vs. C6 ____________
Best vs. C7 ____________
Best vs. C8 ____________
Best vs. C9 ____________
Step 3: Others-to-Worst Comparison
Compared CategoriesLinguistic Preference
C1 vs. Worst ____________
C2 vs. Worst ____________
C3 vs. Worst ____________
C4 vs. Worst ____________
C5 vs. Worst ____________
C6 vs. Worst ____________
C7 vs. Worst ____________
C8 vs. Worst ____________
C9 vs. Worst ____________
3. Part 2: Factor-Level Comparison (for each category)
For each of the nine categories, please complete the following steps:
  • Select the most important (Best) and least important (Worst) factor.
  • Fill out the Best-to-Others comparison table.
  • Fill out the Others-to-Worst comparison table.
Example: Category C2—Smart Air Traffic Control
Factors:
  • F8: 4D Track Development Level
  • F9: Satellite Navigation System Application Level
  • F10: Aviation Broadband Communication Application Level
  • F11: Airspace Resource Utilization Level
  • F12: Traffic Management Collaboration Level
Best Factor: ______
Worst Factor: ______
Best-to-Others Comparison
Compared FactorsLinguistic Preference
Best vs. F8 ____________
Best vs. F9 ____________
Best vs. F10 ____________
Best vs. F11 ____________
Best vs. F12 ____________
Others-to-Worst Comparison
Compared FactorsLinguistic Preference
F8 vs. Worst ____________
F9 vs. Worst ____________
F10 vs. Worst ____________
F11 vs. Worst ____________
F12 vs. Worst ____________
Please repeat the above procedure for all remaining categories:
  • C1: Smart Travel (F1–F7)
  • C3: Smart Airport (F13–F20)
  • C4: Smart Regulation (F21–F23)
  • C5: Industry Collaboration (F24–F26)
  • C6: Organizational Reform (F27–F28)
  • C7: Technical Innovation (F29–F30)
  • C8: Foundational Support (F31–F32)
  • C9: Overall Effect (F33–F37)
Thank you for your valuable input and participation.

Appendix B. Expert Selection Criteria

In this study, a structured approach was adopted to ensure that the expert panel selected for the fuzzy BWM evaluation possessed the qualifications and domain knowledge required to provide reliable and informed judgments regarding the development of smart aviation. The selection criteria were designed to ensure both academic rigor and industry relevance, as detailed below.
1. Area of Expertise
Experts were required to have demonstrable specialization in one or more of the following areas:
  • Smart aviation systems and technology;
  • Civil aviation policy and regulation;
  • Air traffic control and digital infrastructure;
  • Airport management and operations;
  • Aviation digitalization and system engineering;
  • Decision-making, risk analysis, and aviation MCDM applications.
2. Academic and Professional Qualifications
Each expert met at least one of the following academic or professional thresholds:
  • Held a PhD or equivalent terminal degree in aerospace engineering, transportation, systems engineering, management science, or a closely related field.
  • Held a senior academic rank (e.g., Associate Professor, Professor).
  • Held a senior professional or managerial role in a relevant aviation organization (e.g., regulatory body, airline, airport authority, R&D institute).
3. Industry or Research Experience
To ensure relevance to real-world aviation development, each expert also met the following experience threshold:
  • Minimum of 4 years of relevant experience in academia, industry, or public-sector roles related to aviation systems, smart technology implementation, or aviation management and policy.
4. Institutional Affiliation and Roles
Experts were affiliated with a mix of the following types of institutions:
  • Research universities and academic departments specializing in aviation, transportation, or engineering.
  • National or regional civil aviation authorities and regulatory agencies.
  • State-owned and private airline operators or airport authorities.
  • Research institutes and think tanks focused on aviation innovation and digital transformation.
The final expert panel included 23 experts from top-tier academic and research institutions across China, all of whom had previously contributed to scholarly or applied work in smart aviation and several of whom had participated in national-level projects or policy advisory roles.

References

  1. Dou, X. Big data and smart aviation information management system. Cogent Bus. Manag. 2020, 7, 1766736. [Google Scholar] [CrossRef]
  2. Ushakov, D.; Dudukalov, E.; Kozlova, E.; Shatila, K. The Internet of Things impact on smart public transportation. Transp. Res. Procedia 2022, 63, 2392–2400. [Google Scholar] [CrossRef]
  3. Ahmad, R.W.; Salah, K.; Jayaraman, R.; Hasan, H.R.; Yaqoob, I.; Omar, M. The role of blockchain technology in aviation industry. IEEE Aerosp. Electron. Syst. Mag. 2021, 36, 4–15. [Google Scholar] [CrossRef]
  4. Jiang, Y.; Tran, T.H.; Williams, L. Machine learning and mixed reality for smart aviation: Applications and challenges. J. Air Transp. Manag. 2023, 111, 102437. [Google Scholar] [CrossRef]
  5. Wandelt, S.; Zheng, C. Toward smart skies: Reviewing the state of the art and challenges for intelligent air transportation systems (IATS). IEEE Trans. Intell. Transp. Syst. 2024, 25, 12943–12953. [Google Scholar] [CrossRef]
  6. Czerny, A.I.; Fu, X.; Lei, Z.; Oum, T.H. Post pandemic aviation market recovery: Experience and lessons from China. J. Air Transp. Manag. 2021, 90, 101971. [Google Scholar] [CrossRef]
  7. Bao, S.; Gao, F.; Zhang, Z.; Xia, Q.; Bi, W. The way to smart civil aviation: An integrated decision making approach for smart civil aviation assessment in China. Eng. Appl. Artif. Intell. 2024, 138, 109419. [Google Scholar] [CrossRef]
  8. Ullah, I.; Zheng, J.; Ullah, S.; Bhattarai, K.; Almujibah, H.; Alawad, H. Unraveling the Complex Barriers to and Policies for Shared Autonomous Vehicles: A Strategic Analysis for Sustainable Urban Mobility. Systems 2024, 12, 558. [Google Scholar] [CrossRef]
  9. Gao, F.; Wang, W.; Bi, C.; Bi, W.; Zhang, A. Prioritization of used aircraft acquisition criteria: A fuzzy best–worst method (BWM)-based approach. J. Air Transp. Manag. 2023, 107, 102359. [Google Scholar] [CrossRef]
  10. Akhtar, M.; Gunasekaran, A.; Kayikci, Y. A novel stochastic fuzzy decision model for agile and sustainable global manufacturing outsourcing partner selection in footwear industry. J. Enterp. Inf. Manag. 2023, 36, 979–1007. [Google Scholar] [CrossRef]
  11. Chrysafis, K.A.; Theotokas, I.N.; Lagoudis, I.N. Managing fuel price variability for ship operations through contracts using fuzzy TOPSIS. Res. Transp. Bus. Manag. 2022, 43, 100778. [Google Scholar] [CrossRef]
  12. Markatos, D.N.; Pantelakis, S.G. Implementation of a Holistic MCDM-Based Approach to Assess and Compare Aircraft, under the Prism of Sustainable Aviation. Aerospace 2023, 10, 240. [Google Scholar] [CrossRef]
  13. Chai, N.; Zhou, W. A novel hybrid MCDM approach for selecting sustainable alternative aviation fuels in supply chain management. Fuel 2022, 327, 125180. [Google Scholar] [CrossRef]
  14. Lee, K.C.; Tsai, W.H.; Yang, C.H.; Lin, Y.Z. An MCDM approach for selecting green aviation fleet program management strategies under multi-resource limitations. J. Air Transp. Manag. 2018, 68, 76–85. [Google Scholar] [CrossRef]
  15. Tsafarakis, S.; Kokotas, T.; Pantouvakis, A. A multiple criteria approach for airline passenger satisfaction measurement and service quality improvement. J. Air Transp. Manag. 2018, 68, 61–75. [Google Scholar] [CrossRef]
  16. Zia, M.N.; Shah, A.; Khan, S.A.; Najib, A. Identification of critical success factors (CSFs) for successful project management in manufacturing sector. J. Enterp. Inf. Manag. 2024, 37, 1282–1300. [Google Scholar] [CrossRef]
  17. Niu, W.; Rong, Y.; Yu, L. An integrated group decision support framework utilizing Pythagorean fuzzy DEMATEL–CoCoSo approach for medicine cold chain logistics provider selection. J. Enterp. Inf. Manag. 2024, 37, 1809–1838. [Google Scholar] [CrossRef]
  18. Zheng, Q.; Shen, S.L.; Zhou, A.; Lyu, H.M. Inundation risk assessment based on G-DEMATEL-AHP and its application to Zhengzhou flooding disaster. Sustain. Cities Soc. 2022, 86, 104138. [Google Scholar] [CrossRef]
  19. Klarić, K.; Perić, I.; Vukman, K.; Papić, F.; Klarić, M.; Grošelj, P. Hybrid MCDM-FMEA Model for Process Optimization: A Case Study in Furniture Manufacturing. Systems 2024, 13, 14. [Google Scholar] [CrossRef]
  20. Malek, J.; Desai, T.N. Prioritization of sustainable manufacturing barriers using Best Worst Method. J. Clean. Prod. 2019, 226, 589–600. [Google Scholar] [CrossRef]
  21. Rafi, S.; Yu, W.; Akbar, M.A.; Alsanad, A.; Gumaei, A. Prioritization based taxonomy of DevOps security challenges using PROMETHEE. IEEE Access 2020, 8, 105426–105446. [Google Scholar] [CrossRef]
  22. Singh, M.; Rathi, R.; Garza-Reyes, J.A. Analysis and prioritization of Lean Six Sigma enablers with environmental facets using best worst method: A case of Indian MSMEs. J. Clean. Prod. 2021, 279, 123592. [Google Scholar] [CrossRef]
  23. Ikram, M.; Sroufe, R.; Zhang, Q. Prioritizing and overcoming barriers to integrated management system (IMS) implementation using AHP and G-TOPSIS. J. Clean. Prod. 2020, 254, 120121. [Google Scholar] [CrossRef]
  24. Chang, K.Y.; Chen, C.D.; Ku, E.C. Enhancing smart tourism and smart city development: Evidence from Taoyuan smart aviation city in Taiwan. Int. J. Tour. Cities 2024, 10, 146–165. [Google Scholar] [CrossRef]
  25. CAAC. Smart Civil Aviation Construction Evaluation Indicator System (Trial); Technical Report; CAAC: Beijing, China, 2023.
  26. Burak, M.F.; Küsbeci, P. Internet of things and aviation: A bibliometric and visualization analysis. Kybernetes 2023, 53, 4502–4521. [Google Scholar] [CrossRef]
  27. CAAC. Smart Aviation Development Roadmap. 2022. Available online: https://www.caac.gov.cn/ (accessed on 15 February 2025).
  28. Luo, T.; Liu, H.; Shi, X.; Meng, P.; Wang, J.; Fang, W. An Empirical Study of the Quality Governance Level of China’s Civil Aircraft Industry. Systems 2024, 12, 247. [Google Scholar] [CrossRef]
  29. Birks, M.; Mills, J. Grounded Theory: A Practical Guide; Sage: Washington DC, USA, 2015. [Google Scholar]
  30. Zadeh, L.A.; Klir, G.J.; Yuan, B. Fuzzy Sets, Fuzzy Logic, and Fuzzy Systems: Selected Papers; World Scientific: Singapore, 1996; Volume 6. [Google Scholar]
  31. Becerra, C.E.T.; Melo, F.J.C.d.; Xavier, L.d.A.; Albuquerque, A.P.G.d.; Barbosa, A.A.L.; Oliveira, L.A.B.d.; Carvalho, R.S.M.C.d.; Medeiros, D.D.d. A Holistic Quality Improvement Model for Food Services: Integrating Fuzzy Kano and PROMETHEE II. Systems 2024, 12, 422. [Google Scholar] [CrossRef]
  32. Rezaei, J. Best-worst multi-criteria decision-making method. Omega 2015, 53, 49–57. [Google Scholar] [CrossRef]
  33. Rezaei, J.; Nispeling, T.; Sarkis, J.; Tavasszy, L. A supplier selection life cycle approach integrating traditional and environmental criteria using the best worst method. J. Clean. Prod. 2016, 135, 577–588. [Google Scholar] [CrossRef]
  34. Liang, F.; Brunelli, M.; Rezaei, J. Consistency issues in the best worst method: Measurements and thresholds. Omega 2020, 96, 102175. [Google Scholar] [CrossRef]
  35. Torkayesh, A.E.; Zolfani, S.H.; Kahvand, M.; Khazaelpour, P. Landfill location selection for healthcare waste of urban areas using hybrid BWM-grey MARCOS model based on GIS. Sustain. Cities Soc. 2021, 67, 102712. [Google Scholar] [CrossRef]
  36. Hafezalkotob, A.; Hafezalkotob, A. A novel approach for combination of individual and group decisions based on fuzzy best-worst method. Appl. Soft Comput. 2017, 59, 316–325. [Google Scholar] [CrossRef]
  37. Argaw, Y.M.; Liu, Y. The Pathway to Startup Success: A Comprehensive Systematic Review of Critical Factors and the Future Research Agenda in Developed and Emerging Markets. Systems 2024, 12, 541. [Google Scholar] [CrossRef]
  38. Kheybari, S.; Kazemi, M.; Rezaei, J. Bioethanol facility location selection using best-worst method. Appl. Energy 2019, 242, 612–623. [Google Scholar] [CrossRef]
  39. Tu, J.; Wu, Z.; Pedrycz, W. Priority ranking for the best-worst method. Inf. Sci. 2023, 635, 42–55. [Google Scholar] [CrossRef]
  40. Liu, P.; Zhu, B.; Wang, P. A weighting model based on best–worst method and its application for environmental performance evaluation. Appl. Soft Comput. 2021, 103, 107168. [Google Scholar] [CrossRef]
  41. Ecer, F.; Pamucar, D. Sustainable supplier selection: A novel integrated fuzzy best worst method (F-BWM) and fuzzy CoCoSo with Bonferroni (CoCoSo’B) multi-criteria model. J. Clean. Prod. 2020, 266, 121981. [Google Scholar] [CrossRef]
Figure 1. Process of the research framework.
Systems 13 00291 g001
Figure 2. Hierarchical structure of category and factor.
Systems 13 00291 g002
Figure 3. Triangular fuzzy number A ˜ = ( l , m , u ) .
Systems 13 00291 g003
Figure 4. Smart aviation development factors.
Systems 13 00291 g004
Table 1. Factors for smart aviation development.
No.CategoryNo.Factor
C 1 Smart travel F 1 Domestic flights paperless travel level
F 2 Baggage tracking level
F 3 Easy security service rate
F 4 Proportion of aircraft with in-air internet access capability
F 5 Electronic waybill usage rate
F 6 Cargo whole process tracking service level
F 7 Development level of easy transport mechanism
C 2 Smart air traffic control F 8 4D track development level
F 9 Satellite navigation system application level
F 10 Aviation broadband communication application level
F 11 Airspace resource utilization level
F 12 Traffic management collaboration level
C 3 Smart airport F 13 Digital level of airport flight support
F 14 Intelligent allocation level of airport support resources
F 15 Utilization level of contact stands
F 16 Flight average cut-off time
F 17 Flight average transit time
F 18 Flight average taxi time
F 19 Application of smart technology
F 20 Intelligent level of airport operation management
C 4 Smart regulation F 21 All-in-one service rate
F 22 Electronic regulation application level
F 23 Market monitoring automation level
C 5 Industry collaboration F 24 Informatization investment
F 25 CO2 emissions per ton-kilometers
F 26 Low-carbon operation level of the airport
C 6 Organizational reform F 27 Innovation degree of smart aviation organization
F 28 Innovation degree of smart aviation policy system
C 7 Technical innovation F 28 Proportion of R&D investment
F 29 Domestic production rate of major equipment of the ATC system
C 8 Foundational support F 30 Data resources sharing degree
F 32 Cybersecurity and data security level
C 9 Overall effect F 33 Air transport accident rate per ten thousand hours
F 34 Flight punctuality rate
F 35 Flight cancellation rate
F 36 Total labor productivity
F 37 Major airport hourly capacity
Table 2. Transformation between linguistic terms and triangular fuzzy numbers.
Linguistic TermTriangular Fuzzy Number
Equally important (EI)(1, 1, 1)
Weakly important (WI)(2/3, 1, 3/2)
Fairly Important (FI)(3/2, 2, 5/2)
Very important (VI)(5/2, 3/7/2)
Absolutely important (AI)(7/2, 4, 9/2)
Table 3. Consistency index of the fuzzy BWM.
Linguistic Term f ˜ BW CI (Max ζ )
Equally important (EI)(1, 1, 1)3.00
Weakly important (WI)(2/3, 1, 3/2)3.80
Fairly important (FI)(3/2, 2, 5/2)5.29
Very important (VI)(5/2, 3/7/2)6.69
Absolutely important (AI)(7/2, 4, 9/2)8.04
Table 4. Best and worst elements of each category.
CategoryBest ElementWorst Element
Smart travel ( C 1 )Electronic way bill usage rate ( F 5 )Easy security service rate ( F 3 )
Smart air traffic ( C 2 )4D track development level ( F 8 )Traffic management collaboration level ( F 12 )
Smart airport ( C 3 )Intelligent construction technology application level ( F 19 )Flight average taxi time ( F 17 )
Smart regulation ( C 4 )All-in-one service rate ( F 21 )Market monitoring automation level ( F 23 )
Industry collaboration ( C 5 )Low-carbon operation level of the airport ( F 26 )Informatization investment ( F 24 )
Organizational reform ( C 6 )Innovation degree of smart aviation policy system ( F 28 )Innovation degree of smart civil aviation organization ( F 27 )
Technical innovation ( C 7 )Proportion of R&D investment ( F 29 )Domestic production rate of major equipment for ATC system ( F 30 )
Foundational support ( C 8 )Data resources sharing degree ( F 31 )Cybersecurity and data security level ( F 32 )
Overall effect ( C 9 )Air transport accident rate per ten thousand hours ( F 33 )Flight cancellation rate ( F 35 )
Table 5. Expert weight calculation score.
AspectClassValue
TitleSenior/Senior professor4
Intermediate/Professor3
Associate/Associate Professor2
Junior/Assistant Professor1
ExperienceOver 20 years4
10–19 years3
5–9 years2
Under 5 years1
Table 6. Fuzzy preference relation of overall goal.
CategoryFuzzy Preference Degree
Best Element ( C 3 )Worst Element ( C 6 )
C 1 (1.0954, 1.3909, 1.7363)(2.9454, 3.4454, 3.9454)
C 2 (1.0030, 1.2545, 1.5681)(3.0363, 3.5363, 4.0363)
C 3 (1.0000, 1.0000, 1.0000)(3.1363, 3.6363, 4.1363)
C 4 (2.9818, 3.4818, 3.9818)(1.0757, 1.4181, 1.8272)
C 5 (2.9272, 3.4272, 3.9272)(1.1166, 1.3545, 1.6227)
C 6 (3.2545, 3.7545, 4.2545)(1.0000, 1.0000, 1.0000)
C 7 (3.0454, 3.5454, 4.0454)(0.8060, 1.0000, 1.2909)
C 8 (3.1272, 3.6272, 4.1272)(0.8424, 1.0000, 1.2363)
C 9 (2.8545, 3.3545, 3.8545)(1.5181, 1.7818, 2.0590)
Table 7. Fuzzy preference relation of C 1 .
ElementFuzzy Preference Degree
Best Element ( F 5 )Wrost Element ( F 3 )
F 1 (1.7833, 2.1455, 2.5318)(1.9939, 2.2909, 2.5955)
F 2 (1.7772, 2.1909, 2.6273)(2.0378, 2.4545, 2.9000)
F 3 (2.2561, 2.6455, 3.0591)(1.0000, 1.0000, 1.0000)
F 4 (1.4576, 1.7818, 2.1227)(1.7591, 2.1727, 2.6500)
F 5 (1.0000, 1.0000, 1.0000)(2.3701, 2.8373, 3.3360)
F 6 (1.8152, 2.2000, 2.6227)(2.0076, 2.4000, 2.8454)
F 7 (1.5484, 1.8818, 2.2863)(2.0590, 2.5000, 2.9636)
Table 8. Fuzzy preference relation of C 2 .
ElementFuzzy Preference Degree
Best Element ( F 8 )Wrost Element ( F 12 )
F 8 (1.0000, 1.0000, 1.0000)(2.0606, 2.4090, 2.7773)
F 9 (1.9909, 2.3727, 2.7864)(1.8636, 2.2454, 2.6454)
F 10 (1.4955, 1.8545, 2.2727)(1.7439, 2.0818, 2.4681)
F 11 (1.9500, 2.3363, 2.7409)(1.6212, 1.9454, 2.3272)
F 12 (2.0000, 2.3454, 2.7364)(1.0000, 1.0000, 1.0000)
Table 9. Fuzzy preference relation of C 3 .
ElementFuzzy Preference Degree
Best Element ( F 19 )Wrost Element ( F 17 )
F 13 (1.9378, 2.2909, 2.6681)(1.7393, 2.0727, 2.4091)
F 14 (1.6651, 2.0818, 2.5363)(1.8924, 2.2818, 2.7045)
F 15 (1.4757, 1.7090, 1.9636)(1.5833, 1.8454, 2.1363)
F 16 (1.9803, 2.4272, 2.8954)(1.7333, 2.0727, 2.4454)
F 17 (2.2651, 2.6363, 3.0272)(1.0000, 1.0000, 1.0000)
F 18 (1.9666, 2.3454, 2.7363)(2.0303, 2.4181, 2.8181)
F 19 (1.0000, 1.0000, 1.0000)(2.3000, 2.7000, 3.1363)
F 20 (1.9257, 2.3000, 2.7000)(1.7560, 2.1180, 2.5090)
Table 10. Fuzzy preference relation of C 4 .
ElementFuzzy Preference Degree
Best Element ( F 21 )Wrost Element ( F 23 )
F 21 (1.0000, 1.0000, 1.0000)(2.2015, 2.6090, 3.0545)
F 22 (1.7727, 2.0909, 2.4272)(1.8666, 2.2818, 2.7227)
F 23 (2.1439, 2.5545, 2.9681)(1.0000, 1.0000, 1.0000)
Table 11. Fuzzy preference relation of C 5 .
ElementFuzzy Preference Degree
Best Element ( F 26 )Wrost Element ( F 24 )
F 24 (2.0212, 2.3727, 2.7545)(1.0000, 1.0000, 1.0000)
F 25 (1.5121, 1.8545, 2.2409)(1.8075, 2.2272, 2.6954)
F 26 (1.0000, 1.0000, 1.0000)(2.1439, 2.5909, 3.0590)
Table 12. Fuzzy preference relation of C 6 .
ElementFuzzy Preference Degree
Best Element ( F 28 )Wrost Element ( F 27 )
F 27 (1.80303, 2.1818, 2.604)(1.0000, 1.0000, 1.0000)
F 28 (1.0000, 1.0000, 1.0000)(2.3454, 2.7545, 3.1818)
Table 13. Fuzzy preference relation of C 7 .
ElementFuzzy Preference Degree
Best Element ( F 29 )Wrost Element ( F 30 )
F 29 (1.0000, 1.0000, 1.0000)(2.0621, 2.4363, 2.8272)
F 30 (2.0060, 2.3636, 2.7545)(1.0000, 1.0000, 1.0000)
Table 14. Fuzzy preference relation of C 8 .
ElementFuzzy Preference Degree
Best Element ( F 31 )Wrost Element ( F 32 )
F 31 (1.0000, 1.0000, 1.0000)(1.6727, 1.9909, 2.3318)
F 32 (1.8257, 2.1727, 2.5363)(1.0000, 1.0000, 1.0000)
Table 15. Fuzzy preference relation of C 9 .
ElementFuzzy Preference Degree
Best Element ( F 33 )Wrost Element ( F 35 )
F 33 (1.0000, 1.0000, 1.0000)(2.0424, 2.4636, 2.9318)
F 34 (1.7833, 2.1727, 2.5954)(1.8090, 2.1272, 2.4681)
F 35 (2.0924, 2.5090, 2.9590)(1.0000, 1.0000, 1.0000)
F 36 (1.8924, 2.2636, 2.6500)(1.5424, 1.9636, 2.4409)
F 37 (1.6378, 2.0272, 2.4636)(1.4287, 1.7090, 2.0363)
Table 16. Weights of factors.
CategoryWeightFactorLocal WeightLocal RankGlobal WeightGlobal Rank
C 1 0.1535 F 1 0.142740.021929
F 2 0.141750.021830
F 3 0.098770.015236
F 4 0.142830.021928
F 5 0.184610.028315
F 6 0.137860.021231
F 7 0.151620.023325
C 2 0.1564 F 8 0.267610.04181
F 9 0.194040.030311
F 10 0.194230.030410
F 11 0.196520.03079
F 12 0.147750.023126
C 3 0.2133 F 13 0.124940.026618
F 14 0.125230.026717
F 15 0.125420.026716
F 16 0.118570.025321
F 17 0.086780.018534
F 18 0.124260.026520
F 19 0.170410.03636
F 20 0.124850.026619
C 4 0.0896 F 21 0.412110.03695
F 22 0.338320.030312
F 23 0.249630.022427
C 5 0.0900 F 24 0.258930.023424
F 25 0.344320.03108
F 26 0.395910.03567
C 6 0.0621 F 27 0.386820.024022
F 28 0.613210.03814
C 7 0.0711 F 29 0.584310.04162
F 30 0.415720.029614
C 8 0.0694 F 31 0.566010.03933
F 32 0.434020.030113
C 9 0.0945 F 33 0.251710.023823
F 34 0.196430.018633
F 35 0.160250.015237
F 36 0.191140.018135
F 37 0.200620.019032
Table 17. Ranking order of the factors.
FactorDescriptionRank
F 8 4D track development level1
F 29 Proportion of R&D investment2
F 31 Data resources sharing degree3
F 28 Innovation degree of smart aviation policy system4
F 21 All-in-one service rate5
F 19 Application of smart technology6
F 26 Low-carbon operation level of the airport7
F 25 CO2 emissions of transport aviation ton-kilometers8
F 11 Airspace resource utilization level9
F 10 Aviation broadband communication application level10
F 9 Satellite navigation system application level11
F 22 Electronic regulation application level12
F 32 Cybersecurity and data security level13
F 30 Domestic production rate of major equipment of ATC system14
F 5 Electronic waybill usage rate15
F 15 Utilization level of contact stands16
F 14 Intelligent allocation level of airport resources17
F 13 Digital level of airport flight support18
F 20 Intelligent level of airport operation management19
F 18 Flight average taxi time20
F 16 Flight average cut-off time21
F 27 Innovation degree of smart aviation organization22
F 33 Air transport accident rate per ten thousand hours23
F 24 Informatization investment24
F 7 Development level of easy transfer25
F 12 Traffic management collaboration level26
F 23 Market monitoring automation level27
F 4 Proportion of aircraft with in-air internet access capability28
F 1 Domestic flights paperless travel level29
F 2 Baggage tracking level throughout the process30
F 6 Cargo whole process tracking service level31
F 37 Major airport hourly capacity32
F 34 Flight punctuality rate33
F 17 Flight average transit time34
F 36 Total labor productivity35
F 3 Easy security service rate36
F 35 Flight cancellation rate37
Table 18. Comparisons of different methods.
AspectFuzzy AHPClassical BWMFuzzy BWM
Number of pairwise comparisons n ( n 1 ) / 2 2 n 3 2 n 3
Knowledge representationFuzzy numberCrisp numberFuzzy number
Capability of handling uncertaintyYesNoYes
Disclaimer/Publisher’s Note: The statements, opinions and data contained in all publications are solely those of the individual author(s) and contributor(s) and not of MDPI and/or the editor(s). MDPI and/or the editor(s) disclaim responsibility for any injury to people or property resulting from any ideas, methods, instructions or products referred to in the content.

