
Critical Success Factors for Enhancing Intelligent Loading and Unloading in Urban Supply Chains: A Comprehensive Approach Based on Fuzzy DEMATEL-AISM-MICMAC


Abstract
1. Introduction
2. Literature Review
2.1. Urban Smart Logistics
2.2. Development of Factor Theory Research
3. Research Methodology
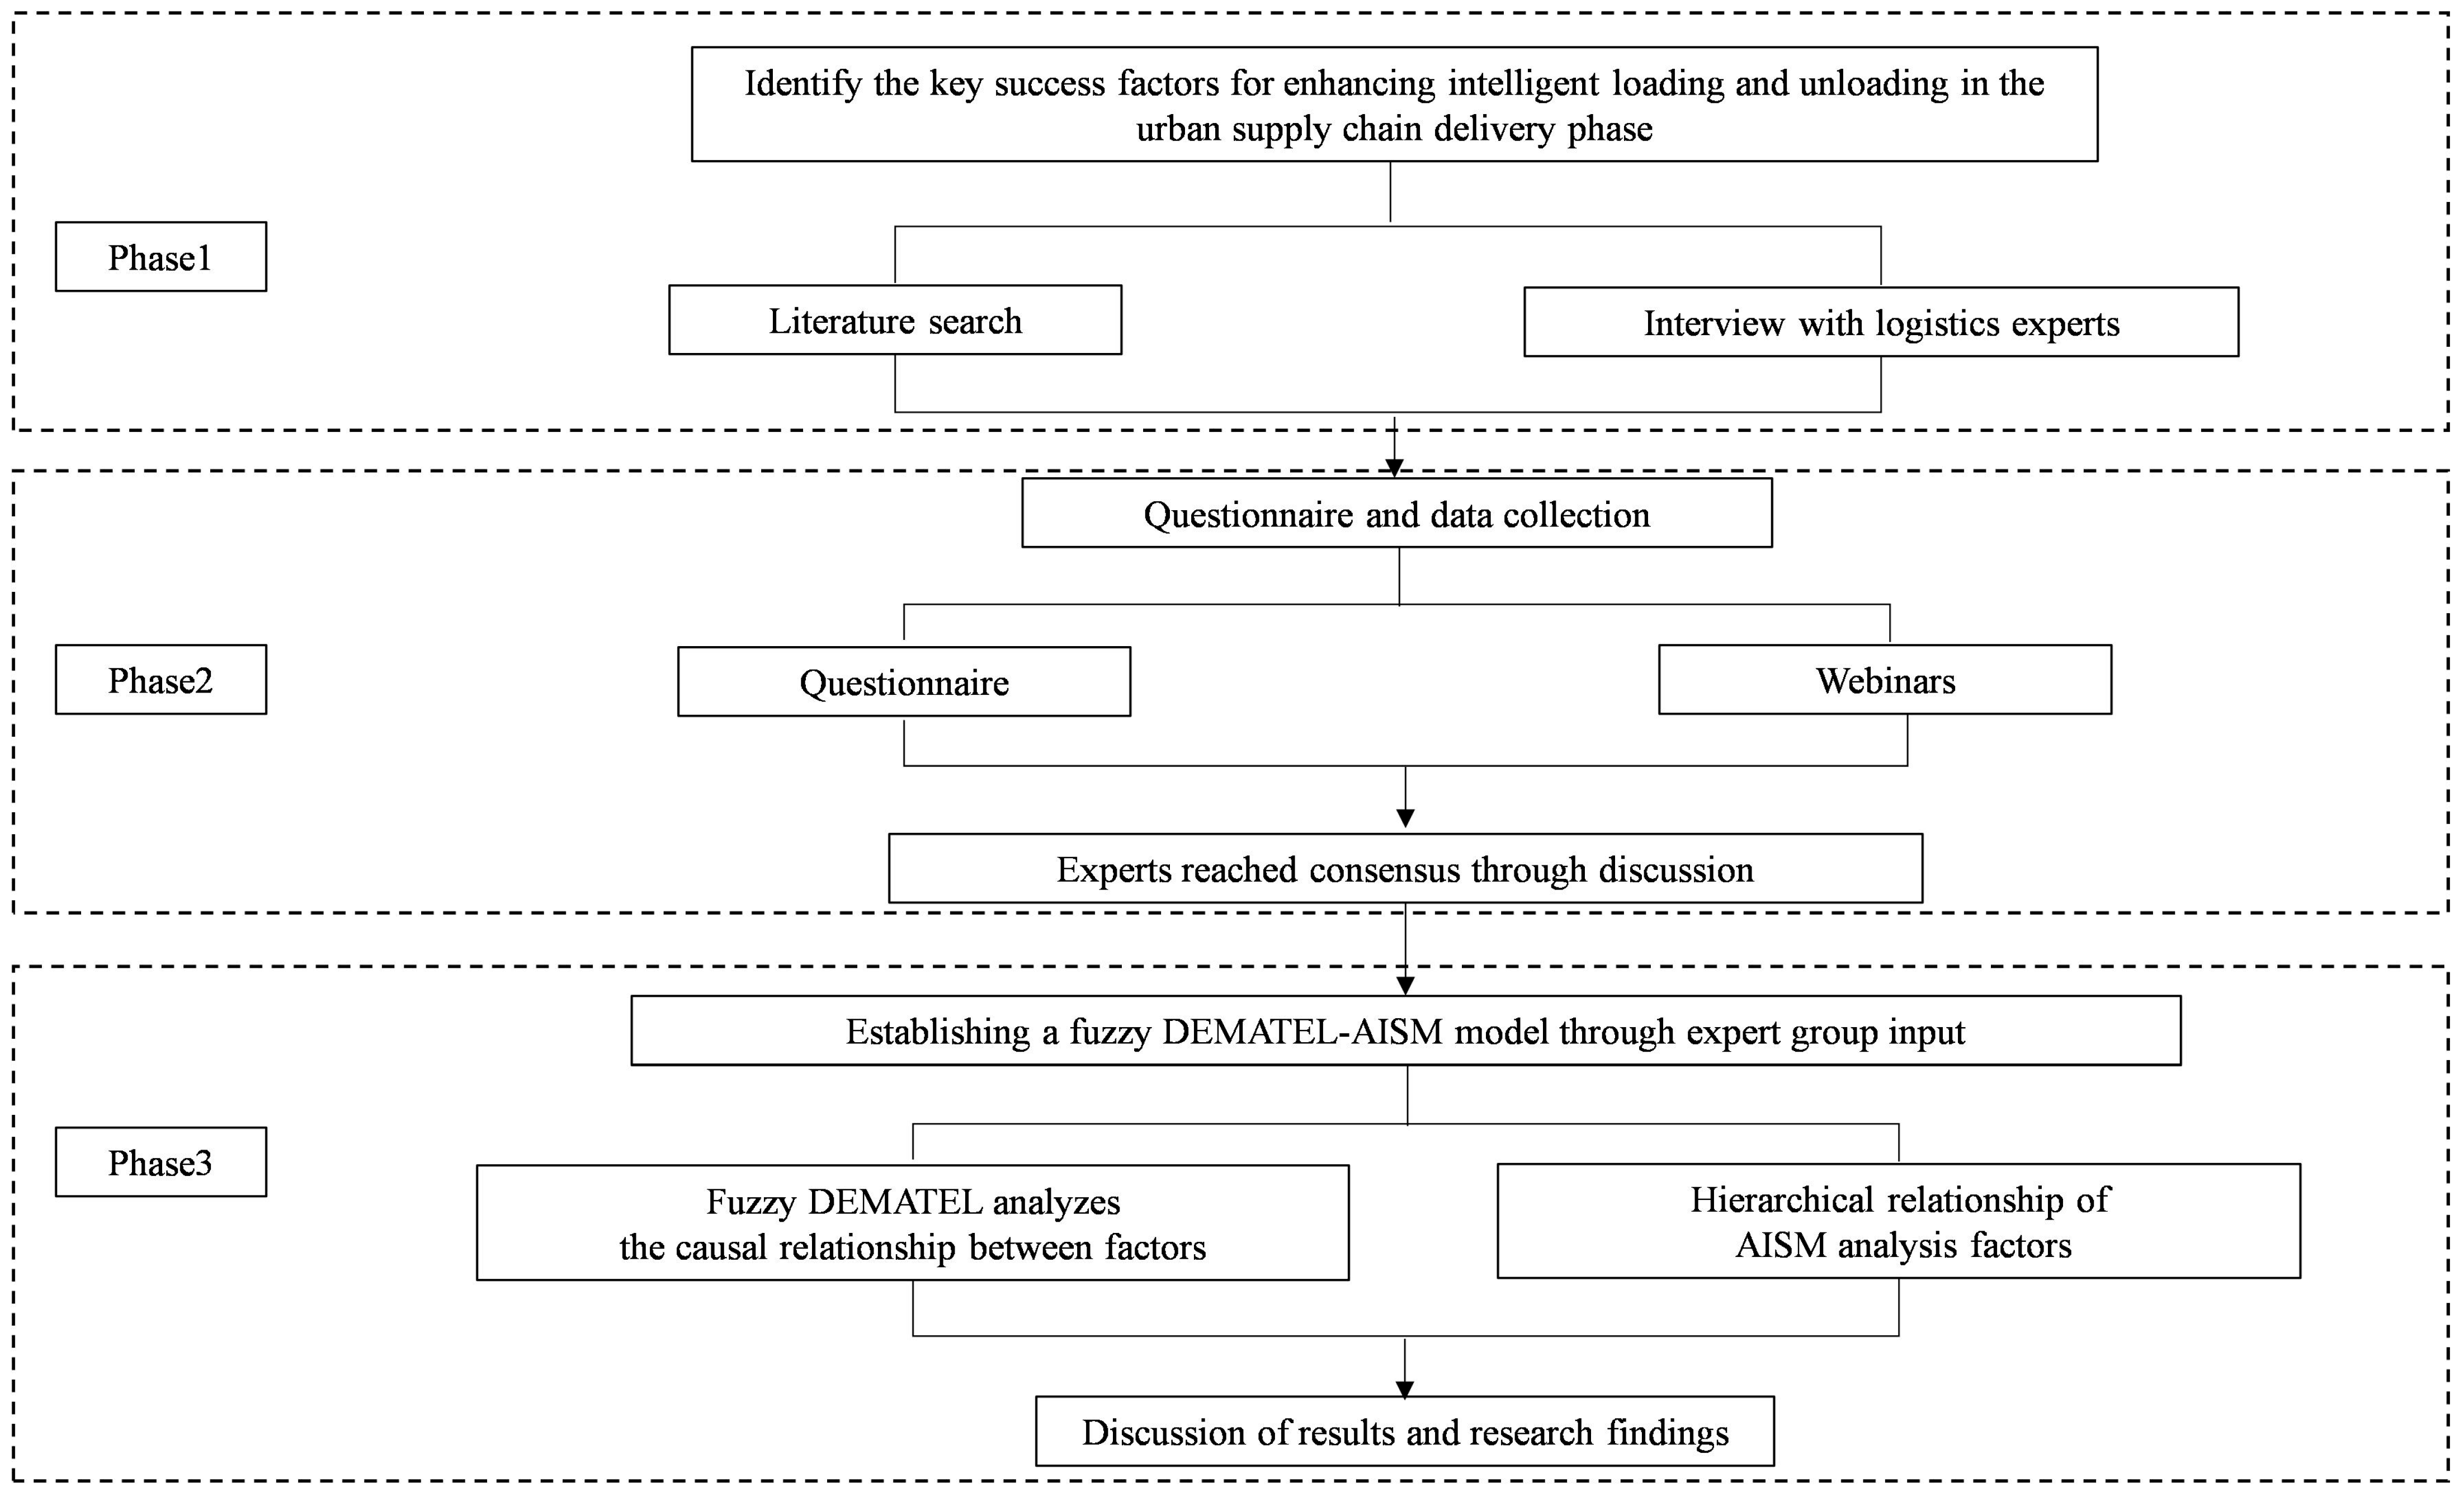
3.1. Research Design
3.2. Establishment of the Fuzzy DEMATEL-AISM Method
3.2.1. Fuzzy DEMATEL
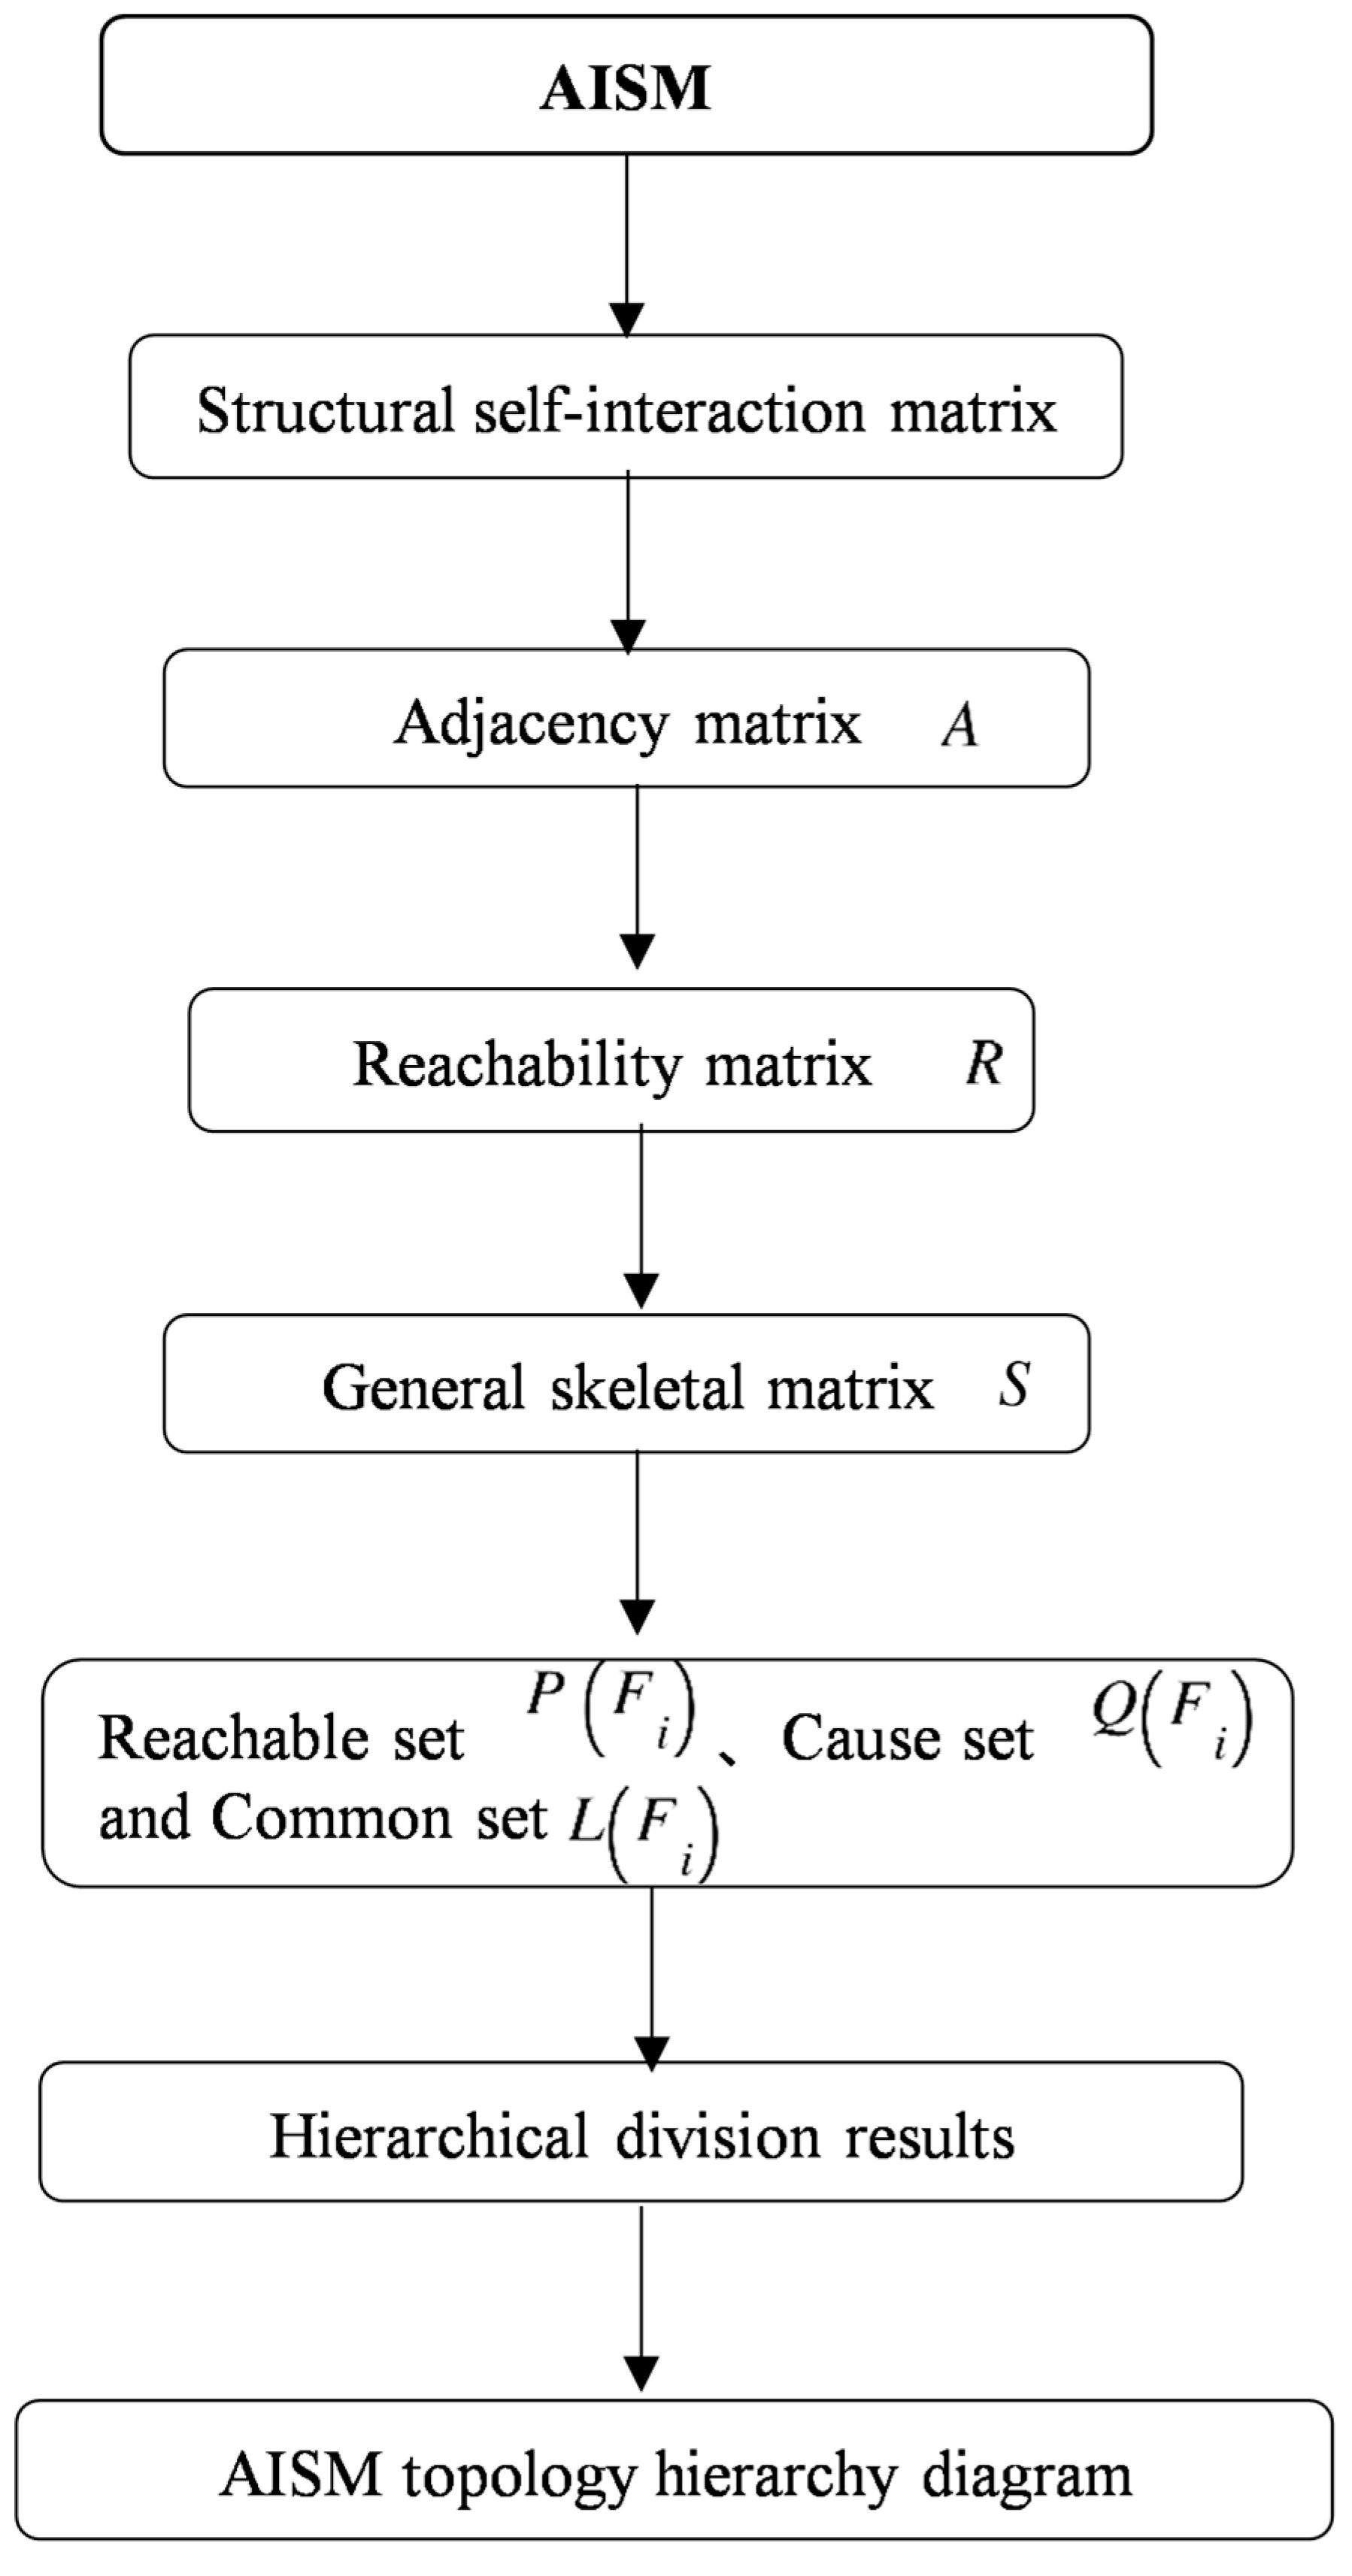
3.2.2. AISM
- 1.
- Calculate the adjacency matrix .
- 2.
- Establish the reachability matrix .
- 3.
- Establish a general skeletal matrix .
- 4.
- Draw the AISM topology hierarchy diagram.
3.3. The Development of Surveys
4. Results and Discussions
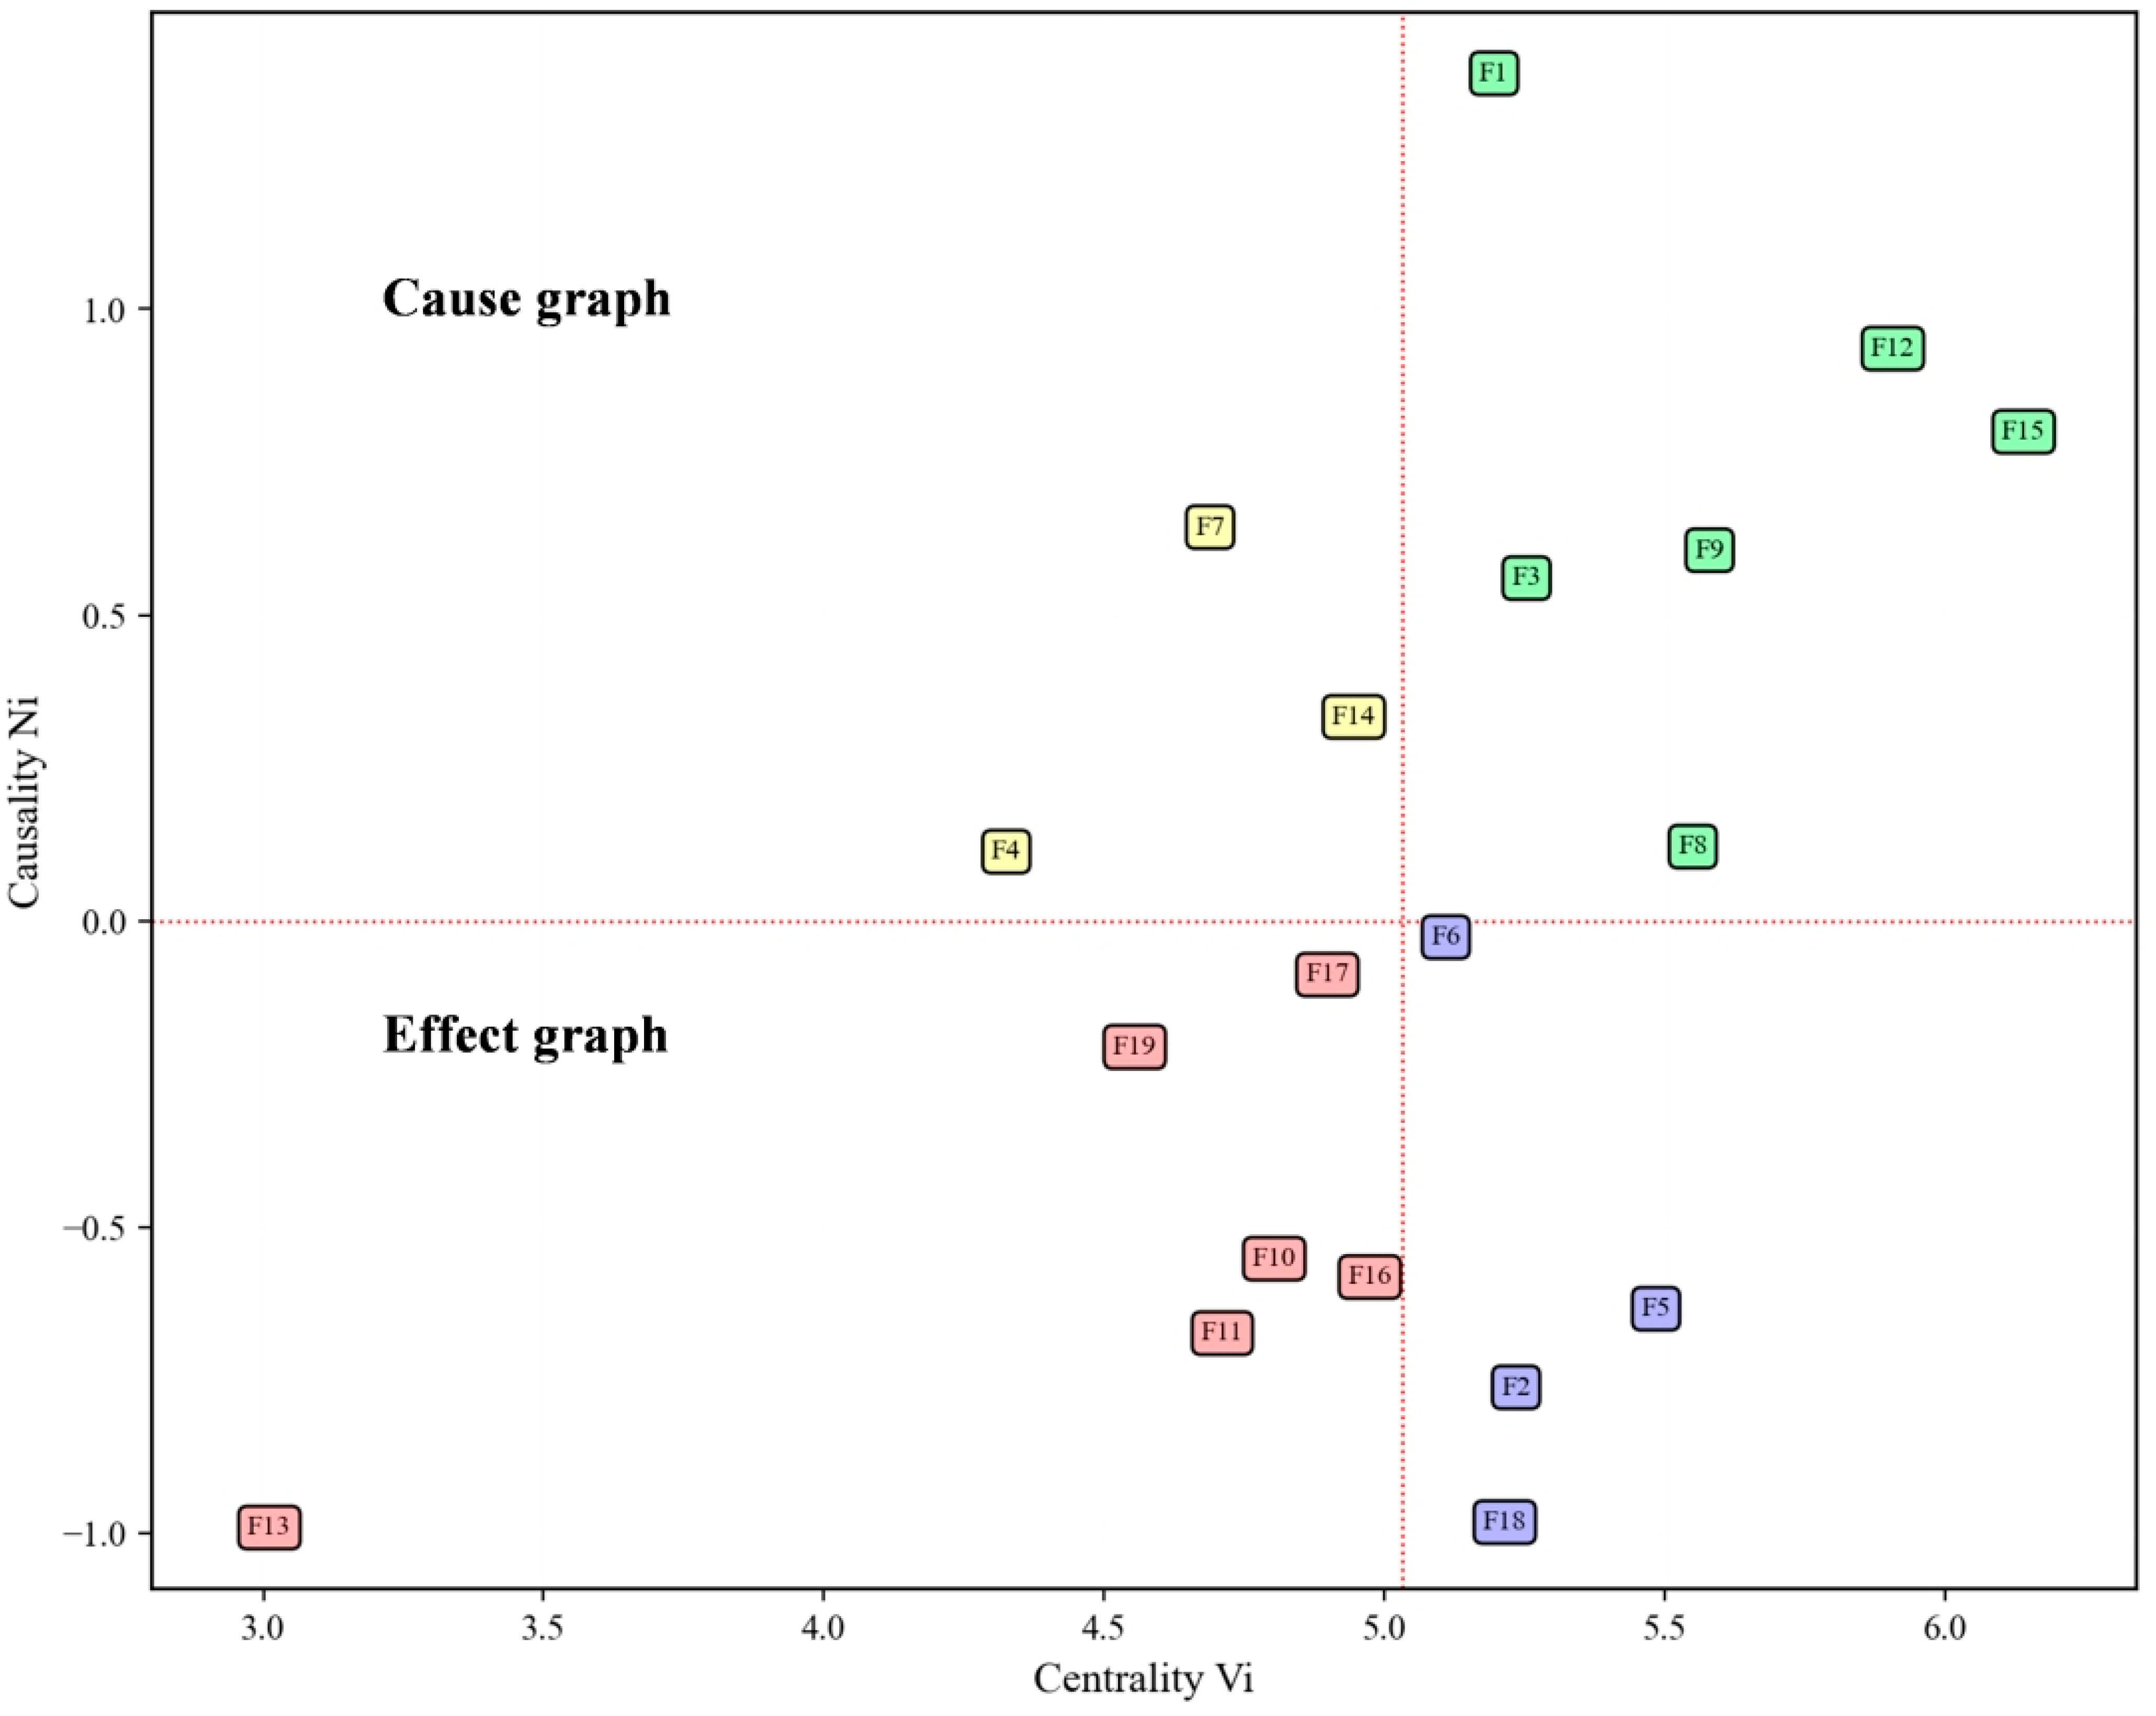
4.1. Fuzzy-DEMATEL Analysis
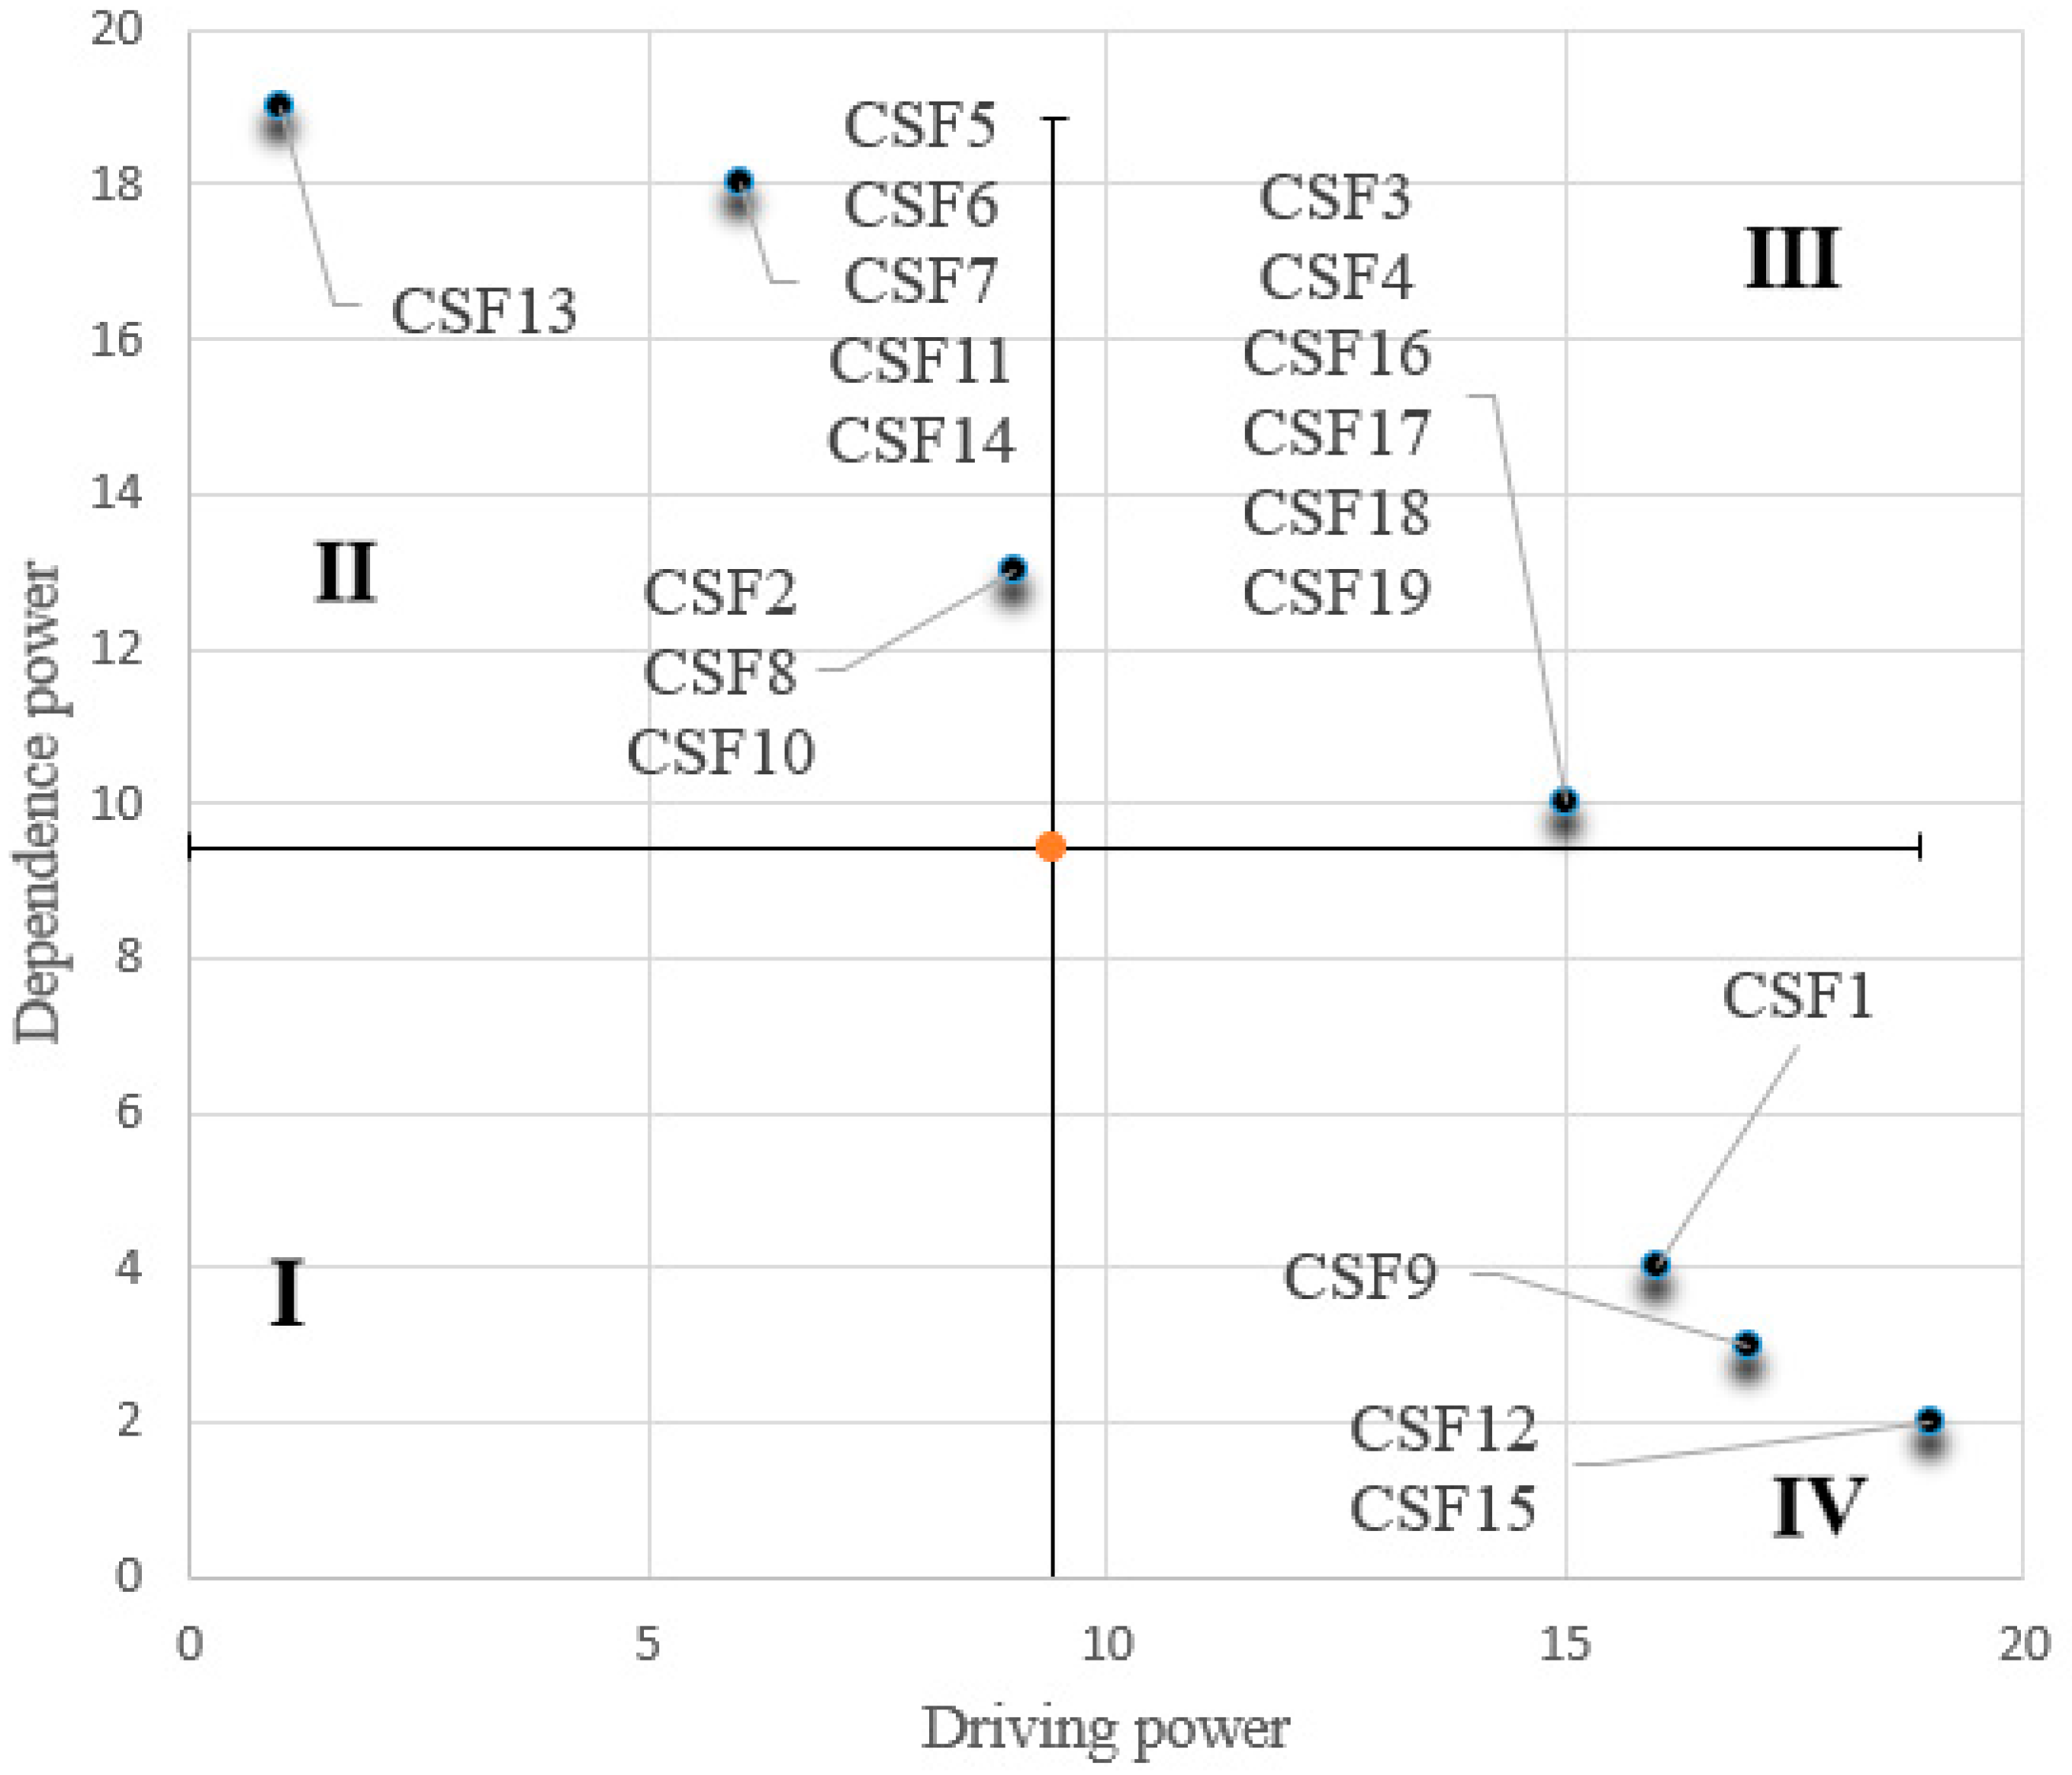
4.2. AISM Analysis
5. Conclusions
5.1. Theoretical Contributions
5.2. Management Contributions
6. Limitations and Future Research
Author Contributions
Funding
Data Availability Statement
Conflicts of Interest
Appendix A
Appendix B

| CSF | F1 | F2 | F3 | F4 | F5 | F6 | F7 | F8 | F9 | F10 | F11 | F12 | F13 | F14 | F15 | F16 | F17 | F18 | F19 |
|---|---|---|---|---|---|---|---|---|---|---|---|---|---|---|---|---|---|---|---|
| F1 | 0.0000 | 0.9667 | 0.9667 | 0.5000 | 0.7333 | 0.9667 | 0.7333 | 0.7333 | 0.7333 | 0.9667 | 0.7333 | 0.9667 | 0.5000 | 0.5000 | 0.9667 | 0.7333 | 0.2667 | 0.5000 | 0.5000 |
| F2 | 0.5000 | 0.0000 | 0.2667 | 0.2667 | 0.5000 | 0.5000 | 0.2667 | 0.2667 | 0.5000 | 0.2667 | 0.9667 | 0.2667 | 0.7333 | 0.5000 | 0.7333 | 0.9667 | 0.9667 | 0.2667 | 0.7333 |
| F3 | 0.7333 | 0.9667 | 0.0000 | 0.5000 | 0.9667 | 0.2667 | 0.2667 | 0.5000 | 0.5000 | 0.9667 | 0.2667 | 0.9667 | 0.5000 | 0.2667 | 0.9667 | 0.9667 | 0.7333 | 0.9667 | 0.7333 |
| F4 | 0.0333 | 0.5000 | 0.5000 | 0.0000 | 0.7333 | 0.2667 | 0.0333 | 0.5000 | 0.9667 | 0.2667 | 0.5000 | 0.7333 | 0.5000 | 0.9667 | 0.2667 | 0.5000 | 0.5000 | 0.9667 | 0.5000 |
| F5 | 0.5000 | 0.7333 | 0.9667 | 0.0333 | 0.0000 | 0.7333 | 0.7333 | 0.5000 | 0.2667 | 0.5000 | 0.7333 | 0.2667 | 0.7333 | 0.2667 | 0.7333 | 0.2667 | 0.9667 | 0.9667 | 0.2667 |
| F6 | 0.5000 | 0.9667 | 0.2667 | 0.7333 | 0.7333 | 0.0000 | 0.7333 | 0.9667 | 0.5000 | 0.5000 | 0.5000 | 0.2667 | 0.2667 | 0.5000 | 0.5000 | 0.9667 | 0.2667 | 0.9667 | 0.5000 |
| F7 | 0.5000 | 0.2667 | 0.5000 | 0.7333 | 0.7333 | 0.7333 | 0.0000 | 0.5000 | 0.2667 | 0.9667 | 0.5000 | 0.5000 | 0.7333 | 0.2667 | 0.7333 | 0.7333 | 0.9667 | 0.7333 | 0.9667 |
| F8 | 0.5000 | 0.9667 | 0.7333 | 0.7333 | 0.9667 | 0.7333 | 0.5000 | 0.0000 | 0.9667 | 0.2667 | 0.5000 | 0.7333 | 0.7333 | 0.7333 | 0.5000 | 0.7333 | 0.5000 | 0.2667 | 0.7333 |
| F9 | 0.5000 | 0.9667 | 0.7333 | 0.5000 | 0.7333 | 0.9667 | 0.5000 | 0.7333 | 0.0000 | 0.9667 | 0.9667 | 0.7333 | 0.5000 | 0.7333 | 0.7333 | 0.7333 | 0.5000 | 0.7333 | 0.7333 |
| F10 | 0.0333 | 0.2667 | 0.2667 | 0.7333 | 0.9667 | 0.2667 | 0.5000 | 0.7333 | 0.2667 | 0.0000 | 0.2667 | 0.9667 | 0.0333 | 0.5000 | 0.7333 | 0.2667 | 0.2667 | 0.9667 | 0.5000 |
| F11 | 0.2667 | 0.9667 | 0.2667 | 0.2667 | 0.2667 | 0.5000 | 0.2667 | 0.7333 | 0.5000 | 0.2667 | 0.0000 | 0.2667 | 0.2667 | 0.7333 | 0.5000 | 0.5000 | 0.9667 | 0.5000 | 0.2667 |
| F12 | 0.7333 | 0.7333 | 0.9667 | 0.5000 | 0.9667 | 0.7333 | 0.5000 | 0.9667 | 0.9667 | 0.7333 | 0.7333 | 0.0000 | 0.5000 | 0.9667 | 0.9667 | 0.9667 | 0.9667 | 0.7333 | 0.5000 |
| F13 | 0.2667 | 0.2667 | 0.0333 | 0.5000 | 0.0333 | 0.0333 | 0.2667 | 0.2667 | 0.7333 | 0.5000 | 0.2667 | 0.0333 | 0.0000 | 0.0333 | 0.2667 | 0.2667 | 0.0333 | 0.2667 | 0.0333 |
| F14 | 0.2667 | 0.5000 | 0.2667 | 0.7333 | 0.2667 | 0.7333 | 0.7333 | 0.9667 | 0.5000 | 0.9667 | 0.5000 | 0.9667 | 0.5000 | 0.0000 | 0.2667 | 0.5000 | 0.5000 | 0.9667 | 0.9667 |
| F15 | 0.7333 | 0.7333 | 0.7333 | 0.7333 | 0.7333 | 0.9667 | 0.7333 | 0.7333 | 0.7333 | 0.9667 | 0.7333 | 0.9667 | 0.7333 | 0.9667 | 0.0000 | 0.9667 | 0.7333 | 0.7333 | 0.9667 |
| F16 | 0.7333 | 0.2667 | 0.2667 | 0.7333 | 0.7333 | 0.5000 | 0.5000 | 0.5000 | 0.7333 | 0.2667 | 0.7333 | 0.2667 | 0.2667 | 0.5000 | 0.5000 | 0.0000 | 0.2667 | 0.9667 | 0.2667 |
| F17 | 0.2667 | 0.9667 | 0.9667 | 0.0333 | 0.9667 | 0.7333 | 0.5000 | 0.5000 | 0.5000 | 0.5000 | 0.7333 | 0.5000 | 0.2667 | 0.2667 | 0.5000 | 0.7333 | 0.0000 | 0.5000 | 0.5000 |
| F18 | 0.2667 | 0.5000 | 0.5000 | 0.5000 | 0.7333 | 0.5000 | 0.2667 | 0.5000 | 0.5000 | 0.7333 | 0.5000 | 0.7333 | 0.0333 | 0.5000 | 0.5000 | 0.5000 | 0.5000 | 0.0000 | 0.2667 |
| F19 | 0.0333 | 0.9667 | 0.5000 | 0.0333 | 0.9667 | 0.5000 | 0.2667 | 0.7333 | 0.2667 | 0.7333 | 0.9667 | 0.2667 | 0.5000 | 0.2667 | 0.7333 | 0.2667 | 0.2667 | 0.9667 | 0.0000 |
| CSF | F1 | F2 | F3 | F4 | F5 | F6 | F7 | F8 | F9 | F10 | F11 | F12 | F13 | F14 | F15 | F16 | F17 | F18 | F19 |
|---|---|---|---|---|---|---|---|---|---|---|---|---|---|---|---|---|---|---|---|
| F1 | 0.0885 | 0.2052 | 0.1739 | 0.1349 | 0.1942 | 0.1850 | 0.1449 | 0.1777 | 0.1662 | 0.1902 | 0.1758 | 0.1814 | 0.1289 | 0.1442 | 0.1913 | 0.1821 | 0.1386 | 0.1812 | 0.1475 |
| F2 | 0.0941 | 0.1017 | 0.0961 | 0.0872 | 0.1342 | 0.1198 | 0.0865 | 0.1092 | 0.1163 | 0.1068 | 0.1550 | 0.0987 | 0.1148 | 0.1097 | 0.1364 | 0.1556 | 0.1459 | 0.1217 | 0.1265 |
| F3 | 0.1285 | 0.1929 | 0.1047 | 0.1240 | 0.1985 | 0.1310 | 0.1069 | 0.1509 | 0.1420 | 0.1794 | 0.1376 | 0.1719 | 0.1202 | 0.1196 | 0.1813 | 0.1841 | 0.1576 | 0.1984 | 0.1508 |
| F4 | 0.0635 | 0.1337 | 0.1117 | 0.0693 | 0.1493 | 0.1042 | 0.0702 | 0.1243 | 0.1463 | 0.1078 | 0.1240 | 0.1311 | 0.0993 | 0.1408 | 0.1064 | 0.1250 | 0.1172 | 0.1669 | 0.1120 |
| F5 | 0.1003 | 0.1581 | 0.1482 | 0.0794 | 0.1115 | 0.1411 | 0.1218 | 0.1306 | 0.1074 | 0.1312 | 0.1449 | 0.1084 | 0.1204 | 0.0999 | 0.1459 | 0.1212 | 0.1551 | 0.1737 | 0.1048 |
| F6 | 0.1026 | 0.1759 | 0.1071 | 0.1293 | 0.1649 | 0.0985 | 0.1249 | 0.1653 | 0.1284 | 0.1332 | 0.1369 | 0.1126 | 0.0952 | 0.1220 | 0.1343 | 0.1687 | 0.1143 | 0.1808 | 0.1242 |
| F7 | 0.1044 | 0.1380 | 0.1274 | 0.1315 | 0.1723 | 0.1495 | 0.0808 | 0.1417 | 0.1172 | 0.1692 | 0.1405 | 0.1319 | 0.1267 | 0.1096 | 0.1545 | 0.1575 | 0.1611 | 0.1736 | 0.1564 |
| F8 | 0.1116 | 0.1914 | 0.1480 | 0.1367 | 0.1922 | 0.1576 | 0.1194 | 0.1154 | 0.1691 | 0.1320 | 0.1496 | 0.1519 | 0.1352 | 0.1461 | 0.1472 | 0.1670 | 0.1404 | 0.1510 | 0.1497 |
| F9 | 0.1177 | 0.2026 | 0.1557 | 0.1314 | 0.1903 | 0.1818 | 0.1274 | 0.1750 | 0.1150 | 0.1861 | 0.1881 | 0.1631 | 0.1256 | 0.1560 | 0.1724 | 0.1776 | 0.1501 | 0.1926 | 0.1588 |
| F10 | 0.0614 | 0.1138 | 0.0960 | 0.1154 | 0.1629 | 0.1015 | 0.0981 | 0.1358 | 0.0984 | 0.0859 | 0.1046 | 0.1440 | 0.0679 | 0.1095 | 0.1336 | 0.1068 | 0.1011 | 0.1638 | 0.1100 |
| F11 | 0.0735 | 0.1550 | 0.0892 | 0.0816 | 0.1108 | 0.1123 | 0.0799 | 0.1300 | 0.1089 | 0.0980 | 0.0832 | 0.0932 | 0.0791 | 0.1184 | 0.1130 | 0.1191 | 0.1395 | 0.1253 | 0.0918 |
| F12 | 0.1431 | 0.2035 | 0.1847 | 0.1418 | 0.2207 | 0.1817 | 0.1387 | 0.2027 | 0.1907 | 0.1861 | 0.1869 | 0.1294 | 0.1363 | 0.1819 | 0.2003 | 0.2067 | 0.1917 | 0.2078 | 0.1567 |
| F13 | 0.0447 | 0.0624 | 0.0377 | 0.0662 | 0.0491 | 0.0417 | 0.0478 | 0.0587 | 0.0865 | 0.0734 | 0.0589 | 0.0417 | 0.0300 | 0.0394 | 0.0580 | 0.0595 | 0.0399 | 0.0646 | 0.0391 |
| F14 | 0.0883 | 0.1513 | 0.1107 | 0.1325 | 0.1419 | 0.1489 | 0.1272 | 0.1716 | 0.1322 | 0.1680 | 0.1396 | 0.1613 | 0.1113 | 0.0927 | 0.1239 | 0.1425 | 0.1314 | 0.1863 | 0.1572 |
| F15 | 0.1424 | 0.2039 | 0.1696 | 0.1584 | 0.2080 | 0.1963 | 0.1538 | 0.1907 | 0.1775 | 0.2022 | 0.1884 | 0.1921 | 0.1517 | 0.1831 | 0.1394 | 0.2072 | 0.1774 | 0.2110 | 0.1868 |
| F16 | 0.1077 | 0.1176 | 0.0965 | 0.1179 | 0.1482 | 0.1192 | 0.1001 | 0.1230 | 0.1304 | 0.1068 | 0.1371 | 0.1011 | 0.0837 | 0.1107 | 0.1205 | 0.0911 | 0.1010 | 0.1654 | 0.0962 |
| F17 | 0.0862 | 0.1727 | 0.1478 | 0.0781 | 0.1741 | 0.1409 | 0.1068 | 0.1306 | 0.1212 | 0.1290 | 0.1463 | 0.1211 | 0.0910 | 0.1003 | 0.1316 | 0.1500 | 0.0931 | 0.1456 | 0.1191 |
| F18 | 0.0766 | 0.1291 | 0.1092 | 0.1002 | 0.1469 | 0.1156 | 0.0832 | 0.1206 | 0.1123 | 0.1327 | 0.1191 | 0.1283 | 0.0665 | 0.1082 | 0.1189 | 0.1222 | 0.1145 | 0.1002 | 0.0944 |
| F19 | 0.0626 | 0.1613 | 0.1086 | 0.0708 | 0.1619 | 0.1163 | 0.0840 | 0.1357 | 0.0977 | 0.1335 | 0.1509 | 0.0978 | 0.0985 | 0.0932 | 0.1353 | 0.1085 | 0.1024 | 0.1627 | 0.0768 |
| CSF | F1 | F2 | F3 | F4 | F5 | F6 | F7 | F8 | F9 | F10 | F11 | F12 | F13 | F14 | F15 | F16 | F17 | F18 | F19 |
|---|---|---|---|---|---|---|---|---|---|---|---|---|---|---|---|---|---|---|---|
| F1 | 1 | 0 | 1 | 1 | 0 | 0 | 0 | 0 | 0 | 0 | 0 | 0 | 0 | 0 | 0 | 1 | 1 | 1 | 0 |
| F2 | 0 | 1 | 0 | 0 | 1 | 0 | 1 | 1 | 0 | 0 | 1 | 0 | 0 | 1 | 0 | 0 | 0 | 0 | 0 |
| F3 | 0 | 1 | 1 | 1 | 0 | 0 | 0 | 0 | 0 | 1 | 1 | 0 | 0 | 0 | 0 | 1 | 1 | 1 | 1 |
| F4 | 0 | 1 | 1 | 1 | 0 | 0 | 0 | 0 | 0 | 1 | 1 | 0 | 0 | 0 | 0 | 1 | 1 | 1 | 1 |
| F5 | 0 | 0 | 0 | 0 | 1 | 0 | 1 | 0 | 0 | 0 | 0 | 0 | 1 | 1 | 0 | 0 | 0 | 0 | 0 |
| F6 | 0 | 0 | 0 | 0 | 0 | 1 | 0 | 0 | 0 | 0 | 0 | 0 | 1 | 1 | 0 | 0 | 0 | 0 | 0 |
| F7 | 0 | 0 | 0 | 0 | 1 | 0 | 1 | 0 | 0 | 0 | 1 | 0 | 1 | 1 | 0 | 0 | 0 | 0 | 0 |
| F8 | 0 | 1 | 0 | 0 | 1 | 1 | 1 | 1 | 0 | 1 | 1 | 0 | 0 | 1 | 0 | 0 | 0 | 0 | 0 |
| F9 | 1 | 0 | 0 | 0 | 0 | 0 | 0 | 0 | 1 | 0 | 0 | 0 | 0 | 0 | 0 | 0 | 0 | 0 | 1 |
| F10 | 0 | 0 | 0 | 0 | 0 | 1 | 1 | 1 | 0 | 1 | 1 | 0 | 0 | 1 | 0 | 0 | 0 | 0 | 0 |
| F11 | 0 | 0 | 0 | 0 | 0 | 0 | 1 | 0 | 0 | 0 | 1 | 0 | 1 | 1 | 0 | 0 | 0 | 0 | 0 |
| F12 | 0 | 0 | 0 | 0 | 0 | 0 | 0 | 0 | 1 | 0 | 0 | 1 | 0 | 0 | 1 | 0 | 0 | 0 | 0 |
| F13 | 0 | 0 | 0 | 0 | 0 | 0 | 0 | 0 | 0 | 0 | 0 | 0 | 1 | 0 | 0 | 0 | 0 | 0 | 0 |
| F14 | 0 | 0 | 0 | 0 | 1 | 1 | 1 | 0 | 0 | 0 | 1 | 0 | 1 | 1 | 0 | 0 | 0 | 0 | 0 |
| F15 | 0 | 0 | 0 | 0 | 0 | 0 | 0 | 0 | 1 | 0 | 0 | 1 | 0 | 0 | 1 | 0 | 0 | 0 | 0 |
| F16 | 0 | 1 | 1 | 1 | 0 | 0 | 0 | 1 | 0 | 1 | 0 | 0 | 0 | 0 | 0 | 1 | 1 | 1 | 1 |
| F17 | 0 | 1 | 1 | 1 | 0 | 0 | 0 | 1 | 0 | 1 | 0 | 0 | 0 | 0 | 0 | 1 | 1 | 1 | 1 |
| F18 | 0 | 1 | 1 | 1 | 0 | 0 | 0 | 1 | 0 | 1 | 0 | 0 | 0 | 0 | 0 | 1 | 1 | 1 | 1 |
| F19 | 0 | 1 | 1 | 1 | 0 | 0 | 1 | 1 | 0 | 1 | 0 | 0 | 0 | 0 | 0 | 1 | 1 | 1 | 1 |
| CSF | F1 | F2 | F3 | F4 | F5 | F6 | F7 | F8 | F9 | F10 | F11 | F12 | F13 | F14 | F15 | F16 | F17 | F18 | F19 |
|---|---|---|---|---|---|---|---|---|---|---|---|---|---|---|---|---|---|---|---|
| F1 | 0 | 0 | 1 | 0 | 0 | 0 | 0 | 0 | 0 | 0 | 0 | 0 | 0 | 0 | 0 | 0 | 0 | 0 | 0 |
| F2 | 0 | 0 | 0 | 0 | 1 | 0 | 0 | 1 | 0 | 0 | 0 | 0 | 0 | 0 | 0 | 0 | 0 | 0 | 0 |
| F3 | 0 | 1 | 0 | 1 | 0 | 0 | 0 | 0 | 0 | 0 | 0 | 0 | 0 | 0 | 0 | 0 | 0 | 0 | 0 |
| F4 | 0 | 0 | 0 | 0 | 0 | 0 | 0 | 0 | 0 | 0 | 0 | 0 | 0 | 0 | 0 | 1 | 0 | 0 | 0 |
| F5 | 0 | 0 | 0 | 0 | 0 | 1 | 0 | 0 | 0 | 0 | 0 | 0 | 1 | 0 | 0 | 0 | 0 | 0 | 0 |
| F6 | 0 | 0 | 0 | 0 | 0 | 0 | 1 | 0 | 0 | 0 | 0 | 0 | 0 | 0 | 0 | 0 | 0 | 0 | 0 |
| F7 | 0 | 0 | 0 | 0 | 0 | 0 | 0 | 0 | 0 | 0 | 1 | 0 | 0 | 0 | 0 | 0 | 0 | 0 | 0 |
| F8 | 0 | 0 | 0 | 0 | 0 | 0 | 0 | 0 | 0 | 1 | 0 | 0 | 0 | 0 | 0 | 0 | 0 | 0 | 0 |
| F9 | 1 | 0 | 0 | 0 | 0 | 0 | 0 | 0 | 0 | 0 | 0 | 0 | 0 | 0 | 0 | 0 | 0 | 0 | 0 |
| F10 | 0 | 1 | 0 | 0 | 0 | 0 | 0 | 0 | 0 | 0 | 0 | 0 | 0 | 0 | 0 | 0 | 0 | 0 | 0 |
| F11 | 0 | 0 | 0 | 0 | 0 | 0 | 0 | 0 | 0 | 0 | 0 | 0 | 0 | 1 | 0 | 0 | 0 | 0 | 0 |
| F12 | 0 | 0 | 0 | 0 | 0 | 0 | 0 | 0 | 1 | 0 | 0 | 0 | 0 | 0 | 1 | 0 | 0 | 0 | 0 |
| F13 | 0 | 0 | 0 | 0 | 0 | 0 | 0 | 0 | 0 | 0 | 0 | 0 | 0 | 0 | 0 | 0 | 0 | 0 | 0 |
| F14 | 0 | 0 | 0 | 0 | 1 | 0 | 0 | 0 | 0 | 0 | 0 | 0 | 0 | 0 | 0 | 0 | 0 | 0 | 0 |
| F15 | 0 | 0 | 0 | 0 | 0 | 0 | 0 | 0 | 0 | 0 | 0 | 1 | 0 | 0 | 0 | 0 | 0 | 0 | 0 |
| F16 | 0 | 0 | 0 | 0 | 0 | 0 | 0 | 0 | 0 | 0 | 0 | 0 | 0 | 0 | 0 | 0 | 1 | 0 | 0 |
| F17 | 0 | 0 | 0 | 0 | 0 | 0 | 0 | 0 | 0 | 0 | 0 | 0 | 0 | 0 | 0 | 0 | 0 | 1 | 0 |
| F18 | 0 | 0 | 0 | 0 | 0 | 0 | 0 | 0 | 0 | 0 | 0 | 0 | 0 | 0 | 0 | 0 | 0 | 0 | 1 |
| F19 | 0 | 0 | 1 | 0 | 0 | 0 | 0 | 0 | 0 | 0 | 0 | 0 | 0 | 0 | 0 | 0 | 0 | 0 | 0 |
| CSF | Reachable Set | Cause Set | Common set |
|---|---|---|---|
| F1 | 1, 2, 3, 4, 5, 6, 7, 8, 10, 11, 13, 14, 16, 17, 18, 19 | 1, 9, 12, 15 | 1 |
| F2 | 2, 5, 6, 7, 8, 10, 11, 13, 14 | 1, 2, 3, 4, 8, 9, 10, 12, 15, 16, 17, 18, 19 | 2, 8, 10 |
| F3 | 2, 3, 4, 5, 6, 7, 8, 10, 11, 13, 14, 16, 17, 18, 19 | 1, 3, 4, 9, 12, 15, 16, 17, 18, 19 | 3, 4, 16, 17, 18, 19 |
| F4 | 2, 3, 4, 5, 6, 7, 8, 10, 11, 13, 14, 16, 17, 18, 19 | 1, 3, 4, 9, 12, 15, 16, 17, 18, 19 | 3, 4, 16, 17, 18, 19 |
| F5 | 5, 6, 7, 11, 13, 14 | 1, 2, 3, 4, 5, 6, 7, 8, 9, 10, 11, 12, 14, 15, 16, 17, 18, 19 | 5, 6, 7, 11, 14 |
| F6 | 5, 6, 7, 11, 13, 14 | 1, 2, 3, 4, 5, 6, 7, 8, 9, 10, 11, 12, 14, 15, 16, 17, 18, 19 | 5, 6, 7, 11, 14 |
| F7 | 5, 6, 7, 11, 13, 14 | 1, 2, 3, 4, 5, 6, 7, 8, 9, 10, 11, 12, 14, 15, 16, 17, 18, 19 | 5, 6, 7, 11, 14 |
| F8 | 2, 5, 6, 7, 8, 10, 11, 13, 14 | 1, 2, 3, 4, 5, 6, 7, 8, 9, 10, 11, 12, 14, 15, 16, 17, 18, 19 | 2, 8, 10 |
| F9 | 1, 2, 3, 4, 5, 6, 7, 8, 9, 10, 11, 13, 14, 16, 17, 18, 19 | 9, 12, 15 | 9 |
| F10 | 2, 5, 6, 7, 8, 10, 11, 13, 14 | 1, 2, 3, 4, 8, 9, 10, 12, 15, 16, 17, 18, 19 | 2, 8, 10 |
| F11 | 5, 6, 7, 11, 13, 14 | 1, 2, 3, 4, 5, 6, 7, 8, 9, 10, 11, 12, 14, 15, 16, 17, 18, 19 | 5, 6, 7, 11, 14 |
| F12 | 1, 2, 3, 4, 5, 6, 7, 8, 9, 10, 11, 12, 13, 14, 15, 16, 17, 18, 19 | 12, 15 | 12, 15 |
| F13 | 13 | 13 | 13 |
| F14 | 5, 6, 7, 11, 13, 14 | 1, 2, 3, 4, 5, 6, 7, 8, 9, 10, 11, 12, 14, 15, 16, 17, 18, 19 | 5, 6, 7, 11, 14 |
| F15 | 1, 2, 3, 4, 5, 6, 7, 8, 9, 10, 11, 12, 13, 14, 15, 16, 17, 18, 19 | 12, 15 | 12, 15 |
| F16 | 2, 3, 4, 5, 6, 7, 8, 10, 11, 13, 14, 16, 17, 18, 19 | 1, 3, 4, 9, 12, 15, 16, 17, 18, 19 | 3, 4, 16, 17, 18, 19 |
| F17 | 2, 3, 4, 5, 6, 7, 8, 10, 11, 13, 14, 16, 17, 18, 19 | 1, 3, 4, 9, 12, 15, 16, 17, 18, 19 | 3, 4, 16, 17, 18, 19 |
| F18 | 2, 3, 4, 5, 6, 7, 8, 10, 11, 13, 14, 16, 17, 18, 19 | 1, 3, 4, 9, 12, 15, 16, 17, 18, 19 | 3, 4, 16, 17, 18, 19 |
| F19 | 2, 3, 4, 5, 6, 7, 8, 10, 11, 13, 14, 16, 17, 18, 19 | 1, 3, 4, 9, 12, 15, 16, 17, 18, 19 | 3, 4, 16, 17, 18, 19 |
References
- Ha, A.Y.; Li, L.; Ng, S.M. Price and delivery logistics competition in a supply chain. Manag. Sci. 2003, 49, 1139–1153. [Google Scholar]
- Bushuev, M.A.; Guiffrida, A.L. Optimal position of supply chain delivery window: Concepts and general conditions. Int. J. Prod. Econ. 2012, 137, 226–234. [Google Scholar]
- Belhadi, A.; Mani, V.; Kamble, S.S.; Khan, S.A.R.; Verma, S. Artificial intelligence-driven innovation for enhancing supply chain resilience and performance under the effect of supply chain dynamism: An empirical investigation. Ann. Oper. Res. 2024, 333, 627–652. [Google Scholar]
- Magazzino, C.; Mele, M.; Schneider, N. A new artificial neural networks algorithm to analyze the nexus among logistics performance, energy demand, and environmental degradation. Struct. Change Econ. Dyn. 2022, 60, 315–328. [Google Scholar]
- Friesz, T.L.; Lee, I.; Lin, C.C. Competition and disruption in a dynamic urban supply chain. Transp. Res. Part B. Methodol. 2011, 45, 1212–1231. [Google Scholar] [CrossRef]
- Mondragon, A.E.C.; Lalwani, C.S.; Mondragon, E.S.C.; Mondragon, C.E.C.; Pawar, K.S. Intelligent transport systems in multimodal logistics: A case of role and contribution through wireless vehicular networks in a sea port location. Int. J. Prod. Econ. 2012, 137, 165–175. [Google Scholar]
- Yi, Z.; Mi, S.; Tong, T.; Li, H.; Lin, Y.; Wang, W.; Li, J. Intelligent initial model and case design analysis of smart factory for shipyard in China. Eng. Appl. Artif. Intell. 2023, 123, 106426. [Google Scholar]
- Carlan, V.; Ceulemans, D.; van Hassel, E.; Derammelaere, S.; Vanelslander, T. Automation in cargo loading/unloading processes: Do unmanned loading technologies bring benefits when both purchase and operational cost are considered? J. Shipp. Trade 2023, 8, 20. [Google Scholar]
- Trkman, P. The critical success factors of business process management. Int. J. Inf. Manag. 2010, 30, 125–134. [Google Scholar]
- Bhatia, P.; Diaz-Elsayed, N. Facilitating decision-making for the adoption of smart manufacturing technologies by SMEs via fuzzy TOPSIS. Int. J. Prod. Econ. 2023, 257, 108762. [Google Scholar] [CrossRef]
- Kannan, D. Role of multiple stakeholders and the critical success factor theory for the sustainable supplier selection process. Int. J. Prod. Econ. 2018, 195, 391–418. [Google Scholar]
- Brunetti, M.; Mes, M.; Lalla-Ruiz, E. Smart logistics nodes: Concept and classification. Int. J. Logist. Res. Appl. 2024, 11, 1984–2020. [Google Scholar]
- Song, Y.; Yu, F.R.; Zhou, L.; Yang, X.; He, Z. Applications of the Internet of Things (IoT) in smart logistics: A comprehensive survey. IEEE Internet Things J. 2020, 8, 4250–4274. [Google Scholar]
- Vachon, S.; Klassen, R.D. An exploratory investigation of the effects of supply chain complexity on delivery performance. IEEE Trans. Eng. Manag. 2002, 49, 218–230. [Google Scholar]
- Su, M.; Woo, S.H.; Chen, X.; Park, K.S. Identifying critical success factors for the agri-food cold chain‘s sustainable development: When the strategy system comes into play. Bus. Strategy Environ. 2023, 32, 444–461. [Google Scholar]
- Ding, Y.; Jin, M.; Li, S.; Feng, D. Smart logistics based on the internet of things technology: An overview. Int. J. Logist. Res. Appl. 2021, 24, 323–345. [Google Scholar]
- Slater, S.F.; Hult, G.T.M.; Olson, E.M. On the importance of matching strategic behavior and target market selection to business strategy in high-tech markets. J. Acad. Mark. Sci. 2007, 35, 5–17. [Google Scholar]
- Kuhlang, P.; Edtmayr, T.; Sihn, W. Methodical approach to increase productivity and reduce lead time in assembly and production-logistic processes. CIRP J. Manuf. Sci. Technol. 2011, 4, 24–32. [Google Scholar]
- Vicente, J.J. Optimizing Supply Chain Inventory: A Mixed Integer Linear Programming Approach. Systems 2025, 13, 33. [Google Scholar] [CrossRef]
- Lu, Y.; Xu, X.; Wang, L. Smart manufacturing process and system automation–a critical review of the standards and envisioned scenarios. J. Manuf. Syst. 2020, 56, 312–325. [Google Scholar]
- Nof, S.Y.; Morel, G.; Monostori, L.; Molina, A.; Filip, F. From plant and logistics control to multi-enterprise collaboration. Annu. Rev. Control 2006, 30, 55–68. [Google Scholar]
- Su, M.; Fang, M.; Pang, Q.; Park, K.S. Exploring the role of sustainable logistics service providers in multinational supply chain cooperation: An integrated theory-based perspective. Front. Environ. Sci. 2022, 10, 976211. [Google Scholar]
- Hu, W.; Mao, J.; Wei, K. Energy-efficient rail guided vehicle routing for two-sided loading/unloading automated freight handling system. Eur. J. Oper. Res. 2017, 258, 943–957. [Google Scholar]
- Park, Y.B. ICMESE: Intelligent consultant system for material handling equipment selection and evaluation. J. Manuf. Syst. 1996, 15, 325–333. [Google Scholar]
- De Ryck, M.; Versteyhe, M.; Debrouwere, F. Automated guided vehicle systems, state-of-the-art control algorithms and techniques. J. Manuf. Syst. 2020, 54, 152–173. [Google Scholar]
- Thylén, N.; Wänström, C.; Hanson, R. Challenges in introducing automated guided vehicles in a production facility–interactions between human, technology, and organisation. Int. J. Prod. Res. 2023, 61, 7809–7829. [Google Scholar]
- Wu, C.S.; Lin, C.T.; Lee, C. Optimal marketing strategy: A decision-making with ANP and TOPSIS. Int. J. Prod. Econ. 2010, 127, 190–196. [Google Scholar]
- Govindan, K. Sustainable consumption and production in the food supply chain: A conceptual framework. Int. J. Prod. Econ. 2018, 195, 419–431. [Google Scholar] [CrossRef]
- Zhang, G.; Zhang, Z. An Evolutionary Game Model of a Regional Logistics Service Supply Chain Complex Network in a Blockchain Environment. Systems 2025, 13, 32. [Google Scholar] [CrossRef]
- Wittmann, C.M.; Hunt, S.D.; Arnett, D.B. Explaining alliance success: Competences, resources, relational factors, and resource-advantage theory. Ind. Mark. Manag. 2009, 38, 743–756. [Google Scholar]
- Griffith, D.A.; Yalcinkaya, G. Resource-advantage theory: A foundation for new insights into global advertising research. Int. J. Advert. 2010, 29, 15–36. [Google Scholar] [CrossRef]
- Bag, S.; Gupta, S.; Kumar, A.; Sivarajah, U. An integrated artificial intelligence framework for knowledge creation and B2B marketing rational decision making for improving firm performance. Ind. Mark. Manag. 2021, 92, 178–189. [Google Scholar] [CrossRef]
- Pei, R.; Su, Z. Key Success Factors for Export Structure Optimization in East Asian Countries Through Global Value Chain (GVC) Reorganization. Systems 2025, 13, 22. [Google Scholar] [CrossRef]
- Wani, T.A.; Ali, S.W. Innovation diffusion theory. J. Gen. Manag. Res. 2015, 3, 101–118. [Google Scholar]
- Su, M.; Fang, M.; Kim, J.; Park, K.S. Sustainable marketing innovation and consumption: Evidence from cold chain food online retail. J. Clean. Prod. 2022, 340, 130806. [Google Scholar] [CrossRef]
- Gu, V.C.; Schniederjans, M.J.; Cao, Q. Diffusion of innovation: Customer relationship management adoption in supply chain organizations. Int. J. Qual. Innov. 2015, 1, 6. [Google Scholar] [CrossRef]
- Hokmabadi, H.; Rezvani, S.M.; de Matos, C.A. Business Resilience for Small and Medium Enterprises and Startups by Digital Transformation and the Role of Marketing Capabilities—A Systematic Review. Systems 2024, 12, 220. [Google Scholar] [CrossRef]
- Lima-Junior, F.R.; Carpinetti, L.C.R. Combining SCOR® model and fuzzy TOPSIS for supplier evaluation and management. Int. J. Prod. Econ. 2016, 174, 128–141. [Google Scholar] [CrossRef]
- Lin, R.J. Using fuzzy DEMATEL to evaluate the green supply chain management practices. J. Clean. Prod. 2013, 40, 32–39. [Google Scholar] [CrossRef]
- Mangla, S.K.; Luthra, S.; Rich, N.; Kumar, D.; Rana, N.P.; Dwivedi, Y.K. Enablers to implement sustainable initiatives in agri-food supply chains. Int. J. Prod. Econ. 2018, 203, 379–393. [Google Scholar] [CrossRef]
- Chen, H.; Liu, S.; Wanyan, X.; Pang, L.; Dang, Y.; Zhu, K.; Yu, X. Influencing factors of novice pilot SA based on DEMATEL-AISM method: From pilots’ view. Heliyon 2023, 9, e13425. [Google Scholar] [CrossRef] [PubMed]
- Chang, B.; Chang, C.W.; Wu, C.H. Fuzzy DEMATEL method for developing supplier selection criteria. Expert Syst. Appl. 2011, 38, 1850–1858. [Google Scholar] [CrossRef]
- Quezada, L.E.; López-Ospina, H.A.; Ortiz, C.; Oddershede, A.M.; Palominos, P.I.; Jofré, P.A. A DEMATEL-based method for prioritizing strategic projects using the perspectives of the Balanced Scorecard. Int. J. Prod. Econ. 2022, 249, 108518. [Google Scholar] [CrossRef]
- Sharma, S.K.; Routroy, S.; Singh, R.K.; Nag, U. Analysis of supply chain vulnerability factors in manufacturing enterprises: A fuzzy DEMATEL approach. Int. J. Logist. Res. Appl. 2024, 27, 814–841. [Google Scholar] [CrossRef]
- Mukherjee, A.A.; Raj, A.; Aggarwal, S. Identification of barriers and their mitigation strategies for industry 5.0 implementation in emerging economies. Int. J. Prod. Econ. 2023, 257, 108770. [Google Scholar] [CrossRef]
- Karmaker, C.L.; Bari, A.M.; Anam, M.Z.; Ahmed, T.; Ali, S.M.; de Jesus Pacheco, D.A.; Moktadir, M.A. Industry 5.0 challenges for post-pandemic supply chain sustainability in an emerging economy. Int. J. Prod. Econ. 2023, 258, 108806. [Google Scholar] [CrossRef]
- Xu, W.; Lu, Y.; Proverbs, D. An evaluation of factors influencing the vulnerability of emergency logistics supply chains. Int. J. Logist. Res. Appl. 2024, 27, 1891–1924. [Google Scholar] [CrossRef]
- Asif, M.; Fisscher, O.A.; de Bruijn, E.J.; Pagell, M. Integration of management systems: A methodology for operational excellence and strategic flexibility. Oper. Manag. Res. 2010, 3, 146–160. [Google Scholar] [CrossRef]
- Bai, C.; Sarkis, J. A grey-based DEMATEL model for evaluating business process management critical success factors. Int. J. Prod. Econ. 2013, 146, 281–292. [Google Scholar] [CrossRef]
- Patel, S.A.; Kamrani, A.K. Intelligent decision support system for diagnosis and maintenance of automated systems. Comput. Ind. Eng. 1996, 30, 297–319. [Google Scholar] [CrossRef]
- Urciuoli, L.; Hintsa, J. Adapting supply chain management strategies to security–an analysis of existing gaps and recommendations for improvement. Int. J. Logist. Res. Appl. 2017, 20, 276–295. [Google Scholar] [CrossRef]
- Ardolino, M.; Bino, A.; Ciano, M.P.; Bacchetti, A. Enabling Digital Capabilities with Technologies: A Multiple Case Study of Manufacturing Supply Chains in Disruptive Times. Systems 2025, 13, 39. [Google Scholar] [CrossRef]
- Abbasi, M.; Nilsson, F. Developing environmentally sustainable logistics: Exploring themes and challenges from a logistics service providers’ perspective. Transp. Res. Part D Transp. Environ. 2016, 46, 273–283. [Google Scholar]
- Li, Z.; She, J.; Guo, Z.; Du, J.; Zhou, Y. An evaluation of factors influencing the community emergency management under compounding risks perspective. Int. J. Disaster Risk Reduct. 2024, 100, 104179. [Google Scholar]
- Liu, F.; Wu, R.; Liu, S.; Liu, C.; Su, M. Assessing the determinants of corporate environmental investment: A machine learning approach. Environ. Sci. Pollut. Res. 2024, 31, 17401–17416. [Google Scholar]
- Sajjad, A.; Eweje, G.; Tappin, D. Sustainable supply chain management: Motivators and barriers. Bus. Strategy Environ. 2015, 24, 643–655. [Google Scholar]


| Serial Number | Research Gap | Research Topic | Author |
|---|---|---|---|
| 1 | Improve loading and unloading efficiency through the optimization of one technology. | Applications of the Internet of Things (IoT) in smart logistics: A comprehensive survey | [13] |
| Energy-efficient rail guided vehicle routing for two-sided loading/unloading automated freight handling system | [23] | ||
| From plant and logistics control to multi-enterprise collaboration | [21] | ||
| 2 | Exploring the reasons affecting intelligent loading and unloading through a single factor. | An exploratory investigation of the effects of supply chain complexity on delivery performance | [14] |
| 3 | Research on the Key Strategic Framework for the Lack of Automation Systems. | Automation in cargo loading/unloading processes: do unmanned loading technologies bring benefits when both purchase and operational cost are considered? | [8] |
| Optimal marketing strategy: A decision-making with ANP and TOPSIS | [27] |
| Profile Information | Number of Respondents | Percentage (%) |
|---|---|---|
| Job position | ||
| 8 | 50.00 |
| 6 | 37.50 |
| 2 | 12.50 |
| Working experience in the company (years) | ||
| 4 | 25.00 |
| 3 | 18.75 |
| 9 | 56.25 |
| Enterprise type | ||
| 2 | 12.50 |
| 3 | 18.75 |
| 6 | 37.50 |
| 2 | 12.50 |
| 3 | 18.75 |
| Number of employees | ||
| 0 | 0.00 |
| 2 | 12.50 |
| 1 | 6.25 |
| 2 | 12.50 |
| 11 | 68.75 |
| Serial Number | Author | Research Topic | Research Methods |
|---|---|---|---|
| 1 | [40] | Enablers to implement sustainable initiatives in agri-food supply chains | ISM-Fuzzy DEMATEL |
| 2 | [42] | Fuzzy DEMATEL method for developing supplier selection criteria | Fuzzy theory-Fuzzy DEMATEL |
| 3 | [39] | Using fuzzy DEMATEL to evaluate the green supply chain management practices | DEMATEL-Fuzzy set theory |
| 4 | [43] | A DEMATEL-based method for prioritizing strategic projects using the perspectives of the Balanced Scorecard | DEMATEL |
| 5 | [44] | Analysis of supply chain vulnerability factors in manufacturing enterprises: a fuzzy DEMATEL approach | Fuzzy DEMATEL |
| 6 | [45] | Identification of barriers and their mitigation strategies for Industry 5.0 implementation in emerging economies | DEMATEL |
| 7 | [46] | Industry 5.0 challenges for post-pandemic supply chain sustainability in an emerging economy | ISM-MICMAC |
| 8 | [41] | Influencing factors of novice pilot SA based on DEMATEL-AISM method: From pilots’ view | DEMATEL-AISM |
| 9 | [47] | An evaluation of factors influencing the vulnerability of emergency logistics supply chains | DEMATEL-AISM |
| 10 | [15] | Identifying CSFs for the agri-food cold chain’s sustainable development: When the strategy system comes into play | AISM-MICMAC |
| 11 | [33] | Key Success Factors for Export Structure Optimization in East Asian Countries Through Global Value Chain (GVC) Reorganization | DEMATEL-ISM |
| Linguistic Terms | Influence Score | Influence Score |
|---|---|---|
| No influence (N) | 0 | (0, 0, 0.25) |
| Very low influence (VL) | 1 | (0, 0.25, 0.50) |
| Low influence (L) | 2 | (0.25, 0.50, 0.75) |
| High influence (H) | 3 | (0.50, 0.75, 1.00) |
| High influence (H) | 4 | (0.75, 1.00, 1.00) |
| Self-Interaction Matrix | Adjacency Matrix | |
|---|---|---|
| i, j | V | 1 |
| j, i | 0 | |
| i, j | A | 0 |
| j, i | 1 | |
| i, j | X | 1 |
| j, i | 1 | |
| i, j | O | 0 |
| j, i | 0 |
| CSFs | Definition | Author |
|---|---|---|
| Market research (F1) | Use market research to understand demand for ILU equipment, promote companies to improve products, and apply to logistics companies. | [5] |
| Operation training (F2) | Through workshops, seminars, and training, impart advantages and operational methods of ILU equipment to stakeholders and train employees to efficiently use and maintain automated systems. | [9,48] |
| Customization (F3) | Provide customized ILU solutions to meet the specific needs of different cities’ supply chains and logistics companies for various scales. | [25] |
| Equipment integration support (F4) | Design scalable devices and provide intelligent integration support to ensure compatibility with logistics processes and various types of vehicles, along with detailed installation and operation documentation. | [20] |
| Innovation improvement (F5) | Regularly update ILU technology, invest in the research and development of cutting-edge intelligent equipment, and continuously evaluate and improve processes to promote the application of equipment in logistics companies. | [43] |
| Equipment usability (F6) | Design intuitive and user-friendly ILU systems to lower the usage threshold and operational difficulty. | [49] |
| Environmental advantage (F7) | Showcase the advantages of the equipment in terms of environmental benefits, such as reducing pollution, optimizing energy efficiency, and lowering operating costs. | [46] |
| After-sales service (F8) | Provide robust after-sales support, including preventive maintenance, remote diagnostics, and on-site support, thereby ensuring equipment performance and stability and enhancing user confidence. | [50] |
| Stakeholder collaboration (F9) | Establish strategic partnerships with key players in the supply chain, design solutions to promote the adoption of smart loading and unloading equipment, and address the specific challenges of urban logistics. | [21,29] |
| Customer feedback mechanisms (F10) | Establish effective user feedback channels, continuously improve the technology and service levels of ILU equipment, and promptly respond to customer needs. | [17] |
| Performance control (F11) | Use real-time monitoring and data analysis to optimize the ILU process and track equipment performance to identify issues. | [40] |
| Government support (F12) | For logistics companies that adopt ILU equipment, provide financial subsidies, research funding, and infrastructure support to promote the development of ILU technology. | [40] |
| Reliability and safety (F13) | Introduce artificial intelligence in ILU equipment to optimize load sorting, space utilization, and route planning. Improve equipment reliability and safety and reduce downtime, workplace accidents, and equipment damage. | [42] |
| Scalability features (F14) | Ensure that ILU technology can scale its features according to business growth and the needs of ILU logistics companies. | [48] |
| Regulatory compliance (F15) | Ensure that ILU technologies comply with local and international regulations to avoid legal issues. | [26,29] |
| User-friendly design (F16) | Design an intuitive and simple ILU operation system to reduce the adoption barriers for users of the ILU logistics company. | [24] |
| Developing automation systems (F17) | Develop advanced automation systems, including robotic arms, autonomous mobile robots, and AGVs, to accelerate loading and unloading speeds, improve accuracy, and reduce manual labor and human errors in ILU logistics companies. | [43,45] |
| Multi-party collaboration platform (F18) | Deploy a multi-party collaboration cloud platform connecting logistics operators, drivers, and warehouse managers to achieve real-time coordination and the efficient utilization of urban zones. | [21] |
| Standardized packaging (F19) | Use standardized, modular packaging to optimize space in vehicles through automated loading and unloading. | [10,13] |
| CSF | F1 | F2 | F3 | F4 | F5 | F6 | F7 | F8 | F9 | F10 | F11 | F12 | F13 | F14 | F15 | F16 | F17 | F18 | F19 |
|---|---|---|---|---|---|---|---|---|---|---|---|---|---|---|---|---|---|---|---|
| F1 | 0 | 4 | 4 | 2 | 3 | 4 | 3 | 3 | 3 | 4 | 3 | 4 | 2 | 2 | 4 | 3 | 1 | 2 | 2 |
| F2 | 2 | 0 | 1 | 1 | 2 | 2 | 1 | 1 | 2 | 1 | 4 | 1 | 3 | 2 | 3 | 4 | 4 | 1 | 3 |
| F3 | 3 | 4 | 0 | 2 | 4 | 1 | 1 | 2 | 2 | 4 | 1 | 4 | 2 | 1 | 4 | 4 | 3 | 4 | 3 |
| F4 | 0 | 2 | 2 | 0 | 3 | 1 | 0 | 2 | 4 | 1 | 2 | 3 | 2 | 4 | 1 | 2 | 2 | 4 | 2 |
| F5 | 2 | 3 | 4 | 0 | 0 | 3 | 3 | 2 | 1 | 2 | 3 | 1 | 3 | 1 | 3 | 1 | 4 | 4 | 1 |
| F6 | 2 | 4 | 1 | 3 | 3 | 0 | 3 | 4 | 2 | 2 | 2 | 1 | 1 | 2 | 2 | 4 | 1 | 4 | 2 |
| F7 | 2 | 1 | 2 | 3 | 3 | 3 | 0 | 2 | 1 | 4 | 2 | 2 | 3 | 1 | 3 | 3 | 4 | 3 | 4 |
| F8 | 2 | 4 | 3 | 3 | 4 | 3 | 2 | 0 | 4 | 1 | 2 | 3 | 3 | 3 | 2 | 3 | 2 | 1 | 3 |
| F9 | 2 | 4 | 3 | 2 | 3 | 4 | 2 | 3 | 0 | 4 | 4 | 3 | 2 | 3 | 3 | 3 | 2 | 3 | 3 |
| F10 | 0 | 1 | 1 | 3 | 4 | 1 | 2 | 3 | 1 | 0 | 1 | 4 | 0 | 2 | 3 | 1 | 1 | 4 | 2 |
| F11 | 1 | 4 | 1 | 1 | 1 | 2 | 1 | 3 | 2 | 1 | 0 | 1 | 1 | 3 | 2 | 2 | 4 | 2 | 1 |
| F12 | 3 | 3 | 4 | 2 | 4 | 3 | 2 | 4 | 4 | 3 | 3 | 0 | 2 | 4 | 4 | 4 | 4 | 3 | 2 |
| F13 | 1 | 1 | 0 | 2 | 0 | 0 | 1 | 1 | 3 | 2 | 1 | 0 | 0 | 0 | 1 | 1 | 0 | 1 | 0 |
| F14 | 1 | 2 | 1 | 3 | 1 | 3 | 3 | 4 | 2 | 4 | 2 | 4 | 2 | 0 | 1 | 2 | 2 | 4 | 4 |
| F15 | 3 | 3 | 3 | 3 | 3 | 4 | 3 | 3 | 3 | 4 | 3 | 4 | 3 | 4 | 0 | 4 | 3 | 3 | 4 |
| F16 | 3 | 1 | 1 | 3 | 3 | 2 | 2 | 2 | 3 | 1 | 3 | 1 | 1 | 2 | 2 | 0 | 1 | 4 | 1 |
| F17 | 1 | 4 | 4 | 0 | 4 | 3 | 2 | 2 | 2 | 2 | 3 | 2 | 1 | 1 | 2 | 3 | 0 | 2 | 2 |
| F18 | 1 | 2 | 2 | 2 | 3 | 2 | 1 | 2 | 2 | 3 | 2 | 3 | 0 | 2 | 2 | 2 | 2 | 0 | 1 |
| F19 | 0 | 4 | 2 | 0 | 4 | 2 | 1 | 3 | 1 | 3 | 4 | 1 | 2 | 1 | 3 | 1 | 1 | 4 | 0 |
| CSF | Influence Degree | Affected Degree | Centrality | Causality | Ranking |
|---|---|---|---|---|---|
| F1 | 3.1317 | 1.7977 | 4.9294 | 1.3339 | 10 |
| F2 | 2.2161 | 2.9701 | 5.1862 | −0.7540 | 7 |
| F3 | 2.8802 | 2.3228 | 5.2031 | 0.5574 | 6 |
| F4 | 2.2032 | 2.0867 | 4.2898 | 0.1165 | 18 |
| F5 | 2.4039 | 3.0316 | 5.4355 | −0.6278 | 5 |
| F6 | 2.5192 | 2.5429 | 5.0620 | −0.0237 | 9 |
| F7 | 2.6436 | 2.0024 | 4.6460 | 0.6411 | 16 |
| F8 | 2.8115 | 2.6894 | 5.5008 | 0.1221 | 4 |
| F9 | 3.0674 | 2.4637 | 5.5311 | 0.6037 | 3 |
| F10 | 2.1103 | 2.6515 | 4.7618 | −0.5412 | 14 |
| F11 | 2.0018 | 2.6674 | 4.6692 | −0.6656 | 15 |
| F12 | 3.3914 | 2.4610 | 5.8524 | 0.9305 | 2 |
| F13 | 0.9993 | 1.9824 | 2.9816 | −0.9831 | 19 |
| F14 | 2.6189 | 2.2852 | 4.9041 | 0.3338 | 12 |
| F15 | 3.4400 | 2.6442 | 6.0843 | 0.7958 | 1 |
| F16 | 2.1741 | 2.7523 | 4.9264 | −0.5782 | 11 |
| F17 | 2.3854 | 2.4723 | 4.8578 | −0.0869 | 13 |
| F18 | 2.0985 | 3.0724 | 5.1709 | −0.9738 | 8 |
| F19 | 2.1585 | 2.3589 | 4.5174 | −0.2004 | 17 |
| CSF | F19 | F18 | F17 | F16 | F15 | F14 | F13 | F12 | F11 | F10 | F9 | F8 | F7 | F6 | F5 | F4 | F3 | F2 |
|---|---|---|---|---|---|---|---|---|---|---|---|---|---|---|---|---|---|---|
| F1 | O | V | V | V | O | O | O | O | O | O | A | O | O | O | O | V | V | O |
| F2 | A | A | A | A | O | V | O | O | V | X | O | X | V | V | V | A | A | |
| F3 | X | X | X | X | O | O | O | O | V | V | O | O | O | O | O | X | ||
| F4 | X | X | X | X | O | O | O | O | V | V | O | O | O | O | O | |||
| F5 | O | O | O | O | O | X | V | O | O | O | O | A | X | X | ||||
| F6 | O | O | O | O | O | X | V | O | X | A | O | A | X | |||||
| F7 | A | O | O | O | O | X | V | O | X | A | O | A | ||||||
| F8 | A | A | A | A | O | V | O | O | V | X | O | |||||||
| F9 | V | V | V | V | A | O | O | A | O | O | ||||||||
| F10 | A | A | A | A | O | V | O | O | V | |||||||||
| F11 | O | O | O | O | O | X | V | O | ||||||||||
| F12 | O | O | O | O | X | O | O | |||||||||||
| F13 | O | O | O | O | O | A | ||||||||||||
| F14 | O | O | O | O | O | |||||||||||||
| F15 | O | O | O | O | ||||||||||||||
| F16 | X | X | X | |||||||||||||||
| F17 | X | X | ||||||||||||||||
| F18 | X |
| CSF | F1 | F2 | F3 | F4 | F5 | F6 | F7 | F8 | F9 | F10 | F11 | F12 | F13 | F14 | F15 | F16 | F17 | F18 | F19 | DRP |
|---|---|---|---|---|---|---|---|---|---|---|---|---|---|---|---|---|---|---|---|---|
| F1 | 1 | 1 | 1 | 1 | 1 | 1 | 1 | 1 | 0 | 1 | 1 | 0 | 1 | 1 | 0 | 1 | 1 | 1 | 1 | 16 |
| F2 | 0 | 1 | 0 | 0 | 1 | 1 | 1 | 1 | 0 | 1 | 1 | 0 | 1 | 1 | 0 | 0 | 0 | 0 | 0 | 9 |
| F3 | 0 | 1 | 1 | 1 | 1 | 1 | 1 | 1 | 0 | 1 | 1 | 0 | 1 | 1 | 0 | 1 | 1 | 1 | 1 | 15 |
| F4 | 0 | 1 | 1 | 1 | 1 | 1 | 1 | 1 | 0 | 1 | 1 | 0 | 1 | 1 | 0 | 1 | 1 | 1 | 1 | 15 |
| F5 | 0 | 0 | 0 | 0 | 1 | 1 | 1 | 0 | 0 | 0 | 1 | 0 | 1 | 1 | 0 | 0 | 0 | 0 | 0 | 6 |
| F6 | 0 | 0 | 0 | 0 | 1 | 1 | 1 | 0 | 0 | 0 | 1 | 0 | 1 | 1 | 0 | 0 | 0 | 0 | 0 | 6 |
| F7 | 0 | 0 | 0 | 0 | 1 | 1 | 1 | 0 | 0 | 0 | 1 | 0 | 1 | 1 | 0 | 0 | 0 | 0 | 0 | 6 |
| F8 | 0 | 1 | 0 | 0 | 1 | 1 | 1 | 1 | 0 | 1 | 1 | 0 | 1 | 1 | 0 | 0 | 0 | 0 | 0 | 9 |
| F9 | 1 | 1 | 1 | 1 | 1 | 1 | 1 | 1 | 1 | 1 | 1 | 0 | 1 | 1 | 0 | 1 | 1 | 1 | 1 | 17 |
| F10 | 0 | 1 | 0 | 0 | 1 | 1 | 1 | 1 | 0 | 1 | 1 | 0 | 1 | 1 | 0 | 0 | 0 | 0 | 0 | 9 |
| F11 | 0 | 0 | 0 | 0 | 1 | 1 | 1 | 0 | 0 | 0 | 1 | 0 | 1 | 1 | 0 | 0 | 0 | 0 | 0 | 6 |
| F12 | 1 | 1 | 1 | 1 | 1 | 1 | 1 | 1 | 1 | 1 | 1 | 1 | 1 | 1 | 1 | 1 | 1 | 1 | 1 | 19 |
| F13 | 0 | 0 | 0 | 0 | 0 | 0 | 0 | 0 | 0 | 0 | 0 | 0 | 1 | 0 | 0 | 0 | 0 | 0 | 0 | 1 |
| F14 | 0 | 0 | 0 | 0 | 1 | 1 | 1 | 0 | 0 | 0 | 1 | 0 | 1 | 1 | 0 | 0 | 0 | 0 | 0 | 6 |
| F15 | 1 | 1 | 1 | 1 | 1 | 1 | 1 | 1 | 1 | 1 | 1 | 1 | 1 | 1 | 1 | 1 | 1 | 1 | 1 | 19 |
| F16 | 0 | 1 | 1 | 1 | 1 | 1 | 1 | 1 | 0 | 1 | 1 | 0 | 1 | 1 | 0 | 1 | 1 | 1 | 1 | 15 |
| F17 | 0 | 1 | 1 | 1 | 1 | 1 | 1 | 1 | 0 | 1 | 1 | 0 | 1 | 1 | 0 | 1 | 1 | 1 | 1 | 15 |
| F18 | 0 | 1 | 1 | 1 | 1 | 1 | 1 | 1 | 0 | 1 | 1 | 0 | 1 | 1 | 0 | 1 | 1 | 1 | 1 | 15 |
| F19 | 0 | 1 | 1 | 1 | 1 | 1 | 1 | 1 | 0 | 1 | 1 | 0 | 1 | 1 | 0 | 1 | 1 | 1 | 1 | 15 |
| DEP | 4 | 13 | 10 | 10 | 18 | 18 | 18 | 13 | 3 | 13 | 18 | 2 | 19 | 18 | 2 | 10 | 10 | 10 | 10 |
| Level | Results of Type UP | Results of Type DOWN |
|---|---|---|
| 1 | 13 | 12, 15 |
| 2 | 5, 6, 7, 11, 14 | 9 |
| 3 | 2, 8, 10 | 1 |
| 4 | 3, 4, 16, 17, 18, 19 | 3, 4, 16, 17, 18, 19 |
| 5 | 1 | 2, 8, 10 |
| 6 | 9 | 5, 6, 7, 11, 14 |
| 7 | 12, 15 | 13 |
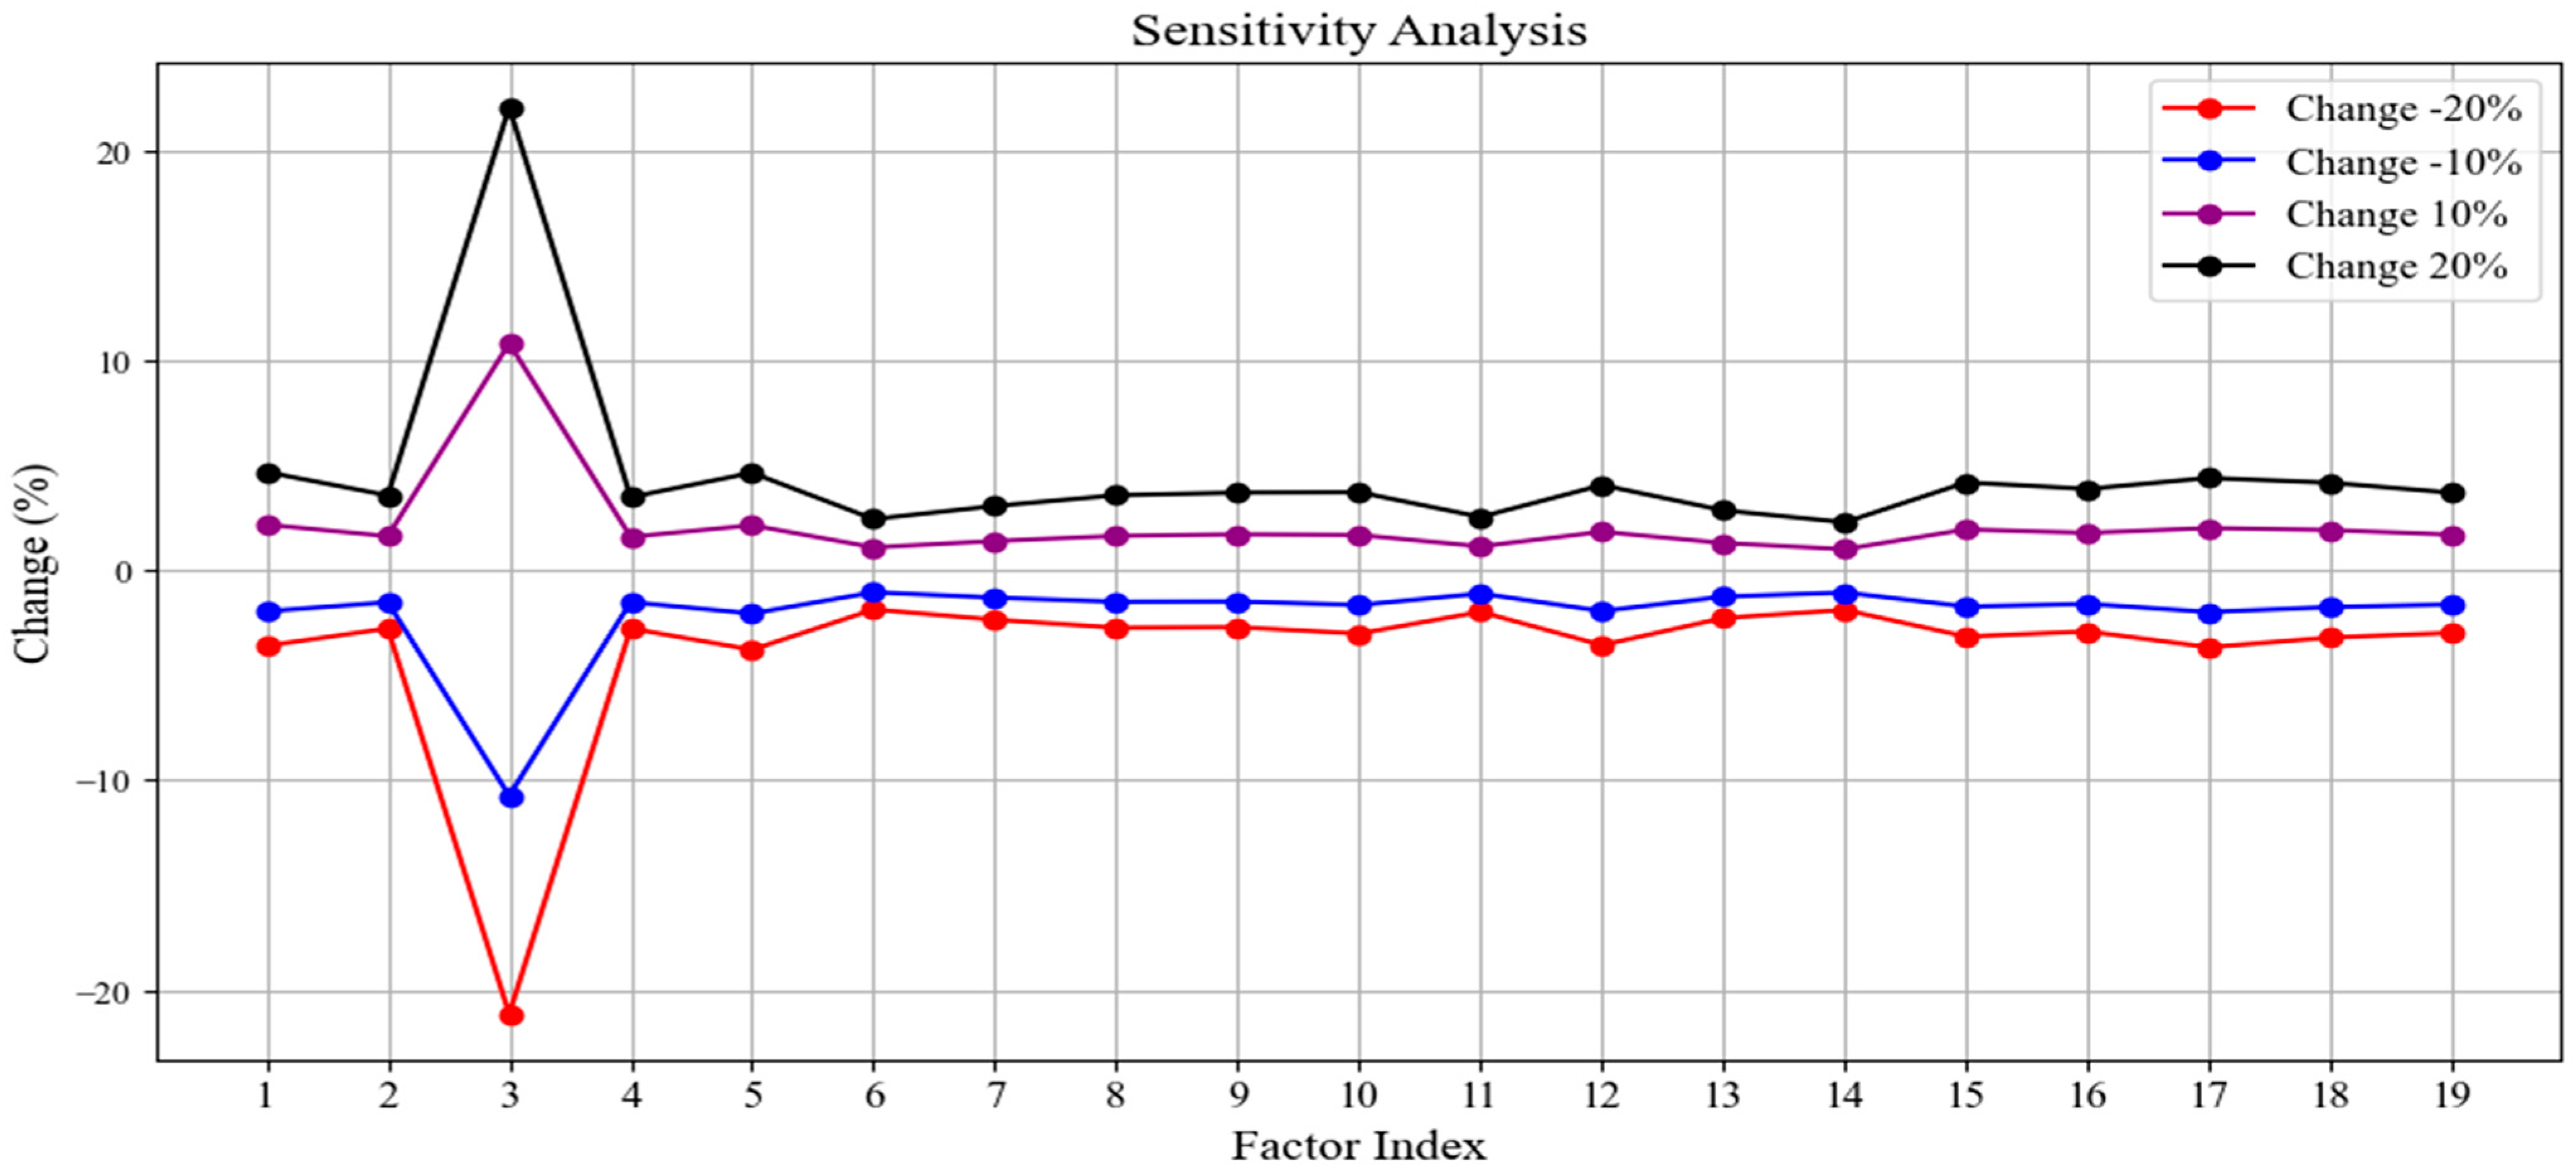
| CSF | Decreasing Influence 20% | Decreasing Influence 10% | Increase Influence 10% | Increase Influence by 20% |
|---|---|---|---|---|
| F1 | −3.6 | −1.96 | 2.17 | 4.67 |
| F2 | −2.78 | −1.53 | 1.62 | 3.56 |
| F3 | −2.14 | −1.1 | 1.07 | 3.02 |
| F4 | −2.78 | −1.53 | 1.59 | 3.48 |
| F5 | −2.78 | −1.53 | 1.59 | 3.48 |
| F6 | −1.87 | −1.05 | 1 | 2.93 |
| F7 | −2.36 | −1.51 | 1.31 | 3.2 |
| F8 | −2.74 | −1.51 | 1.62 | 3.75 |
| F9 | −2.14 | −1.1 | 1.07 | 3.02 |
| F10 | −3.02 | −1.66 | 1.68 | 3.71 |
| F11 | −2.57 | −1.3 | 1.23 | 3.35 |
| F12 | −3.18 | −1.92 | 1.93 | 4.05 |
| F13 | −1.07 | −0.78 | 0.78 | 2.28 |
| F14 | −2 | −1.11 | 1.07 | 2.87 |
| F15 | −2 | −1.61 | 1.78 | 1 |
| F16 | −3.21 | −1.76 | 1.91 | 4.16 |
| F17 | −2.99 | −1.63 | 1.69 | 3.69 |
| F18 | −2.99 | −1.63 | 1.69 | 3.69 |
| F19 | −2.99 | −1.63 | 1.69 | 3.69 |
Disclaimer/Publisher’s Note: The statements, opinions and data contained in all publications are solely those of the individual author(s) and contributor(s) and not of MDPI and/or the editor(s). MDPI and/or the editor(s) disclaim responsibility for any injury to people or property resulting from any ideas, methods, instructions or products referred to in the content. |
© 2025 by the authors. Licensee MDPI, Basel, Switzerland. This article is an open access article distributed under the terms and conditions of the Creative Commons Attribution (CC BY) license (https://creativecommons.org/licenses/by/4.0/).
Share and Cite
Wang, X.; Zhou, M.; Su, M. Critical Success Factors for Enhancing Intelligent Loading and Unloading in Urban Supply Chains: A Comprehensive Approach Based on Fuzzy DEMATEL-AISM-MICMAC. Systems 2025, 13, 230. https://doi.org/10.3390/systems13040230
Wang X, Zhou M, Su M. Critical Success Factors for Enhancing Intelligent Loading and Unloading in Urban Supply Chains: A Comprehensive Approach Based on Fuzzy DEMATEL-AISM-MICMAC. Systems. 2025; 13(4):230. https://doi.org/10.3390/systems13040230
Chicago/Turabian StyleWang, Xiaoteng, Meihui Zhou, and Miao Su. 2025. "Critical Success Factors for Enhancing Intelligent Loading and Unloading in Urban Supply Chains: A Comprehensive Approach Based on Fuzzy DEMATEL-AISM-MICMAC" Systems 13, no. 4: 230. https://doi.org/10.3390/systems13040230
APA StyleWang, X., Zhou, M., & Su, M. (2025). Critical Success Factors for Enhancing Intelligent Loading and Unloading in Urban Supply Chains: A Comprehensive Approach Based on Fuzzy DEMATEL-AISM-MICMAC. Systems, 13(4), 230. https://doi.org/10.3390/systems13040230