1. Introduction
Sustainability represents one of the most significant contemporary megatrends [
1,
2,
3]. The Brundtland Report laid the groundwork for sustainable development by discussing the integration of environmental, social, and economic considerations [
4]. The Triple Bottom Line framework, which emphasizes three pillars—people, planet, and profit—was coined later by John Elkington in 1994 [
5,
6].
Although the concept of sustainability has a long history, its importance has increased and continues to grow. The principal driving force behind this phenomenon is the growth in the global population and the concomitant increase in environmental awareness among people and within the business community [
7]. In this context, corporate investments are evolving in response to the phenomenon of sustainability. The objective is to integrate this phenomenon into lean transformations in all studies, focusing on achieving profitability. This approach is intended to facilitate the development of more environmentally friendly processes and enhance productivity [
8,
9,
10]. As Mahmoum Ganbadi et al. (2021) posited, contemporary approaches to supply chain modeling have prioritized monetary performance, with few addressing the full spectrum of sustainability encompassing economic, environmental, and social dimensions [
11]. In his study, he underscored the necessity for more comprehensive sustainability assessments and empirical studies and proposed a research agenda to address these deficiencies [
11]. Braglia et al. (2024) presented a structured methodology that integrates Lean Thinking and environmental sustainability in strategic planning to improve environmental performance, emphasizing the role of cost–benefit analysis in sustainability decisions and the integration of technological innovations in the evaluation of green measures and decision support processes in industrial settings [
12]. Furthermore, environmentally conscious individuals have begun utilizing wood, a natural, organic, and renewable resource, to mitigate environmental impact.
Wood is a natural and durable material used in interior design for centuries [
13]. Wood is employed in a multitude of applications. The primary sectors that utilize wood as a principal material are construction and building, paper, home and industrial furniture, and outdoor furniture, which is the focus of this study [
14]. The global outdoor furniture market is poised for robust expansion from 2025 onward, with multiple forecasts indicating a value growth from around USD 53 billion to over USD 80 billion by 2032 and average annual growth rates of about 5–6% [
15,
16,
17,
18]. Across these projections, wood remains a favored material in outdoor designs, valued for its natural aesthetics, durability, and timeless appeal. As conveyed in the aforementioned market reports, the prevailing perception is that consumers tend to favor wood in outdoor furniture designs due to its inherent aesthetic, durable, long-lasting, and timeless qualities.
Wooden outdoor furniture companies seek a competitive advantage through the lean philosophy/production practice [
19]. The lean philosophy/production approach aims to enhance productivity by distinguishing between non-value-added and value-added activities throughout the production process [
20]. As Siegel et al. (2019) state, lean manufacturing is a production method that identifies and eliminates waste and optimizes resource use through continuous improvement [
21]. Concurrently, Braglia et al. (2024) emphasized that the implementation of lean manufacturing practices within the purview of environmental sustainability has the potential to enhance operational efficiency and ecological performance [
22].
Taiichi Ohno initially developed the lean philosophy between 1948 and 1975 and has since exerted a profound influence across all sectors globally. The lean philosophy/culture will remain significant in the present and future eras due to its efficiency and high profitability [
23]. In the context of lean manufacturing, waste is generated throughout the production process due to activities that do not contribute to the creation of added value. These wastes can be classified into a total of eight different categories: overproduction, waiting, unnecessary transportation, unnecessary handling, unnecessary processing, inventory, movement, and the waste of unused skills [
24]. Seth et al. (2017) demonstrated that implementing waste reduction strategies derived from the lean production/philosophy process can increase productivity, specifically through improving cycle times within business processes [
25]. Abreu et al. (2017) posited that implementing lean and green practices will result in two key outcomes [
26]. Firstly, it will enhance efficiency by reducing waste. Secondly, conserving energy will augment efficiency and sustainability performance [
26]. Concurrently, May et al. (2015) suggested sustainability performance while concomitantly increasing energy efficiency [
27]. Although lean production is regarded as the foundation and focal point of the automotive industry, it is evident that it is being adopted in many sectors [
28]. These include steel [
29], agriculture/food [
30], manufacturing, healthcare, construction, product development, service [
31], prefabricated building manufacturing [
32], and leather footwear [
33].
The Value Stream Mapping (VSM) methodology is employed to identify these wastes in the process [
23,
34]. Lean practices, defined as lean tools, are necessary to reduce lean wastes identified using VSM methodology. Implementing lean practices has been demonstrated to enhance operational efficiency by eliminating non-value-added activities within the process. Furthermore, as indicated by Dieste et al. (2019), lean practices have been shown to improve environmental performance by increasing resource efficiency. This is achieved through the systematic elimination of waste, which results in a reduction in energy consumption [
35]. However, it is essential to note that certain lean practices, such as Just-In-Time manufacturing (JIT), have the potential to adversely affect the environment due to their reliance on low inventory levels and frequent transportation [
35]. The VSM methodology is typically understood as a visual representation of the process stages of a system [
36]. Although the VSM methodology is highly effective in identifying waste, studies demonstrate that this methodology can be further enhanced by integrating digital technologies and sustainability in addition to the VSM methodology [
8,
9,
10,
37,
38]. In this context, Abdulmalek and Raigopal (2007) employed simulation models to implement lean principles in a steel mill and observed the results [
29]. In a similar vein, Horsthofer-Rauch et al. (2022) conducted a review of academic studies on the digitalization of VSM [
38]. The manual execution of VSM has become inefficient and ineffective due to increasing production and product complexity [
38]. Once the lean wastes have been identified through VSM, the subsequent decision-making process typically involves determining which lean tools are most effective in eliminating these wastes. In this regard, the optimal approach for top management and lean consultants is the application of multi-criteria decision making (MCDM) methods [
39]. For instance, Mohanraj et al. (2015) systematically enhanced productivity by integrating QFD and VSM methodology in their study [
40]. In a similar vein, Bhuvanesh Kumar and Parameshwaran (2018) employed a multifaceted approach that integrated F-QFD, F-FMEA, plant layout, and VSM methodologies to prioritize critical resources and eliminate lean wastes in the context of water tank and barrel production [
41]. Building upon these studies, subsequent research conducted by Deepan et al. (2022) in the casting industry [
42], Bhuvanesh Kumar and Parameshwaran (2020) in the manufacturing industry [
43], Bhuvanesh Kumar and Parameshwaran (2019) in the casting and automobile industry [
44], and Reda and Dvivedi (2022) in a leather shoe manufacturing company in Ethiopia have made valuable contributions to the literature by identifying, prioritizing, and eliminating lean waste [
45]. While QFD and FMEA techniques from MCDM methodologies are employed in various contexts, including machine/equipment selection [
46], product design, defect elimination [
47,
48], and performance improvement, these techniques can be employed to identify and eliminate potential defects in processes [
49,
50,
51,
52]. They can also be effectively utilized in the selection of lean tools. In this context, Reda and Dvivedi (2022) employed QFD and FMEA techniques to select the lean tools necessary for eliminating lean wastes [
45]. This study demonstrates that choosing lean tools represents a significant decision-making challenge and that MCDM methodologies can be employed to address this issue. A literature review reveals that fuzzy logic, MCDM, and lean management are used in many sectors with varying degrees of integration to enhance productivity [
40,
41,
42,
43,
44].
In the field of MCDM, Mahmoum Ganbadi et al. (2021) underscored the significance of integrating MCDM with sustainability, emphasizing the necessity for comprehensive sustainability assessments in supply chain design [
11]. Moreover, while lean principles have been applied in various manufacturing contexts (e.g., Seth et al. (2017) in industrial transformers and Bhuvanesh Kumar and Parameshwaran (2018) in water tank manufacturing), their application in the outdoor wood furniture industry, especially with MCDM concepts for better sustainability performance, is limited [
25,
41]. This sector faces distinctive challenges, including process efficiency, material sustainability, environmental impact, and fluctuating cost factors, which necessitate a bespoke approach.
Consequently, despite extensive research in the areas of sustainability, MCDM, lean management, and the outdoor wood furniture industry, there is a notable absence of integration of these areas of study into a coherent framework. The extant literature primarily addresses these areas in isolation or conjunction with one another yet lacks a comprehensive approach that integrates all four aspects. This gap presents an opportunity to develop an integrated model that can enhance decision-making processes, improve sustainability performance, and facilitate lean management practices by combining lean and MCDM tools and techniques specifically tailored to the outdoor wood furniture industry. Prior research has demonstrated the efficacy of lean tools and sustainability models in various sectors. For example, Serafim Silva et al. (2024) proposed the VSM4S model, which combines the traditional VSM with sustainability indicators [
10]. However, this model does not address the specific case of outdoor wood furniture [
10]. Similarly, Bhamu and Sangwan (2014) emphasized the advancement of lean tools but noted the absence of a unified implementation framework that incorporates sustainability metrics and MCDM [
28]. Bhattacharya et al. (2019) underscored the pivotal role of lean–green integration, particularly in terms of reducing waste, diminishing costs, and enhancing organizational performance [
53]. The study observed that adopting a combination of lean and green practices yielded a more favorable impact on sustainability performance in comparison to the implementation of individual practices [
53].
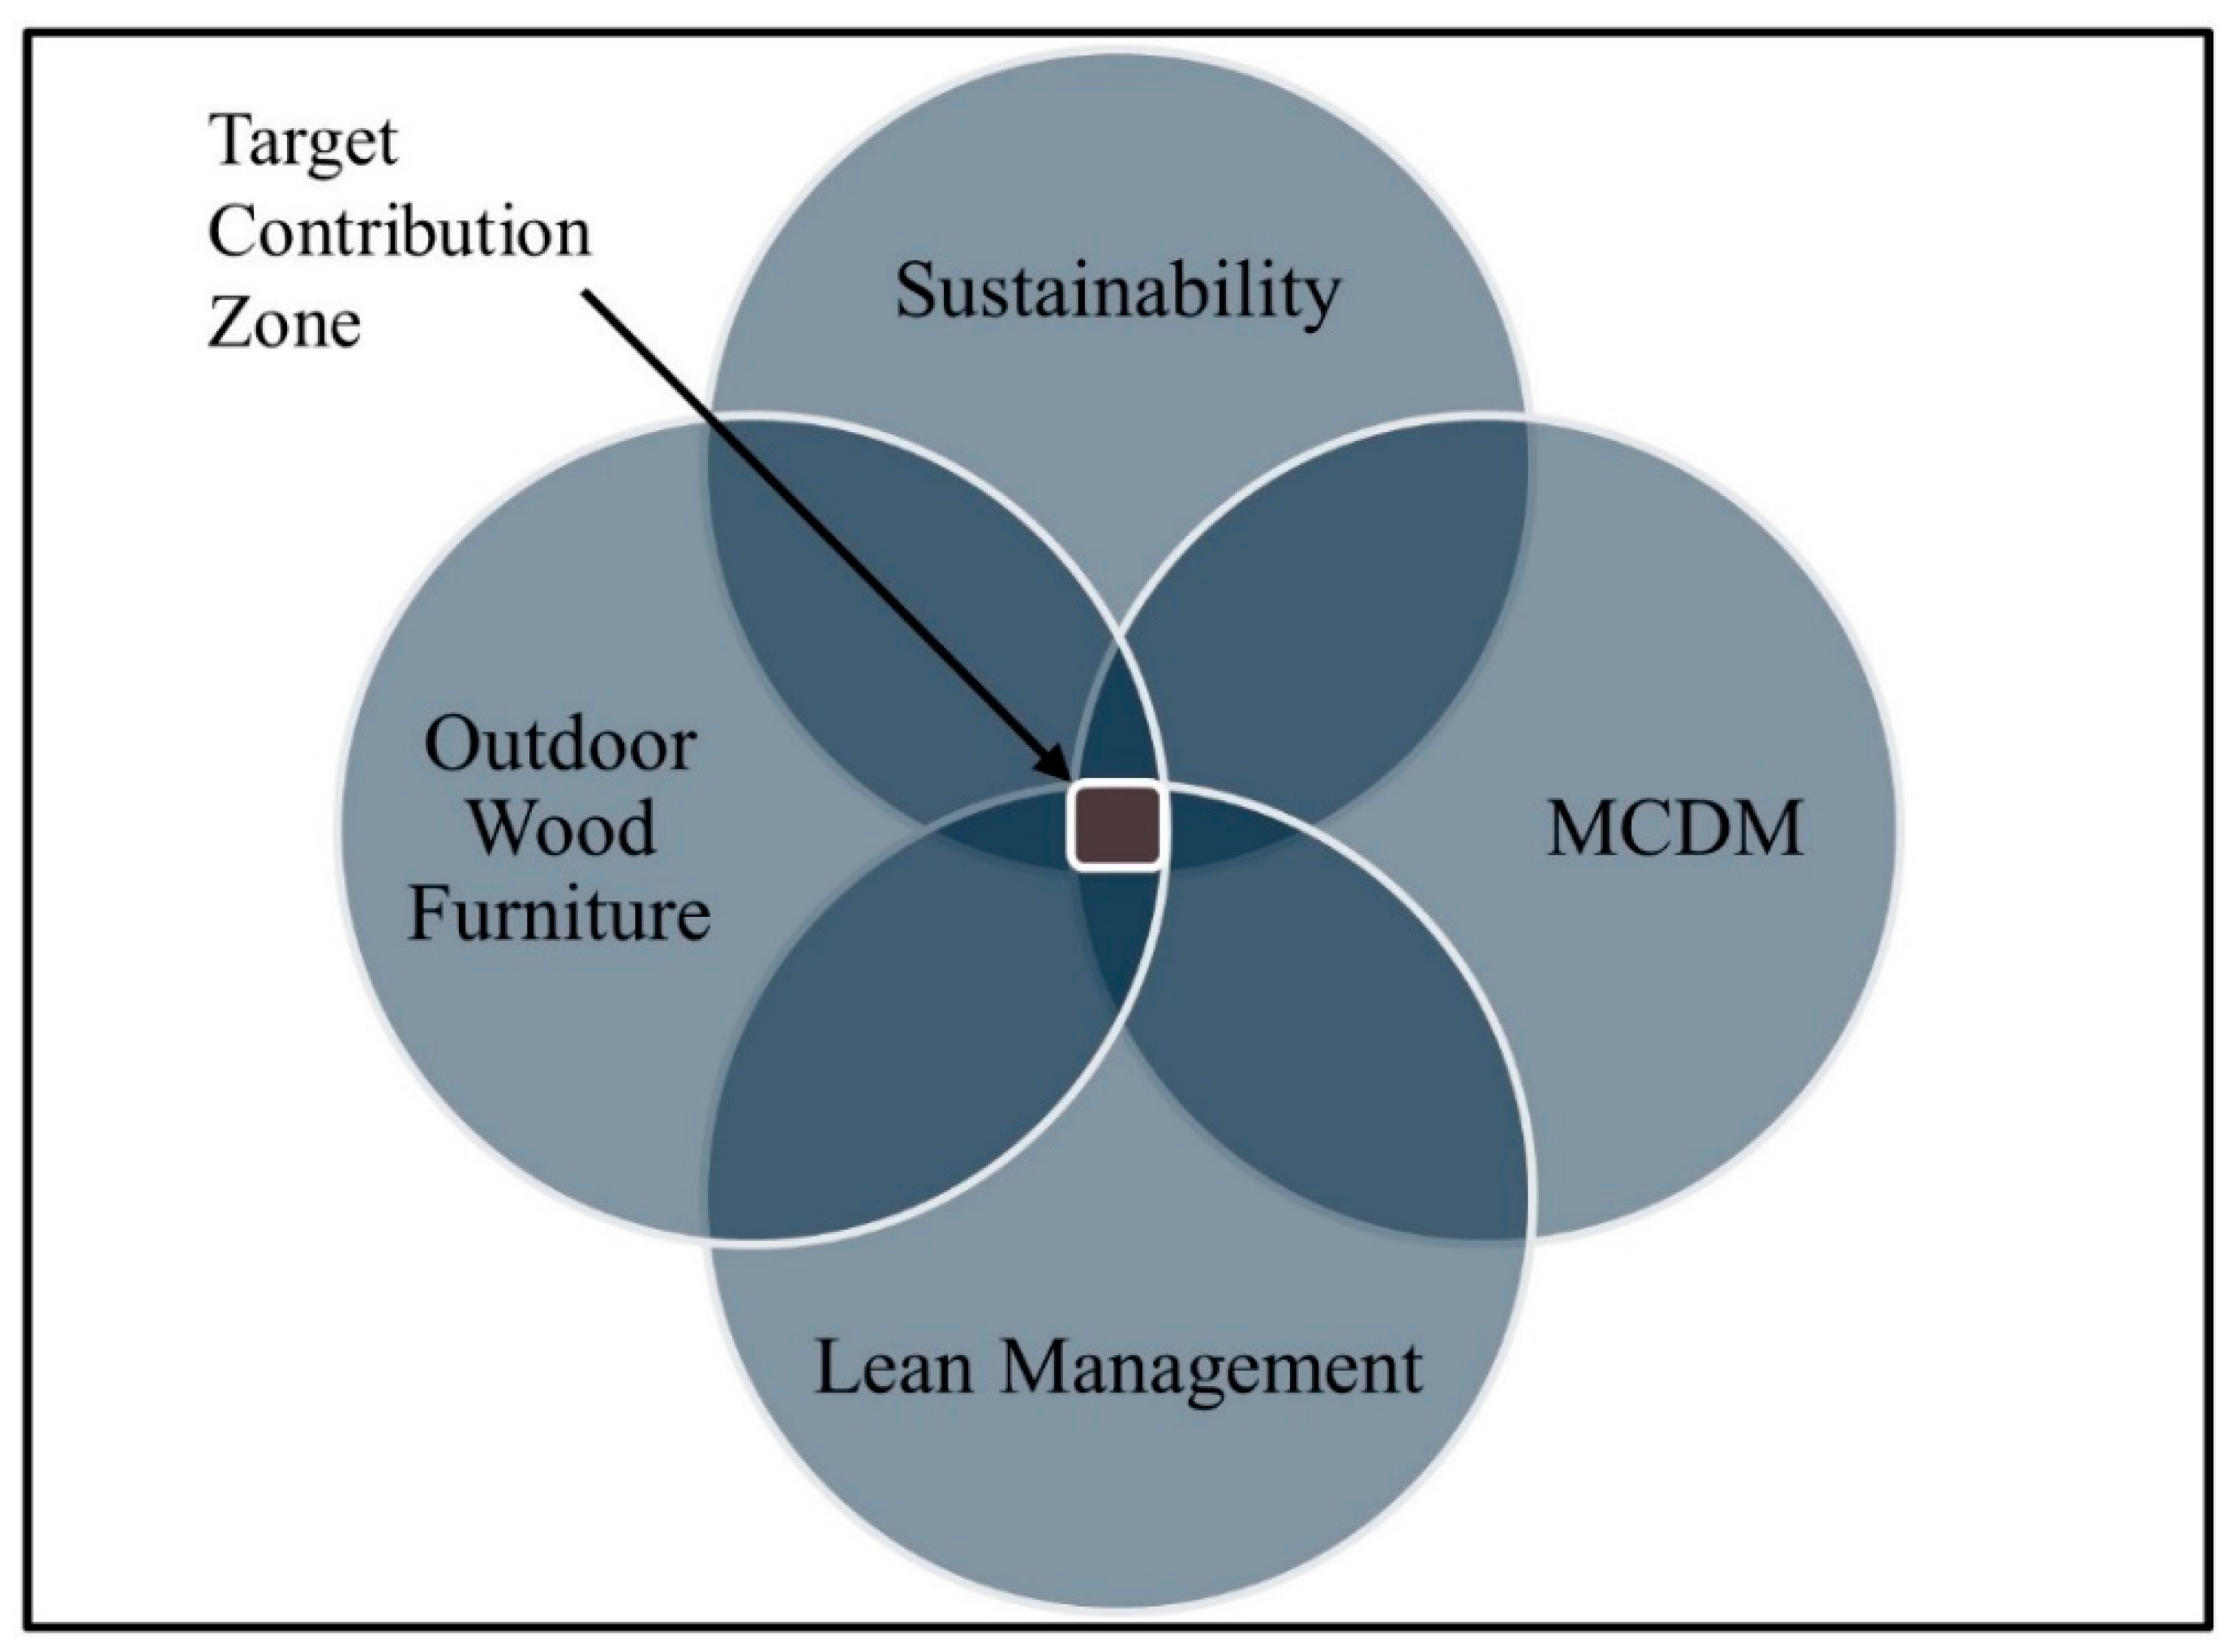
This study aims to contribute to the cluster of the intersection of the four main topics in the literature, as illustrated in
Figure 1. Accordingly, this study’s objectives are twofold: firstly, to demonstrate how lean management and MCDM principles and techniques can be effectively and systematically applied in a tailored way to optimize production processes, improve economic and environmental sustainability performance, and enhance decision-making capabilities in the outdoor wood furniture industry; and, secondly, to validate the effectiveness and practicality of the proposed methodology through the documentation of empirical evidence. By addressing this gap in the literature, this study will make a significant contribution to the field of outdoor wood furniture manufacturing. It will be one of the most relevant studies to date examining the adoption of sustainable and lean practices in this sector.
2. Materials and Methods
This study focused on the supply chain structure of a value-added wood product industry segment, namely, outdoor wood furniture. At the request of the industry partner, the pseudonym EcoCraft Outdoor Furniture is used instead of the company’s real name. Established in 1995 in the United States, EcoCraft Outdoor Furniture is a wooden outdoor furniture company with a mission to create high-quality, durable, and sustainable outdoor furniture that enhances outdoor living spaces while minimizing environmental impacts. EcoCraft Outdoor Furniture specializes in wood outdoor furniture, including benches, chairs, tables, loungers, and custom-designed pieces. One of the company’s most important products is the wooden garden/park bench, which is made from high-quality, sustainably sourced materials and designed to be durable for outdoor use. The bench features ergonomic designs and weather-resistant surface coatings to protect against rain, sunlight, and humidity. The wood-based park bench had a specific design so that all structural components—the seat, backrest, armrests, and legs—were made of wood, while metal hardware was limited to fasteners such as bolts, screws, and washers. The seat and backrest consisted of planks or slats, while the legs and armrests were shaped to provide support and stability. Internal braces were likewise fabricated from wood, preserving the bench’s natural appearance. Although metal fasteners ensured secure connections and simplified assembly, no metal legs or auxiliary supports were included, thus reducing reliance on non-wooden materials. Before the wooden structure was assembled, it was treated with sanding and appropriate surface coatings (e.g., sealants, varnishes, or protective paint) to extend the bench’s longevity while retaining its predominantly wooden character. The designated batch size for this product was 50 units.
Lean waste elimination is a pressing concern for organizations. By eliminating non-value-added activities, businesses strive to bolster efficiency and sustainability. However, the first step in eliminating lean waste is to make it visible. To achieve this, organizations rely on the robust VSM methodology [
36]. This tool helps identify existing issues and potentially yields significant future benefits [
37]. Using the VSM methodology to visualize waste, companies can select the appropriate lean tools to eliminate it [
54].
Selecting lean tools was one of the most challenging aspects for businesses due to the numerous lean tools available for eliminating lean waste. However, choosing the most effective tool for waste elimination was crucial. Therefore, this study utilized the MCDM methodology to select lean tools for eliminating lean wastes and enhancing the sustainability performance of a company’s target supply chain structure, producing outdoor wooden parks and garden equipment.
Initially, this study mapped the company’s supply chain structure to understand the flow of materials and information across the entire process (Phase 1). This foundational step set the stage for identifying areas of waste and inefficiency. Then, key performance indicators (KPIs) relevant to the wood furniture industry were determined. In selecting the KPIs, a consultative and context-specific approach was adopted to ensure both industrial relevance and alignment with sustainability principles. Specifically, iterative discussions were conducted with three seasoned experts from the wood product sector and two specialists in sustainability. This interdisciplinary input ensured that metrics accurately reflect day-to-day production realities (e.g., Cycle Time, Changeover Time) while encompassing critical environmental considerations (e.g., energy consumption, waste generation). As such, the final KPI set strikes a balance between economic efficiency and environmental stewardship, capturing the multifaceted objectives of lean transformation in a practical manner for industry practitioners yet remains rigorous from a sustainability standpoint. The details of the final KPI set are given below.
First Pass Yield (FPY) (%): The percentage of products that meet quality standards without rework.
Changeover Time (min): The time required to switch from producing one batch to another.
Overall Equipment Effectiveness (OEE) (%): Equipment effectiveness at each workstation, considering availability, performance, and quality.
Energy Efficiency (kWh/batch): The energy consumed per batch at each workstation.
Solid Waste Amount (kg/batch): The waste generated per batch at each workstation.
Cycle Time (min): The time to complete one production cycle at each workstation.
Up Time (min/day): The machinery’s actual operational time per day, calculated as Up Time = OEE × 480.
Down Time (min/day): The total time any machinery is not operational daily, calculated as Down Time = 480 − Up Time.
Production Cost Per Batch (USD): The cost incurred to produce one batch at each workstation, considering materials, labor, and overheads.
The selected KPIs’ primary function was to quantify the economic and environmental benefits of deploying the proposed methodology. Using the data collected, the current state VSM was drawn to visually represent the existing processes (Phase 2). The VSM included all steps in the supply chain, from order placement to product delivery, highlighting value-added and non-value-added activities [
36]. In Phase 2, detailed data on process times, inventory levels, material flows, and information flows were gathered. All the data were collected based on the pre-determined batch size of 50 wood benches. Based on the current state map, lean wastes were identified, including overproduction, waiting times, unnecessary transportation, excess inventory, defects, and underutilized talent (Phase 3) [
54]. This study then proceeded to its next phase, where the root causes and effects of the identified lean wastes were analyzed and prioritized using the Failure Mode and Effects Analysis (FMEA) technique (Phase 4). The FMEA helped systematically identify potential failure modes, their causes, and effects and prioritized them based on their RPN [
55]. The Delphi Method was employed in this study phase to ascertain the failure modes, probability, severity, and noticeability scores. In particular, three rounds of Delphi surveys were conducted, involving four experts from academic and industrial backgrounds. The selection criteria for these experts were based on their extensive experience in lean management, sustainability practices, and the value-added wood product industry. A consensus was deemed to have been reached when there was over 70% agreement on the appropriateness of the selected variables.
In the fifth phase, after analyzing the prioritized root causes, lean tools that could be used to address the prioritized lean wastes were proposed and ranked using the Fuzzy Quality Function Deployment methodology (Phase 5). Fuzzy QFD integrated customer and technical requirements, reducing subjectivity and uncertainty in the evaluation process [
56]. A systematic procedure was adopted to establish the relationships in the Fuzzy QFD matrix, ensuring that each lean tool’s linkage to a given failure mode was founded on expert opinion and established lean principles. Initially, a panel of four specialists—two industry managers with direct operational experience and two academic researchers versed in lean methodologies—assessed the compatibility of each lean tool with the identified waste categories. This assessment was conducted through consensus-based discussions, in which participants referenced documented effects of specific lean tools (e.g., Just-In-Time’s impact on inventory and scheduling; automation’s influence on production flow) and considered the contextual nuances of outdoor wood furniture manufacturing. The strength of each relationship was then encoded using a linguistic scale (weak, moderate, strong), subsequently translated into fuzzy numbers for quantitative analysis. All linguistic assessments conducted at this intersection were integrated by calculating the geometric mean of the evaluations provided by four experts. Accordingly, even where a linkage might appear secondary or indirect (such as between a tool focused on inventory management and a failure mode related to changeover delays), reasoned expert judgment was applied to ascertain whether any cascading process benefits or hidden interdependencies might exist. Therefore, the outcome was designed to reflect clear-cut primary relationships and less obvious synergies and trade-offs, enabling a more robust and replicable methodology. Then, the selected lean tools were implemented to achieve the future state VSM (Phase 6). The process data were re-collected after six months following the deployment of the improvement projects. Therefore, Future-state VSM illustrated the process’s post-improvement state and outlined a leaner and more sustainable process flow that minimized or eliminated identified wastes. In past studies, Future-state VSM was used to visualize the optimal flow of materials and information [
36]. This study reflects the post-improvement state with actual empirical findings. In the last phase, the results of the systematic methodology were interpreted and discussed to document this study’s critical achievements and contributions (Phase 7).
By following these systematic steps, this study aimed to effectively eliminate lean wastes and improve the sustainability and efficiency of the supply chain for a company producing outdoor wooden park and garden equipment.
Figure 2 provides a diagram illustrating the phases of this study. This section provides more detailed information on the FMEA and Fuzzy QFD methodology steps.
2.1. Failure Modes and Effect Analysis (FMEA)
FMEA, a tool used for risk identification and mitigation, was developed in the late 1940s in the USA. This approach was initially applied in the nuclear and aerospace industries and continued to be used in these sectors over the subsequent years. Its utilization expanded to the NASA Apollo program in the 1960s, the automobile industry in the 1970s, and various subsequent applications after the 1980s [
57,
58,
59].
Failure Mode and Effects Analysis is an analytical approach that evaluates and prevents known or potential failures in a product or process based on previous experiences and technologies. Assessing the consequences of existing or potential failures identifies measures to reduce or prevent the occurrence of these failures. After implementing the actions, the probability of failure is reassessed, and the entire analysis process is documented [
55].
FMEA is classified into four main categories in risk analysis, each with a specific focus and application in different processes and industries. Design FMEA (DFMEA) is a risk analysis method that prevents failures and initiates corrective actions during the design phase of a product [
60], while Process FMEA (PFMEA) analyzes the production phase of a product to identify potential failures in the process and implement corrective actions [
61]. System FMEA (SFMEA) identifies and prioritizes failures affecting the entire system, originating from its components [
62]. On the other hand, Service FMEA detects task errors due to system or process failures before the service is delivered to customers [
63].
In this study, Process FMEA (PFMEA) activities were conducted. In the FMEA methodology, the RPN used to prioritize failure modes was calculated using Equation (1), which is the product of three critical components: occurrence, severity, and detectability. The occurrence factor represents the frequency of the hazard’s occurrence. The severity factor indicates the impact of the hazard if it occurs. The detectability factor measures the likelihood of detecting the hazard before it occurs. The traditional scale values were used in the evaluation of occurrence, severity, and detectability rates of lean failure modes and for the calculation of RPN values [
64].
The risk priority number (RPN) was calculated using Equation (1):
where Occurrence (O) represents the frequency of the hazard’s occurrence. Severity (S) indicates the impact of the hazard if it occurs. Detectability (D) measures the likelihood of detecting the hazard before it occurs.
FMEA is not a finite analysis. It requires continuous system monitoring, repeating the analysis by taking necessary measures when a potential failure occurs, and identifying new risks and failures that the system may encounter due to evolving technology and conditions. This continuous approach ensures that the analysis remains relevant and effective over time.
2.2. Fuzzy QFD
Quality Function Deployment (QFD) was developed in Japan in the late 1960s to design products that meet customer requirements and improve the manufacturing process [
65,
66,
67]. It was adopted by numerous Japanese companies, prominently Toyota and was introduced to the United States and Europe in 1983 [
67]. Ford Motor Company was among the first Western companies to adopt QFD, and it continues to evolve in tandem with digitalization [
66,
67]. Recent studies have seen an escalation of interest in the integration of QFD with fuzzy logic and web-based services [
66].
Subsequent to its integration with the Analytic Hierarchy Process (AHP) and Failure Mode and Effects Analysis (FMEA), QFD has become a prevalent instrument in project management [
68]. Quality Function Deployment is a matrix, known as a “House of Quality”, with customer requirements (“what”) in the rows and technical specifications (“how”) in the columns [
41,
43,
45]. The body of the matrix illustrates the relationships between the two, and the roof shows the relationships among the technical specifications themselves. The house of quality is used sequentially as a four-stage model or a matrix of matrices for product, product parts, production process, and production planning [
56]. The model’s initial stage entails identifying customer expectations and their correlation with technical requirements. The product concept was developed in the subsequent stage, and critical technical features were defined. The following stage entails planning the production process and assessing the manufacturability of the technical requirements. The final stage entails implementing quality control and process enhancement initiatives, ensuring the perpetual enhancement of the product’s performance. This systematic framework facilitates the effective management of customer-oriented design processes [
67]. In this study, the initial two stages of the quality house were not employed since the target product was already part of the company’s product catalogue. Consequently, the present study exclusively focused on the final two stages of the quality house: process planning and production planning matrices.
Integrating fuzzy logic with QFD applications aims to eliminate subjectivity and uncertainty in evaluating the “whats” and “hows”. The House of Quality consists of nine steps, which are detailed below. Nevertheless, specific HOQ matrices, such as the preparation (planning) matrix, technical analysis, and goal analysis sections, were not included in this report as they are not pertinent to the current study [
46].
Step 1: Identifying the importance of customer requirements, denoted as lean failure modes in this study. The identified lean failure modes are given in
Table 1.
Step 2: Determination of technical requirements, denoted as lean tools in this study. The lean tools identified are given in
Table 1.
Step 3: Assignment of importance weights to customer requirements. The importance weights of the LFMs were determined using the scale in
Table 2.
Step 4: Development of the relationship matrix between customer and technical requirements. This relationship matrix between the LFMs and lean tools was created with the aid of
Table 3.
Step 5: Preparation of the correlation matrix showing the technical requirements’ relationships with lean tools. This correlation matrix was prepared using the correlation degree scale given in
Table 4.
Step 6: Calculation of the importance of the weights of the technical requirements using Equation (2).
Number of lean failure modes;
: Number of lean tools;
: The importance weight of the jth lean tool;
: The importance rating of the ith lean failure mode;
: The relationship value between the ith lean failure mode and the jth lean tool.
Step 7: Defuzzification of the fuzzy lean tool importance weight (
l,
m,
u) values using Equation (3).
: Crisp Value
After defuzzification, the lean tools were ranked, and the best lean tool was selected.
3. Results
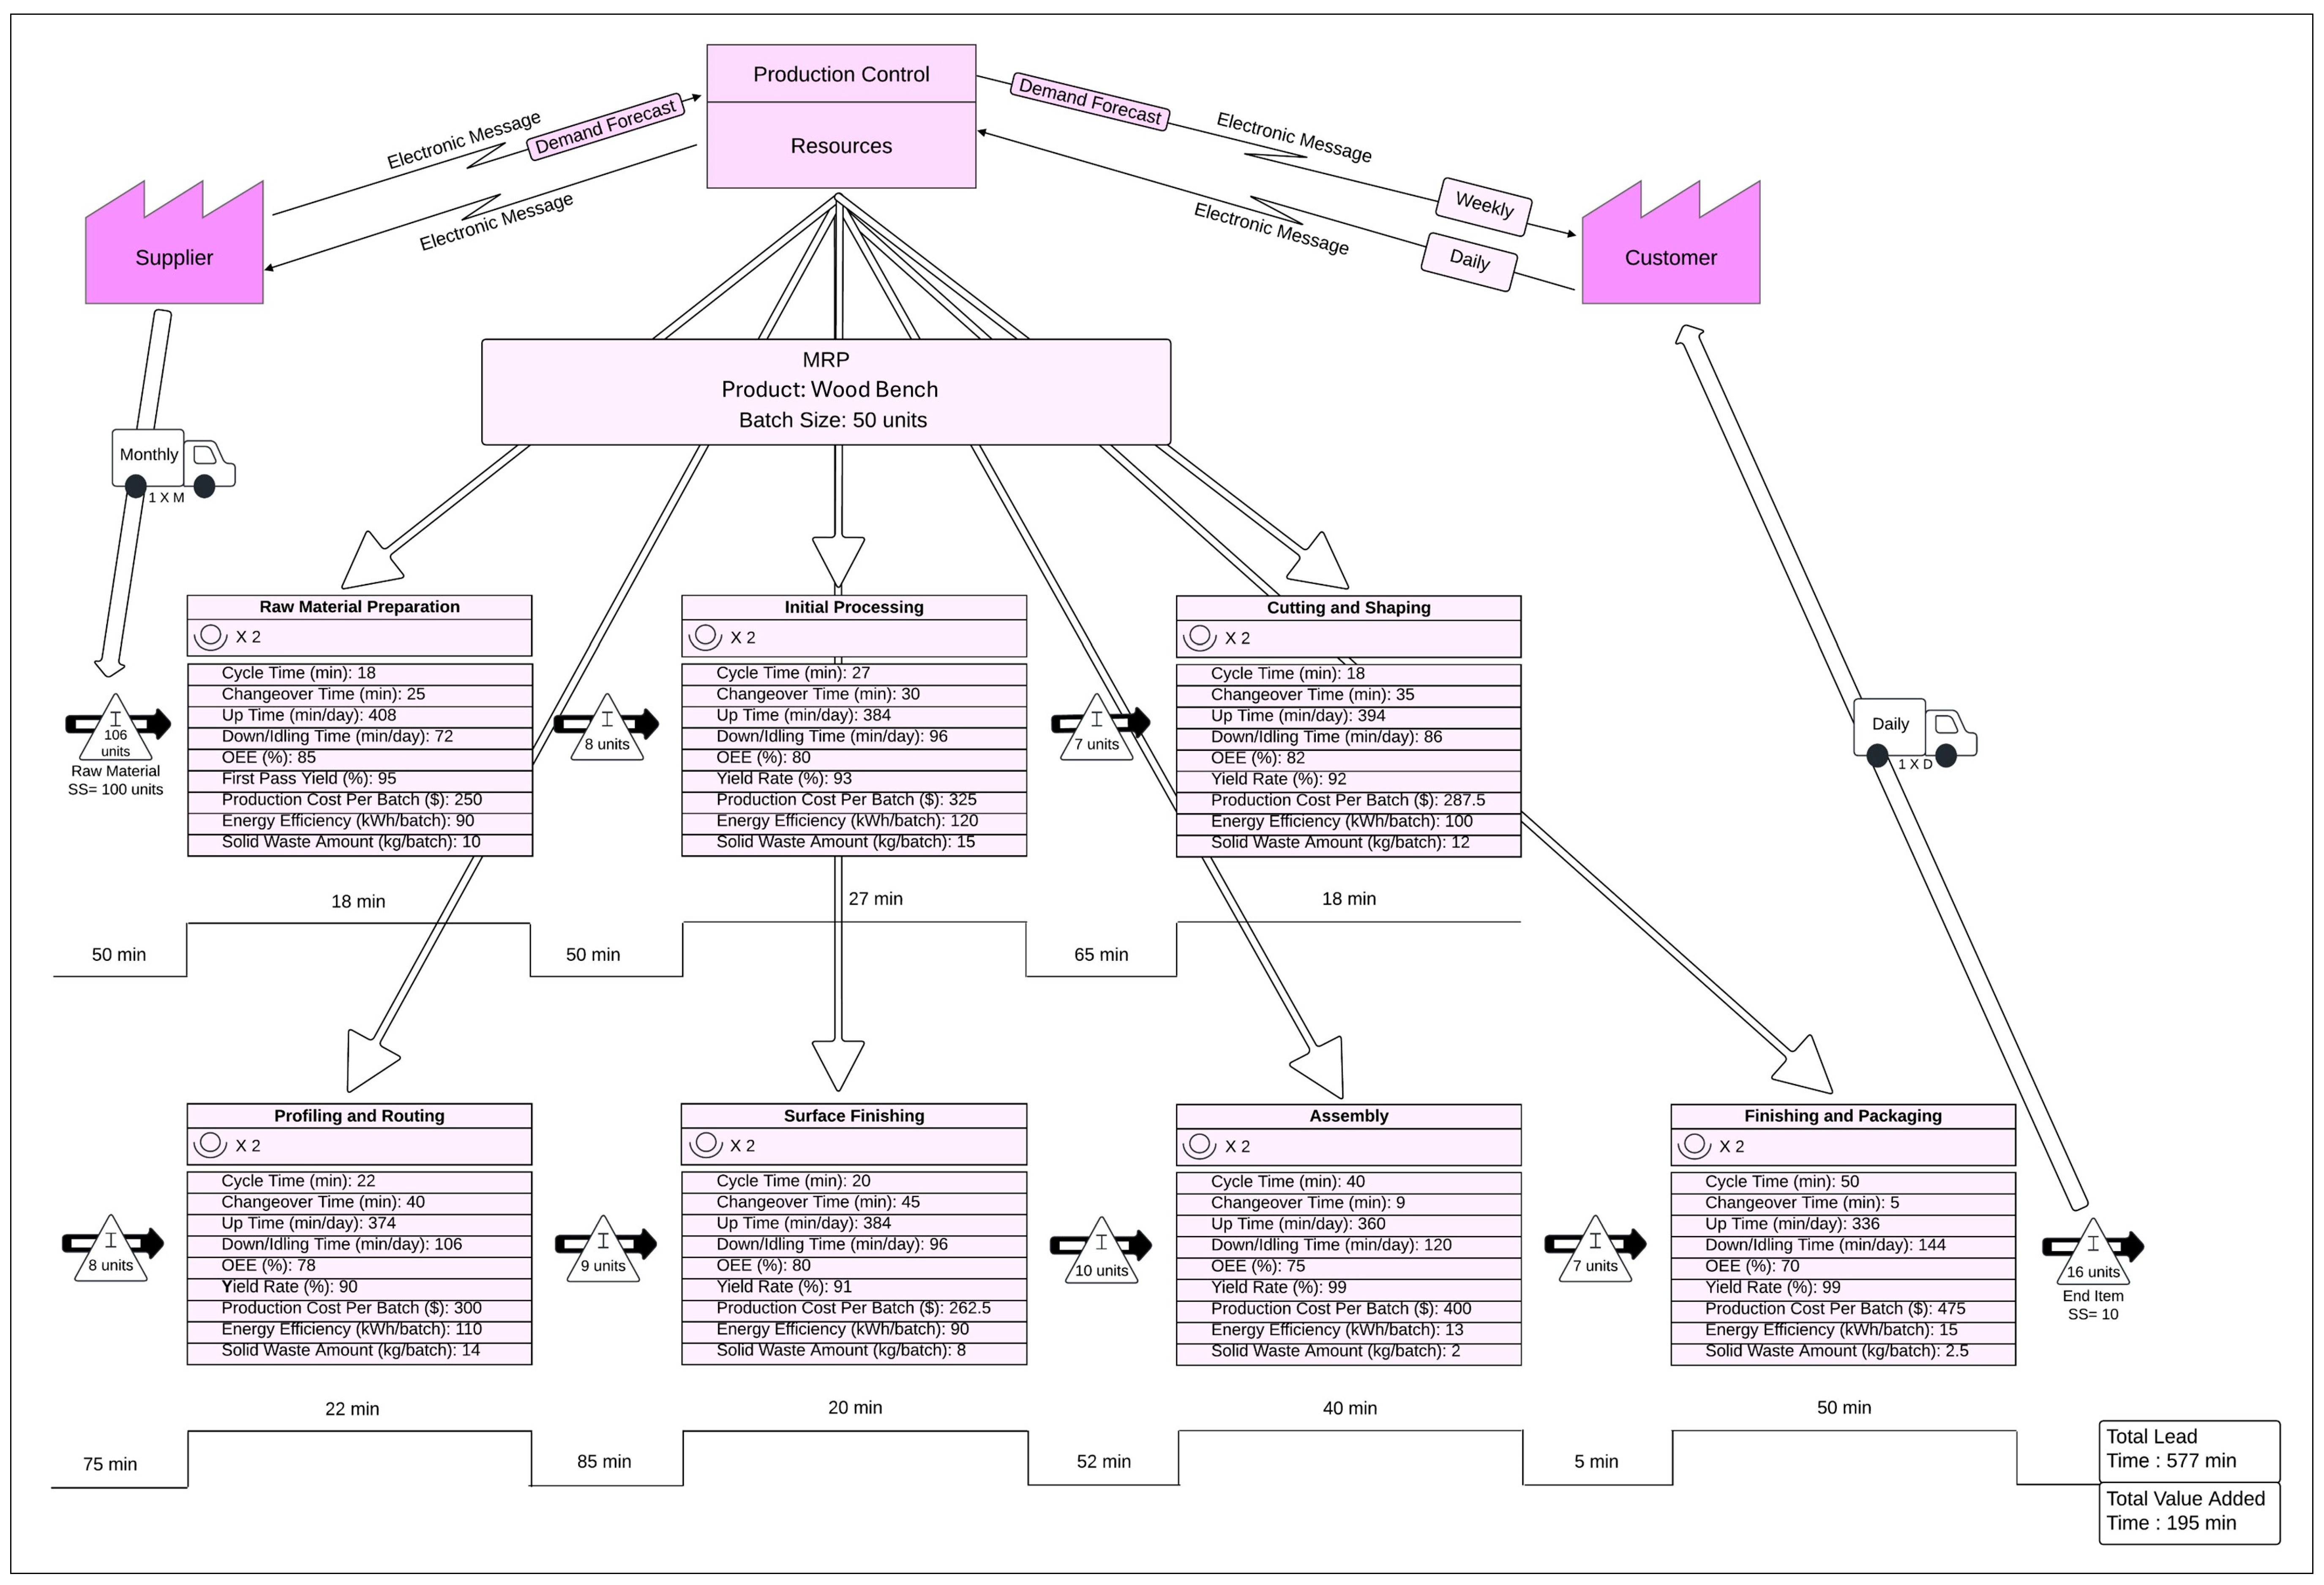
EcoCraft Outdoor Furniture is a company that manufactures wooden outdoor furniture and has headquarters in Türkiye. Inefficiencies were identified in the company’s wooden park/garden bench production process. To address these inefficiencies optimally, a Value Stream Map was first created for the process. The VSM measured various parameters for each process step, including Cycle Time (min), Changeover Time (min), Up Time (min/day), Down Time/idling time (min/day), Overall Equipment Effectiveness (OEE) (%), First Pass Yield (%), Production Cost Per Batch (USD), Energy Efficiency (kWh/batch), and Solid Waste Amount (kg/batch). Energy Efficiency (kWh/batch) and Solid Waste Amount (kg/batch) KPIs were used to assess the environmental sustainability of the process. At the same time, the rest were considered indicators of economic sustainability and process efficiency. The current state VSM is presented in
Figure 3.
Based on the current state VSM, thirteen lean failure modes (LFMs) were identified for the wooden park/garden bench production process. These LFMs include poor layout design (FM1), equipment downtime (FM2), the lack of automation (FM3), inventory overstock (FM4), quality issues (FM5), changeover delays (FM6), energy inefficiency (FM7), material waste (FM8), long cycle time (FM9), high production cost (FM10), inconsistent yield (FM11), under-utilized talent (FM12), and excessive transportation (FM13). The LFMs were categorized according to basic lean wastes and prioritized using the FMEA technique. In accordance with the methodology, the root cause and effect of each LFM were identified, and scores for probability, severity, and detectability were assigned to calculate the RPNs. An FMEA table was created and presented in
Table 5.
Table 5 shows that poor layout design (FM1) had the highest RPN score of 336, while high production cost (FM10) had the lowest RPN score of 140. According to the FMEA methodology, a project proposal is developed for any failure mode with an RPN score above 100. Therefore, lean project proposals were developed for all LFMs listed in
Table 5. These lean projects are detailed in
Table 5. Subsequently, the Fuzzy QFD methodology was used to select the lean tools for the developed lean projects.
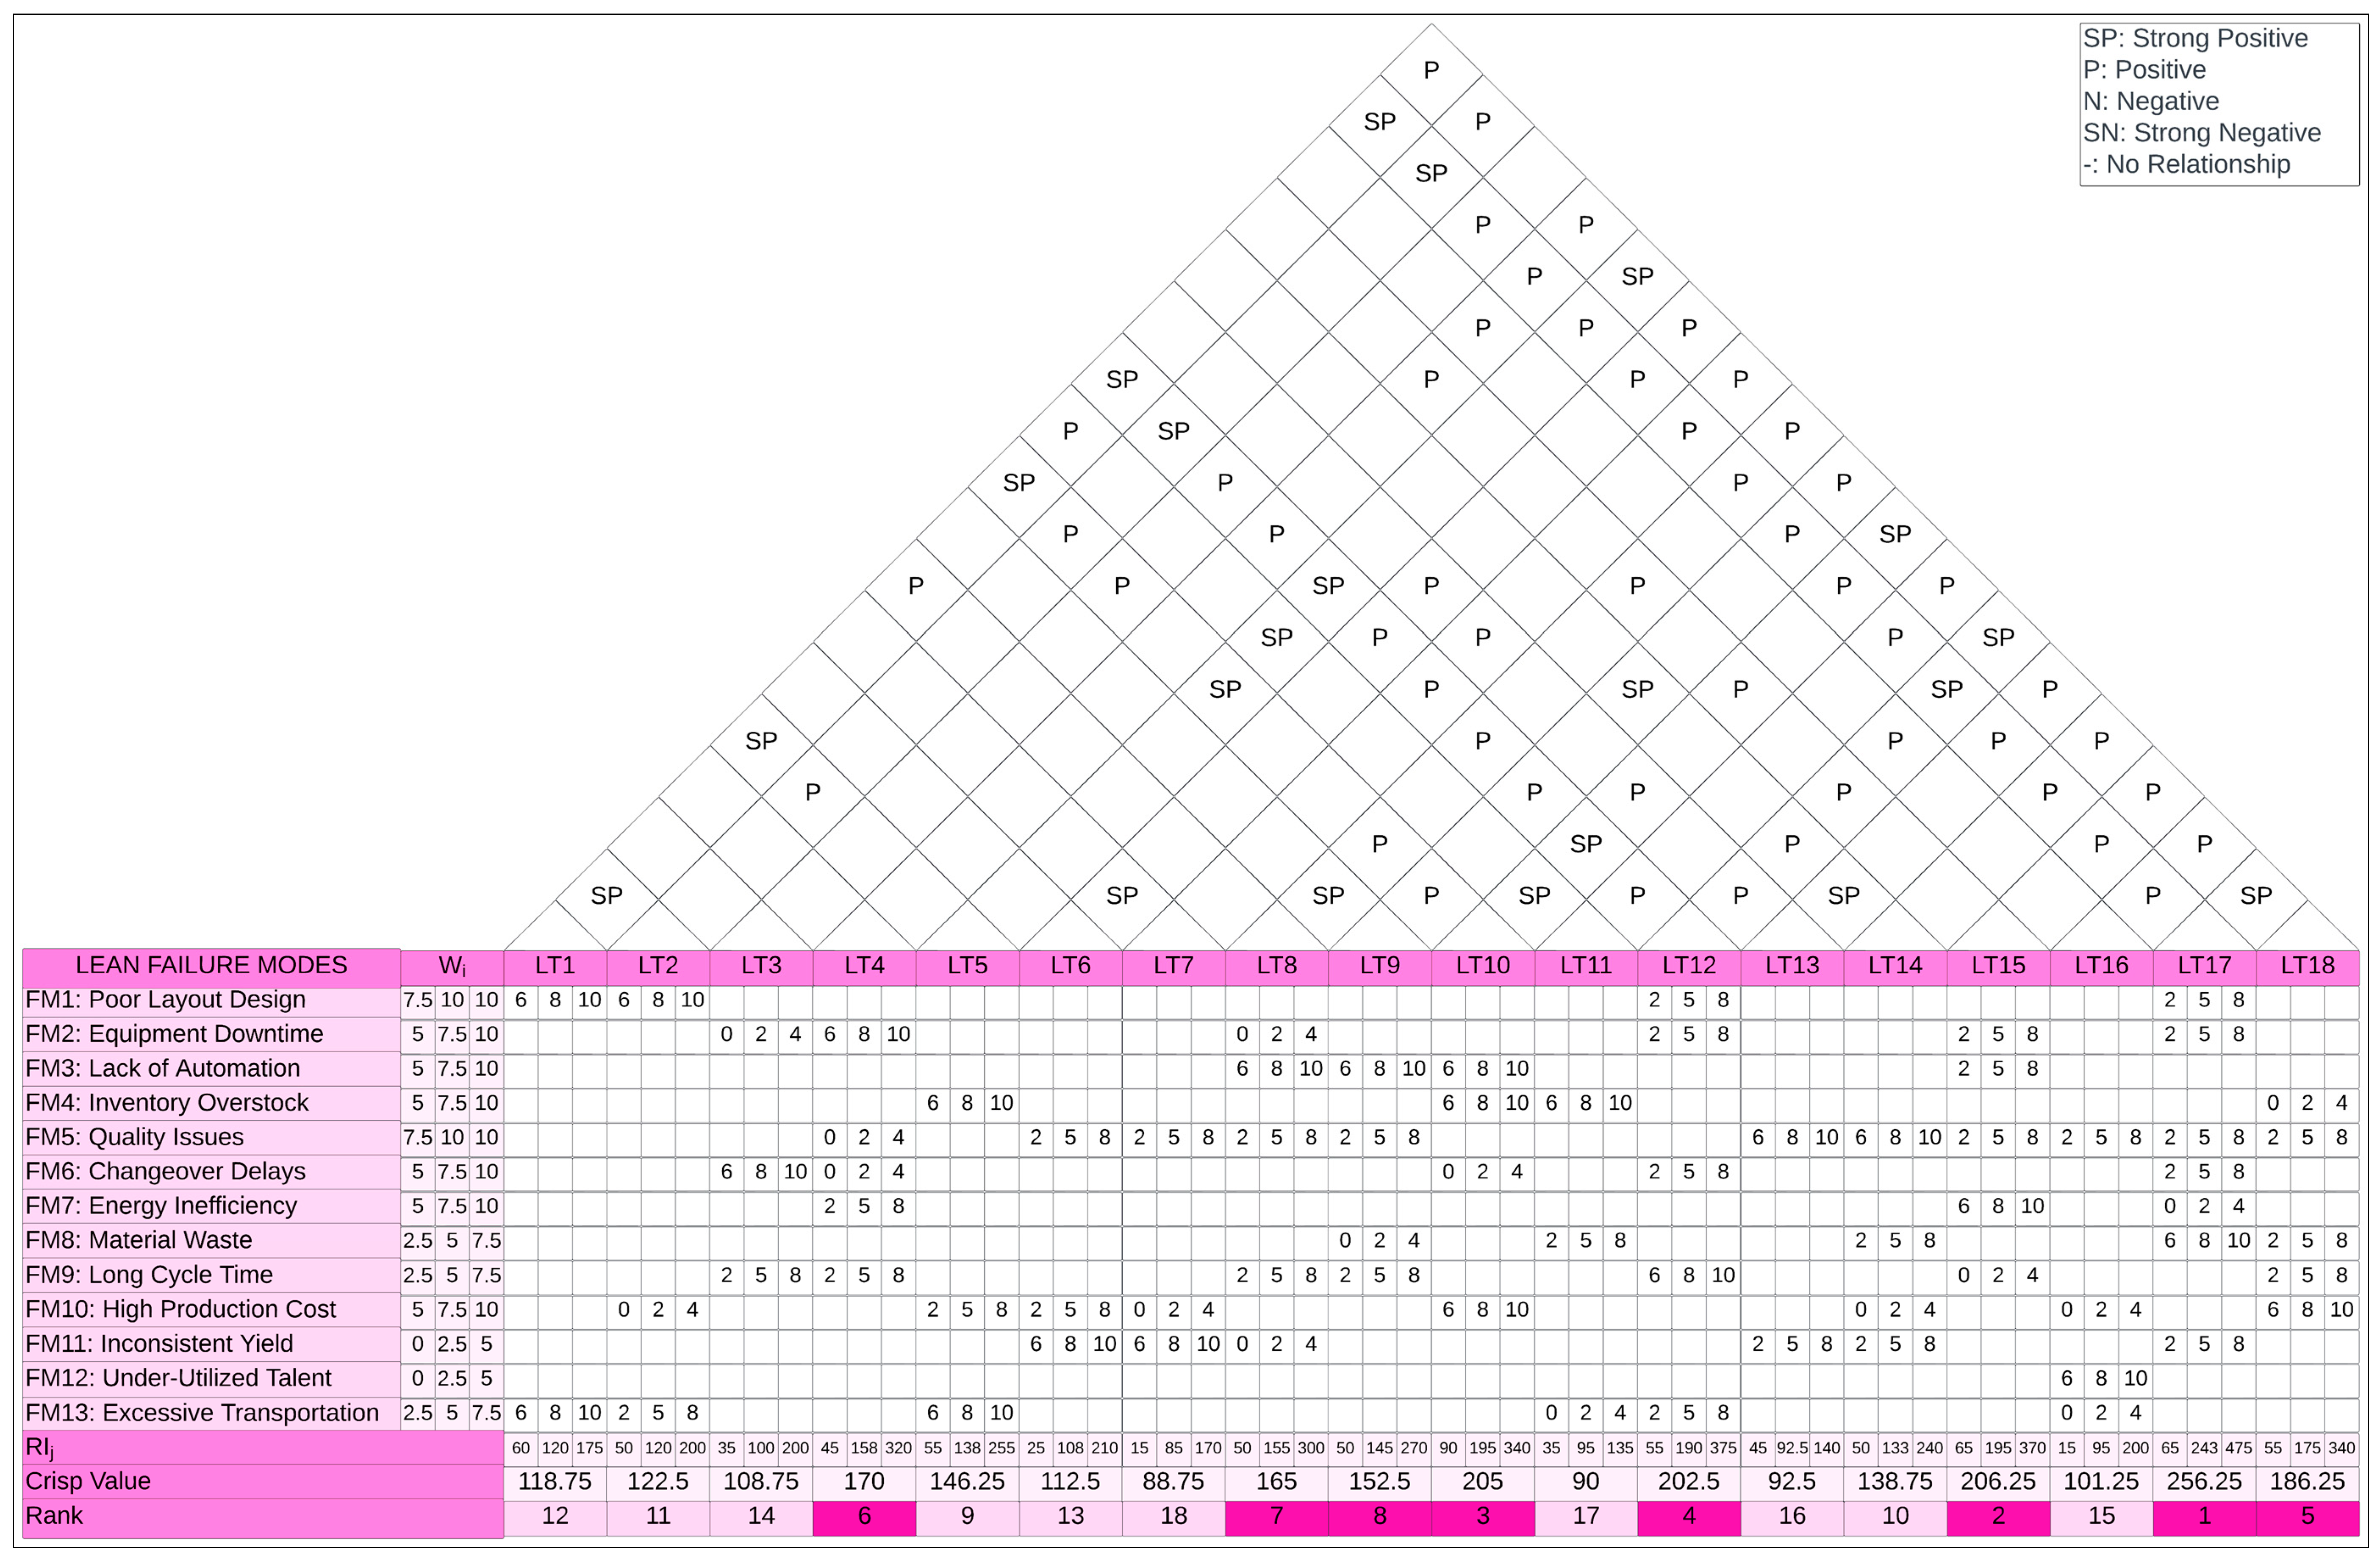
Within the Fuzzy QFD method, the prioritized LFMs are listed in the column. The technical requirement section included the lean tools and techniques that could potentially address the LFMs. In the initial phase, the importance weights of the LFMs were determined. Subsequently, a relationship matrix between the LFMs and lean tools was created. The correlation matrix, which shows the relationship between the selected lean tools is illustrated in
Figure 4. After the correlation matrix was created, the fuzzy importance weights of the lean tools were calculated. The fuzzy weights were then defuzzified to obtain the exact values of the lean tools. These values are presented in
Figure 4. Based on these values, a ranking was made to determine which lean tool would be used first.
The lean tool ranking derived from Fuzzy QFD revealed a complete list of lean tools with the highest potential to eliminate lean wastes within the wooden park/garden bench production process. The final set of lean tools was selected according to the threshold value specified in the methodology. The ranking of the lean tools based on the specified threshold values was as follows: Implement Kaizen and continuous improvement (LT17) with a crisp value of 256.02, upgrade machinery for energy efficiency (LT15) with a value of 206.25, Just-In-Time (JIT) (LT10) with a value of 205, optimize production processes with lean methodologies (LT12) with a value of 202.5, implement cost reduction strategies (LT18) with a value of 186.25, Total Productive Maintenance (TPM) (LT4) with a value of 170, invest in automation (LT8) with a value of 165, and Andon (LT9) with a value of 152.5.
At this stage, one should acknowledge that both deployed and not-deployed lean tools created a trade-off where direct and indirect advantages and lurking disadvantages should be accounted for. Although the Single-Minute Exchange of Dies (SMED) was identified through FMEA rankings as a potential solution for specific lean failure modes, it did not emerge in the final Fuzzy QFD results and was therefore not implemented. Nonetheless, concerns regarding its possible drawbacks—such as increased energy consumption from more frequent machine restarts—remain relevant in contexts where the SMED might eventually be adopted. This underscores the importance of evaluating lean tools’ advantages and potential trade-offs, including those not ultimately selected. Maintaining a holistic view of lean interventions ensures that each initiative, whether deployed or merely considered, aligns with broader operational and sustainability objectives. This is why this study employed a two-phased selection system of lean tools for better filtered and focused economic and environmental performance improvement measures.
The lean tools determined by the Fuzzy QFD methodology were applied to the current state VSM in sequence. Initially, Kaizen activities were recommended for the Raw Material Preparation, Initial Processing, Cutting and Shaping, and Profiling and Routing operations. The Kaizen activities aimed to minimize material waste in these operations, thereby reducing costs and environmental impact. Secondly, updating machinery for energy efficiency was suggested for the Raw Material Preparation, Initial Processing, Cutting and Shaping, Profiling and Routing, and Surface Finishing operations. Although energy savings and increased energy efficiency were anticipated from the updated machinery, it was also determined that these updates would reduce high production costs, contributing to the cost reduction strategies proposed in the fifth place.
The third recommended lean tool was Just-In-Time (JIT). By applying JIT to the Raw Material Preparation operation, inventory overstock was eliminated, followed by a reduction in high production costs. Fourthly, optimizing production processes with lean methodologies was recommended for the Initial Processing, Profiling and Routing, Surface Finishing, and Assembly operations to reduce long cycle times.
Fifth, cost reduction strategies were proposed for the Initial Processing, Profiling and Routing, Assembly, and Finishing and Packaging operations. This intervention reduced high production costs, increased profitability, and ensured more efficient resource use. The sixth lean tool applied was Total Productive Maintenance (TPM). TPM was implemented in the Initial Processing, Cutting and Shaping, Profiling and Routing, Surface Finishing, and Assembly operations, establishing a maintenance plan for the machines to prevent frequent breakdowns and significantly reduce downtime. Additionally, TPM helped prevent major machine failures, avoiding substantial costs for the business.
The seventh lean tool applied was automation. All processes within the business were performed manually, resulting in slow operations and low efficiency due to the lengthy processes. Therefore, automation was introduced in the Cutting and Shaping and Profiling and Routing operations. This reduced increasing labor costs and shortened the cycle time prolonged by manual operations. The final lean tool applied was Andon. Implementing Andon in the Raw Material Preparation, Initial Processing, Cutting and Shaping, Profiling and Routing, and Surface Finishing operations helped quickly identify and prevent errors within the process. The Andon system prevented increased labor costs due to errors. The stages at which all these lean tools were integrated into the production process’s current state are illustrated in the VSM shown in
Figure 5.
Implementing lean projects shown in
Figure 5 in the production process of wooden park/garden benches resulted in a significant reduction in total lead time, which improved by approximately 38.46%, reducing it to 352 min in the future state as presented in
Table 6. The value-added time in the current state improved by approximately 22.05%, decreasing to 152 min in the future state, while the non-value-added time was reduced by 47.64%, bringing it down to 200 min. Additionally, the required number of workers in the wooden park/garden bench production decreased from 14 to 12, representing an improvement of 14.29%. Finally, the total inventory in the system was reduced from 171 to 73 units, achieving an improvement of approximately 57.31% as shown in
Table 6. The future state VSM, illustrating all these improvements, is presented in
Figure 6.
As observed in
Figure 6, the improvements detailed in
Figure 5 have led to enhancements in the process steps. First, in the initial step of the process, Raw Material Preparation, the implementation of lean projects such as Andon, JIT, Kaizen, and machinery upgrades yielded a reduction in Cycle Time from 18 min to 14 min, achieving a 22.22% improvement. Changeover Time was reduced from 25 to 10 min, reflecting a 60% improvement. Up Time increased from 408 min to 456 min, indicating an 11.76% improvement, while Down/Idling Time decreased from 72 min to 24 min, showing a 66.67% improvement. Overall Equipment Effectiveness (OEE) improved from 85% to 95%, a gain of 11.76%, and First Pass Yield increased from 95% to 97%, an improvement of 2.11%. Production Cost Per Batch decreased from USD 250 to USD 200, marking a 20% improvement; Energy Efficiency improved from 90 kWh to 70 kWh, achieving a 22.22% improvement; and Solid Waste Amount decreased from 10 kg to 8 kg, reflecting a 20% improvement.
In the second step of the production process (Initial Processing), implementing projects such as Andon, Total Productive Maintenance (TPM), cost reduction strategies, optimized production processes, machinery upgrades, and Kaizen led to several improvements. Cycle Time was reduced from 27 min to 22 min, an 18.52% improvement, and Changeover Time was reduced from 30 min to 12 min, achieving a 60% improvement. Up Time increased from 384 min to 432 min, a 12.5% improvement, while Down/Idling Time decreased from 96 min to 48 min, showing a 50% improvement. OEE improved from 80% to 90%, a gain of 12.5%, and First Pass Yield increased from 93% to 95%, an improvement of 2.15%. Production Cost Per Batch decreased from USD 325 to USD 275, marking a 15.38% improvement; Energy Efficiency improved from 120 kWh to 90 kWh, achieving a 25% improvement; and Solid Waste Amount decreased from 15 kg to 10 kg, reflecting a 33.33% improvement.
The third stage of the process, Cutting and Shaping, involved the elimination of identified wastes through the implementation of Andon, TPM, Automation, machinery upgrades, and Kaizen initiatives. These efforts resulted in several key improvements in the measured KPIs: Cycle Time was reduced from 18 min to 14 min, achieving a 22.22% improvement, and Changeover Time was reduced from 35 min to 15 min, reflecting a 57.14% improvement. Up Time increased from 394 min to 444 min, a 12.69% improvement, while Down/Idling Time decreased from 86 min to 36 min, showing a 58.14% improvement. OEE improved from 82% to 92%, a gain of 12.2%, and First Pass Yield increased from 92% to 94%, an improvement of 2.17%. Production Cost Per Batch decreased from USD 287.5 to USD 237.5, marking a 17.39% improvement, Energy Efficiency improved from 100 kWh to 75 kWh, achieving a 25% improvement, and Solid Waste Amount decreased from 12 kg to 8 kg, reflecting a 33.33% improvement.
In the fourth step of the process, Profiling and Routing, lean projects such as Automation, Andon, TPM, cost reduction strategies, production process optimization, machinery upgrades, and Kaizen were implemented. These implementations reduced Cycle Time from 22 min to 18 min, achieving an 18.18% improvement, and a reduction in Changeover Time from 40 min to 16 min, reflecting a 60% improvement. Up Time increased from 374 min to 420 min, indicating a 12.30% improvement, while Down/Idling Time decreased from 106 min to 60 min, showing a 43.40% improvement. Overall Equipment Effectiveness (OEE) improved from 78% to 93%, a gain of 19.23%, and First Pass Yield increased from 90% to 93%, an improvement of 3.33%. Production Cost Per Batch decreased from USD 300 to USD 250, marking a 16.67% improvement; Energy Efficiency improved from 110 kWh to 85 kWh, achieving a 22.73% improvement; and Solid Waste Amount decreased from 14 kg to 10 kg, reflecting a 28.57% improvement.
The fifth step of the process, Surface Finishing, saw the implementation of lean projects such as TPM, Andon, production process optimization, and machinery upgrades. These improvements reduced Cycle Time from 20 min to 16 min, achieving a 20% improvement, and a decrease in Changeover Time from 45 min to 18 min, reflecting a 60% improvement. Up Time increased from 384 min to 432 min, indicating a 12.5% improvement, while Down/Idling Time decreased from 96 min to 48 min, showing a 50% improvement. OEE improved from 80% to 90%, a gain of 12.5%, and First Pass Yield increased from 91% to 94%, an improvement of 3.30%. Production Cost Per Batch decreased from USD 262.5 to USD 212.5, marking a 19.05% improvement; Energy Efficiency improved from 90 kWh to 70 kWh, achieving a 22.22% improvement, and Solid Waste Amount decreased from 8 kg to 5 kg, reflecting a 37.5% improvement.
In the sixth step of the process, Assembly experts implemented lean projects such as TPM, cost reduction strategies, and production process optimization to eliminate lean wastes. These lean projects reduced Cycle Time from 40 min to 30 min, achieving a 25% improvement, and a reduction in Changeover Time from 9 min to 4 min, reflecting a 55.56% improvement. Up Time increased from 360 min to 420 min, indicating a 16.67% improvement, while Down/Idling Time decreased from 120 min to 60 min, showing a 50% improvement. OEE improved from 75% to 85%, a gain of 13.33%, and First Pass Yield increased from 99% to 100%, an improvement of 1.01%. Production Cost Per Batch decreased from USD 200 to USD 115, marking a 42.5% improvement; Energy Efficiency improved from 130 kWh to 100 kWh, achieving a 23.08% improvement; and Solid Waste Amount decreased from 2 kg to 1 kg, reflecting a 50% improvement.
Cost-reduction strategies and production-process optimization improvements were implemented in the seventh and final stage of the process. These improvements resulted in a reduction in Cycle Time from 50 min to 38 min, achieving a 24% improvement, and a decrease in Changeover Time from 5 min to 2 min, reflecting a 60% improvement. Up Time increased from 336 min to 420 min, indicating a 25% improvement, while Down/Idling Time decreased from 144 min to 60 min, showing a 58.33% improvement. OEE improved from 70% to 80%, a gain of 14.29%, and First Pass Yield increased from 99% to 100%, an improvement of 1.01%. Production Cost Per Batch decreased from USD 225 to USD 150, marking a 33.33% improvement; Energy Efficiency improved from 150 kWh to 120 kWh, achieving a 20% improvement; and Solid Waste Amount decreased from 2.5 kg to 1.5 kg, reflecting a 40% improvement.
4. Discussion
This study’s results revealed findings consistent with the literature regarding the tangible gains achieved through the selected lean tools. Zahraee et al. (2021) reported a 36.36% improvement in total lead time in their study on lean waste elimination in the construction sector [
37]. Similarly, this study achieved a 38.46% improvement in total lead time following the implemented improvements. Another study yielding comparable results was conducted by Sirajudeen and Krishnan (2022), which focused on identifying lean wastes in a prefabricated component manufacturing company [
32]. Their study reduced lead time from 1102 min to 739 min, achieving a 32.94% improvement [
32]. In their study, Bhuvanesh Kumar and Parameshwaran (2019) prioritized lean failure modes and reported a 47.3% improvement in lead time in the automotive manufacturing sector [
44]. However, their study in the casting industry resulted in a markedly different outcome, with only an 11.3% improvement in lead time [
44].
In contrast, Bhuvanesh Kumar and Parameshwaran’s 2020 study on lean tool selection and waste elimination using MCDM methods in the manufacturing industry reported only a 5% improvement in lead time [
43]. Conversely, their 2018 study achieved a significantly higher improvement rate of 64.33% in lead time [
41].
Regarding value-added time, Bhuvanesh Kumar and Parameshwaran (2018) achieved a 25.93% improvement [
41]. Similarly, this study observed a 22.05% improvement in value-added time. Sirajudeen and Krishnan (2022) reported a 28.21% improvement in value-added time in their research, aligning closely with the findings of this study [
32]. In contrast, Mohanraj et al. (2015) reported the lowest improvement rate in the literature, with a 3.87% increase in value-added time, while Reda and Dvivedi (2022) achieved the highest improvement rate of 56.3 [
40,
45].
In terms of improvements in the workforce capacity, Bhuvanesh Kumar and Parameshwaran (2018) reported a 16.67% improvement, which was comparable to the 14.24% improvement observed in this study [
41]. However, Reda and Dvivedi (2022) achieved a similar reduction of two workers, corresponding to an improvement rate of 0.99% [
33].
However, these improvement results, while substantial, should be interpreted within the limited scope of a single product line—the wooden park/garden bench. Historically high inventory levels in this product family allowed targeted lean tools such as Just-In-Time (JIT) and Total Productive Maintenance (TPM) to be deployed with relative ease, yielding rapid gains in throughput and approximately a 60% reduction in inventory. Although initial OEE figures of 70–85% appeared robust, focused interventions revealed underutilized capacity, inadequate maintenance scheduling, and process inefficiencies that could be improved. Furthermore, the six-month timeline represents only a pilot phase; extending similar interventions to the firm’s entire product portfolio would likely involve a more prolonged rollout, more complex planning, and broader training efforts. Overall, the findings of this study highlight the transformative potential of lean-based improvements for a single product while also illustrating that distinct baseline conditions and a narrower scope can facilitate sharper improvements than those expected in multi-product environments.
In a broader perspective, the findings of Abreu et al. (2017) and Bhattacharya et al. (2019) argued that companies adopting lean-green models experience significant reductions in waste and energy consumption, which has positive effects on sustainability performance and increases efficiency [
26,
53]. Similarly, the findings of this study have achieved results that are consistent with the extant literature by providing both a reduction in waste and significant improvements in sustainability performance in businesses implementing lean principles. Concurrent with these studies, Dieste et al. (2019) revealed that companies adopting lean production practices in the manufacturing environment also make positive improvements in sustainability performance [
35]. Siegel et al. (2019) identified the most prevalent lean tools utilized by companies adopting the lean-green model, including 5S, TPM, and VSM, among others, with these tools employed at least once [
21]. As supported with empirical evidences of this and past studies, the same lean tools employed to eliminate waste in this and past studies yielded similar results. Concurrently, Farias et al. (2019) developed a set of criteria to evaluate lean and green performance and found that the most common lean tools corresponding to this set of criteria were JIT/Pull and SMED, followed by Kaizen and TPM [
69]. In this study, the lean tools selected to enhance lean and sustainability performance bear a strong resemblance to those identified in past studies.
Furthermore, the Waste Identification Diagram (WID) is another essential tool in waste management, providing a structured way to identify and visualize waste across various processes. The WID represents production units and their operational waste more effectively than Value Stream Mapping (VSM) [
70]. Similar to VSM, by enhancing the visual representation of waste, the WID allows organizations to pinpoint the most significant waste sources and understand the complex relationships between different elements within a production environment [
71]. The implementation of the WID alongside other methodologies, like Failure Mode and Effect Analysis (FMEA) and Lean principles, has proven effective in prioritizing and minimizing waste [
72]. WID’s efficacy is underscored by its comparative performance against VSM. Past research indicates that the WID is often more effective in identifying ‘Muda’ (waste) within processes, as noted by Contreras et al., who found that the WID provides more precise insights that lead to enhanced waste management strategies [
71]. For instance, the incorporation of lean principles using the WID allows for a transformative approach in sectors such as healthcare and manufacturing, where waste reduction is critical to improving overall performance [
73]. On the other hand, the findings of this study showed that VSM was also effective in waste identification when strengthened with proper KPIs and supported with the FMEA. Consequently, organizations embracing VSM and the WID alongside lean principles could realize significant improvements in reducing operational waste and enhancing value creation.
Overall, the results of this study could be better understood when discussed in the context of managerial, practical, and application-oriented implications. This study aimed to significantly contribute to the scientific body of knowledge by addressing the intersection of four critical research streams: sustainability, lean management, MCDM, and outdoor wood furniture manufacturing. Integrating these streams into a cohesive framework presents several scientific implications. Firstly, this study bridges the gap between sustainability, lean management, MCDM, and outdoor wood furniture manufacturing, providing a holistic framework that can be adapted to various manufacturing sectors. This integrated approach can be a foundation for future research in other industries. Secondly, this study contributes to methodological advancements in the field by applying advanced methodologies such as Value Stream Mapping, Fuzzy QFD, and Fuzzy FMEA within the context of sustainable lean manufacturing. Integrating these tools helps identify and mitigate risks, optimize production processes, and enhance decision-making capabilities. Lastly, the development and application of sustainability metrics within the lean management framework provide a new dimension to traditional lean tools, helping balance economic, environmental, and social aspects of manufacturing and contributing to the broader discourse on sustainable manufacturing practices.
The findings of this study have significant implications for managers in the outdoor wood furniture manufacturing industry. By adopting the integrated framework proposed in this study, managers can enhance decision-making capabilities by applying MCDM tools within the lean management framework, enabling more informed and balanced decisions considering all critical factors, including sustainability, cost, and efficiency. Empirical evidence showed that lean production facilitates process optimization and waste reduction, thereby enhancing operational efficiency. Research has indicated that integrating green initiatives to minimize environmental impact with efforts to reduce energy consumption or limit non-value added production can significantly improve firms’ sustainability performance. This dual focus is particularly important as firms seek to meet the evolving demands of stakeholders who prioritize economic and environmental objectives [
21,
26,
35,
53,
69]. Improved efficiency is another key benefit, as lean management principles integrated with sustainability practices lead to the identification and elimination of non-value-added activities, waste reduction, and optimized resource utilization, resulting in cost savings and enhanced productivity. Additionally, incorporating sustainability metrics into the production process aligns with corporate social responsibility goals, allowing managers to track and improve their environmental performance, reduce carbon footprints, and promote sustainable practices throughout the supply chain. Furthermore, using Fuzzy QFD and Fuzzy FMEA aids in identifying potential risks and prioritizing mitigation strategies, ensuring smoother operations and reducing the likelihood of disruptions.
The practical implications of this study are substantial, offering actionable insights for industry practitioners. This study provides a detailed roadmap for implementing lean tools such as VSM, 5S, and Just-In-Time in outdoor wood furniture manufacturing, enabling practitioners to streamline operations, improve workflow, and enhance overall efficiency. Practical guidelines for integrating sustainability practices into daily operations are also provided, including strategies for reducing waste, optimizing energy use, and sourcing sustainable materials, essential for achieving long-term environmental goals. Additionally, this study highlights the importance of training employees in lean and sustainable practices, and practical training programs can be developed based on this study’s findings to equip employees with the necessary skills and knowledge to implement these practices effectively. Lastly, the integrated framework helps optimize the entire supply chain, from raw material procurement to end-item delivery, and practitioners can apply this study’s insights to enhance collaboration with suppliers, improve inventory management, and reduce lead times.
While this study provides valuable insights and contributions to sustainability, lean management, MCDM, and outdoor wood furniture manufacturing, it has limitations. These limitations, however, open up several avenues for future research. First and foremost, this study was limited to a single product line—the wooden park/garden bench—resulting in more focused and manageable improvements that may not directly translate to the firm’s entire product range, where scalability difficulties, additional complexities and extended implementation timelines could arise.
One limitation of this study is the specific focus on the outdoor wood furniture industry, which might limit the generalizability of the findings to other manufacturing sectors. Future research could explore the applicability of the integrated framework in different industries, such as automotive, electronics, or food manufacturing, to validate and refine the framework’s versatility and robustness across various contexts.
Another limitation is the reliance on specific methodologies such as VSM, Fuzzy QFD, and Fuzzy FMEA. While these tools are robust and valuable, they may not capture all aspects of complex manufacturing systems, particularly those involving high variability and uncertainty. Future research could investigate integrating additional methodologies, such as digital twins or machine learning algorithms, to enhance the framework’s predictive and adaptive capabilities.
This study also primarily relies on quantitative data for analysis and decision making. This approach may overlook qualitative factors such as employee satisfaction, organizational culture, and stakeholder engagement, which are crucial for successfully implementing lean and sustainable practices. Future research could incorporate qualitative methodologies, such as case studies or interviews, to gain a deeper understanding of these softer aspects and their impact on the overall effectiveness of the framework.
Moreover, this study assumes a static environment for implementing the integrated framework. Manufacturing environments are dynamic and constantly evolving due to technological advancements, market fluctuations, and regulatory changes. Future research could focus on developing adaptive frameworks that respond to these changes in real time, ensuring continuous improvement and resilience in manufacturing operations.
Another significant limitation is the potential bias introduced by the subjective judgments in the QFD and FMEA methodologies, although the introduction of the fuzzy numbers helped with alleviating this limitation. While these tools help prioritize issues and identify critical factors, the reliance on expert opinions can introduce subjectivity and bias. Future research could explore using more objective data sources and advanced analytical techniques to mitigate these biases and improve the reliability of the findings.
Finally, this study does not extensively address the economic trade-offs in implementing sustainability and lean practices. While these practices offer long-term benefits, they often require significant upfront investments. Future research could develop detailed cost–benefit analyses and financial models to help organizations understand and manage these trade-offs, ensuring that sustainable and lean practices are economically viable. Moreover, a total integration of HOQ into economic and environmental performance enhancement projects could be explored in future studies. Also, direct and indirect potential negative impacts associated with deployed improvement propositions and lean tools due to their characteristics and dynamic production process would be among intriguing future research topics. Furthermore, the WID and VSM could be comparatively studied to assess their effectiveness in waste identification and process illustration.
In conclusion, while this study significantly contributes to integrating sustainability, lean management, MCDM, and outdoor wood furniture manufacturing, several limitations provide fertile ground for future research. By addressing these limitations, future studies can enhance the integrated framework’s robustness, applicability, and practical relevance, contributing to more sustainable and efficient manufacturing practices across various industries.


