Abstract
As the global market for shipping perishable goods expands, the substantial loss and high claim costs associated with these goods have drawn increasing attention. Blockchain technology (BCT) can improve customs clearance efficiency and reduce perishable goods loss. However, the high investment costs present a clear trade-off between enhancing clearance efficiency to mitigate loss and claims costs and the financial burden of BCT adoption. Additionally, determining which stakeholder should invest in BCT has become a critical strategic issue. To address this, we develop three Stackelberg game models to investigate the optimal BCT investment strategies for different entities—the port and the shipping company—in the maritime supply chain. Building on previous models in the existing literature, we incorporate the perishable goods loss rate and claim costs to offer new insights into how the perishable goods loss rate influences BCT investment outcomes. The results reveal that when the shipping company invests in BCT, if its BCT investment cost coefficient is within a certain range, a higher perishable goods loss rate can generate higher profits for both the port and the shipping company. Furthermore, our findings indicate that BCT investment enhances consumer surplus and social welfare in the maritime supply chain when considering perishable goods loss.
1. Introduction
1.1. Background and Motivation
As the global market for shipping perishable goods continues to expand, the associated loss and high claim costs have gained increasing attention. Data show that the global market for shipping perishable goods was valued at approximately USD 1.93 billion in 2023, with a projected compound annual growth rate (CAGR) of 2.8% from 2023 to 2027 [1,2]. However, due to the time-sensitive nature of perishable goods, delays in customs clearance at borders can result in substantial economic loss and product quantity loss, thereby harming the interests of both customers and shipping companies. For instance, in 2022, inefficient customs clearance at the port of Philadelphia caused transportation and clearance time between Chile and the port to extend up to 45 days compared to the usual average of 20 days [3]. This resulted in the severe deterioration of perishable goods such as fresh grapes and blueberries intended for the U.S. market. Meanwhile, the claim costs for perishable goods are considerable, sometimes reaching tens of thousands of dollars per container [4]. Hence, improving clearance efficiency is crucial for reducing loss in perishable goods.
In this context, leveraging blockchain technology (BCT) to enhance customs clearance efficiency becomes particularly important. In the maritime industry, BCT is specifically employed to digitize paperwork, improve information sharing, and automate processes [5]. The adoption of BCT simplifies customs clearance procedures and enhances clearance efficiency, thereby reducing perishable goods loss and supporting waste mitigation efforts [6,7,8]. Specifically, some scholars have estimated a 42.1% reduction in goods loss in the maritime supply chain with the use of a BCT-based beef cold chain system through simulation analysis [9]. According to a report published by the United Nations Conference on Trade and Development (UNCTAD) in 2023, the organization advocates for ports and shipping companies to increase investment in advanced technologies such as BCT to enhance operational efficiency in the maritime supply chain [10]. Simultaneously, China’s Ministry of Transport has introduced regulations aimed at promoting the use of BCT for the electronic release of imported refrigerated containers, which is intended to improve the service quality of reefer shipping.
However, data from second case studies indicate that investing in a BCT platform can range from millions to tens of millions of dollars, including expenses for hardware and software, the costs associated with the training of staff and the organizational transition [11,12]. Therefore, the BCT investment cost presents a clear trade-off between improving clearance efficiency to reduce perishable goods loss and claims costs and the financial burden of investing in BCT. The perishable goods loss rate varies by type, with fresh fruits and vegetables being more prone to spoilage compared to meat, resulting in higher potential claims costs. Therefore, whether BCT investment can generate profits may vary depending on the different perishable goods loss rate.
Additionally, given the unoverlooked BCT investment cost, another strategic issue arises: who should invest BCT—the port or the shipping company? Previously, Maersk and IBM jointly decided to discontinue operating the BCT-based maritime trade platform TradeLens, with one of the reasons being its failure to achieve commercial viability [13]. In contrast, the Global Shipping Business Network (GSBN), which aims to provide a paperless and transparent solution connecting ports, shipping companies, and shippers, continues to operate. The contrasting fates of GSBN and TradeLens highlight the fact that the benefits derived from BCT investments differ significantly depending on the roles within the maritime supply chain, influenced by the conflicting interests of various participants.
Therefore, motivated by the background discussed above, we aim to critically analyse BCT investment decisions under different scenarios, with a particular focus on whether the investment should be made by the port or the shipping company and how the perishable goods loss rate influences these decisions.
We aim to answer the following research questions:
- Is it beneficial to invest in BCT when considering the perishable goods loss?
- Who is better off investing in BCT? And what are optimal strategies for port and shipping company?
- Is it more beneficial for the port and the shipping company to transport goods with a high or low perishable goods loss rate based on BCT?
To answer these above issues, we first construct the baseline model without BCT investment, followed by two models where the port and the shipping company invest in BCT, respectively. Unlike other models, we introduce the formulas for perishable goods loss rates and claim costs, aiming to provide new insights into how perishable goods loss rates influence the investment outcomes of BCT. Equilibrium results are derived for each of these three models. By comparing the outcomes, we further reveal the impact of BCT investment, considering perishable goods loss, on the shipping market demand, port and shipping company profits, consumer surplus, and social welfare.
Through the further analysis of the equilibrium results, we identify the optimal BCT investment strategy and discuss who should invest in BCT from the perspective of profits. Moreover, we uncover how different perishable goods loss rates affect the outcomes of BCT investment.
1.2. Contribution Statements and Paper Structure
Our research makes three key contributions to the research on operations management of BCT in the maritime supply chain considering perishable goods loss.
First, targeting the limitations of existing research that have not considered the impact of perishable goods loss on BCT investment, our study is the first to incorporate the perishable goods loss rate and claim costs into the model, analysing their effects on the optimal decisions, market demand, and profits of different investment entities.
Second, our research provides theoretical support to the current literature. By incorporating the perishable goods loss rate and claim costs into our model, we verify that BCT investment can increase consumer surplus and social welfare under the condition of perishable goods loss. Furthermore, our conclusions align with the empirical evidence provided by Jo et al. (2022) that, when considering perishable goods loss, adopting BCT can enhance consumer surplus and social welfare, thereby offering additional theoretical validation [9].
Finally, our findings indicate that if the shipping company invests in BCT and its BCT investment cost coefficient is kept within a certain range, a higher perishable goods loss rate leads to increased profits for both the port and the shipping company, as well as higher market demand.
The paper is structured as follows: Section 2 reviews the literature to identify research gaps. Section 3 outlines the three game models. Section 4 discusses the effects of BCT investment and analyses the impact of the perishable goods loss rate in the maritime supply chain by comparing outcomes. Section 5 uses numerical experiments to explore optimal strategies for the port and shipping company, validating the proposed propositions. Managerial and practical limitations and implications for future research are in Section 6.
2. Literature Review
Our study covers three key aspects: BCT, the maritime supply chain, and the shipping of perishable goods. Therefore, in the Literature Review Section, we focus on research related to these areas.
2.1. BCT in Maritime Supply Chain
BCT is a distributed database technology, characterized by transparency, traceability, automation, immutability, and decentralization [14]. Applications of BCT in the maritime supply chain encompass electronic bills of lading, customs clearance, the digitalization of paperwork, and cargo tracking and tracing [15]. Leveraging these features, some scholars have started to explore BCT-related research in the maritime supply chain context.
Several studies have investigated the value of BCT in the maritime supply chain, highlighting its positive impacts such as improved customs clearance efficiency, reduced paperwork, and enhanced logistics transparency [7,15,16,17]. Some scholars have identified key stakeholders in the adoption of BCT in the maritime supply chain. For example, Nguyen et al. (2023) found that shipping companies are early adopters and ports are fast followers in BCT adoption [18]. Balci and Surucu-Balci (2021) found that high prominent stakeholders are ports, shippers, and customs [19].
However, there are still challenges to adopting BCT, with the expensive construction costs being one of the key factors [12,15]. Therefore, some scholars discuss the balance between service level and investment costs of BCT in the maritime supply chain. For instance, Zhong et al. (2021) highlighted BCT’s potential role in regulating freight rates and preventing price wars in container shipping markets [20]. Wang et al. (2023) found that BCT investment costs and logistics service transparency jointly influence shipping firms’ market demand, optimal market price, and profit [21]. Wang et al. (2021) found that the relationship between the unit net benefit and unit operations cost brought out by BCT is a key factor of BCT adoption [6]. Pu and Lam (2022) found that BCT initiators should prioritize improving the technology’s cost-effectiveness [22].
2.2. Perishable Goods Research with BCT
Blackburn and Scudder (2009) defined perishable goods as items that peak in value at harvest or production and lose value exponentially until they are refrigerated to slow deterioration [23]. Due to the sensitivity of perishable goods to temperature and time, cold chain transportation is the method used to ensure the quality of these goods during transportation [24].
BCT has a positive impact on the reduction in perishables loss [25]. Some scholars have researched the impact of BCT on perishable goods and the cold chain, focusing primarily on the role of BCT’s traceability, transparency, and trustworthiness in facilitating information sharing and oversight within the perishable goods supply chain [8,26,27,28,29]. Some scholars have discussed strategies for a supply chain to adopt BCT, particularly in scenarios involving perishable goods, and found that BCT adoption may induce the upper stream in the supply chain to increase the wholesale price [30,31,32]. Moreover, Wu et al. (2021) found that adopting BCT is not always the optimal decision for the food supply chain; it depends on the perishable goods loss rate [33].
2.3. Perishable Goods Research in Maritime Supply Chain
In the maritime supply chain, the transportation modes for perishable goods typically involve reefer bulk goods shipping or reefer container shipping [34]. Some scholars have studied the factors influencing perishable goods loss in the maritime supply chain and concluded that congestion, customs procedures, shipping delays are the main factors [35,36]. Some scholars revealed that the type of perishable goods may have a greater impact on the seaborne cold chain [34].
Research on BCT in the maritime supply chain with perishable goods is indeed limited. Some scholars have established a BCT-based beef shipping cold chain system and simulated the changes in food loss and waste based on the BCT platform [9]. Others have explored how to incentivize cold chain enterprises in the maritime industry to adopt BCT and actively participate in an information sharing platform using evolutionary game theory methods [37].
2.4. Research Gap
Through the summary of the literature mentioned above, it is clear that, firstly, the current literature is controversial regarding whether BCT increases consumer surplus and social welfare. Secondly, we found that there is limited research focusing on the investment of BCT in the maritime supply chain with perishable goods.
On the one hand, empirical studies by Jo et al. (2022) have found that using BCT can increase consumer surplus in the beef cold chain [9]. Therefore, there is a need for theoretical support to verify the impact of BCT investment on consumer surplus and social welfare in the maritime supply chain with perishable goods loss. On the other hand, some scholars have only investigated the case of port investment in BCT in the cold chain context; therefore, it is necessary to investigate the scenario of the shipping company investing in BCT [37].
To fill these gaps, we focus on investigating the effects of investing in BCT led by either the port or shipping company on market demand, profits, consumer surplus, and social welfare in the maritime supply chain. In addition, we examine the impact of the perishable goods loss rate on the profits and market demand under different investment scenarios.
3. Modelling and Equilibrium Results
In this paper, we consider a maritime supply chain with perishable goods, consisting of a port, a shipping company, and a shipper, as shown in Figure 1. The solid lines in Figure 1 represent the flow of goods, where the shipping company transports perishable goods from the shipper to the port. The dashed lines indicate the services provided by the port and the shipping company: the port offers services such as customs clearance and cargo release to the shipping company, while the shipping company provides reefer shipping services to the shipper.
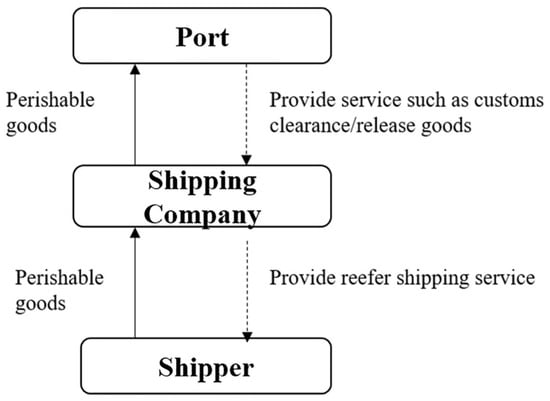
Figure 1.
Structure of the maritime supply chain.
In a traditional maritime supply chain, perishable goods often suffer quantity loss due to long transportation times and inefficient customs clearance [23,24,36]. According to the Rotterdam Rules [38] and the existing industry practice [4], if perishable goods deteriorate during transportation or unloading, the shipping company is typically considered the liable party and is responsible for compensating the shipper for the quantity loss. Therefore, in this paper, the shipping company is assumed to bear the claim costs for perishable goods loss during transport and customs clearance.
However, BCT can effectively address this issue. By leveraging functions such as electronic cargo release, BCT benefits the entire maritime supply chain by improving customs clearance efficiency, reducing perishable goods loss, and lowering the claim costs paid by the shipping company [12].
Given these benefits, this study examines BCT investment by either the port or the shipping company, as each entity’s investment leads to distinct economic outcomes, including market demand and the profits of both the port and the shipping company. When the port invests in BCT, the investment cost is borne by the port, while the shipping company benefits from reduced perishable goods loss and lower compensation payments. When the shipping company invests in BCT, the investment cost is borne by the shipping company, while the port may indirectly benefit, such as through an increased profit of the port.
Notably, the adoption of BCT across the maritime supply chain is often associated with costs that cover not only expenses for hardware and software but also costs related to staff training and organizational transition [12]. Therefore, to simplify our modelling, we assume that all the above-mentioned costs are construction costs and are considered one-time costs.
Given these differences, we propose three models to investigate the benefits of BCT investment and optimal BCT investment strategies for the port and shipping company, considering perishable goods loss.
For ease of reading, we summarize the notations used in the three models in this paper, as shown in Table 1.

Table 1.
Notations and descriptions.
3.1. Model NBCT
The first one is model NBCT, representing a traditional maritime supply chain where neither the port nor the shipping company invests in BCT. The structure of model NBCT is shown in Figure 2.
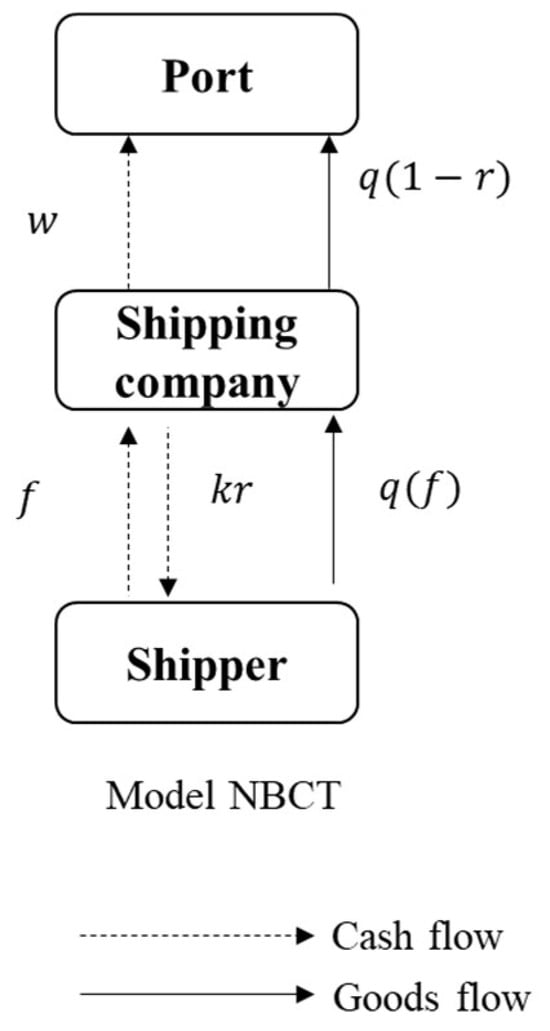
Figure 2.
Structure of model NBCT.
Let be the real demand in the shipping market and be the potential market scale. In particular, this paper considers the transportation of perishable goods, for which shipping companies typically use reefer transport. Consequently, let be the reefer freight rate, which is decided by the shipping company [34]. Let be the reefer freight rate elasticity coefficient. Then, the demand function in model NBCT is
In model NBCT, the port decides the service price . Hence, the profit of the port is
The shipping company decides the reefer freight rate based on the port service price . Let be the basic quantity perishable goods loss rate without investing in BCT (hereinafter referred to as the perishable goods loss rate). Let be the unit claim cost of perishable goods loss, then is the unit claim cost paid by the shipping company to the shipper. The profit of the shipping company is
3.2. Model PBCT
The second one is model PBCT, representing the port investing in BCT. The structure of model PBCT is shown in Figure 3.
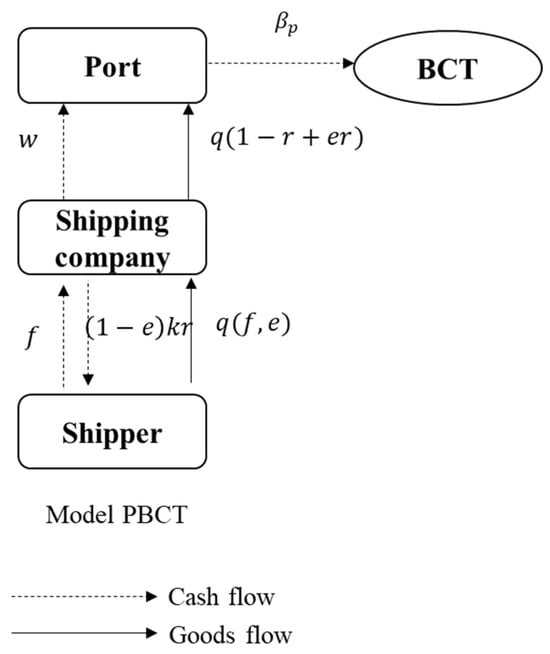
Figure 3.
Structure of model PBCT.
In model PBCT, we consider the increase in market demand driven by BCT investment. Let be the enhanced customs clearance efficiency due to BCT investment [21]. Let λ be the marginal impact of the enhanced customs clearance efficiency on market demand. Then, the demand function in model PBCT is
In model PBCT, the port decides the service price and the enhanced customs clearance efficiency . The parameter represents the port’s BCT investment cost coefficient, which measures the investment cost required to achieve a certain enhanced customs clearance efficiency. Then, the port’s BCT investment cost is , a commonly used expression in the operations management literature [21,39]. This quadratic cost function represents the diminishing marginal returns of BCT investment, reflecting the rising marginal cost of enhancing customs clearance efficiency. Therefore, we adopt this function to more accurately represent the effects of BCT investment. Given that the port incurs costs for BCT investment, the profit of the port is
The shipping company decides the reefer freight rate based on the port service price and the enhanced customs clearance efficiency . Due to the adoption of BCT, the quantity loss of perishable goods is reduced. According to Yu and Xiao (2017), the perishable goods quantity loss with BCT investment is modelled as [39]. Therefore, the profit of the shipping company is
3.3. Model SBCT
The third model is the shipping company investing in BCT. The structure of model PBCT is shown in Figure 4.
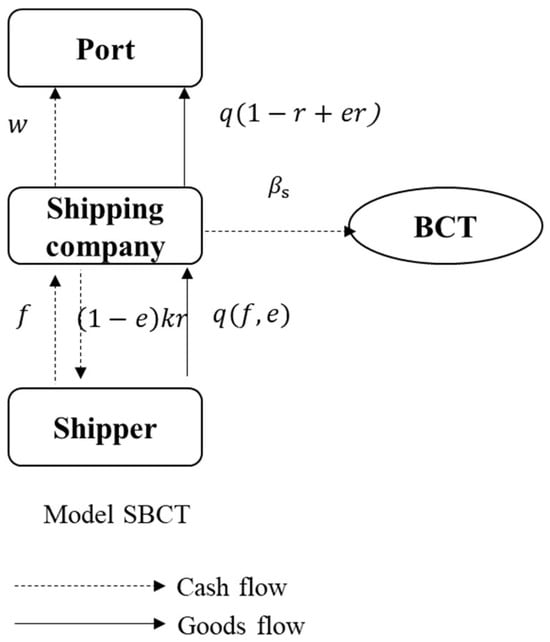
Figure 4.
Structure of model SBCT.
In model SBCT, BCT investment leads to the same increase in market demand as in model PBCT. Therefore, the demand function in model SBCT is identical to that in model PBCT, as shown in Equation (4). Unlike model PBCT, the port only decides the service price . Therefore, the profit of the port is
The shipping company decides the reefer freight rate and the enhanced customs clearance efficiency according to the port service price . Let represent the shipping company’s BCT investment cost coefficient. Since the shipping company invests in BCT, it incurs the corresponding BCT investment cost of . The shipping company’s unit claim cost is . Therefore, the profit of the shipping company is
3.4. Equilibrium Results
Lemma 1.
In model NBCT, if , there exist equilibrium solutions for decision variables and profits of the port and shipping company (notably, the condition also holds for the equilibrium solutions in the other two models. This condition ensures the existence of the equilibrium solution, which is a fundamental requirement across all models).
Lemma 2.
If the port invests in BCT, when
, there exist equilibrium solutions for decision variables and profits of the port and shipping company, where .
Lemma 3.
If the shipping company invests in BCT, when
, there exists equilibrium solutions for decision variables and profits of the port and shipping company, where .
Lemma 2 and Lemma 3 collectively indicate that the profitability of BCT investment depends on the investment cost coefficient thresholds for both the port and the shipping company. Specifically, the port’s investment in BCT is only profitable when , suggesting that the port must have a strong management foundation and higher customs clearance efficiency to justify continued BCT investment. Similarly, the shipping company can only achieve profitability when , with its investment cost threshold being higher than that of the port. This implies that the shipping company requires a more robust management base before considering BCT adoption to enhance customs clearance efficiency.
Overall, we summarize the equilibrium solutions of market demand and the profits of the port and the shipping company under the three BCT investment scenarios to analyse the effects of BCT investment, as shown in Table 2. Here, denote the equilibrium market demand under the NBCT, PBCT, and SBCT models, respectively. Similarly, represent the equilibrium profits of the port under these three models, while and denote the equilibrium profits of the shipping company under the respective models. The detailed calculation process can be found in the Supplementary Materials.
Table 2.
Equilibrium results.
4. Effects of BCT Investment and Analysis of Perishable Goods Loss Rate
To answer the first and second questions, we investigate the effects of BCT investment in the maritime supply chain with perishable goods. This paper first examines whether BCT investment is beneficial by comparing market demand, profits, consumer surplus, and social welfare between scenarios with and without BCT investment. Next, this paper compares market demand, profits, consumer surplus, social welfare under model PBCT and model SBCT to explore which entity—the port or the shipping company—is better off investing in BCT.
To answer the third question, we analyse the impact of the perishable goods loss rate on the profits of the port and the shipping company as well as the market demand to investigate whether transporting goods with a high or low perishable goods loss rate is more beneficial for these entities under BCT investment.
4.1. Benefits of BCT Investment
4.1.1. Market Demand and Profits Effects
Proposition 1.
We compare market demand and the profits of the port and the shipping company between scenarios with and without BCT investment, and this can be determined as follows: ; }, }.
Proposition 1 indicates that, compared to not investing in BCT, whether the investment is made by the port or the shipping company, it leads to higher market demand, the profit of the port, and the profit of the shipping company.
4.1.2. Consumer Surplus and Social Welfare Effects
Drawing on a prior study [39], we define the formula of consumer surplus (CS) as follows:
where denotes the equilibrium reefer freight rate, represents the maximum reefer freight rate, and denotes the demand function.
Social welfare (SW) is defined as follows [40]:
where represents the total profit of all stakeholders in the maritime supply chain, including the port and the shipping company.
Then, we derive the results of consumer surplus and social welfare under the three models and conduct a comparison (detailed results are provided in the Supplementary Materials).
Proposition 2.
We compare the consumer surplus and social welfare between scenarios with and without BCT investment, and this can be determined as follows: ; .
Proposition 2 indicates that consumer surplus and social welfare are higher with BCT investment than without, which implies that BCT investment brings more benefits like reduced perishable goods loss and improved customs clearance efficiency.
4.2. Comparisons Between Model PBCT and Model SBCT
4.2.1. Market Demand and Profit Effects
Proposition 3.
We compare market demand under model PBCT and model SBCT, and it can be determined as follows: if then ; if then , where represents the lower bound of the port’s BCT investment cost coefficient.
This indicates that when the port’s BCT investment cost coefficient falls within this range, i.e., , the market demand under model PBCT is higher than that under model SBCT. In other words, BCT investment by the port can more effectively increase market demand. Otherwise, when , BCT investment by the shipping company becomes a more favourable approach for boosting market demand.
Proposition 4.
We separately compare the profits of the port and the shipping company under model PBCT and model SBCT, and this can be determined as follows: (a) If , then ; if then ; (b) If , then , then . Where M is a coefficient (with ) that determines the threshold at which the profit of the shipping company under model SBCT exceeds that under model PBCT. The derivation of M is provided in the Supplementary Materials.
Proposition 4 illustrates that when , the profits of both the port and the shipping company in the case under model SBCT are higher than that under model PBCT. Because market demand is higher in model SBCT under this condition (as derived from Proposition 3, where leads to higher market demand in model SBCT compared to model PBCT), the increased demand leads to greater profits for both the port and the shipping company, making it more profitable for the shipping company to invest in BCT.
Meanwhile, Proposition 4a,b indicate that the correlation between port and shipping company BCT investment cost coefficients lead to different optimal strategies, which will be analysed in Section 5.1.
4.2.2. Consumer Surplus and Social Welfare Effects
Proposition 5.
We compare consumer surplus under model PBCT and model SBCT, and it can be determined as follows: when ; otherwise, .
Proposition 5 compares consumer surplus under model PBCT and model SBCT, and it reveals that the relationship between the port’s BCT investment cost coefficient and the shipping company’s BCT investment cost coefficient influences the relative levels of consumer surplus. When , the port investing in BCT achieves higher consumer surplus. However, when exceeds this threshold, BCT investment by the shipping company results in greater consumer surplus.
Proposition 6.
We compare social welfare under model PBCT and model SBCT, and it can be determined as follows: if , then , and (The derivations of are provided in the Supplementary Materials).
Proposition 6 states that when the port’s BCT investment cost coefficient and the shipping company’s BCT investment cost coefficient satisfy a certain condition (i.e., ), social welfare under model PBCT is higher than that under model SBCT. In other words, under this condition, the port investment in BCT contributes more to improving social welfare.
4.3. The Impact of Perishable Goods Loss Rate
Proposition 7.
We find that under model SBCT, there exists a range for the shipping company’s investment cost coefficient within which the profits of the port and the shipping company, as well as market demand, are positively correlated with the perishable goods loss rate. This occurs when , then , where .
We can obtain that when , an increase in the perishable goods loss rate leads to higher profits for both the port and the shipping company, as well as an increase in market demand. This may be due to two factors: firstly, the investment in BCT enhances the customs clearance efficiency of the maritime supply chain, and the shippers’ preference for this improved customs clearance efficiency drives the growth in demand; secondly, a higher perishable goods loss rate increases claim costs, while a smaller investment through BCT enhances the customs clearance efficiency, thereby reducing these costs. Therefore, the increase in demand and the reduction in claim cost together enhance the profits of both the port and the shipping company. This also indicates that the shipping company needs to control its BCT investment costs to effectively convert BCT investment into profit growth while also allowing the port to benefit simultaneously.
5. Numerical Analysis
In order to verify the above propositions and equilibrium results, we conduct a numerical analysis. We show the optimal investment strategies for the port and the shipping company, as well as the impact of the BCT investment cost coefficient on the reefer freight rate, demand, investment level, and profits of the port and the shipping company under models PBCT and SBCT with different perishable goods loss rate. Considering the values of parameters used in the existing literature [21,39,41] and ensuring that , this guarantees the existence of equilibrium solutions across all models; the parameter settings and their significance are presented in Table 3.
Table 3.
Parameters’ setting and significance.
5.1. Optimal Strategy Analysis
Based on Proposition 4a,b in Section 4.2.1, we can obtain the optimal BCT investment strategies for the port and shipping company under different perishable goods loss rates, as shown in Figure 5 and Table 4.
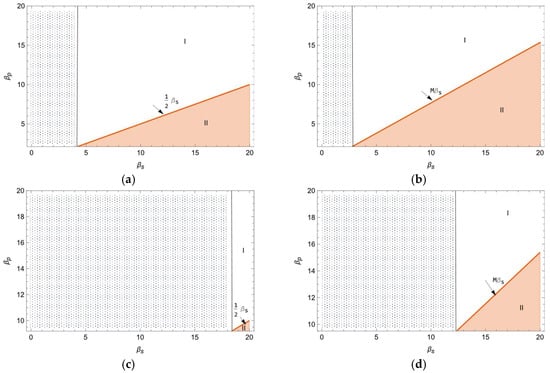
Figure 5.
The optimal strategy for BCT investment in the port and shipping company under different perishable goods loss rates. (a) the profits of the port under Model PBCT and Model SBCT (). (b) the profits of the shipping company under Model PBCT and Model SBCT (). (c) the profits of the port under Model PBCT and Model SBCT (). (d) the profits of the shipping company under Model PBCT and Model SBCT ().
Table 4.
Optimal strategy for port and shipping company.
Figure 5 highlights how the port’s profit and the shipping company’s profit change across different relationships between and under different perishable goods loss rates. In Figure 5, the grey area represents the infeasible region. The diagonal line represents the critical boundary for the port and the shipping company to choose their BCT investment strategies. The area above this diagonal line, that is, the white area, indicates that the profit of the port or the shipping company under model SBCT is more favourable. The area below this diagonal line, that is, the orange area, indicates that the profit of the port or the shipping company under model PBCT is more favourable.
When the port is the decision subject, as shown in Figure 5a,c, regionⅠrepresents , then the optimal strategy of the port is that the shipping company invests in BCT, which can obtain higher profits, while region II represents , and the optimal strategy of the port is that the port itself invests in BCT. When the shipping company is the decision subject, as shown in Figure 5b,d, region I represents , then the optimal strategy of the shipping company is to invest in BCT by itself; region II represents , then the optimal strategy of the shipping company is the port investing in BCT. In addition, further analysing the effect of the perishable goods loss rate on the optimal strategy, comparing Figure 5a,c, the proportion of region II decreases with an increasing perishable goods loss rate. This means that the port’s optimal strategy prefers the shipping company to invest in BCT with the perishable goods loss rate increasing. Figure 5b,d also show the same trend. This may be due to the fact that as the perishable goods loss rate increases, shipping companies are able to improve the customs clearance efficiency by investing in BCT, reduce the quantity loss of perishable goods in the process of waiting for customs clearance, and ultimately increase the port profits and their own profits; the profit advantage of shipping companies investing in BCT becomes more significant when the perishable goods loss rate is high.
5.2. The Impact of the BCT Investment Cost Coefficient with Different Perishable Goods Loss Rates
Figure 6 and Figure 7 demonstrate the effect of the BCT investment cost coefficient on market demand and the profit of the port and shipping company under model PBCT and SBCT with different perishable goods loss rates. The dashed portion in these figures indicates that the BCT investment cost coefficient does not reach profitable solutions.
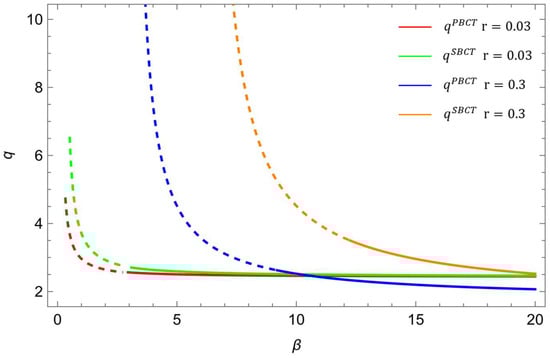
Figure 6.
The impact of BCT investment on demand in models PBCT and SBCT under different perishable goods loss rates.
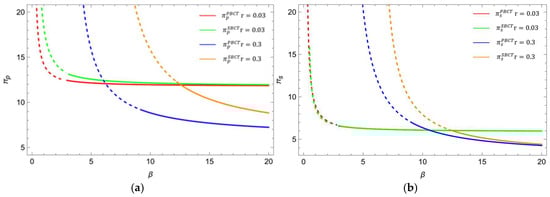
Figure 7.
The impact of the BCT investment cost coefficient on profits of the port and shipping company in models PBCT and SBCT under different perishable goods loss rates. (a) The impact of the BCT investment cost coefficient on profits of the port in models PBCT and SBCT under different perishable goods loss rates. (b) The impact of the BCT investment cost coefficient on profits of the shipping company in models PBCT and SBCT under different perishable goods loss rates.
Figure 6 illustrates the impact of the BCT investment cost coefficient on market demand in the PBCT and SBCT models at different perishable loss rates.
Figure 6 shows a general decreasing trend in market demand as the BCT investment cost coefficient increases in both models. However, Figure 7 also highlights a specific range of the BCT investment cost coefficient where market demand is higher at a higher perishable loss rate than at a lower loss rate, which also supports Proposition 7. This suggests that despite the high cost associated with BCT investment, its value may be enhanced in the case of high perishable loss scenarios, as it can significantly mitigate such loss.
Furthermore, when the BCT investment cost coefficient is the same for both the port and the shipping company, the latter achieves a higher market demand than the port. This observation could reflect greater market reliance on the shipping company’s adoption of BCT or more substantial operational efficiency gains that the shipping company can realise through BCT.
Figure 7a,b demonstrate the changes in profits of the port and shipping company with the BCT investment cost coefficient under different models.
In general, both the port and shipping company profits decrease as the BCT investment cost coefficient increases. Furthermore, the profits of both the port and shipping company exhibit a slower decrease when the perishable goods loss rate is low. This suggests that as the perishable goods loss rate increases, the returns on BCT investment may diminish. Therefore, the port and shipping company need to consider adopting a more integrated strategy, such as the use of more advanced cold chain technology, to maintain the freshness of their goods.
6. Conclusions
In the context of the maritime supply chain with perishable goods, BCT minimizes customs clearance waiting times and document processing delays, thereby reducing perishable goods loss and associated claim costs, which can be substantial [16]. However, investment in BCT platforms can be costly, and the benefits vary significantly between different stakeholders, influenced by the conflicting interests within the maritime supply chain. This diversity of benefits underlines the complexity of integrating BCT into the maritime supply chain.
By constructing three models and analysing the outcomes, we contribute to enrich the existing research on BCT in the maritime supply chain with perishable goods loss.
We summarize our conclusions as follows:
- Investing in BCT is beneficial for both the port and the shipping company when the BCT investment cost coefficient exceeds a threshold. Furthermore, the shipping company faces a higher BCT investment cost threshold than the port. Both actors have higher profits and higher market demand compared to the scenario without BCT investment. Furthermore, our results indicate that BCT investment enhances both social welfare and consumer surplus when accounting for perishable goods loss.
- The optimal investment decisions for the port and the shipping company are influenced by the BCT investment cost coefficient and perishable goods loss rate. When the port’s BCT investment cost coefficient exceeds that of the shipping company, the shipping company’s BCT investment yields higher market demand, profits, consumer surplus, and social welfare. As the perishable goods loss rate increases, both the port and the shipping company are more inclined towards the shipping company investing in BCT, with a more pronounced profit advantage for the shipping company when the loss rate is high.
- Within a specific range of the shipping company’s BCT investment cost coefficient, a higher perishable goods loss rate boosts profits and demand for both the port and the shipping company.
6.1. Managerial Implications
In addition, this study provides managerial insights into BCT investment in the maritime supply chain under perishable goods loss and offers strategies for the port and shipping company.
Firstly, BCT investment is only economically feasible if the investment cost coefficient exceeds a threshold. This suggests that the current operational efficiency and management capacity of the port and the shipping company should be assessed before investing in BCT. A strong management base and high customs clearance efficiency are key to sustaining benefits and improvements. On the other hand, the shipping company needs stronger management to benefit from BCT investment, so strengthening management capacity becomes a necessary prior condition.
Secondly, a higher perishable goods loss rate may lead the shipping company to be more inclined to use BCT to minimize loss. This highlights the proactive nature of the shipping company in adopting new technologies to manage the risk of perishable goods loss. Ports, on the other hand, may be more conservative in their technology investments, reflecting differences in technology adoption strategies between different types of companies. This finding also supports the view that shipping companies are early adopters and fast followers in BCT adoption [18].
Lastly, as the perishable goods loss rate increases, relying solely on higher BCT investment to maintain profitability may lead to diminishing returns. This is because the marginal benefits of BCT investment in reducing perishable goods loss may not always be sufficient to offset the increasing investment costs. Therefore, the port and the shipping company need to consider more integrated strategies, such as introducing more advanced cold chain technologies to maintain perishable goods freshness and reduce loss.
6.2. Practical Implications
Firstly, both the port and shipping company must comprehensively evaluate their operational efficiency, financial resources, and technological capabilities to ensure that BCT investments yield substantial benefits rather than impose additional financial burdens. For the port, direct investment in BCT may not be fully effective if management efficiency and customs clearance processes are not yet optimized. Thus, the port should first enhance its operational efficiency and management practices before considering BCT investment. For the shipping company, due to the higher investment threshold for BCT, ensuring financial sustainability and technological readiness is crucial. Alternatively, shipping companies may establish pilot projects or adopt a phased BCT investment strategy to effectively mitigate the risks associated with high initial investment costs.
Secondly, our research finds that the optimal investment strategy for the port and the shipping company depends on the perishable goods loss rate. When the perishable goods loss rate is relatively low, the port should assess whether investing in BCT is financially viable, while the shipping company must evaluate whether independent BCT investment or reliance on port-operated BCT infrastructure is more cost-effective. When the perishable goods loss rate is relatively high, the shipping company—particularly those operating high-value, high-risk perishable cargo routes—should prioritize BCT investment. These shipping companies should proactively integrate BCT into their operational processes to minimize losses caused by transport delays and quality degradation.
Finally, investing in BCT, whether by the port or the shipping company, leads to higher profits and greater market demand. At the same time, consumer surplus and social welfare also increase. This shows that adopting BCT is necessary for the maritime supply chain and society, and efforts should be made to actively enhance the development environment of the maritime supply chain and maximize overall profitability, both from the perspective of individual business growth and for the sustainable development of the entire industry and society. Moreover, governments and industry leaders should introduce supportive policies and incentives to accelerate BCT adoption, such as encouraging the port and the shipping company to establish data-sharing agreements to improve supply chain transparency and efficiency, as well as providing government subsidies to offset initial BCT investment costs and facilitate BCT integration into the maritime industry.
6.3. Limitations and Implications for Future Research
Although we provide some interesting results, there are several limitations to this paper. Firstly, we only study the structure of the maritime supply chain composed of one port and one shipping company, which does not take into account the existence of the situation of competition between shipping companies or ports. In the future, research can be conducted from a competitive perspective to provide a more in-depth analysis. Secondly, this study does not explicitly account for the profit allocation between the port and the shipping company in the model. Future research could explore profit allocation mechanisms and contract coordination strategies between the port and the shipping company.
Supplementary Materials
The following supporting information can be downloaded at https://www.mdpi.com/article/10.3390/systems13030196/s1, Proof S1: Proof of lemmas and propositions.
Author Contributions
Conceptualization, L.L. and J.Z.; methodology, L.L. and J.Z.; writing—original draft preparation, L.L.; writing—review and editing, L.L. and J.Z.; visualization, L.L.; funding acquisition, L.L. All authors have read and agreed to the published version of the manuscript.
Funding
The authors acknowledge the support provided by the Fundamental Research Funds for the Central Universities of Beijing Jiaotong University: Grant No. 2022YJS047.
Data Availability Statement
All relevant data are within the paper.
Conflicts of Interest
The authors declare no conflicts of interest.
Abbreviations
The following abbreviations are used in this manuscript:
| BCT | Blockchain technology |
| GSBN | Global Shipping Business Network |
References
- Company, T.B.R. Perishable Goods Sea Transportation Global Market Report 2024. Available online: https://www.researchandmarkets.com/reports/5792937/perishable-goods-sea-transportation-global (accessed on 10 October 2024).
- Gray, P. Reefer Market Update and Challenges Ahead. Available online: https://www.internationalblueberry.org/assets/uploads/2023/07/Philip-Gray_Reefer-market-update-and-challenges-ahead.pdf (accessed on 10 October 2024).
- Bridgett, L. Container Shipping Situation Worsens Due to Congestion, Delays, and Empty Containers. Available online: https://www.spglobal.com/commodityinsights/en/ci/research-analysis/container-shipping-situation-worsens-due-to-congestion-delays.html (accessed on 10 October 2024).
- Club, B.P.I. Refrigerated Container Cargo Claims. Available online: https://britanniapandi.com/2022/04/refrigerated-container-cargo-claims/ (accessed on 10 October 2024).
- Pu, S.; Lam, J.S.L. Blockchain adoptions in the maritime industry: A conceptual framework. Marit. Policy Manag. 2020, 48, 777–794. [Google Scholar] [CrossRef]
- Wang, J.; Liu, J.; Wang, F.; Yue, X. Blockchain technology for port logistics capability: Exclusive or sharing. Transp. Res. Part B Methodol. 2021, 149, 347–392. [Google Scholar] [CrossRef]
- Yang, C.-S. Maritime shipping digitalization: Blockchain-based technology applications, future improvements, and intention to use. Transp. Res. Part E Logist. Transp. Rev. 2019, 131, 108–117. [Google Scholar] [CrossRef]
- Sengupta, T.; Narayanamurthy, G.; Moser, R.; Pereira, V.; Bhattacharjee, D. Disruptive Technologies for Achieving Supply Chain Resilience in COVID-19 Era: An Implementation Case Study of Satellite Imagery and Blockchain Technologies in Fish Supply Chain. Inf. Syst. Front. 2022, 24, 1107–1123. [Google Scholar] [CrossRef]
- Jo, J.; Yi, S.; Lee, E.-K. Including the reefer chain into genuine beef cold chain architecture based on blockchain technology. J. Clean. Prod. 2022, 363, 132646. [Google Scholar] [CrossRef]
- (UNCTAD) UNCoTaD. Review of Maritime Transport 2023. Available online: https://unctad.org/publication/review-maritime-transport-2023 (accessed on 10 October 2024).
- Gopalakrishnan, P.K.; Hall, J.; Behdad, S. Cost analysis and optimization of Blockchain-based solid waste management traceability system. Waste Manag. 2021, 120, 594–607. [Google Scholar] [CrossRef]
- Tiwari, S.; Sharma, P.; Choi, T.-M.; Lim, A. Blockchain and third-party logistics for global supply chain operations: Stakeholders’ perspectives and decision roadmap. Transp. Res. Part E Logist. Transp. Rev. 2023, 170, 103012. [Google Scholar] [CrossRef]
- Bruno, M. Maersk Scraps TradeLens. Available online: https://www.porttechnology.org/news/maersk-scraps-tradelens/ (accessed on 10 October 2024).
- Cole, R.; Stevenson, M.; Aitken, J. Blockchain technology: Implications for operations and supply chain management. Supply Chain. Manag. Int. J. 2019, 24, 469–483. [Google Scholar] [CrossRef]
- Liu, J.; Zhang, H.; Zhen, L. Blockchain technology in maritime supply chains: Applications, architecture and challenges. Int. J. Prod. Res. 2021, 61, 3547–3563. [Google Scholar] [CrossRef]
- Pu, S.; Lam, J.S.L. Greenhouse gas impact of digitalizing shipping documents: Blockchain vs. centralized systems. Transp. Res. Part D Transp. Environ. 2021, 97, 102942. [Google Scholar] [CrossRef]
- Zhao, H.; Liu, J.; Hu, X. Servitization with blockchain in the maritime supply chain. Ocean Coast. Manag. 2022, 225, 106195. [Google Scholar] [CrossRef]
- Nguyen, S.; Chen, P.S.-L.; Du, Y. Blockchain adoption in container shipping: An empirical study on barriers, approaches, and recommendations. Mar. Policy 2023, 155, 105724. [Google Scholar] [CrossRef]
- Balci, G.; Surucu-Balci, E. Blockchain adoption in the maritime supply chain: Examining barriers and salient stakeholders in containerized international trade. Transp. Res. Part E Logist. Transp. Rev. 2021, 156, 102539. [Google Scholar] [CrossRef]
- Zhong, H.; Zhang, F.; Gu, Y. A Stackelberg game based two-stage framework to make decisions of freight rate for container shipping lines in the emerging blockchain-based market. Transp. Res. Part E Logist. Transp. Rev. 2021, 149, 102303. [Google Scholar] [CrossRef]
- Wang, H.; Wang, C.; Li, M.; Xie, Y. Blockchain technology investment strategy for shipping companies under competition. Ocean Coast. Manag. 2023, 243, 106696. [Google Scholar] [CrossRef]
- Pu, S.; Lam, J.S.L. A game theoretic approach of optimal adoption time of blockchain: A case of ship operators. Comput. Ind. Eng. 2022, 169, 108219. [Google Scholar] [CrossRef]
- Blackburn, J.; Scudder, G. Supply Chain Strategies for Perishable Products: The Case of Fresh Produce. Prod. Oper. Manag. 2009, 18, 129–137. [Google Scholar] [CrossRef]
- Amorim, P.; Meyr, H.; Almeder, C.; Almada-Lobo, B. Managing perishability in production-distribution planning: A discussion and review. Flex. Serv. Manuf. J. 2011, 25, 389–413. [Google Scholar] [CrossRef]
- Vu, N.; Ghadge, A.; Bourlakis, M. Blockchain adoption in food supply chains: A review and implementation framework. Prod. Plan. Control 2021, 34, 506–523. [Google Scholar] [CrossRef]
- Hosseini Bamakan, S.M.; Ghasemzadeh Moghaddam, S.; Dehghan Manshadi, S. Blockchain-enabled pharmaceutical cold chain: Applications, key challenges, and future trends. J. Clean. Prod. 2021, 302, 127021. [Google Scholar] [CrossRef]
- Sunny, J.; Undralla, N.; Madhusudanan Pillai, V. Supply chain transparency through blockchain-based traceability: An overview with demonstration. Comput. Ind. Eng. 2020, 150, 106895. [Google Scholar] [CrossRef]
- Mangla, S.K.; Kazancoglu, Y.; Ekinci, E.; Liu, M.; Özbiltekin, M.; Sezer, M.D. Using system dynamics to analyze the societal impacts of blockchain technology in milk supply chainsrefer. Transp. Res. Part E Logist. Transp. Rev. 2021, 149, 102289. [Google Scholar] [CrossRef]
- Sander, F.; Semeijn, J.; Mahr, D. The acceptance of blockchain technology in meat traceability and transparency. Br. Food J. 2018, 120, 2066–2079. [Google Scholar] [CrossRef]
- Liu, J.; Zhao, H.; Lyu, Y.; Yue, X. The provision strategy of blockchain service under the supply chain with downstream competition. Ann. Oper. Res. 2022, 327, 375–400. [Google Scholar] [CrossRef]
- Li, Y.; Tan, C.; Ip, W.H.; Wu, C.H. Dynamic blockchain adoption for freshness-keeping in the fresh agricultural product supply chain. Expert. Syst. Appl. 2023, 217, 119494. [Google Scholar] [CrossRef]
- Zhang, X.; Li, Z.; Li, G. Impacts of blockchain-based digital transition on cold supply chains with a third-party logistics service provider. Transp. Res. Part E Logist. Transp. Rev. 2023, 170, 103014. [Google Scholar] [CrossRef]
- Wu, X.-Y.; Fan, Z.-P.; Cao, B.-B. An analysis of strategies for adopting blockchain technology in the fresh product supply chain. Int. J. Prod. Res. 2021, 61, 3717–3734. [Google Scholar] [CrossRef]
- Zhang, X.; Lam, J.S.L.; Iris, Ç. Cold chain shipping mode choice with environmental and financial perspectives. Transp. Res. Part D Transp. Environ. 2020, 87, 102537. [Google Scholar] [CrossRef]
- Castelein, B.; Geerlings, H.; Van Duin, R. The reefer container market and academic research: A review study. J. Clean. Prod. 2020, 256, 120654. [Google Scholar] [CrossRef]
- Kaptan, M.; Bayazit, O. Fuzzy Bayesian network analysis of the factors causing food losses in reefer containers. J. Food Process Eng. 2023, 46, e14358. [Google Scholar] [CrossRef]
- Shen, L.; Yang, Q.; Hou, Y.; Lin, J. Research on information sharing incentive mechanism of China’s port cold chain logistics enterprises based on blockchain. Ocean Coast. Manag. 2022, 225, 106229. [Google Scholar] [CrossRef]
- United Nations Commission On International Trade Law. United Nations Convention on Contracts for the International Carriage of Goods Wholly or Partly by Sea (New York, 2008) (the “Rotterdam Rules”). Available online: https://uncitral.un.org/en/texts/transportgoods/conventions/rotterdam_rules (accessed on 10 October 2024).
- Yu, Y.; Xiao, T. Pricing and cold-chain service level decisions in a fresh agri-products supply chain with logistics outsourcing. Comput. Ind. Eng. 2017, 111, 56–66. [Google Scholar] [CrossRef]
- Choi, T.-M. Blockchain-technology-supported platforms for diamond authentication and certification in luxury supply chains. Transp. Res. Part E Logist. Transp. Rev. 2019, 128, 17–29. [Google Scholar] [CrossRef]
- Liu, J.; Wang, J. Carrier alliance incentive analysis and coordination in a maritime transport chain based on service competition. Transp. Res. Part E Logist. Transp. Rev. 2019, 128, 333–355. [Google Scholar] [CrossRef]
Disclaimer/Publisher’s Note: The statements, opinions and data contained in all publications are solely those of the individual author(s) and contributor(s) and not of MDPI and/or the editor(s). MDPI and/or the editor(s) disclaim responsibility for any injury to people or property resulting from any ideas, methods, instructions or products referred to in the content. |
© 2025 by the authors. Licensee MDPI, Basel, Switzerland. This article is an open access article distributed under the terms and conditions of the Creative Commons Attribution (CC BY) license (https://creativecommons.org/licenses/by/4.0/).