Abstract
Within globalization, the significance of urban innovation cooperation has become increasingly evident. However, urban innovation cooperation faces challenges due to various factors—social, economic, and spatial—making it difficult for traditional methods to uncover the intricate nonlinear relationships among them. Consequently, this research concentrates on cities within the Yangtze River Delta region, employing an explainable machine learning model that integrates eXtreme Gradient Boosting (XGBoost), SHapley Additive exPlanations (SHAP), and Partial Dependence Plots (PDPs) to investigate the nonlinear and interactive effects of multidimensional factors impacting urban innovation cooperation. The findings indicate that XGBoost outperforms LR, SVR, RF, and GBDT in terms of accuracy and effectiveness. Key results are summarized as follows: (1) Urban innovation cooperation exhibits different phased characteristics. (2) There exist nonlinear and interactive effects between urban innovation cooperation and multidimensional factors, among them, the Scientific and Technological dimension contributes the most (30.59%) and has the most significant positive promoting effect in the later stage after surpassing a certain threshold. In the Social and Economic dimension (23.61%), the number of Internet Users (IU) contributes the most individually. The Physical Space dimension (20.46%) generally exhibits mutation points during the early stages of urban development, with overall relationships predominantly characterized by nonlinear positive trends. (3) Through the application of PDP, it is further determined that IU has a positive synergistic effect with per capita Foreign Direct Investment (FDI), public library collections per capita (LC), and city night light data (NPP), while exhibiting a negative antagonistic effect with Average Annual Wage of Staff (AAS) and number of Enterprises above Designated Size in Industry (EDS). (4) For cities at different developmental stages, tailored development proposals should be formulated based on single-factor contribution and multifactor interaction effects. These insights enhance our understanding of urban innovation cooperation and elucidate the nonlinear and interactive effects of multidimensional influencing factors.
1. Introduction
The concept of urban innovation cooperation originated from Joseph Schumpeter’s innovation theory in 1911, which laid the foundation for subsequent related concepts [1]. In the accelerated process of globalization, innovation cooperation accelerates the dissemination of knowledge and technology, and cities usually rely on cooperation to achieve steady economic development [2,3]. Many cities have acknowledged the importance of innovation cooperation in improving regional competitiveness [4]. According to [5,6], strengthening urban innovation cooperation can foster the coordinated advancement of adjacent regions and further contribute to the integrated and sustainable development of the national economy. However, some cities face challenges related to inefficient resource allocation and inequitable input distribution in innovation cooperation [7,8,9,10], resulting in negative effects such as low cooperation efficiency and impeded regional integration.
Urban innovation cooperation has always been a topic discussed by many scholars. Some scholars focus on the evolution process of innovation cooperation network structure at the macro scale and propose the evolution from single center to multi-center [11,12,13,14]. Some scholars use different regression analysis methods to explore the influencing factors of urban innovation cooperation, and propose that human resource, R&D investment, geographical location, and other factors will affect urban innovation cooperation [15,16,17,18,19]. However, they focus more on the influence of different factors in a single dimension and lack a comprehensive framework integrating multidimensional factors. Research on urban innovation cooperation has made some progress, but most of them focus on the macro national and provincial levels, while research from the perspective of cities is relatively scarce. Nevertheless, as an important subject of innovation cooperation, only by conducting research at the urban level can strategies be formulated in line with local circumstances, thereby averting a one-size-fits-all development approach [20]. At the same time, recent relevant literature shows a trend of expanding research boundaries in order to consider the interaction of social, economic, human, and other multidimensional factors, and to strive to include more impact factors into the consideration, so as to fit the complex and changeable realistic situation. However, the current mainstream research still relies on traditional linear regression methods to analyze the relationship between influencing factors and urban innovation cooperation, and these traditional methods are slightly insufficient to reveal the nonlinear relationship among diverse influencing factors in reality [21,22]. In particular, they will encounter problems such as multicollinearity in the complex situations where multiple factors are intermingled, resulting in biased results [23]. This cannot accurately reflect the true nonlinear correlation among the multidimensional factors of urban cooperation, making it difficult to find the dynamic mechanism behind urban innovation cooperation [24].
The problem this research aims to solve is as follows: existing studies on urban innovation cooperation are fragmented and lack a unified and comprehensive research framework for multidimensional factors. Most research at the city level is scarce, and the traditional linear regression methods cannot effectively handle the complex nonlinear relationships among influencing factors. There is a lack of in-depth exploration of the contribution degrees and interaction effects of various factors, which makes it difficult to provide targeted and practical policy recommendations for promoting urban innovation cooperation.
Due to the inherent limitations of linear regression in dealing with the complex nonlinear relationship of multidimensional factors, it is difficult to accurately analyze the influencing factors of urban innovation cooperation [25]. Machine learning models, with their strong data processing capability and model building advantages, become a solution [26]. XGBoost can predict results and clarify the relationship between factors and results [21] to provide necessary support for the final decision [22,27]. Despite this, machine learning models remain criticized by some scholars due to their unique “black box effect” [28,29]. To overcome this, SHapley Additive exPlanations (SHAP) [30] was developed to precisely quantify the importance of each factor in the prediction, further opening the “black box” and giving users insight into the model’s internal mechanisms [31]. While XGBoost and SHAP have been extensively applied in finance and medicine, their use in urban innovation cooperation remains nascent. Research in this field usually uses simple machine learning models to predict technological development trends [32], but insufficient attention has been devoted to analyzing the influence mechanism and clarifying the correlation [33].
The contributions of this research are as follows: Firstly, this research constructs a comprehensive research framework that integrates four dimensions (Physical Space, Human Resource, Scientific and Technological, and Social and Economic), which is more comprehensive than previous single-dimension or limited-factor research. Secondly, by using an explainable machine learning model integrating XGBoost, SHAP, and PDP, it can effectively analyze the nonlinear and interactive effects of multidimensional factors on urban innovation cooperation, breaking through the limitations of traditional linear regression methods. This enables a more accurate understanding of the complex relationships among factors and urban innovation cooperation. Thirdly, based on the research results, this study provides targeted development proposals for cities at different developmental stages, which has strong practical guiding significance for promoting urban innovation cooperation and regional integration development. These aspects are different from existing research and can fill the gaps in related fields.
In order to make up for the gaps in related fields, this research uses invention patent data [17,34] to explore the influencing factors of innovation cooperation in 41 cities in the Yangtze River Delta region based on an explainable machine learning model [33]. The research aims to address the following three key issues related to urban innovation cooperation: 1. Understand the spatial evolution of urban innovation cooperation in the Yangtze River Delta region and the development of different cities. 2. Construct a research framework that can integrate multidimensional factors and identify and judge the nonlinear and interactive effects of multidimensional factors affecting urban innovation cooperation. 3. Propose strategies focusing on the input of key factors for cities with different development conditions, in order to achieve substantial returns, foster urban innovation cooperation, and advance regional integration development, according to the contribution degree and interaction effect of factors.
To resolve the identified challenges, this research utilizes co-inventor patent data from the China National Intellectual Property Administration (CNIPA) to investigate the structure and evolution of innovation cooperation among cities in the Yangtze River Delta from 2011 to 2021. Building upon the existing literature, this research identifies four dimensions and selects twenty-four influencing factors, employing the XGBoost model to analyze these factors. Furthermore, we systematically interpret the nonlinear and interactive effects of each factor using SHAP and PDP [35], highlighting the contribution trends of key factors affecting urban innovation cooperation. We also provide a quantitative explanation of the contribution thresholds for each factor, offering practical insights to enhance urban innovation cooperation capabilities and promote regional integration development.
The structure of this article is outlined as follows: Section 2 offers a literature review that synthesizes existing research. Section 3 elaborates on the data sources and research methodologies in detail. Section 4 presents the research findings, covering the spatial evolution of urban innovation cooperation and the identification of the nonlinear and interactive effects of multidimensional factors. Section 5 engages in an in-depth discussion of the research results, highlighting their theoretical and practical implications. Finally, Section 6 recapitulates the key findings of this research, while also exploring its limitations as well as potential avenues for future applications.
2. Literature Review
2.1. Urban Innovation Cooperation
Urban innovation cooperation has been increasingly acknowledged as a vital factor in enhancing regional innovation capabilities [1], while patent data are often regarded as the most direct and effective metric for assessing urban innovation cooperation [2]. Existing research can be generally classified into two categories. The first category primarily articulates the significance of urban innovation cooperation from a theoretical perspective, drawing on insights from new economic geography to elucidate its spatial spillover effects [3]. For instance, [4] examines the Beijing–Tianjin–Hebei region, which shares similarities with the Yangtze River Delta, and elucidates the mechanisms and impacts of innovation cooperation from various angles. Meanwhile, [5] clarifies the definition of urban innovation and underscores its importance, while [6,7] highlight that urban innovation cooperation can enhance the innovative capacity of surrounding underdeveloped areas and facilitate rapid urban development. Moreover, [8] connects urban innovation cooperation with multidimensional proximity, establishing a foundation for further empirical investigations. The second category of empirical analysis explores the impact of various factors on urban innovation cooperation. For instance, [9] analyzes Chinese cities from 2003 to 2016 and proposes that urban innovation cooperation enhances both local and external innovation efficiency. Additionally, [10] reveals a nonlinear connection between urban hierarchical structures and the agglomeration of innovation. They note that the influence significantly intensifies after reaching a certain threshold, although the specific value remains unspecified. Ref. [11] suggests that promoting the high-quality development of urban innovation cooperation can be achieved by reducing the waste of human resources. Conversely, some scholars approach the topic from a negative effects perspective; for example, [12] argues that geographical proximity can, in certain cases, hinder innovation cooperation. Reference [13] posits that the relationship between innovation and economic growth is intricate and lacks definitive causality, asserting that public capital investment does not directly influence innovation cooperation. Ref. [14] contends that innovation cooperation may yield negative effects, arguing that collaborating parties should maintain proximity to the “optimal cooperation point” based on their unique characteristics.
2.2. Multidimensional Influencing Factors
In the research of urban innovation cooperation, numerous investigations have been carried out to explore the multidimensional factors influencing urban innovation cooperation from various perspectives. Early research, such as [15], integrates internal factors (e.g., GDP, R&D investment, and educational attainment) with external factors (e.g., geographical accessibility and foreign investment) to assess their impact on urban innovation cooperation. Subsequently, ref. [16] focuses on the mechanisms through which human capital and population dynamics affect urban innovation cooperation. Building on existing studies, ref. [17] further expands the analysis by incorporating additional factors such as per capita income, road mileage, and labor force, thereby enhancing the comprehensiveness of factor selection. Refs. [18,19] utilize quantitative methods to demonstrate the significant role of governmental institutions in urban innovation cooperation. Ref. [20] constructs a structural equation model (SEM) based on nine factors, including policy support and innovation climate, to conduct empirical analysis. It utilizes a more systematic and scientific approach to dissect the complex relationships among multiple factors. Research on urban agglomerations has also been gradually emerging in recent years. Ref. [21] applies the gravity model to build a cooperation innovation network among cities within the Yangtze River Delta, establishing a regional innovation community from perspectives such as spatial coordination and resource sharing. Ref. [22] proposes that urban agglomerations serve as a crucial mechanism for regional innovation cooperation, utilizing factors like population density and industrial structure to assess their impact on the development of urban clusters. They emphasize the significance of urban agglomerations in urban innovation cooperation and the contribution of related factors. Ref. [23] employs gravitational models, social network analysis, and spatial econometric models. They conclude that factors such as capital and labor are beneficial for urban innovation cooperation. Accordingly, government institutions play a significant role in urban innovation cooperation. In this research, government—related factors are mainly presented in the Social and Economic dimension, such as Government General Public Service Expenditure per capita (GPSE). Government policies can directly affect resource allocation, talent attraction, and industrial development, all of which are closely related to urban innovation cooperation. For example, policies promoting infrastructure construction can improve the Physical Space dimension factors like per capita urban road length (URL) and urban park area (UPA), creating a better environment for innovation cooperation. Moreover, government policies can also influence the Human Resource dimension. Policies related to education and training can increase the number of skilled workers and innovative talents, affecting factors such as the number of college students (CS) and the Average Annual Wage of Staff (AAS). Additionally, in the Scientific and Technological dimension, government policies can have a direct impact on factors such as education expenditure per capita (EE) and per capita Scientific and Technological Expenditure of the government (STE). These policies can support scientific research projects and promote the transformation of scientific and technological achievements, providing a solid foundation for urban innovation cooperation.
2.3. Explainable Machine Learning Model
For the purpose of probing into the influence mechanisms existing between urban innovation cooperation and diverse factors, traditional quantitative models such as social network analysis [24,25], negative binomial regression models [26], the super efficiency DEA model [27], fixed-effects negative binomial, and ordinary least squares analyses [28] have been widely employed. However, as research progresses, it has become increasingly apparent that the multidimensional factors affecting urban innovation cooperation do not solely exhibit linear relationships; rather, they may experience abrupt shifts upon reaching certain thresholds [10]. In this context, how is the level of urban innovation cooperation influenced by the complex interrelations of these multidimensional factors? Is the degree of influence of these factors consistent across different types of urban innovation cooperations? How can we accurately allocate resources to enhance the level of urban innovation cooperation? To effectively address these questions, this research introduces a novel technique with robust explanatory power that considers multiple factors using explainable machine learning models [29]. Among these, XGBoost, based on the principles of gradient boosting, aggregates multiple base learners (decision trees) to accommodate a vast array of factors and compute the optimal solution within the model [30]. Meanwhile, SHAP, grounded in the Shapley value from game theory [31], aims to assign an importance score to each factor, clarifying the rationale behind specific model predictions [32]. This is crucial for gaining a deeper understanding of the mechanisms by which multidimensional factors influence urban innovation cooperation. Meanwhile, Partial Dependence Plots (PDPs) illustrate the marginal effects of individual or multiple factors on machine learning outcomes [33], effectively presenting the impact trends of factors on urban innovation cooperation. The integration of machine learning with Shapley values and PDP was demonstrated to be effective in exploring nonlinear and interactive effects [34,35,36].
3. Data and Methods
3.1. Research Area
The Yangtze River Delta region, situated in the eastern coastal area of China, was classified as one of the world’s leading megacities by [37]. This research utilizes the “Outline of the Integrated Regional Development of the Yangtze River Delta” issued by China in 2019, to define the urban agglomeration of the Yangtze River Delta as comprising 13 prefecture-level cities in Jiangsu Province, 11 in Zhejiang Province, 16 in Anhui Province, and the municipality of Shanghai (Figure 1). As of 2023, the Yangtze River Delta region had achieved a total economic output exceeding CNY 30 trillion, ranking it second among global urban agglomerations. The resident population has reached 238 million, boasting a population density of over 660 individuals per square km, significantly surpassing the metropolitan scale proposed by [37], which stipulated a minimum of 25 million inhabitants and a density of 250 individuals per square km.

Figure 1.
Study area: Geographical location and urban spatial distribution of Yangtze River Delta.
The reasons for selecting this region are as follows: Firstly, since 2010, the volume and growth of patent applications and their growth in the Yangtze River Delta urban agglomeration have significantly outpaced those in comparable regions such as the Pearl River Delta and the Beijing–Tianjin–Hebei urban clusters. Secondly, the central government has launched a succession of policies to encourage innovative cooperation within the Yangtze River Delta [38]. Key policies, including the “Outline of the Integrated Development of the Yangtze River Delta” and the “Three-year action plan (2018–2020) for Yangtze River Delta’s integrated development”, have fostered closer connections among cities in the region and have invigorated urban innovation cooperation activities [18]. Furthermore, the Yangtze River Delta features a diverse array of cities in different scales: Shanghai, an international metropolis with global influence; Hangzhou, a large city demonstrating strong comprehensive strength and radiating effects across multiple sectors; Nantong, a medium-sized industrial city with a significant role in manufacturing; and Huangshan, a small tourism city focused on developing the tertiary sector, among others. This diversity is conducive to examining the differences in innovative cooperation among cities of varying scales [39].
3.2. Data Source
Patent data have been extensively utilized by scholars who conduct research on innovation across various geographical scales [40,41,42,43]. It is contended by many researchers that although patent data might not be a flawless indicator of technological cooperation and output, it still ranks among the most direct, effective, and quantifiable metrics [2,44,45]. The number of patents is often considered an ideal quantitative indicator of a city’s innovative capacities [46].
In China, patents are categorized into design patents, utility models, and invention patents. Among these, invention patents, due to their high technological content, maximum innovation value, and robust core competitiveness, are considered the optimal indicator for assessing regional innovation capacity. Therefore, this research focuses solely on invention patents. The period from a patent application to its grant in China can extend up to three years. To ensure data integrity and usability, the research focuses on the period from 2011 to 2021. Patent data are sourced from the public patent application information provided by the China National Intellectual Property Administration (CNIPA). Initially, invention patent applications from non-unique applicants within the Yangtze River Delta region are extracted. Subsequently, the address information of other applicants’ companies or institutions is independently retrieved. Ultimately, collaborative patent data between cities are calculated based on all address information of the invention patent applicants [25,47]. Multidimensional influencing factors are derived from the panel data spanning 41 cities between 2011 and 2021. The primary data sources are “CHINA CITY STATISTICAL YEARBOOK (2011–2021)” (http://www.stats.gov.cn/ (accessed on 10 November 2024)) and relevant annual reports from government statistic bureaus (Jiangsu Provincial Statistics Bureau: http://tj.jiangsu.gov.cn/ (accessed on 12 November 2024); Zhejiang Provincial Statistics Bureau: http://tjj.zj.gov.cn/ (accessed on 11 November 2024); Anhui Provincial Statistics Bureau: http://tjj.ah.gov.cn/, (accessed on 11 November 2024), etc.). The night light data are obtained through secondary processing of DMSP-OLS-like data [23,48]. The raw data for the glow-in-the-dark data are available on the National Oceanic and Atmospheric Administration’s (NOAA) data platform (https://www.noaa.gov/ (accessed on 15 November 2024)).
3.3. The Selection of Multidimensional Influencing Factors
Prior research has predominantly concentrated on construction investment [49,50,51,52], human resource [16,22,53], R&D expenditure [15,20], among other factors. However, most of these studies have discussed these factors from limited perspectives, neglecting to incorporate them into a holistic systems approach [54]. Furthermore, constrained by traditional models, the number of selected factors has remained limited. In this study, the selection of 24 factors across four different dimensions is based on a comprehensive consideration of multiple aspects (Table 1).

Table 1.
Description of multidimensional influencing factors.
First and foremost, the aim was to achieve as comprehensive as possible coverage of potential factors influencing urban innovation cooperation. Each dimension represents a crucial aspect of urban development. For instance, in the Physical Space dimension, these selected factors capture the spatial and infrastructural elements that underpin innovation cooperation, ensuring a comprehensive understanding of the physical environment impacts. By including multiple factors within each dimension, we could obtain a more complete view of the influencing mechanisms. At the same time, we needed to strike a balance between comprehensiveness and manageability. Selecting too few factors may overlook important variables, leading to an incomplete understanding, whereas incorporating too many can make the analysis overly complex and difficult to interpret. Thus, 24 factors were chosen to cover a wide range of factors without overburdening the analysis process.
Secondly, the reliability and accessibility of data played a vital role in factor selection. All the selected factors are sourced from reliable data platforms such as the “CHINA CITY STATISTICAL YEARBOOK (2011—2021)” and relevant annual reports from government statistic bureaus. This ensures the accuracy and credibility of the research. For instance, FDI was selected partly because of its data accessibility and its potential for accurate measurement.
Finally, the selection of factors was firmly grounded in theoretical and empirical justification. A comprehensive review of the existing literature was conducted. Previous studies have identified various factors related to human resources, technological investment, and economic structure as influencing urban innovation cooperation. By incorporating these factors into our research, we built on the existing knowledge base. Although there was no specific empirical testing solely for the number of factors, the 24 factors selected were used in related research to varying extents, and their relevance to urban innovation cooperation has been widely recognized. For example, the Average Annual Wage of Staff (AAS) and Urban Population Density (UPD) were shown in previous studies to have significant impacts on urban innovation cooperation [16,55]. This theoretical and empirical support validates our choice of factors.
In conclusion, the selection of 24 factors across four dimensions was carefully considered and methodologically justified. It was based on comprehensive coverage of influencing factors, data reliability, theoretical and empirical justification, and model performance and interpretability. These indicators were carefully chosen to ensure a thorough and reliable analysis of the factors influencing urban innovation cooperation.
3.3.1. Physical Space Dimension
The Physical Space dimension provides support in terms of space, communication, market access, and transportation, serving as a crucial foundation for the smooth conduct of urban innovation cooperation [15]. Among these, CLA, UR, URL, HM, and UPA serve as the fundamental spatial guarantees for the initiation of innovation cooperation [56,57]. Meanwhile, urban nighttime light data [58,59] visually represent the city’s economic vitality and population concentration among other diverse information [60].
3.3.2. Human Resource Dimension
The Human Resource dimension constitutes the core driving force of urban innovation cooperation [17,61]. It focuses on human resource issues, selecting key factors as follows: UPD reflects the abundance of human resources [55]; CT and CS are significant entities in innovative activities; AAS indicates labor costs and talent attraction; and PF reflects the vitality of urban population movement and the closeness of regional economic ties [16].
3.3.3. Scientific and Technological Dimension
The Scientific and Technological dimension draws on the research approaches of [20,62], focusing on the selection of factors related to technological innovation as follows: EE and STE directly reflect the city’s investment in technological innovation, which is capable of cultivating innovative talent and supporting scientific research projects; and EDS and IL reflect the city’s industrial base, which provides application scenarios and industrial support for technological innovation [63].
3.3.4. Social and Economic Dimension
The Social and Economic dimension facilitates urban innovation cooperation by optimizing industrial structures, driving consumer markets, and fostering a socio-cultural atmosphere [64,65]. Governmental institutions play a pivotal role through policies such as fiscal incentives (e.g., R&D subsidies, tax breaks), infrastructure investments, and intellectual property protection. Among these, FDI and GPSE focus more on policy and institutional aspects [19]; IS, PIV, SIV, and TIV serve as key indicators reflecting the industrial structure; LC represents the urban cultural atmosphere [20]; and IU is used to indicate the level of urban informatization [66].
3.4. Methodology
3.4.1. Urban Innovation Cooperation Intensity Network
The urban innovation cooperation intensity network is constructed using the co-invention patent data. The nodes of the network represent different cities, and the size of each node reflects the total number of external cooperation of that city. This characteristic is used as the input of the dependent variable for the next-stage XGBoost model. At the same time, different development stages are characterized by classifying the sizes of the network nodes.
The joint application information of urban invention patents is sourced from the China National Intellectual Property Administration (CNIPA). Each cooperative patent is analyzed in terms of temporal and geographical dimensions, with the application address pinpointed to specific cities. Patents involving intra-city cooperation or single applicants are excluded. Subsequently, patents with multiple application cities are disaggregated. For instance, if the cities of the applicant institutions include ABC, the cooperation can be divided into three links: AB, BC, and AC. Finally, all cooperative sub-networks are merged to construct the Yangtze River Delta urban innovation cooperation network. In this network, cities participating in the cooperative application of invention patents are represented as nodes, their cooperative relationships as edges, and the number of cooperative patent applications as the weight of the edges. Given that the cooperative relationship between two cities is undirected, if City A and City B jointly apply for 100 invention patents, the weight of the edge from A to B is 100, and similarly, the weight from B to A is also 100. This establishes a weighted undirected Yangtze River Delta urban innovation cooperation network. Furthermore, the natural break method of GIS is applied to grade each edge, thereby investigating the trends in the intensity of urban innovation cooperation in the Yangtze River Delta region.
3.4.2. eXtreme Gradient Boosting (XGBoost)
We selected the XGBoost model to predict the contribution of various factors to urban innovation cooperation. XGBoost, a key component of our methodology, outperforms traditional regression-based methods in multiple aspects. Traditional linear regression methods, which are commonly used in previous studies, struggle to handle complex nonlinear relationships among multiple factors. They often assume a linear relationship between variables, which is unrealistic in the context of urban innovation cooperation where numerous factors interact in intricate ways. In contrast, XGBoost is a gradient-boosting method that can accommodate a vast array of factors [67]. It incorporates second-order Taylor expansion of the loss function, regularization terms, parallel computing, and missing value handling. These features enable it to compute the optimal solution for the model and prevent overfitting, even when dealing with high-dimensional and complex data [68,69].
where D is the training dataset, is the input feature vector, and is the corresponding label.
where is the first base learner (decision tree).
The urban innovation cooperation intensity network serves as a crucial data source for the XGBoost model. The data extracted from this network, such as the number of cooperative patents between cities, which reflect the intensity of innovation cooperation among cities, is integrated with other multidimensional influencing factors data (including those from the Physical Space, Human Resource, Scientific and Technological, and Social and Economic dimensions). This combined data are then input into the XGBoost model. The XGBoost model, in turn, processes these data to predict the contribution of various factors to urban innovation cooperation and to explore the complex nonlinear and interactive relationships among them. In other words, the urban innovation cooperation intensity network provides the real-world observational data on urban innovation cooperation, while the XGBoost model offers a powerful analytical tool to uncover the underlying mechanisms and influential factors behind this cooperation based on the multidimensional influencing factors.
3.4.3. SHapley Additive exPlanations and Partial Dependence Plots
We opted for SHAP and PDP to address the black box issue in machine learning models, elucidating the nonlinear and interactive effects of each influencing factor on urban innovation cooperation. SHAP [31] and PDP further enhance the analysis by addressing the limitations of traditional methods in interpreting model results. Traditional quantitative models often lack the ability to precisely quantify the importance of each factor and visualize the marginal effects of variables on the outcome. SHAP, based on the Shapley value from game theory, provides a unified, model-agnostic approach to explain the reasons behind individual predictions [70]. It can calculate the importance scores for each factor, helping us understand which factors have a greater impact on urban innovation cooperation and the direction of their impact (positive or negative). This is a significant improvement over traditional methods, which may only provide a general sense of variable influence without a clear quantification. PDP, on the other hand, can intuitively visualize the marginal effects of one or two variables on the outcomes. It quantifies and visualizes the contribution of each factor in the model, revealing the marginal effects of independent variables. This is crucial for understanding the nonlinear relationships between factors and urban innovation cooperation.
where represents the contribution of a factor , represents the set of factors, is a subset of that does not contain factors, represents the number of elements of subset , and and respectively represent the predicted value results with or without factors. represents the marginal contribution of each factor to the prediction outcomes. Each factor’s contribution to the model output is assigned based on its marginal contribution compared to other factors measured in the SHAP value.
Additionally, Partial Dependence Plots (PDPs) can intuitively visualize the marginal effects of one or two variables on the outcomes [71]. They quantify and visualize the contribution of each factor in the model [72], revealing the marginal effects of independent variables, further addressing the black box issue in machine learning models [34,73,74].
where is the number of samples in the dataset, and represent two variables, and represents the partial dependence functions of and
PDP is used in conjunction with the XGBoost–SHAP analysis. After obtaining the factor importance from SHAP, PDP is used to explore the nonlinear relationships between key factors and urban innovation cooperation. For example, it shows how the number of Internet Users (IU) or the number of Enterprises above Designated Size in Industry (EDS) affects urban innovation cooperation as their values change.
3.4.4. Architecture of Explainable Machine Learning Model
These three techniques are integrated in a unified scenario rather than being tested independently. First, XGBoost processes the combined data from the urban innovation cooperation intensity network and other multidimensional influencing factors. It predicts the contribution of various factors to urban innovation cooperation and captures the complex relationships among them.
Then, SHAP is applied to the output of the XGBoost model. By calculating the Shapley values for the selected factors, SHAP ranks the importance of each factor. It also shows how the contribution of each factor changes nonlinearly. This helps in understanding which factors are more influential and how they contribute to the model’s predictions, thus providing insights into the internal mechanisms of the XGBoost model.
Finally, PDP is used in conjunction with the XGBoost–SHAP analysis. After obtaining the factor importance from SHAP, PDP is employed to explore the nonlinear relationships between key factors and urban innovation cooperation. PDP can also visualize the interaction effects between two factors, which further enhances our understanding of the complex relationships in the model.
In summary, this integrated architecture allows for a comprehensive analysis of the nonlinear and interactive effects of multidimensional factors on urban innovation cooperation. XGBoost serves as the foundation for predicting factor contributions and capturing complex relationships. SHAP interprets the XGBoost model, providing a deeper understanding of factor importance and nonlinear contributions. PDP then visualizes these relationships, making it easier for researchers and policymakers to grasp the complex interactions and make informed decisions.
4. Result
4.1. The Evolution of the Innovation Cooperation Intensity Network
Figure 2 presents the variation in the number of co-invented patents for cities in the Yangtze River Delta from 2011 to 2021. The total number of co-patents shows an overall upward trend with minor fluctuations: it rose from 1488 in 2011 to 11,142 in 2021, with an average growth rate of approximately 27.5% and an overall growth rate of 648.8%. Specifically, from 2011 to 2014, the number gradually increased from 1488 to 3342, and then climbed to 7449 by 2017, during which the maximum growth rate was approximately 49.3%. Between 2017 and 2018, the number dropped to 6112, and from 2018 to 2021, it quickly rebounded to 11,142, with the maximum growth rate of about 21.1%. Combining Figure 2 and Figure 3, the following results can be obtained.
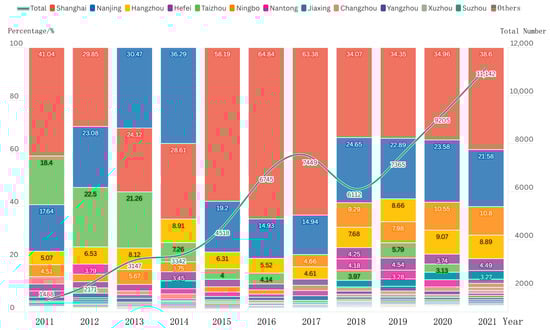
Figure 2.
The line chart shows the change in the total number of cooperative patents in the Yangtze River Delta region over time, and the bar chart shows the change in the ratio of the number of cooperative patents in the total number of cities in the Yangtze River Delta region over time. A certain color represents a fixed city, which cannot be distinguished by other colors because most cities are relatively small.
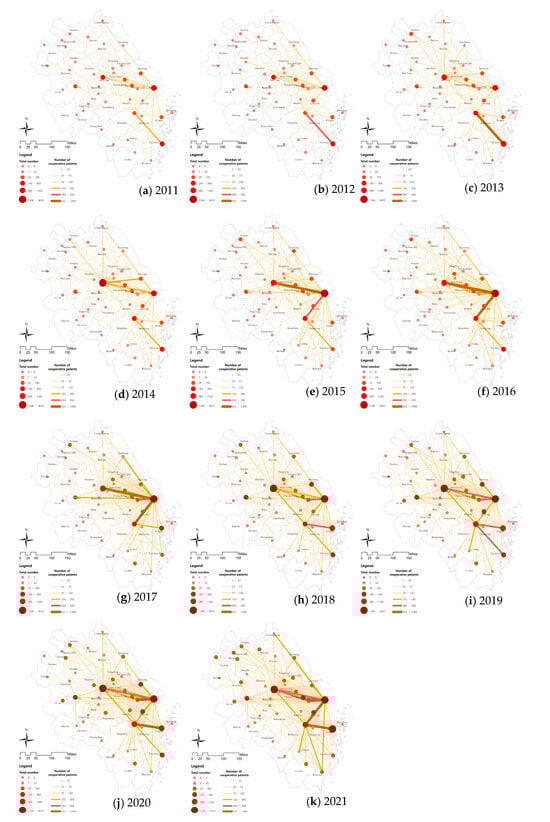
Figure 3.
Yangtze River Delta regional urban innovation cooperation intensity network (2011–2021 change trend chart).
The density of the urban innovation cooperation intensity network has increased. In 2011, the innovation cooperation network was relatively sparse. The number of cooperations between most cities was only 0–6, showing an overall low level and hardly forming a network. By 2021, it was evident that almost all cities were interconnected through the patent cooperation network. The significant increase in the number of dark lines indicated that the cooperation frequency between more and more cities reached 153–292 or even higher, forming a complex and dense innovation cooperation network.
The number of core cities has increased, and their radiation ranges have expanded. Initially, there were only four core nodes, namely Shanghai, Nanjing, Hangzhou, and Taizhou, presenting a “Z”-shaped radiation range, which had extremely limited driving effects on the innovation cooperation of more distant cities. Over time, the number of core nodes has been continuously increasing. Cities such as Ningbo, Hefei, and Nantong have emerged as new core nodes and have become increasingly important in the region. Meanwhile, the radiation ranges of the original core cities, Shanghai, Nanjing, and Hangzhou, have expanded significantly, establishing cooperative relationships with more cities and gradually forming a “diamond”-shaped radiation range. In contrast, cities with slower growth, such as Taizhou, have become regressive cities.
The geographical distribution of innovation cooperation has become more balanced. Initially, there was an obvious imbalance in the geographical distribution of innovation cooperation, mainly concentrated in the eastern and southern parts of the Yangtze River Delta, while there was less cooperation in other regions. Currently, although the focus of the innovation cooperation network remains in the southeast, the participation degree of innovation cooperation in other regions has increased significantly, narrowing the regional differences and making the innovation cooperation within the region more extensive and balanced.
4.2. Factor Screening and Comparison of Multiple Models
Distinct factors with excessively high correlations tend to undermine the accuracy of the model and are commonly regarded as redundant factors. [75,76]. The Pearson correlation coefficient, which serves as a statistical indicator for gauging the correlation between two variables, can be utilized for the preliminary screening of factors [77,78]. Figure 4 illustrates the correlation degrees among the 24 factors. Notably, the correlations among CT, CS, AAS, GPSE, EE, and NCU exceed 0.8. Based on practical implications, further judgment was made to eliminate three values, namely CT, CS, and EE. Additionally, to further validate the rationality of the factors selected for the model, the variance inflation factor (VIF) was employed to exclude the independent variables that might possess collinearity [79]. As shown in Table 2, the VIF values of the remaining 21 factors were all less than 8, indicating the absence of multicollinearity in the model [80].
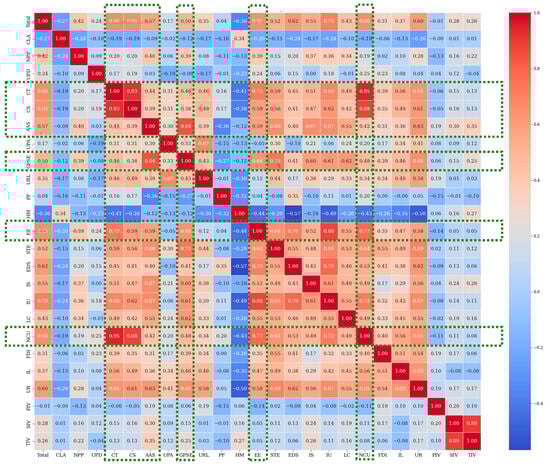
Figure 4.
Pearson correlation heat map of influencing factors.
Table 2.
VIF result of factors.
To demonstrate the suitability of XGBoost for this research, several other models were selected for comparison. Specifically, the linear regression model (LR), Support Vector Regression model (SVR), Random Forest model (RF), Gradient Boosting Decision Tree model (GBDT), and eXtreme Gradient Boosting model (XGBoost) were employed to predict the correlations of the driving factors for the urban innovation cooperation mentioned above. To mitigate potential biases, a 5-fold cross-validation was initially adopted to optimize the hyperparameters, aiming to minimize the impact of noisy learning and enhance the generalization ability of the model [80].
As mentioned earlier, XGBoost can compute the optimal solution for the model and prevent overfitting, even when dealing with high-dimensional and complex data [34]. In contrast, LR assumes a linear relationship between variables, which is often unrealistic in the context of urban innovation cooperation, where numerous factors interact in complex and nonlinear ways. SVR requires the careful selection of kernel functions, is sensitive to the scale of input features, and necessitates extensive preprocessing [81]. Although RF can handle nonlinear relationships to some extent, it may overfit if the number of trees is not properly adjusted [82]. XGBoost and GBDT share similarities in the boosting method, but XGBoost introduces several improvements [83]. XGBoost implements parallel processing to accelerate the calculation speed and can handle missing values internally, making it more efficient in practice. In comparison with the other several algorithms (Table 3), the XGBoost model exhibited the lowest MSE (0.633), RMSE (0.790), and MAE (0.638), as well as the highest R2 (0.855), suggesting that the XGBoost model demonstrated greater scientific validity in exploring this dataset [84]. Meanwhile, the integration of XGBoost and SHAP yielded favorable results and could effectively serve the subsequent prediction of factor contribution degrees [74].
Table 3.
Multiple model comparison results.
4.3. The Relative Importance of Factors Explained by SHAP
To more precisely assess the influence degrees of multidimensional factors, this research quantitatively ranked the contribution degrees of factors using the SHAP model. Figure 5 depicts the relative importance of the 21 factors to urban innovation cooperation. In Figure 5a, the horizontal axis represents the SHAP values. A positive value indicates that the factor has a positive impact on the result, and the larger the value, the greater the contribution of the factor, and vice versa. A color tending toward red suggests a relatively high value of the factor, while a color tending toward blue implies a relatively low value. The degree of dispersion of the points illustrates the variation in the factor’s influence across different samples, serving as an indicator for judging the stability of the factor’s contribution degree. For instance, the distribution of AAS is quite evident: the high-value parts are all greater than 0, and the low-value parts are all less than 0. This suggests that an increase in the average wage of urban employees leads to a sharp rise in the number of urban innovation cooperation cases. Conversely, when the average wage drops, the number of urban innovation cooperation cases will decrease significantly. This result also aligns with our subjective perception.
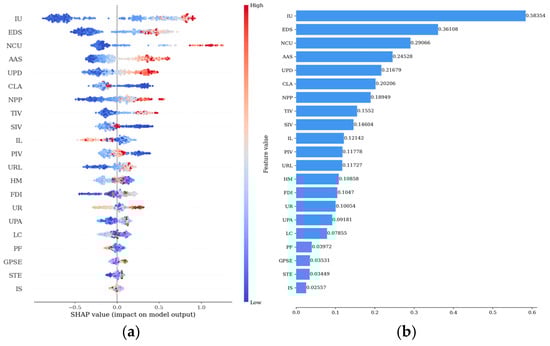
Figure 5.
(a) SHAP value (impact on model output). (b) SHAP value (mean SHAP value). Summary of relative importance of factors and local interpretations.
As shown in Figure 5b, IU exhibits the highest relative importance (0.58354). With the development of information technology, the Internet has significantly facilitated the frequency of long-distance communication, gradually diminishing the negative impacts caused by geographical distance. This conclusion is highly consistent with the relevant research findings of numerous scholars [85,86]. Following IU, EDS and NCU rank next in relative importance. Since enterprises and universities are the two most critical entities in innovation, their activity levels have a substantial impact on urban innovation cooperation. Factors such as AAS, UPD, and CLA also have relatively strong influencing relationships with urban innovation cooperation. Notably, STE and GPSE exhibit relatively weak relative importance. This result is particularly interesting as it challenges the conventional mindset that “the more investment, the more output [87,88]”.
Based on the proportion of the average SHAP value, the four dimensions are ranked as follows: the Scientific and Technological dimension (30.59%), Human Resource dimension (25.34%), Social and Economic dimension (23.61%), and Physical Space dimension (20.46%). The Scientific and Technological dimension can expand fields and break boundaries, making significant contributions to urban innovation cooperation. Among them, EDS and NCU rank second and third, respectively, in relative importance, while STE has a negligible impact. The Human Resource dimension directly provides impetus for urban innovation cooperation. Among them, AAS and UPD rank fourth and fifth, respectively. The Social and Economic dimension can offer opportunities for the collision of diverse cultures, thus stimulating the vitality of innovation cooperation. Among them, IU ranks first. Interestingly, several other factors within this dimension, such as FDI, GPSE, LC, and IS, do not have a significant impact on urban innovation cooperation. A more reasonable explanation is that the overall economic levels and degrees of opening-up of cities in the Yangtze River Delta region are relatively high, and the differences among FDI, GPSE, LC, and IS are far smaller than those of IU. Consequently, the contribution degrees of these four factors are lower than that of IU.
4.4. The Nonlinear Effect Based on PDP
4.4.1. The Nonlinear Effect of the Scientific and Technological Dimension
As shown in Figure 6, the Scientific and Technological dimension generally plays a positive promoting role in urban innovation cooperation. Among them, EDS, NCU, and STE all exhibit a significant positive promotion when exceeding a certain value, while IL undergoes repeated fluctuations and finally tends to remain stable. For NCU, when the number of universities is less than 11, it has a U-shaped negative impact. After reaching 11, NCU begins to show a positive linear promoting relationship. This indicates that when there are fewer universities, there may be limited knowledge resources and insufficient basic levels. As the number increases, the transformation of scientific research achievements and talent cultivation in universities play a positive promoting role in urban innovation cooperation [89]. As the value of EDS increases, the SHAP values generally show a trend of gradually rising from negative to positive and then stabilizing, roughly following a logarithmic function. The explanation is that when the number of enterprises is small, it may suggest to some extent that most enterprises in the region are at the two ends of the industrial chain, lacking in innovation. Only when the number of enterprises continues to grow can the industrial chain be completed, promoting the emergence of innovation cooperation. STE is roughly the same as EDS. The difference lies in that STE finally tends to grow at a constant rate, indicating that the role of government research expenditures will become limited after reaching a certain level [90]. The impact of the IL is relatively complex. When it is small initially, it has a negative impact. As it increases, it first rises to a positive peak, then drops to negative values, and finally tends to be 0. It shows an overall polynomial function relationship, which is consistent with the research of [91].
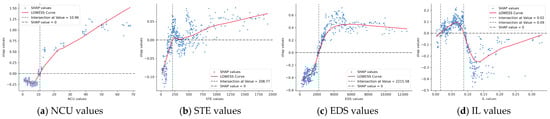
Figure 6.
The nonlinear effect of the Scientific and Technological dimension.
4.4.2. The Nonlinear Effect of the Human Resource Dimension
The Human Resource dimension shows an overall trend similar to a logarithmic function in relation to urban innovation cooperation (Figure 7). Both AAS and the UPD witness a gradual increase in SHAP values along with the growth of their respective numerical values, while the growth rate slows down. At the same time, when the value of both factors exceeds a certain threshold, they will change rapidly, which greatly improves the contribution to urban innovation cooperation. However, the passenger flow factor (PF) has a relatively low concentration degree, generally showing a transition from positive promotion to negative inhibition as the value increases. To explain this phenomenon, we can consider it from the perspective of brain drain. A large number of personnel flows, to some extent, indicates a severe brain drain, which in turn leads to a decline in urban innovation cooperation [92,93].
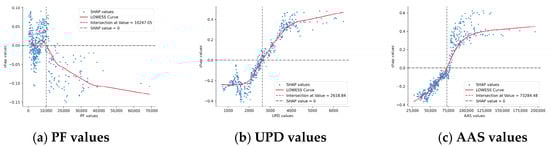
Figure 7.
The nonlinear effect of the Human Resource dimension.
4.4.3. The Nonlinear Effect of the Social and Economic Dimension
The impact of the Social and Economic dimension on urban innovation cooperation is complex and can be roughly divided into the following three categories (Figure 8). The first category consists of IU, TIV, and IS. As the values increase, the overall effect shifts from negative to positive and continues to grow. The second category shows an inverted-U quadratic function relationship, which is presented by GPSE, PIV, SIV, and FDI. Finally, it is worth mentioning LC. Based on the degree of scatter point aggregation, its trend is supposed to be similar to that of the second category, showing an inverted-U quadratic function relationship of decreasing first and then increasing. However, due to the limited sample size, its fitting curve eventually turns negative as the value increases. Based on relevant literature, this sample is considered incidental [94,95]. Therefore, it is determined that the LC factor should have a rapidly growing positive effect after the per capita number of books exceeds 2.29.
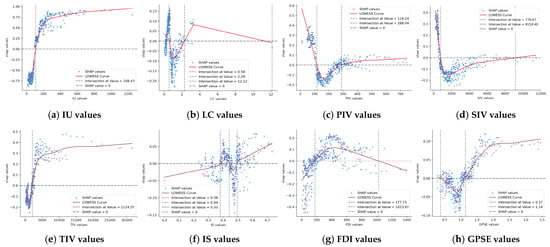
Figure 8.
The nonlinear effect of the Social and Economic dimension.
4.4.4. The Nonlinear Effect of the Physical Space Dimension
The nonlinear effect between the Physical Space dimension and urban innovation cooperation is presented (Figure 9). Among them, as the values of NPP, URL, and UPA increase, they all shift from having a negative impact on urban innovation cooperation to a positive one after exceeding certain thresholds (NPP: 11.98; URL: 2.26; UPA: 1.72). HM and UR exhibit an inverted-U-shaped quadratic function relationship. As their values increase, they both change from having a positive impact on urban innovation cooperation to a negative one and then back to a positive impact. For CLA, when its value increases to 0.24, it rapidly drops from a positive value to a negative one. This is consistent with the conclusion put forward by [96,97] that excessive urban expansion may lead to a dispersion of resources, which is unfavorable for innovation cooperation.
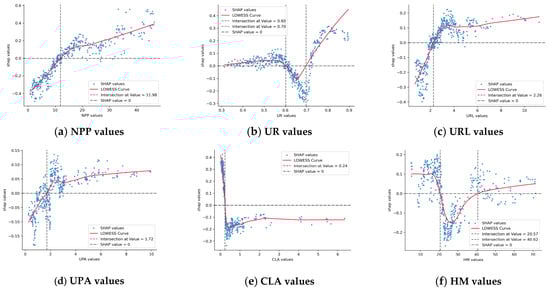
Figure 9.
The nonlinear effect of the Physical Space dimension.
4.5. Interaction Effect of Multidimensional Influencing Factors
The interaction effect of multidimensional influencing factors can offer valuable insights into how to significantly promote urban innovation cooperation. To gain a more comprehensive understanding of the interactive effects among the Scientific and Technological, Human Resource, Social and Economic, and Physical Space dimensions, this research employs the SHAP feature interaction analysis [98,99]. As shown in Figure 10a, all factors are first paired to form 210 pairs of features. Subsequently, the SHAP interaction values for each pair are calculated, and the pairs of features with significant interactions are selected for detailed interpretation. In this research, 10 pairs of features are selected, which account for the top 5% in terms of the absolute value of interaction (with interaction values greater than 0.0048) (Figure 10b).
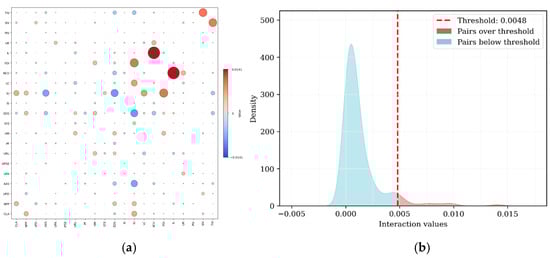
Figure 10.
(a) Interaction matrix diagram. (b) Density distribution. Interaction effect of factors.
Among these 10 pairs of factors, the average SHAP factor interaction values are positive for 8 pairs. That is, the changes in these two factors contribute to urban innovation cooperation in the same direction, and their interaction further boosts this contribution. For the other two pairs, the average SHAP factor interaction values are negative. Specifically, the two factors contribute to urban innovation cooperation in opposite directions, and their interaction further weakens the contribution. Among them, the positive interaction between NCU and IL is the strongest, with an interaction value of 0.0141. Meanwhile, the negative interaction between IU and EDS is the strongest, with an interaction value of −0.0087. Figure 11 presents the changes in the interaction effects of these 10 pairs of factors, which can be roughly classified into the following types of models.
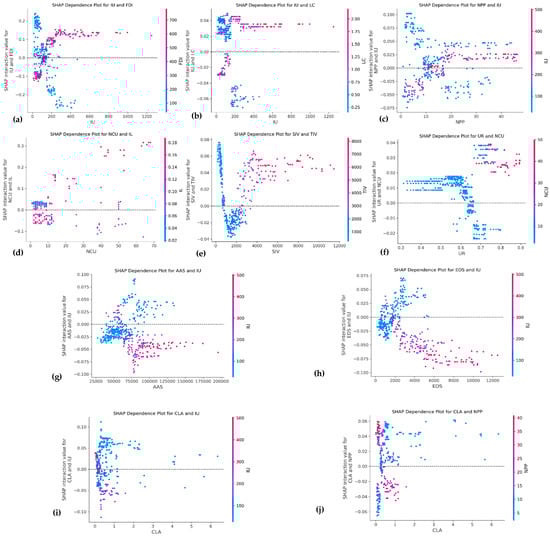
Figure 11.
The interaction effect of multidimensional influencing factors.
The first type exhibits positive average SHAP factor interaction values between the two factors. When both factors increase, a synergistic effect occurs, further promoting urban innovation cooperation. As shown in Figure 11a–f, when the values of the two factors are either small or large, their interaction values are positive. As the factors increase, the feature interaction values may turn negative initially, but will return to positive after exceeding a certain threshold, showing an overall positive synergistic effect. The underlying mechanism of this effect is that when the two factors change in a coordinated manner within a certain range, they can complement and boost each other, jointly creating favorable conditions for urban innovation cooperation. For instance, in Figure 11a, when both IU and FDI increase, their interaction effect has a positive promoting impact.
The second type has negative average SHAP factor interaction values for the two factors. When both factors increase, an antagonistic effect emerges, further inhibiting urban innovation cooperation. As can be seen from Figure 11g–h, when the values of the two factors are small or large, their feature interaction values are negative. As the factors increase, the feature interaction values may become positive initially, but will turn negative after exceeding a certain threshold, presenting an overall negative antagonistic effect. This is because when the two factors change, issues such as resource competition and functional conflicts may arise between them, leading to mutual constraints and thus having a negative impact on urban innovation cooperation. As shown in Figure 11g, when both IU and AAS increase, their interaction effect has a negative inhibitory effect.
The third type has positive average SHAP factor interaction values for the two factors, but the change trend is rather complex, with sudden changes occurring under extreme conditions. As shown in Figure 11i–j, when the values of the two factors are different (one large and one small), their interaction values are positive, showing a positive effect. However, when a certain factor exceeds a specific threshold, the feature interaction value will immediately turn negative, presenting a negative effect. Such complex changes may be due to the nonlinear effect between the factors and the different interaction mechanisms within various numerical ranges. In Figure 11i, a slight increase in one of the factors, either IU or CLA, can lead to a rapid shift in the interaction effect, which requires understanding and interpretation considering the relative importance of factors and their practical significance.
5. Discussion
5.1. Phased Characteristics of Urban Innovation Cooperation
Overall, urban innovation cooperation in the Yangtze River Delta region has been continuously strengthening (Figure 2 and Figure 3). It has evolved from a sparse innovation cooperation network at the beginning to a complex and dense one nowadays. In particular, the “Z-shaped” radiation range initially formed with Shanghai, Nanjing, Hangzhou, and Taizhou. And the core cities have gradually expanded into a “diamond-shaped” radiation range with Shanghai, Nanjing, Hangzhou, and Ningbo as the nodes. In this research, the natural breaks method was adopted to classify cities according to the number of urban innovation cooperation as follows: (1) Core cities: Cities with a cooperation quantity greater than 505. (2) Emerging cities: Cities with a cooperation quantity greater than 183 but less than or equal to 505. (3) Underdeveloped cities: Cities with a cooperation quantity less than or equal to 183. (4) Regressive cities: Cities that previously had a quantity greater than 505 but now have a quantity less than or equal to 183. Meanwhile, it is noteworthy that although the overall cooperation trend is still on the rise, the growth rate is slowing down year by year. Moreover, some cities have very limited participation in the innovation cooperation within the Yangtze River Delta region. This conclusion is also consistent with the research of [24,25]. It not only reflects the stage characteristics of urban innovation cooperation but also reveals the challenges faced by urban innovation cooperation.
5.2. The Nonlinear Effect of Multidimensional Influencing Factors
Owing to the limitations of analytical tools, previous studies were typically confined to focusing on a small number of influencing factors. In contrast, this research embarks from four dimensions, namely the “Scientific and Technological dimension”, “Human Resource dimension”, “Social and Economic dimension”, and “Physical Space dimension”, and employs an explainable machine learning model to analyze 21 factors. This approach not only breaks through the constraints on the quantity and type of factors analyzed but also delves deeper into exploring the specific contribution degrees of various factors in the conclusions. It probes into the nonlinear and interaction effects of these factors, thereby filling the gaps in relevant research.
In the dimension of Scientific and Technological, EDS and NCU are the most significant contributing factors to urban innovation cooperation. Enterprises and universities serve as crucial carriers of knowledge and technology, and the congregation of a large number of professionals can substantially promote urban innovation cooperation [100]. Notably, this research has uncovered an interesting phenomenon: when NCU exceeds 20 and EDS exceeds 4000, the positive promotion trends of the two diverge. Specifically, NCU will maintain a continuous upward growth rate in the later stage, while the growth rate of EDS will slow down as its quantity increases. This may be attributed to the fact that when the number of enterprises surpasses a certain critical value, the industrial structure tends to become homogeneous. And excessive technological similarity will impede innovation cooperation, which is the negative effect brought about by homogenization [101]. Conversely, an increase in the number of universities can render the structure of industry–university–research cooperation more rational, thereby further promoting innovation development [102]. The change trend of IL is rather complex. As IL gradually expands, its initial impact on urban innovation cooperation is positive (Figure 6d), which is consistent with the view put forward by [103] that the expansion of industrial land scale can effectively promote industrial agglomeration and innovation cooperation. However, when IL reaches the threshold of 0.09, the situation changes. It shifts from positive promotion to negative inhibition, deviating from the conclusion of [103]. Through in-depth research, it was found that in cities with a relatively large per capita industrial land scale, such as Zhenjiang, Tongling, and Maanshan, their industrial types are mostly manufacturing and processing industries with large land occupation, and such industries often have a negative impact on innovation cooperation [104]. Therefore, when IL exceeds this threshold, it will change from positive promotion to negative inhibition.
The Human Resource dimension, as the second crucial dimension influencing urban innovation cooperation, emphasizes the central role of people in driving urban innovation and economic growth [105,106]. From the perspective of talent flow (Figure 7a), moderate personnel mobility reflects the advantages of regional openness and information circulation. However, once it exceeds a specific threshold, personnel mobility will transform into brain drain, exerting an inhibitory effect on urban innovation cooperation [107]. Figure 7b,c illustrates that the contribution degrees of UPD and AAS are close, and their influence trends are similar. When the relevant factors grow beyond a certain threshold, they will quickly turn into positive promotion, but the growth rate will slow down after reaching another threshold. This phenomenon is consistent with the conclusions of [108,109], that is, lower population density and wage levels impede innovation cooperation, while appropriate increases in both can significantly promote innovation cooperation. Taking Suzhou (JS) as an example, from 2010 to 2020, the influx of a large number of high-tech enterprises attracted talents from surrounding areas, and the population density gradually increased from 1852 people per square km to 3176 people. At the same time, enterprises continuously raised salary packages to recruit talents, and the average wage increased from CNY 51,658 to CNY 126,749. During this period, the number of urban innovation cooperation projects in Suzhou increased significantly from 4 to 85, demonstrating the promoting effect of population density and wage increases on urban innovation cooperation. However, when the population density exceeded 2500 in 2019, the growth rate of innovation cooperation slowed down. It dropped from 38.89% to 25.89%, but still maintained a positive promotion trend overall, which is in line with the trend described in the previous text.
In the Social and Economic dimension, its impact on urban innovation cooperation exhibits complex diversity. Government institutions play a vital role in urban innovation cooperation. In this research, government-related factors are mainly reflected in the Social and Economic dimension, such as GPSE. Government policies and institutions can interact with other factors in multiple ways. For example, government policies can influence the distribution of resources. An increase in GPSE can provide more public services, which may enhance the attractiveness of a city to talents and enterprises. However, as our research found, before reaching a certain threshold (1.14 in this study), an increase in GPSE may also impede urban innovation cooperation. This is because under the condition of limited overall resources, more investment in public services may relatively reduce the resources available for innovation cooperation. Regarding GPSE, Figure 8h shows that its impact differs from the conclusions of traditional regression analysis. Refs. [110,111] believe that increasing investment in urban public services can significantly enhance urban innovation capabilities. However, this research has found that before reaching the threshold of 1.14, an increase in GPSE will instead impede the development of urban innovation cooperation. We speculate that under the condition of limited overall resources, an increase in urban public service expenditure will relatively reduce the resources in the innovation cooperation field, thus generating a negative effect. This speculation was verified in Bozhou, Fuyang, and Suzhou (AH). Concerning the contribution degree change in IS, ref. [112] proposed that the optimization of industrial structure can promote innovation cooperation, but they could not explain the negative impact in the 0.44–0.50 interval in Figure 8f. To address this question, we explored the samples in this interval and found that the industrial structures of cities such as Zhoushan, Zhenjiang, Taizhou (ZJ), and Chizhou are located in this interval. Most of these cities are in the stage of transformation, renovation, and upgrading from traditional industries to modern industrial structures. Although it has affected the innovation cooperation to a certain extent in that year, it still has a positive promoting effect in the long run, which does not violate the theory of [112].
The research results of the Physical Space dimension indicate that improving urban infrastructure helps create a market environment conducive to innovation, thereby positively promoting urban innovation cooperation, which is consistent with the research conclusions of [51,113]. Figure 9b,f shows different trends for UR and HM. When UR reaches 0.6–0.7, an overall negative effect emerges. We propose the following explanations. Firstly, in cities at this stage, such as Bozhou and Suzhou (AH), the internal capital competition intensifies. The improvement of the urbanization rate requires a large amount of capital to be invested in infrastructure construction and other aspects, squeezing the funds for innovation investment. Secondly, at this stage, cities may blindly replicate the industrial structures and development patterns of more developed cities to accelerate urbanization. This often leads to intense competition within the same industrial sectors, resulting in a lack of differentiation and complementarity, which hinders innovation cooperation driven by industrial synergy among cities. Finally, the relevant systems are imperfect. For example, with the rapid development of urbanization, the household registration system makes it difficult for rural-to-urban migrants to enjoy the same treatment as urban residents, which is not conducive to the in-depth development of urban innovation cooperation [114]. For example, before 2015, both Suzhou (JS) and Huzhou had problems such as the unequal distribution of educational resources and imperfect household registration systems, which to some extent affected the enthusiasm for urban innovation cooperation.
In the discussion of different phased characteristics of urban innovation cooperation, the data from the urban innovation cooperation intensity network, analyzed using XGBoost, SHAP, and PDP, provides a more in-depth understanding of the evolution of cooperation networks and the roles of different cities. When analyzing the nonlinear effects of multidimensional factors, the methodology employed in this study allows for a detailed exploration of the contribution degrees and interaction effects of various factors. For example, in the Scientific and Technological dimension, we can clearly observe the different contribution trends of EDS and NCU and understand the reasons behind them. Traditional methods, with their limited ability to handle multiple factors and nonlinear relationships, would struggle to provide such an in-depth analysis.
5.3. The Interaction Effect of Multidimensional Influencing Factors
This research further delved into the pairwise interaction effects of the driving factors for urban innovation cooperation. Analyzing these interaction effects enables an understanding of the comprehensive impacts when two or more features are combined in the outcome. Such information regarding interaction effects is crucial for comprehending the model and data [115]. In this research, the top 10 pairs of features were selected for detailed analysis, which to some extent enhanced the research in the relevant field of urban innovation cooperation. IU has the greatest single-factor contribution to urban innovation cooperation and reflects the regional informatization level. IU exhibits positive synergistic effects with FDI, LC, and NPP. That is, as IU and these factors increase, urban innovation cooperation will be promoted to a greater extent. In contrast, IU has negative antagonistic effects with AAS and EDS, meaning that as IU and these factors increase, urban innovation cooperation will be inhibited to a greater extent. This also emphasizes that in the current information age, how to improve the social economic environment and balance human resources will be the main issues faced by urban innovation cooperation [116]. In Figure 11i, when CLA remains within 0–1 and IU is within 0–100 or 400–500, a positive synergistic effect emerges, which promotes urban innovation cooperation. This phenomenon indicates that when a city is in the initial or advanced development stage, urban development and informatization development synergistically promote each other, and the driving force for urban innovation cooperation is strong [117,118]. However, when IU increases to 100–400 while CLA remains at a low level, a negative effect appears, inhibiting urban innovation cooperation.
Due to the dynamic adaptability characteristics of factor interaction effects, different factors can be preferentially invested based on the interaction effects among them to better respond to changes in the internal and external environments. Taking Nanjing as an example, after encountering the COVID-19 pandemic in 2020, NPP decreased by 9.72% compared to the previous year, and the population flow (PF) decreased by 26.89%. The Nanjing Municipal Government launched a batch of major infrastructure construction projects to create employment opportunities and drive the development of related industries to maintain the normal operation of the city. During the project implementation, the inputs of CLA, URL, and other factors were effectively increased. In that year, the newly added per capita construction land area in Nanjing reached 1500 square m, and the per capita urban road length increased by 1.226 km. As can be seen from Figure 11j, the improvement of CLA could offset the negative effects brought about by the decline of NPP, ensuring the overall effect still shows positive promotion. In fact, the total number of innovation cooperation in Nanjing in 2020 increased by about 9.98%, which was consistent with the theoretical analysis results. This fully verified the effectiveness and guiding significance of the interaction effects of multidimensional influencing factors in actual urban management decision-making.
In the discussion of interaction effects, the integrated methodology helps us understand how different factors interact to promote or inhibit urban innovation cooperation. For IU, we can identify its positive synergistic and negative antagonistic effects with other factors, which are essential for formulating effective policies. Traditional methods often lack the ability to analyze such complex interactions, leading to less informed policy recommendations.
5.4. Targeted Management Under Phased Characteristics
Generally speaking, previous studies mostly assumed that the impacts of various factors on urban innovation cooperation were monotonic or linear [34]. However, this research introduced an explainable machine learning model to reveal the complex nonlinear effects between multidimensional influencing factors and urban innovation cooperation. Especially when approaching certain thresholds, intricate interaction effects would occur among the factors. This provides a novel perspective for exploring urban innovation cooperation.
Based on the research results of this research, it was found that for core cities such as Shanghai, Nanjing, Hangzhou, and Ningbo in the urban innovation cooperation network, the Physical Space and Human Resource dimensions of these cities have surpassed the early mutation threshold points and entered the later stage of high contribution with a gentle growth rate. To significantly enhance the intensity of urban innovation cooperation, emphasis should be placed on increasing the inputs of the Scientific and Technological dimension and the Social and Economic dimension that have a large positive contribution growth rate in the later stage. For example, by appropriately increasing research funds and attaching importance to university construction to attract talents, urban competitiveness is enhanced [89]. Meanwhile, measures such as increasing the number of public books and optimizing the industrial structure should be taken to improve the social and cultural level [119], strengthen innovation cooperation capabilities, and expand the radiation range.
Secondly, for emerging cities with strong development momentum, such as Hefei, Nantong, and Jiaxing, based on the nonlinear effects of factors, it is judged that after they cross the mutation points of factors reflecting urban infrastructure construction, such as HM, URL and CLA, they should further optimize the construction of the high-level Physical Space dimension [56,57]. For example, increasing the per capita green area and enhancing the urban night vitality. At the same time, the Human Resource dimension of these cities is generally close to the mutation points, so it is also necessary to focus on optimizing human resources. For example, formulating preferential policies to improve residents’ welfare benefits, attracting innovative talents and teams, and promoting cooperation between universities and enterprises encourages them to cross the mutation points and generates significant positive feedback.
Then, for underdeveloped cities, such as Zhoushan, Zhenjiang, and Yancheng, the top priority is to vigorously promote the development of the Physical Space dimension. Since they are generally closer to the mutation points among the four dimensions, the investment intensity in infrastructure such as transportation, communication, and energy should be increased to improve the urban development environment and enhance the city’s attraction and carrying capacity. Meanwhile, considering the interaction effects between the Physical Space and Scientific and Technological dimensions, the investment in these areas should be increased to promote the occurrence of greater positive interaction effects to drive urban innovation cooperation.
Finally, regressive cities like Taizhou (ZJ) developed rapidly in the early stage but gradually lost their advantages in the later stage. In the early stage, relying on relatively good Physical Space and Social and Economic dimensions, they could cross the mutation points and achieve rapid development with relatively few input elements. However, in the later stage, due to limited input elements, the increase in resources was lower than that of cities in the initial development stage, resulting in the gradual weakening of their own advantages. Such cities should pay more attention to the interaction effects among factors to balance the inputs of multidimensional factors, focus on the inputs of factors with positive synergistic effects, and avoid negative interaction effects. For example, continuously improving and upgrading the urban informatization level, actively opening up to the outside world, integrating into a larger-scale innovation cooperation network [120], and simultaneously optimizing the unreasonable industrial structure and solving the problem of abnormal salary levels to promote urban innovation cooperation.
6. Conclusions
This research selected 41 cities in the Yangtze River Delta region as the research area and selected the period from 2011 to 2021 as the time interval. The XGBoost model was employed to predict the nonlinear effects between multidimensional influencing factors and urban innovation cooperation. Furthermore, SHAP and PDP were utilized to further analyze the contribution degrees and interaction effects of each factor, which enhanced the interpretability of the model. In comparison with LR, SVR, RF and GBDT, it was found that XGBoost exhibited superior performance in terms of R², MSE, RMSE, and MAE, demonstrating higher accuracy.
This research ascertained that a favorable scientific and technological environment is crucial for urban innovation cooperation, accounting for 30.59% of the contribution. Among them, diversified enterprises and universities are two factors with relatively high importance. Abundant human resources contribute 25.34% to urban innovation cooperation, and the average wage of employees and population density will rapidly exert a positive promoting effect when the input exceeds a certain mutation point. The social economic background, accounting for 23.61%, has a complex and diverse nonlinear effect on urban innovation cooperation. That is to say, within a certain range, the continuous input of social economic elements may have a negative inhibitory effect on urban innovation cooperation. Finally, the physical space, accounting for 20.46%, also plays a non-negligible role. Especially for cities in the initial development stage, more attention should be paid to the construction of physical space, because when the mutation point is exceeded, a small amount of input elements can yield unexpected returns. For cities of different stages, governmental institutions should adopt dynamic, context-specific strategies. For core cities, policies should prioritize scaling university–industry partnerships (NCU-EDS synergy) and optimize fiscal tools like R&D tax credits. Emerging cities need to further optimize the construction of high-level physical space (UPA, NPP, etc.) to cross the threshold of physical space, and pay attention to optimizing human resources. Underdeveloped cities should vigorously promote infrastructure development and balance GPSE distribution to avoid resource crowding out, while regressive cities need policies that enhance digital connectivity and FDI inflows.
Although this research has provided valuable suggestions for promoting urban innovation cooperation, it also had some limitations. Firstly, although the explainable machine learning model utilized in this research incorporated a sufficient number of factors, there were still deficiencies in aspects such as government policies, social background, and the impact of the pandemic, which also had important impacts on urban innovation cooperation. Moreover, this research adopted patent cooperation data, which is consistent with most scholars, to represent urban innovation cooperation, while, in fact, urban innovation cooperation also includes paper cooperation and others. Secondly, although the cities in the Yangtze River Delta cover diverse cities at different development stages, the impacts of resource constraints remain. Geopolitical factors and other challenges faced by border region cities in innovation cooperation are not reflected in the research on the Yangtze River Delta region. Therefore, future research should first enrich data sources. In addition to traditional patent data, more qualitative data and influencing factors reflecting urban innovation cooperation should be incorporated. Secondly, the research area range should be expanded as much as possible, and the sample size and research time should be increased to improve the generalization ability of the model, enhancing the credibility of the model. Lastly, future research should explore policy lag effects and intergovernmental coordination challenges in multi-city agglomerations and further propose strategic suggestions for cities at various stages according to local conditions to promote the development of urban innovation cooperation, improve regional innovation competitiveness, and drive regional integration development.
Author Contributions
Conceptualization, R.W. and X.W.; methodology, Z.Z.; software, R.W.; validation, R.W., X.W., and Z.Z.; formal analysis, R.W.; investigation, R.W.; resources, R.W. and Z.Z.; data curation, S.Z.; writing—original draft preparation, R.W. and Z.Z.; writing—review and editing, R.W. and X.W.; visualization, R.W., Z.Z., and S.Z.; supervision, K.L.; project administration, X.W.; funding acquisition, X.W. All authors have read and agreed to the published version of the manuscript.
Funding
This research was funded by the Research on the Path and Strategy of Hangzhou Development Zone in Building a Major Platform for Industrial Cooperation in the Yangtze River Delta, grant number 7501009010.
Data Availability Statement
The data used to support the findings of this research are available from the first author or the corresponding author upon request.
Conflicts of Interest
The authors declare no conflicts of interest.
References
- Fitjar, R.D.; Rodríguez-Pose, A. Firm Collaboration and Modes of Innovation in Norway. Res. Policy 2013, 42, 128–138. [Google Scholar] [CrossRef]
- Jin, P.Z.C.; Peng, C.; Song, M. Macroeconomic uncertainty, high-level innovation, and urban green development performance in China. China Econ. Rev. 2019, 55, 1–18. [Google Scholar] [CrossRef]
- Pan, X.; Chu, J.; Pan, X.; Wang, M. A comparative analysis of changes in urban innovation spatial correlation effect in China and its driving factors. Asian J. Technol. Innov. 2020, 29, 1–15. [Google Scholar] [CrossRef]
- Bao, L. The mechanism of regional collaborative innovation. J. Knowl. Econ. 2024, 15, 1–25. [Google Scholar] [CrossRef]
- Ziegler, R. Social Innovation as a Collaborative Concept. Innov.-Eur. J. Soc. Sci. Res. 2017, 30, 388–405. [Google Scholar] [CrossRef]
- Deng, J.; Chen, T.; Zhang, Y. Effect of Collaborative Innovation on High-Quality Economic Development in Beijing–Tianjin–Hebei Urban Agglomeration—An Empirical Analysis Based on the Spatial Durbin Model. Mathematics 2023, 11, 1909. [Google Scholar] [CrossRef]
- Gao, X.; Guan, J.; Rousseau, R. Mapping collaborative knowledge production in China using patent co-inventorships. Scientometrics 2011, 88, 343–362. [Google Scholar] [CrossRef]
- Mattes, J. Dimensions of Proximity and Knowledge Bases: Innovation between Spatial and Non-spatial Factors. Reg. Stud. 2012, 46, 1085–1099. [Google Scholar] [CrossRef]
- Fan, F.; Lian, H.; Wang, S. Can regional collaborative innovation improve innovation efficiency? An empirical study of Chinese cities. Growth Chang. 2020, 51, 440–463. [Google Scholar] [CrossRef]
- Fan, F.; Dai, S.; Zhang, K.; Ke, H. Innovation agglomeration and urban hierarchy: Evidence from Chinese cities. Appl. Econ. 2021, 53, 6300–6318. [Google Scholar] [CrossRef]
- Dai, H.; Liu, Y.; Li, H.; Cao, A. Depth and Width of Collaborative Innovation Networks and High-Quality Development. Sustainability 2024, 16, 5909. [Google Scholar] [CrossRef]
- Ben Letaifa, S.; Rabeau, Y. Too close to collaborate? How geographic proximity could impede entrepreneurship and innovation. J. Bus. Res. 2013, 66, 2071–2078. [Google Scholar] [CrossRef]
- Mtar, K.; Belazreg, W. Causal Nexus Between Innovation, Financial Development, and Economic Growth: The Case of OECD Countries. J. Knowl. Econ. 2020, 12, 310–341. [Google Scholar] [CrossRef]
- Li, X.; Liu, X. The impact of the collaborative innovation network embeddedness on enterprise green innovation performance. Front. Environ. Sci. 2023, 11, 1190697. [Google Scholar] [CrossRef]
- Rodríguez-Pose, A.; Crescenzi, R. Research and Development, Spillovers, Innovation Systems, and the Genesis of Regional Growth in Europe. Reg. Stud. 2008, 42, 51–67. [Google Scholar] [CrossRef]
- Faggian, A.; McCann, P. Universities, Agglomerations and Graduate Human Capital Mobility. Tijdschr. Voor Econ. En Soc. Geogr. 2009, 100, 210–223. [Google Scholar] [CrossRef]
- Crescenzi, R.; Rodríguez-Pose, A. R&D, Socio-Economic Conditions, and Regional Innovation in the U.S. Growth Change 2013, 44, 287–320. [Google Scholar] [CrossRef]
- Zeng, J.; Ning, Z.; Lassala, C.; Ribeiro-Navarrete, S. Effect of innovative-city pilot policy on industry–university–research collaborative innovation. J. Bus. Res. 2023, 162, 113867. [Google Scholar] [CrossRef]
- Huaichao, C.; Zhang, J.; Fei, Y. Has Institutional Support Promoted the Collaborative Innovation of Industry-University-Research? The Moderation Effect of Absorptive Capacity of Enterprise and the Mediation Effect of Cooperative Tightness of Industry-University-Research. Sci. Res. Manag. 2020, 41, 1–11. [Google Scholar]
- Liu, H.; Liu, Z.; Lai, Y.; Li, L. Factors Influencing Collaborative Innovation Project Performance: The Case of China. Sustainability 2021, 13, 7380. [Google Scholar] [CrossRef]
- Li, Y.; Ye, M. Evolution and Development Strategy of Collaborative Innovation Network among Cities in the Yangtze River Delta-Based on Urban Innovation Index Data. Afr. Asian Stud. 2021, 20, 291–323. [Google Scholar] [CrossRef]
- Yang, T.; Zhou, K.L.; Zhang, C. Spatiotemporal Patterns and Influencing Factors of Green Development Efficiency in China’s Urban Agglomerations. Sustain. Cities Soc. 2022, 85, 104069. [Google Scholar] [CrossRef]
- Wang, S.; Wang, J.; Wang, Y.; Wang, X. Spillover and Re-Spillover in China’s Collaborative Innovation. Int. Reg. Sci. Rev. 2022, 46, 38–68. [Google Scholar] [CrossRef]
- Yao, L.; Li, J.; Li, J. Urban Innovation and Intercity Patent Collaboration: A Network Analysis of China’s National Innovation System. Technol. Forecast. Soc. Change 2020, 160, 120185. [Google Scholar] [CrossRef]
- Barbosa, S.; Sáiz, P.; Zofío, J.L. The emergence and historical evolution of innovation networks: On the factors promoting and hampering patent collaboration in technological lagging economies. Res. Policy 2024, 53, 104990. [Google Scholar] [CrossRef]
- Tang, C.; Qiu, P.; Dou, J. The impact of borders and distance on knowledge spillovers—Evidence from cross-regional scientific and technological collaboration. Technol. Soc. 2022, 70, 102014. [Google Scholar] [CrossRef]
- Zhao, Y.; Lyu, J.; Huesig, S. The Impact of Innovative City Cooperation Network on City’s Innovation Efficiency: Evidence from China. J. Knowl. Econ. 2023, 15, 10349–10383. [Google Scholar] [CrossRef]
- Yang, Q.; Zhu, Z.; Wang, J.; Cao, C. A tale of two ties: The impact of a focal city’s direct and indirect collaboration networks on regional innovation. J. Technol. Transf. 2024, 49, 1–42. [Google Scholar] [CrossRef]
- Jiang, S.; Sweet, L.; Blougouras, G.; Brenning, A.; Li, W.; Reichstein, M.; Denzler, J.; Shangguan, W.; Yu, G.; Huang, F.; et al. How Interpretable Machine Learning Can Benefit Process Understanding in the Geosciences. Earth’s Futur. 2024, 12, e2024EF004540. [Google Scholar] [CrossRef]
- Sun, B.; Sun, T.; Jiao, P. Spatio-Temporal Segmented Traffic Flow Prediction with ANPRS Data Based on Improved XGBoost. J. Adv. Transp. 2021, 2021, 1–24. [Google Scholar] [CrossRef]
- Shapley, L. A Value for n-Person Games. In Contributions to the Theory of Games II; Kuhn, H., Tucker, A., Eds.; Princeton University Press: Princeton, NJ, USA, 1953; pp. 307–317. [Google Scholar]
- Behera, R.K.; Bala, P.K.; Rana, N.P. Creation of sustainable growth with explainable artificial intelligence: An empirical insight from consumer packaged goods retailers. J. Clean. Prod. 2023, 399, 136605. [Google Scholar] [CrossRef]
- Rui, J. Exploring the association between the settlement environment and residents’ positive sentiments in urban villages and formal settlements in Shenzhen. Sustain. Cities Soc. 2023, 98, 104851. [Google Scholar] [CrossRef]
- Liu, C.; Peng, Z.; Liu, L.; Wu, H.; Kinne, J.; Cai, M.; Li, S. XAI in geographic analysis of innovation: Evaluating proximity factors in the innovation networks of Chinese technology companies through web-based data. Appl. Geogr. 2024, 171, 103373. [Google Scholar] [CrossRef]
- Li, Z. Extracting spatial effects from machine learning model using local interpretation method: An example of SHAP and XGBoost. Comput. Environ. Urban Syst. 2022, 96, 101845. [Google Scholar] [CrossRef]
- Liu, J.; Ren, K.; Ming, T.; Qu, J.; Guo, W.; Li, H. Investigating the effects of local weather, streamflow lag, and global climate information on 1-month-ahead streamflow forecasting by using XGBoost and SHAP: Two case studies involving the contiguous USA. Acta Geophys. 2023, 71, 905–925. [Google Scholar] [CrossRef]
- Gottmann, J. Megalopolitan Systems around the World. Ekistics 1976, 41, 109–113. [Google Scholar]
- Li, Y.; Phelps, N.A. Articulating China’s Science and Technology: Knowledge Collaboration Networks Within and Beyond the Yangtze River Delta Megalopolis in China. Chin. Geogr. Sci. 2018, 28, 247–260. [Google Scholar] [CrossRef]
- Zhang, S.; Cai, J.; Wei, Y.; Yang, Q.; Li, L. Characteristics of urban network and city functions in the Yangtze River Delta Region: A multi-scale perspective. Heliyon 2024, 10, e30377. [Google Scholar] [CrossRef]
- Andersson, D.E.; Gunessee, S.; Matthiessen, C.W.; Find, S. The Geography of Chinese Science. Environ. Plan. A Econ. Space 2014, 46, 2950–2971. [Google Scholar] [CrossRef]
- Lei, X.-P.; Zhao, Z.-Y.; Zhang, X.; Chen, D.-Z.; Huang, M.-H.; Zhao, Y.-H. The inventive activities and collaboration pattern of university–industry–government in China based on patent analysis. Scientometrics 2012, 90, 231–251. [Google Scholar] [CrossRef]
- Li, Y.; Phelps, N.A. Knowledge polycentricity and the evolving Yangtze River Delta megalopolis. Reg. Stud. 2017, 51, 1035–1047. [Google Scholar] [CrossRef]
- Zoltan, J.A.; Anselin, L.; Varga, A. Patents and Innovation Counts as Measures of Regional Production of New Knowledge. Res. Policy 2002, 31, 1069–1085. [Google Scholar]
- Griliches, Z. Patent Statistics as Economic Indicators: A Survey; University of Chicago Press: Chicago, IL, USA, 1998. [Google Scholar]
- Zhang, J.; Chang, Y.; Zhang, L.; Li, D. Do technological innovations promote urban green development?—A spatial econometric analysis of 105 cities in China. J. Clean. Prod. 2018, 182, 395–403. [Google Scholar] [CrossRef]
- Li, Y.; Du, R. Polycentric urban structure and innovation: Evidence from a panel of Chinese cities. Reg. Stud. 2022, 56, 113–127. [Google Scholar] [CrossRef]
- Sun, Y.; Cao, C. Intra- and inter-regional research collaboration across organizational boundaries: Evolving patterns in China. Technol. Forecast. Soc. Chang. 2015, 96, 215–231. [Google Scholar] [CrossRef]
- Wu, Y.; Shi, K.; Chen, Z.; Liu, S.; Chang, Z. Developing Improved Time-Series DMSP-OLS-Like Data (1992–2019) in China by Integrating DMSP-OLS and SNPP-VIIRS. IEEE Trans. Geosci. Remote Sens. 2022, 60, 1–14. [Google Scholar] [CrossRef]
- Banerjee, A.V.; Duflo, E.; Qian, N. On the road: Access to transportation infrastructure and economic growth in China. J. Dev. Econ. 2020, 145, 102442. [Google Scholar] [CrossRef]
- Mohmand, Y.T.; Wang, A.; Saeed, A. The impact of transportation infrastructure on economic growth: Empirical evidence from Pakistan. Transp. Lett. 2017, 9, 63–69. [Google Scholar] [CrossRef]
- Tang, H.; Zhang, J.; Fan, F.; Wang, Z. High-speed rail, urban form, and regional innovation: A time-varying difference-in-differences approach. Technol. Anal. Strat. Manag. 2022, 36, 195–209. [Google Scholar] [CrossRef]
- Wang, L.; Acheampong, R.A.; He, S. High-speed rail network development effects on the growth and spatial dynamics of knowledge-intensive economy in major cities of China. Cities 2020, 105, 102772. [Google Scholar] [CrossRef]
- McGuirk, H.; Lenihan, H.; Hart, M. Measuring the impact of innovative human capital on small firms’ propensity to innovate. Res. Policy 2015, 44, 965–976. [Google Scholar] [CrossRef]
- Ren, Y.; Tian, Y.; Xiao, X. Spatial effects of transportation infrastructure on the development of urban agglomeration integration: Evidence from the Yangtze River Economic Belt. J. Transp. Geogr. 2022, 104, 103431. [Google Scholar] [CrossRef]
- Audretsch, D.B.; Feldman, M.P. R&D Spillovers and the Geography of Innovation and Production. Am. Econ. Rev. 1996, 86, 630–640. [Google Scholar]
- Sawicki, D. The Rise of the Creative Class: And How It’s Transforming Work, Leisure, Community and Everyday Life. Am. Plan. Association. J. Am. Plan. Assoc. 2003, 69, 90. [Google Scholar]
- Lawton, P.; Murphy, E.; Redmond, D. Residential Preferences of the ‘Creative Class’? Cities 2013, 31, 47–56. [Google Scholar] [CrossRef]
- Doll, C.N.; Muller, J.-P.; Morley, J.G. Mapping regional economic activity from night-time light satellite imagery. Ecol. Econ. 2006, 57, 75–92. [Google Scholar] [CrossRef]
- Wang, X.; Sutton, P.C.; Qi, B. Global Mapping of GDP at 1 km2 Using VIIRS Nighttime Satellite Imagery. ISPRS Int. J. Geo-Inf. 2019, 8, 580. [Google Scholar] [CrossRef]
- Sarif, N.; Roy, A.K. Measuring urban shrinkage in India using night-light data from DMSP-OLS and VIIRS-NPP satellite sensors. Cities 2024, 152, 105176. [Google Scholar] [CrossRef]
- Huallachain, B.O.; Leslie, T.F. Rethinking the regional knowledge production function. J. Econ. Geogr. 2007, 7, 737–752. [Google Scholar] [CrossRef]
- Duranton, G.; Diego, P. Micro-Foundations of Urban Agglomeration Economies. In Handbook of Regional and Urban Economics; Elsevier: Amsterdam, The Netherlands, 2004; pp. 2063–2117. [Google Scholar]
- Ezcurra, R.; Pascual, P.; Rapún, M. Regional Specialization in the European Union. Reg. Stud. 2006, 40, 601–616. [Google Scholar] [CrossRef]
- Boschma, R.; Ron, M. Constructing an Evolutionary Economic Geography. J. Econ. Geogr. 2007, 7, 537–548. [Google Scholar] [CrossRef]
- Kogler, D.F. Evolutionary Economic Geography–Theoretical and Empirical Progress. Reg. Stud. 2015, 49, 705–711. [Google Scholar] [CrossRef]
- Ding, C.; Liu, C.; Zheng, C.; Li, F. Digital Economy, Technological Innovation and High-Quality Economic Development: Based on Spatial Effect and Mediation Effect. Sustainability 2022, 14, 216. [Google Scholar] [CrossRef]
- Liu, L.B. An Ensemble Framework for Explainable Geospatial Machine Learning Models. Int. J. Appl. Earth Obs. Geoinf. 2024, 132, 104036. [Google Scholar] [CrossRef]
- Lu, X.; Sun, L.; Zhang, Y.; Du, J.; Wang, G.; Huang, X.; Li, X.; Wang, X. Predicting Cd accumulation in crops and identifying nonlinear effects of multiple environmental factors based on machine learning models. Sci. Total. Environ. 2024, 951, 175787. [Google Scholar] [CrossRef]
- Mousa, S.R.; Bakhit, P.R.; Osman, O.A.; Ishak, S. A Comparative Analysis of Tree-Based Ensemble Methods for Detecting Imminent Lane Change Maneuvers in Connected Vehicle Environments. Transp. Res. Rec. J. Transp. Res. Board 2018, 2672, 268–279. [Google Scholar] [CrossRef]
- Zhou, S.; Jia, W.; Wang, M.; Liu, Z.; Wang, Y.; Wu, Z. Synergistic assessment of multi-scenario urban waterlogging through data-driven decoupling analysis in high-density urban areas: A case study in Shenzhen, China. J. Environ. Manag. 2024, 369, 122330. [Google Scholar] [CrossRef]
- Li, Z.; Shi, H.; Yang, X.; Tang, H. Investigating the nonlinear relationship between surface solar radiation and its influencing factors in North China Plain using interpretable machine learning. Atmospheric Res. 2022, 280, 106406. [Google Scholar] [CrossRef]
- Friedman, J.H. Greedy Function Approximation: A Gradient Boosting Machine. Ann. Stat. 2001, 29, 1189–1232. [Google Scholar] [CrossRef]
- Lundberg, S. A Unified Approach to Interpreting Model Predictions. arXiv 2017, arXiv:1705.07874. [Google Scholar]
- Lundberg, S.M.; Erion, G.G.; Lee, S.I. Consistent Individualized Feature Attribution for Tree Ensembles. arXiv 2018, arXiv:1802.03888. [Google Scholar]
- Wu, X.; Huang, X. Screening of urban environmental vulnerability indicators based on coefficient of variation and anti-image correlation matrix method. Ecol. Indic. 2023, 150, 110196. [Google Scholar] [CrossRef]
- Grömping, U. Variable Importance in Regression Models. Wiley Interdiscip. Rev.Comput. Stat. 2015, 7, 137–152. [Google Scholar] [CrossRef]
- Chatterjee, S. A New Coefficient of Correlation. J. Am. Stat. Assoc. 2021, 116, 2009–2022. [Google Scholar] [CrossRef]
- Ahlgren, P.; Jarneving, B.; Rousseau, R. Requirements for a Cocitation Similarity Measure, with Special Reference to Pearson’s Correlation Coefficient. J. Am. Soc. Inf. Sci. Technol. 2003, 54, 550–560. [Google Scholar] [CrossRef]
- Shrestha, N. Detecting Multicollinearity in Regression Analysis. Am. J. Appl. Math. Stat. 2020, 8, 39–42. [Google Scholar] [CrossRef]
- Doan, Q.C.; Ma, J.; Chen, S.; Zhang, X. Nonlinear and Threshold Effects of the Built Environment, Road Vehicles and Air Pollution on Urban Vitality. Landsc. Urban Plan. 2025, 253, 105204. [Google Scholar] [CrossRef]
- Agarwal, V.; Singh, M.; Kumar, K.P. A Comprehensive Review of Linear Regression, Random Forest, Xgboost, and Svr: Integrating Machine Learning and Actuarial Science for Health Insurance Pricing. International Conference on Data Science, Computation and Security, Indore, India, 2–4 November 2023; Springer Nature: Singapore, 2023; Volume 922, pp. 355–367. [Google Scholar]
- Demir, S.; Şahin, E.K. Liquefaction prediction with robust machine learning algorithms (SVM, RF, and XGBoost) supported by genetic algorithm-based feature selection and parameter optimization from the perspective of data processing. Environ. Earth Sci. 2022, 81, 1–17. [Google Scholar] [CrossRef]
- Sagi, O.; Rokach, L. Approximating XGBoost with an interpretable decision tree. Inf. Sci. 2021, 572, 522–542. [Google Scholar] [CrossRef]
- Mardia, K.V.; Kent, J.T.; Taylor, C.C. Multivariate Analysis; John Wiley & Sons: Hoboken, NJ, USA, 2024; Volume 88. [Google Scholar]
- Forman, C.; van Zeebroeck, N. From Wires to Partners: How the Internet Has Fostered R&D Collaborations Within Firms. Manag. Sci. 2012, 58, 1549–1568. [Google Scholar] [CrossRef]
- Riemer, K.; Schellhammer, S. Collaboration in the Digital Age: Diverse, Relevant and Challenging. In Collaboration in the Digital Age: How Technology Enables Individuals, Teams and Businesses; Springer International Publishing: Cham, Switzerland, 2019; pp. 1–12. [Google Scholar]
- Kaldor, N. Capital Accumulation and Economic Growth. In The Theory of Capital: Proceedings of a Conference Held by the International Economic Association; Palgrave Macmillan: London, UK, 1961. [Google Scholar]
- Iwaisako, T.; Futagami, K. Patent Protection, Capital Accumulation, and Economic Growth. Econ. Theory 2013, 52, 631–668. [Google Scholar] [CrossRef]
- Andersson, R.; Quigley, J.M.; Wilhelmsson, M. Urbanization, productivity, and innovation: Evidence from investment in higher education. J. Urban Econ. 2009, 66, 2–15. [Google Scholar] [CrossRef]
- Wei, L.; Lin, B.; Zheng, Z.; Wu, W.; Zhou, Y. Does fiscal expenditure promote green technological innovation in China? Evidence from Chinese cities. Environ. Impact Assess. Rev. 2023, 98, 106945. [Google Scholar] [CrossRef]
- Han, S.; Wang, M.; Liu, Q.; Wang, R.; Ou, G.; Zhang, L. The Influence of Land Disposition Derived from Land Finance on Urban Innovation in China: Mechanism Discussion and Empirical Evidence. Int. J. Environ. Res. Public Health 2022, 19, 3212. [Google Scholar] [CrossRef] [PubMed]
- Agrawal, A.; Kapur, D.; McHale, J.; Oettl, A. Brain drain or brain bank? The impact of skilled emigration on poor-country innovation. J. Urban Econ. 2011, 69, 43–55. [Google Scholar] [CrossRef]
- Docquier, F.; Rapoport, H. Globalization, Brain Drain, and Development. J. Econ. Lit. 2012, 50, 681–730. [Google Scholar] [CrossRef]
- Kaasa, A.; Vadi, M. How Does Culture Contribute to Innovation? Evidence from European Countries? Evidence from European Countries. Econ. Innov. New Technol. 2010, 19, 583–604. [Google Scholar] [CrossRef]
- Cooke, P.N.; Lazzeretti, L. Creative Cities, Cultural Clusters and Local Economic Development; Edward Elgar Publishing: Cheltenham, UK, 2008. [Google Scholar]
- Anas, A.; Arnott, R.; Small, K.A. Urban Spatial Structure. J. Econ. Lit. 1998, 101, 1426–1464. [Google Scholar]
- Glaeser, E.L.; Gottlieb, J.D. The Wealth of Cities: Agglomeration Economies and Spatial Equilibrium in the United States. J. Econ. Lit. 2009, 47, 983–1028. [Google Scholar] [CrossRef]
- Fumagalli, F.; Muschalik, M.; Kolpaczki, P.; Hüllermeier, E.; Hammer, B. Shap-Iq: Unified Approximation of Any-Order Shapley Interactions. Adv. Neural Inf. Process. Syst. 2024, 36, 11515–11551. [Google Scholar]
- Yue, H. Investigating the Influence of Streetscape Environmental Characteristics on Pedestrian Crashes at Intersections Using Street View Images and Explainable Machine Learning. Accid. Anal. Prev. 2024, 205, 107693. [Google Scholar] [CrossRef]
- Moon, H.; Mariadoss, B.J.; Johnson, J.L. Collaboration with Higher Education Institutions for Successful Firm Innovation. J. Bus. Res. 2019, 99, 534–541. [Google Scholar] [CrossRef]
- De Noni, I.; Orsi, L.; Belussi, F. The Role of Collaborative Networks in Supporting the Innovation Performances of Lagging-Behind European Regions. Res. Policy 2018, 47, 1–13. [Google Scholar] [CrossRef]
- Mao, C.; Yu, X.; Zhou, Q.; Harms, R.; Fang, G. Knowledge growth in university-industry innovation networks—Results from a simulation study. Technol. Forecast. Soc. Chang. 2020, 151, 119746. [Google Scholar] [CrossRef]
- Lewis, R. Chicago Made: Factory Networks in the Industrial Metropolis; University of Chicago Press: Chicago, IL, USA, 2019. [Google Scholar]
- Hassink, R. Locked in Decline? On the Role of Regional Lock-Ins in Old Industrial Areas. In The Handbook of Evolutionary Economic Geography; Edward Elgar Publishing: Cheltenham, UK, 2010. [Google Scholar]
- Du, Y.; Wang, M.; Yin, Y. Research on innovation cooperation network of Chinese universities based on patent data. J. Eng. Technol. Manag. 2023, 71, 101784. [Google Scholar] [CrossRef]
- Shi, X.; Chen, Y.; Xia, M.; Zhang, Y. Effects of the Talent War on Urban Innovation in China: A Difference-in-Differences Analysis. Land 2022, 11, 1485. [Google Scholar] [CrossRef]
- Verginer, L.; Riccaboni, M. Talent goes to global cities: The world network of scientists’ mobility. Res. Policy 2021, 50, 104127. [Google Scholar] [CrossRef] [PubMed]
- Huang, Y.; Li, K.; Li, P. Innovation ecosystems and national talent competitiveness: A country-based comparison using fsQCA. Technol. Forecast. Soc. Chang. 2023, 194, 122733. [Google Scholar] [CrossRef]
- Florida, R.; Charlotta, M. Talent, Cities, and Competitiveness; Oxford University Press: Oxford, UK, 2015. [Google Scholar]
- Cruz, S.S.; Paulino, S.R. Experiences of innovation in public services for sustainable urban mobility. J. Urban Manag. 2022, 11, 108–122. [Google Scholar] [CrossRef]
- Qiu, Y.; Wang, H. The Impact of Public Services on Urban Innovation—A Study Based on Differences and Mechanisms. Sustainability 2022, 14, 9630. [Google Scholar] [CrossRef]
- Feldman, M.P.; Audretsch, D.B. Innovation in Cities:: Science-Based Diversity, Specialization and Localized Competition. Eur. Econ. Rev. 1999, 43, 409–429. [Google Scholar] [CrossRef]
- Andersson, D.; Berger, T.; Prawitz, E. Making a Market: Infrastructure, Integration, and the Rise of Innovation. Rev. Econ. Stat. 2023, 105, 258–274. [Google Scholar] [CrossRef]
- Cheng, T.; Selden, M. The Origins and Social Consequences of China’s HukouSystem. China Q. 1994, 139, 644–668. [Google Scholar] [CrossRef]
- Orsini, N.; Moore, A.; Wolk, A. Interaction Analysis Based on Shapley Values and Extreme Gradient Boosting: A Realistic Simulation and Application to a Large Epidemiological Prospective Study. Front. Nutr. 2022, 9, 871768. [Google Scholar] [CrossRef]
- Dakhli, M.; De Clercq, D. Human Capital, Social Capital, and Innovation: A Multi-Country Study. Entrep. Reg. Dev. 2004, 16, 107–128. [Google Scholar] [CrossRef]
- Wang, Q.; Zhang, F.; Li, R. Artificial Intelligence and Sustainable Development During Urbanization: Perspectives on Ai R&D Innovation, Ai Infrastructure, and Ai Market Advantage. Sustain. Dev. 2024, 23, 1136–1156. [Google Scholar]
- Schaffers, H.; Komninos, N.; Pallot, M.; Trousse, B.; Nilsson, M.; Oliveira, A. Smart Cities and the Future Internet: Towards Cooperation Frameworks for Open Innovation; Springer: Berlin/Heidelberg, Germany, 2011. [Google Scholar]
- Tu, W.; Zhang, L.; Sun, D.; Mao, W. Evaluating high-tech industries’ technological innovation capability and spatial pattern evolution characteristics: Evidence from China. J. Innov. Knowl. 2023, 8, 100287. [Google Scholar] [CrossRef]
- Appio, F.P.; Lima, M.; Paroutis, S. Understanding Smart Cities: Innovation Ecosystems, Technological Advancements, and Societal Challenges. Technol. Forecast. Soc. Change 2019, 142, 1–14. [Google Scholar] [CrossRef]
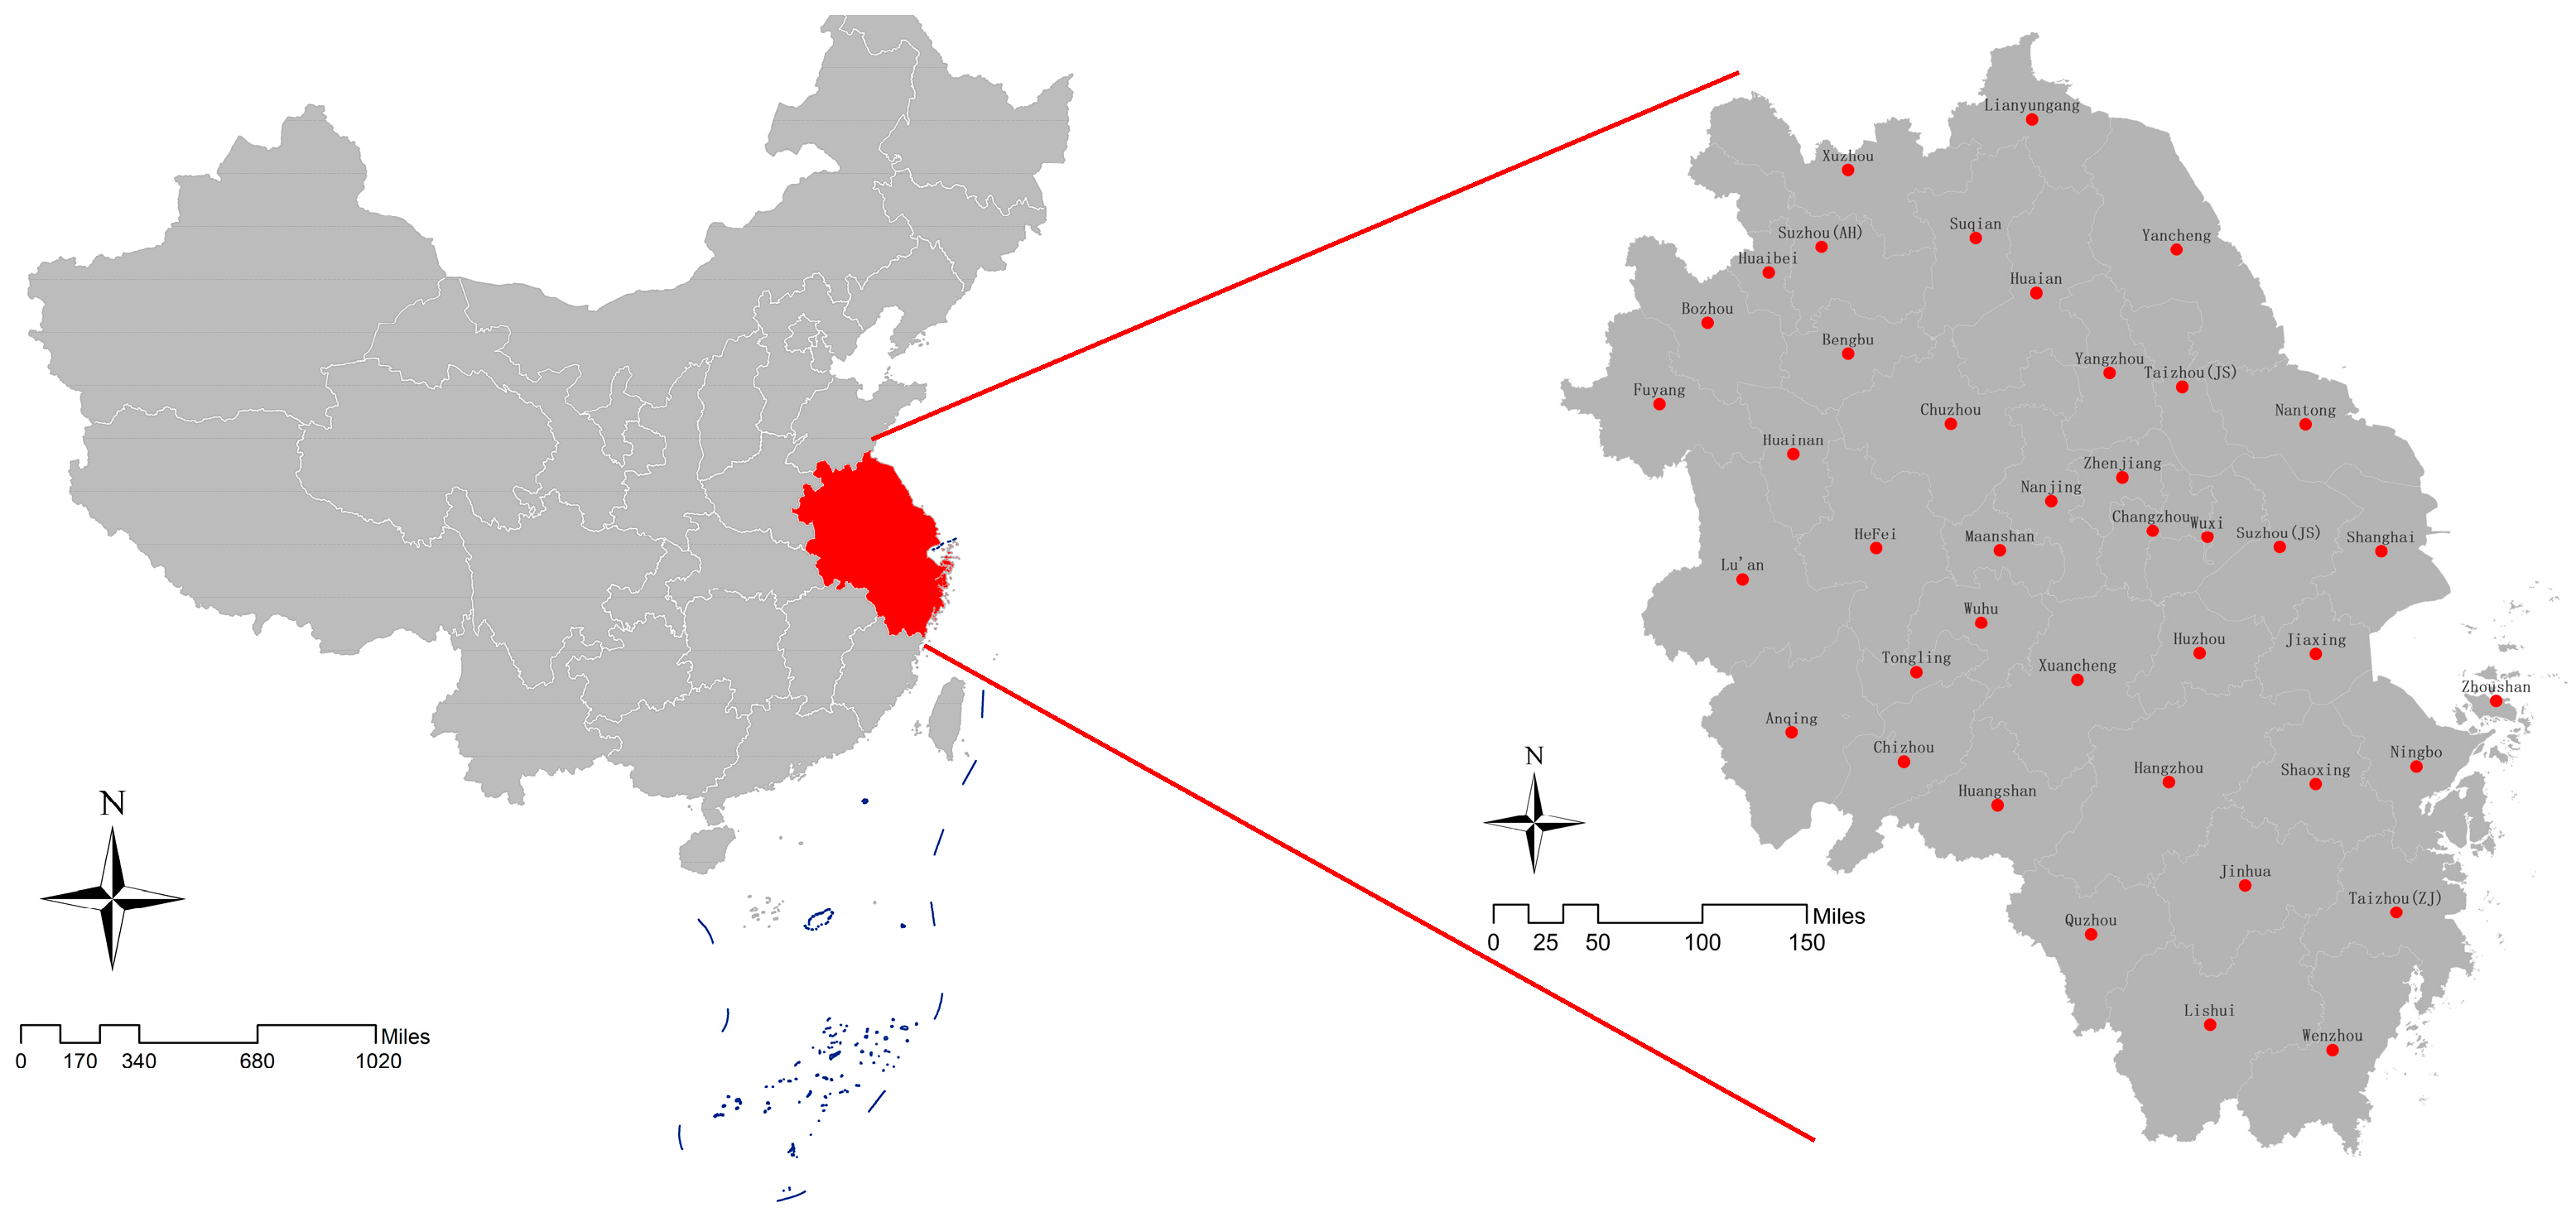
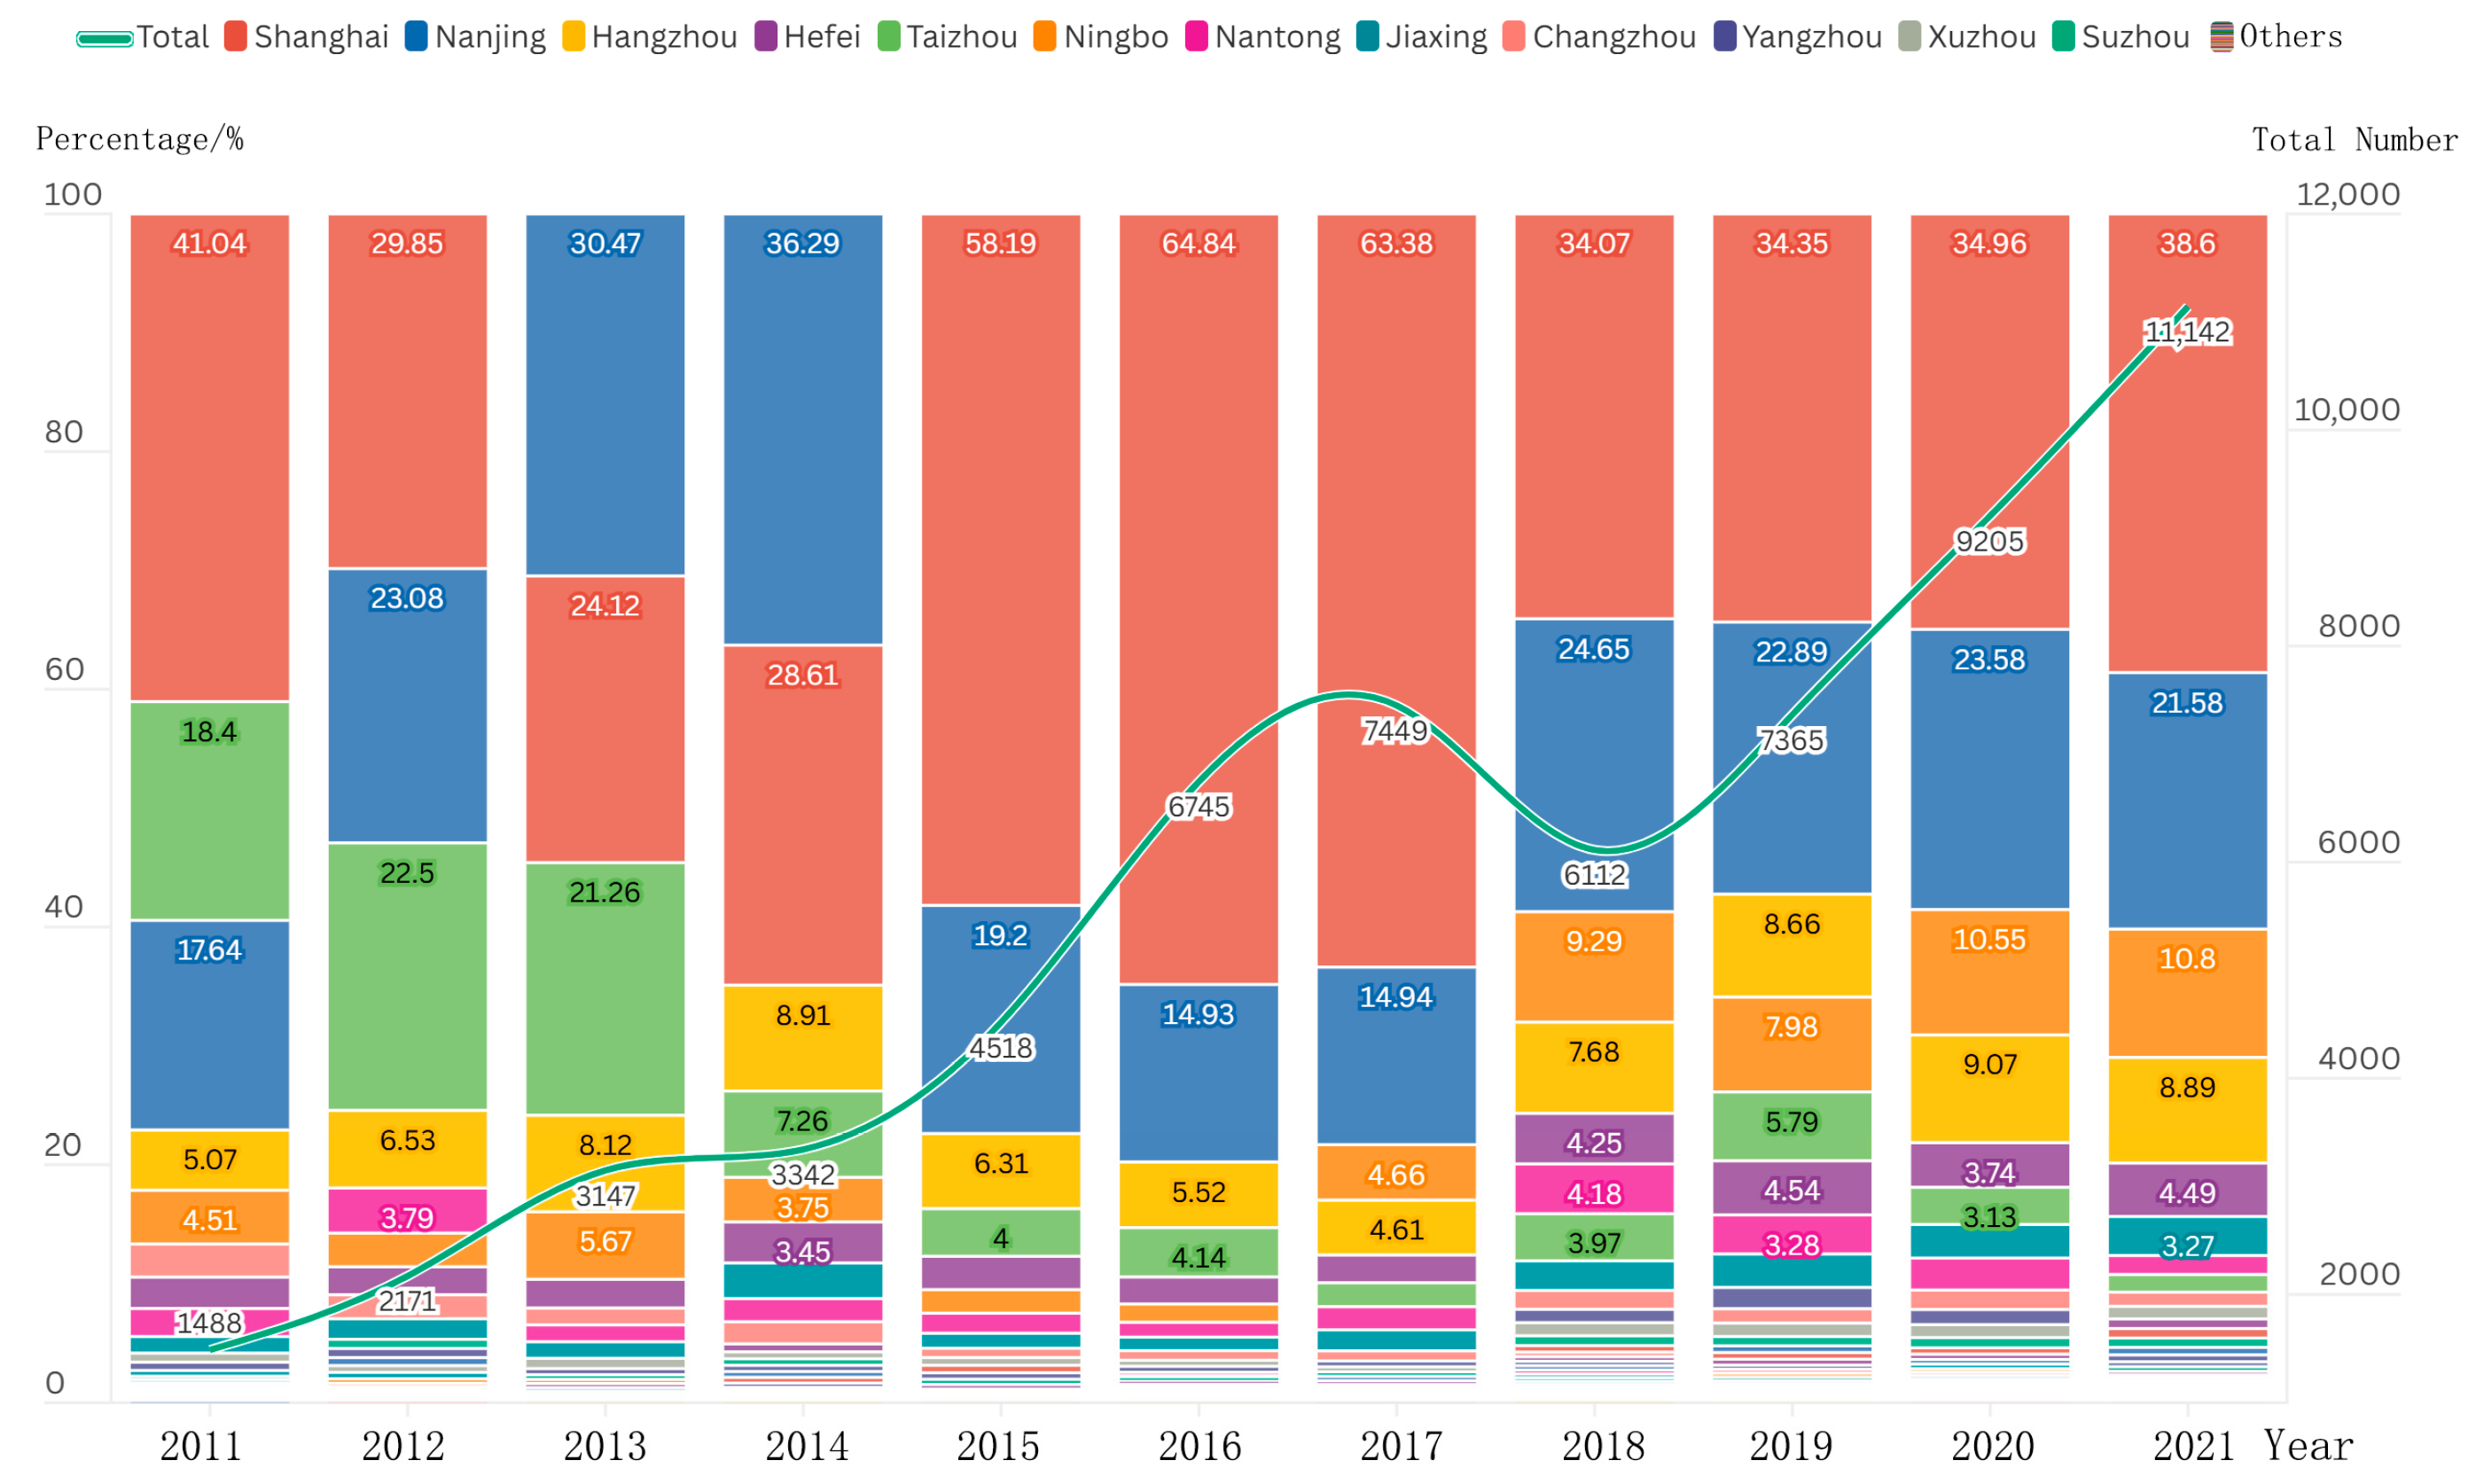
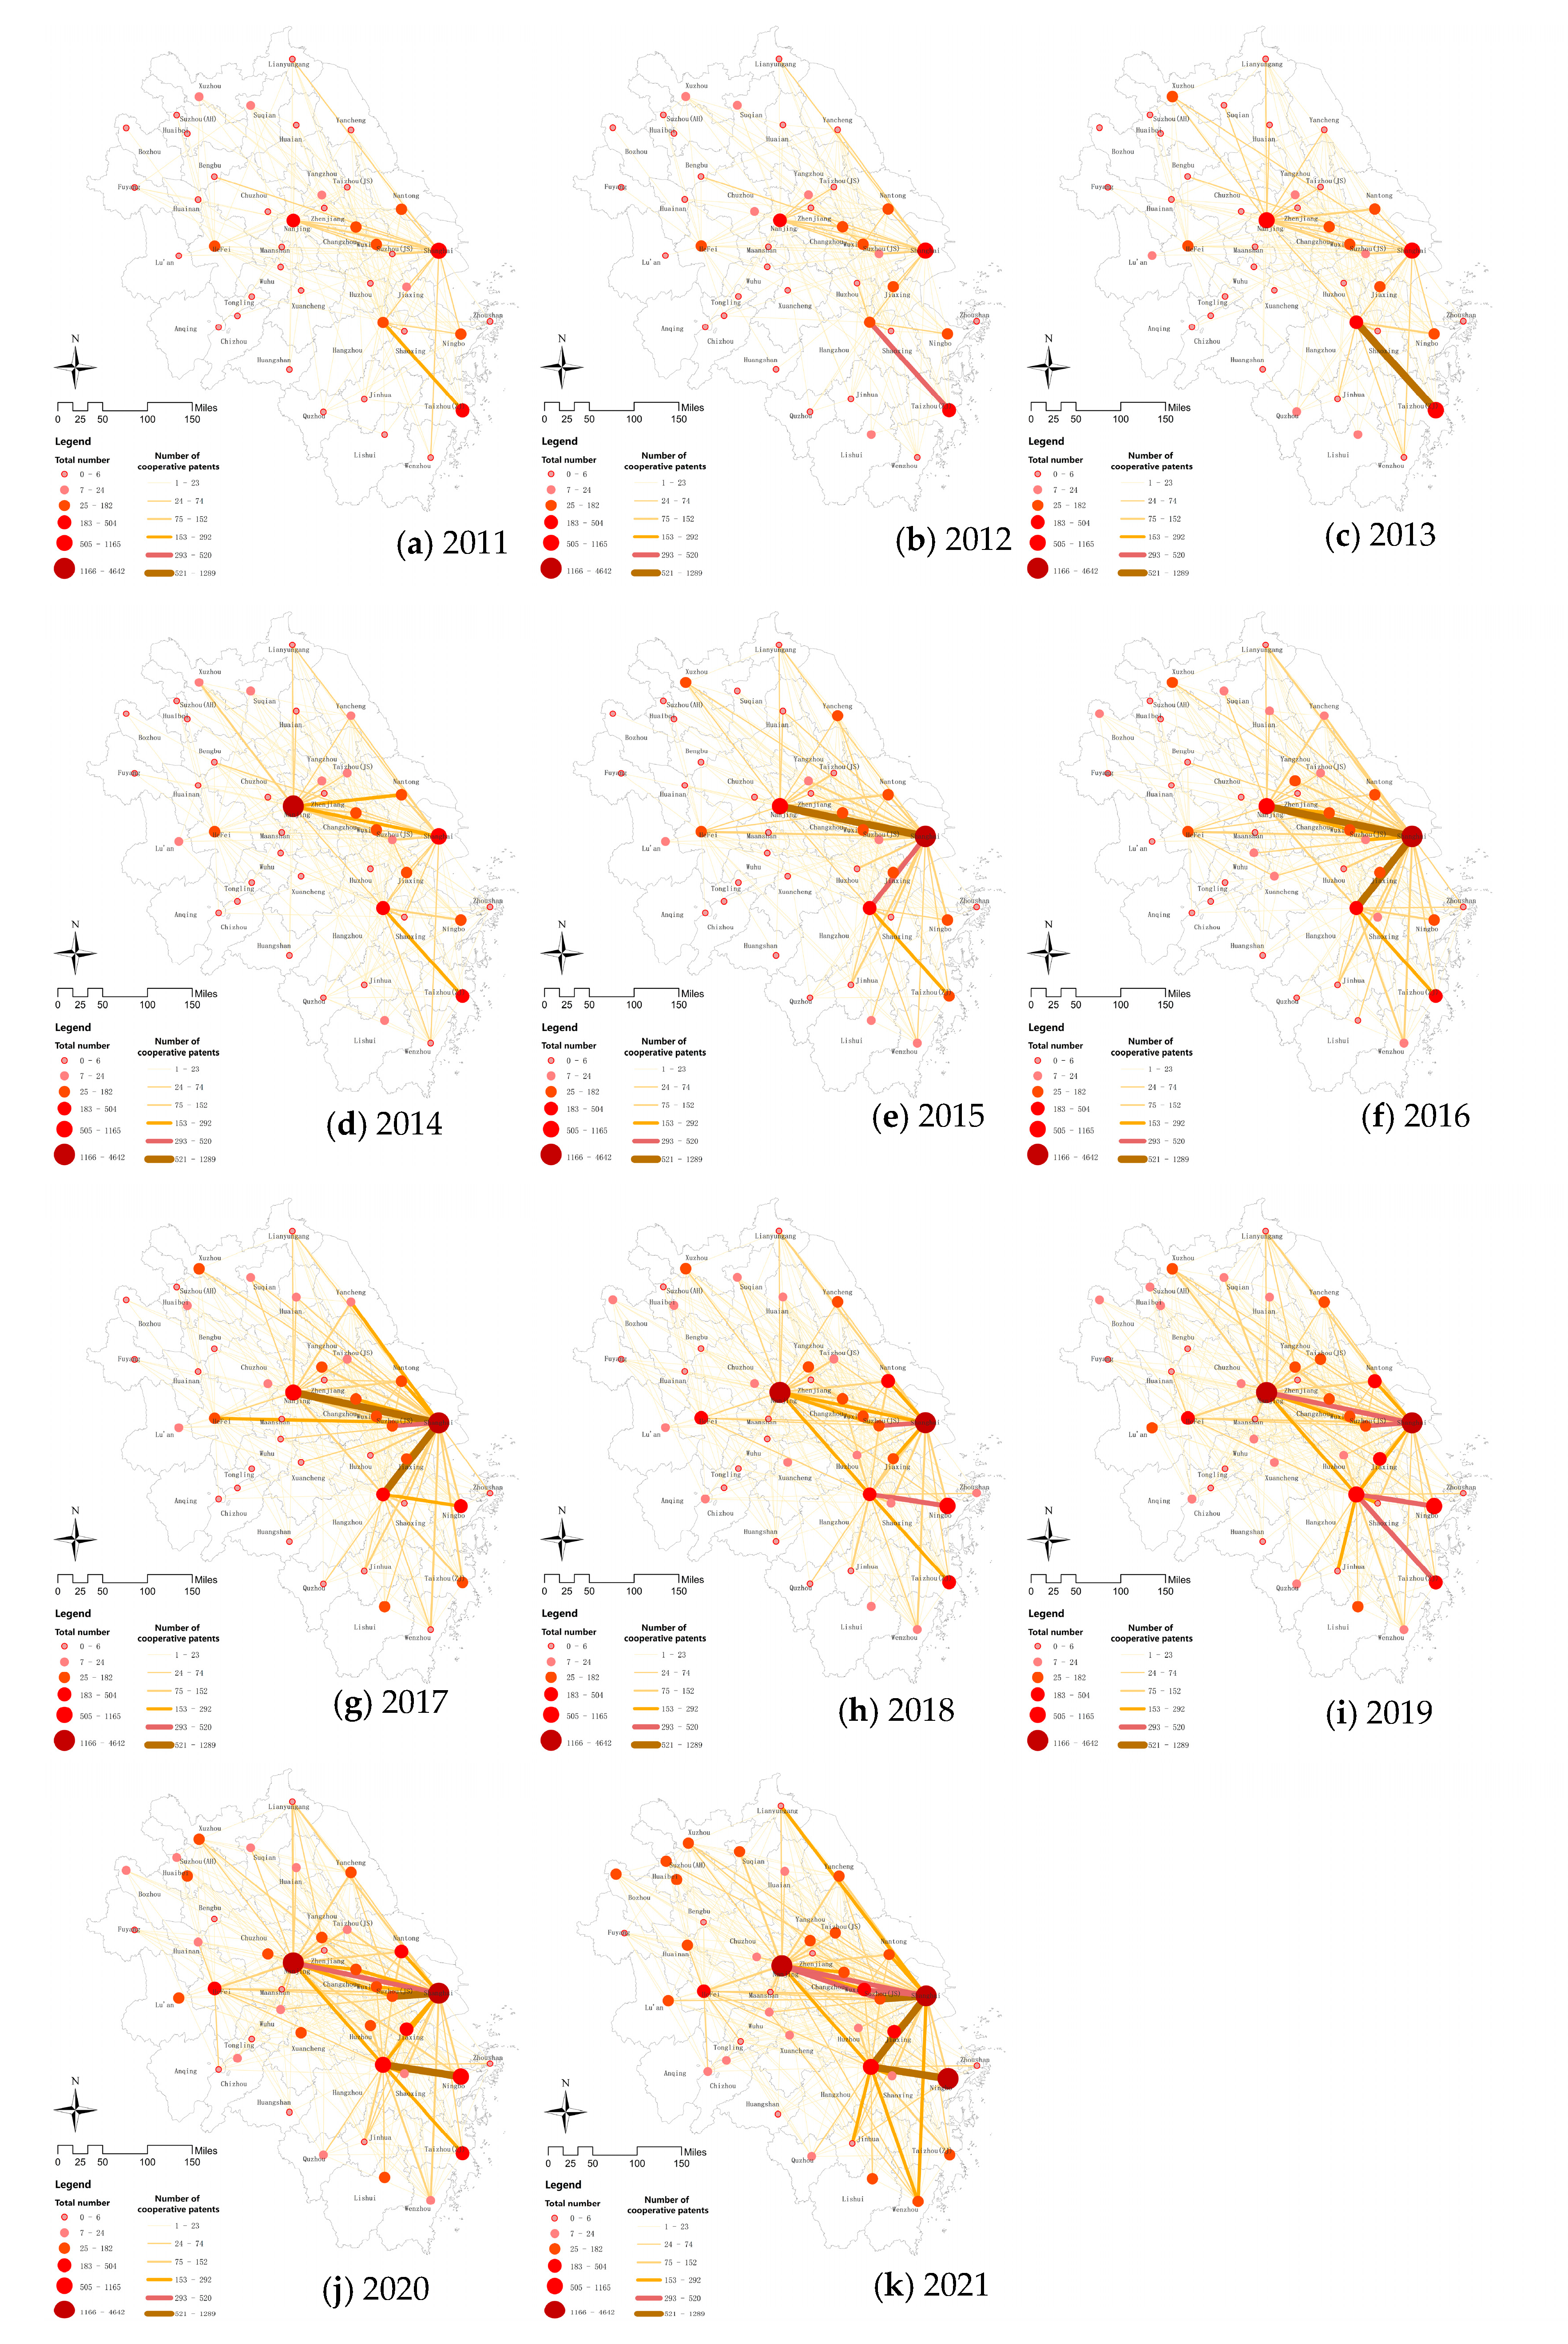

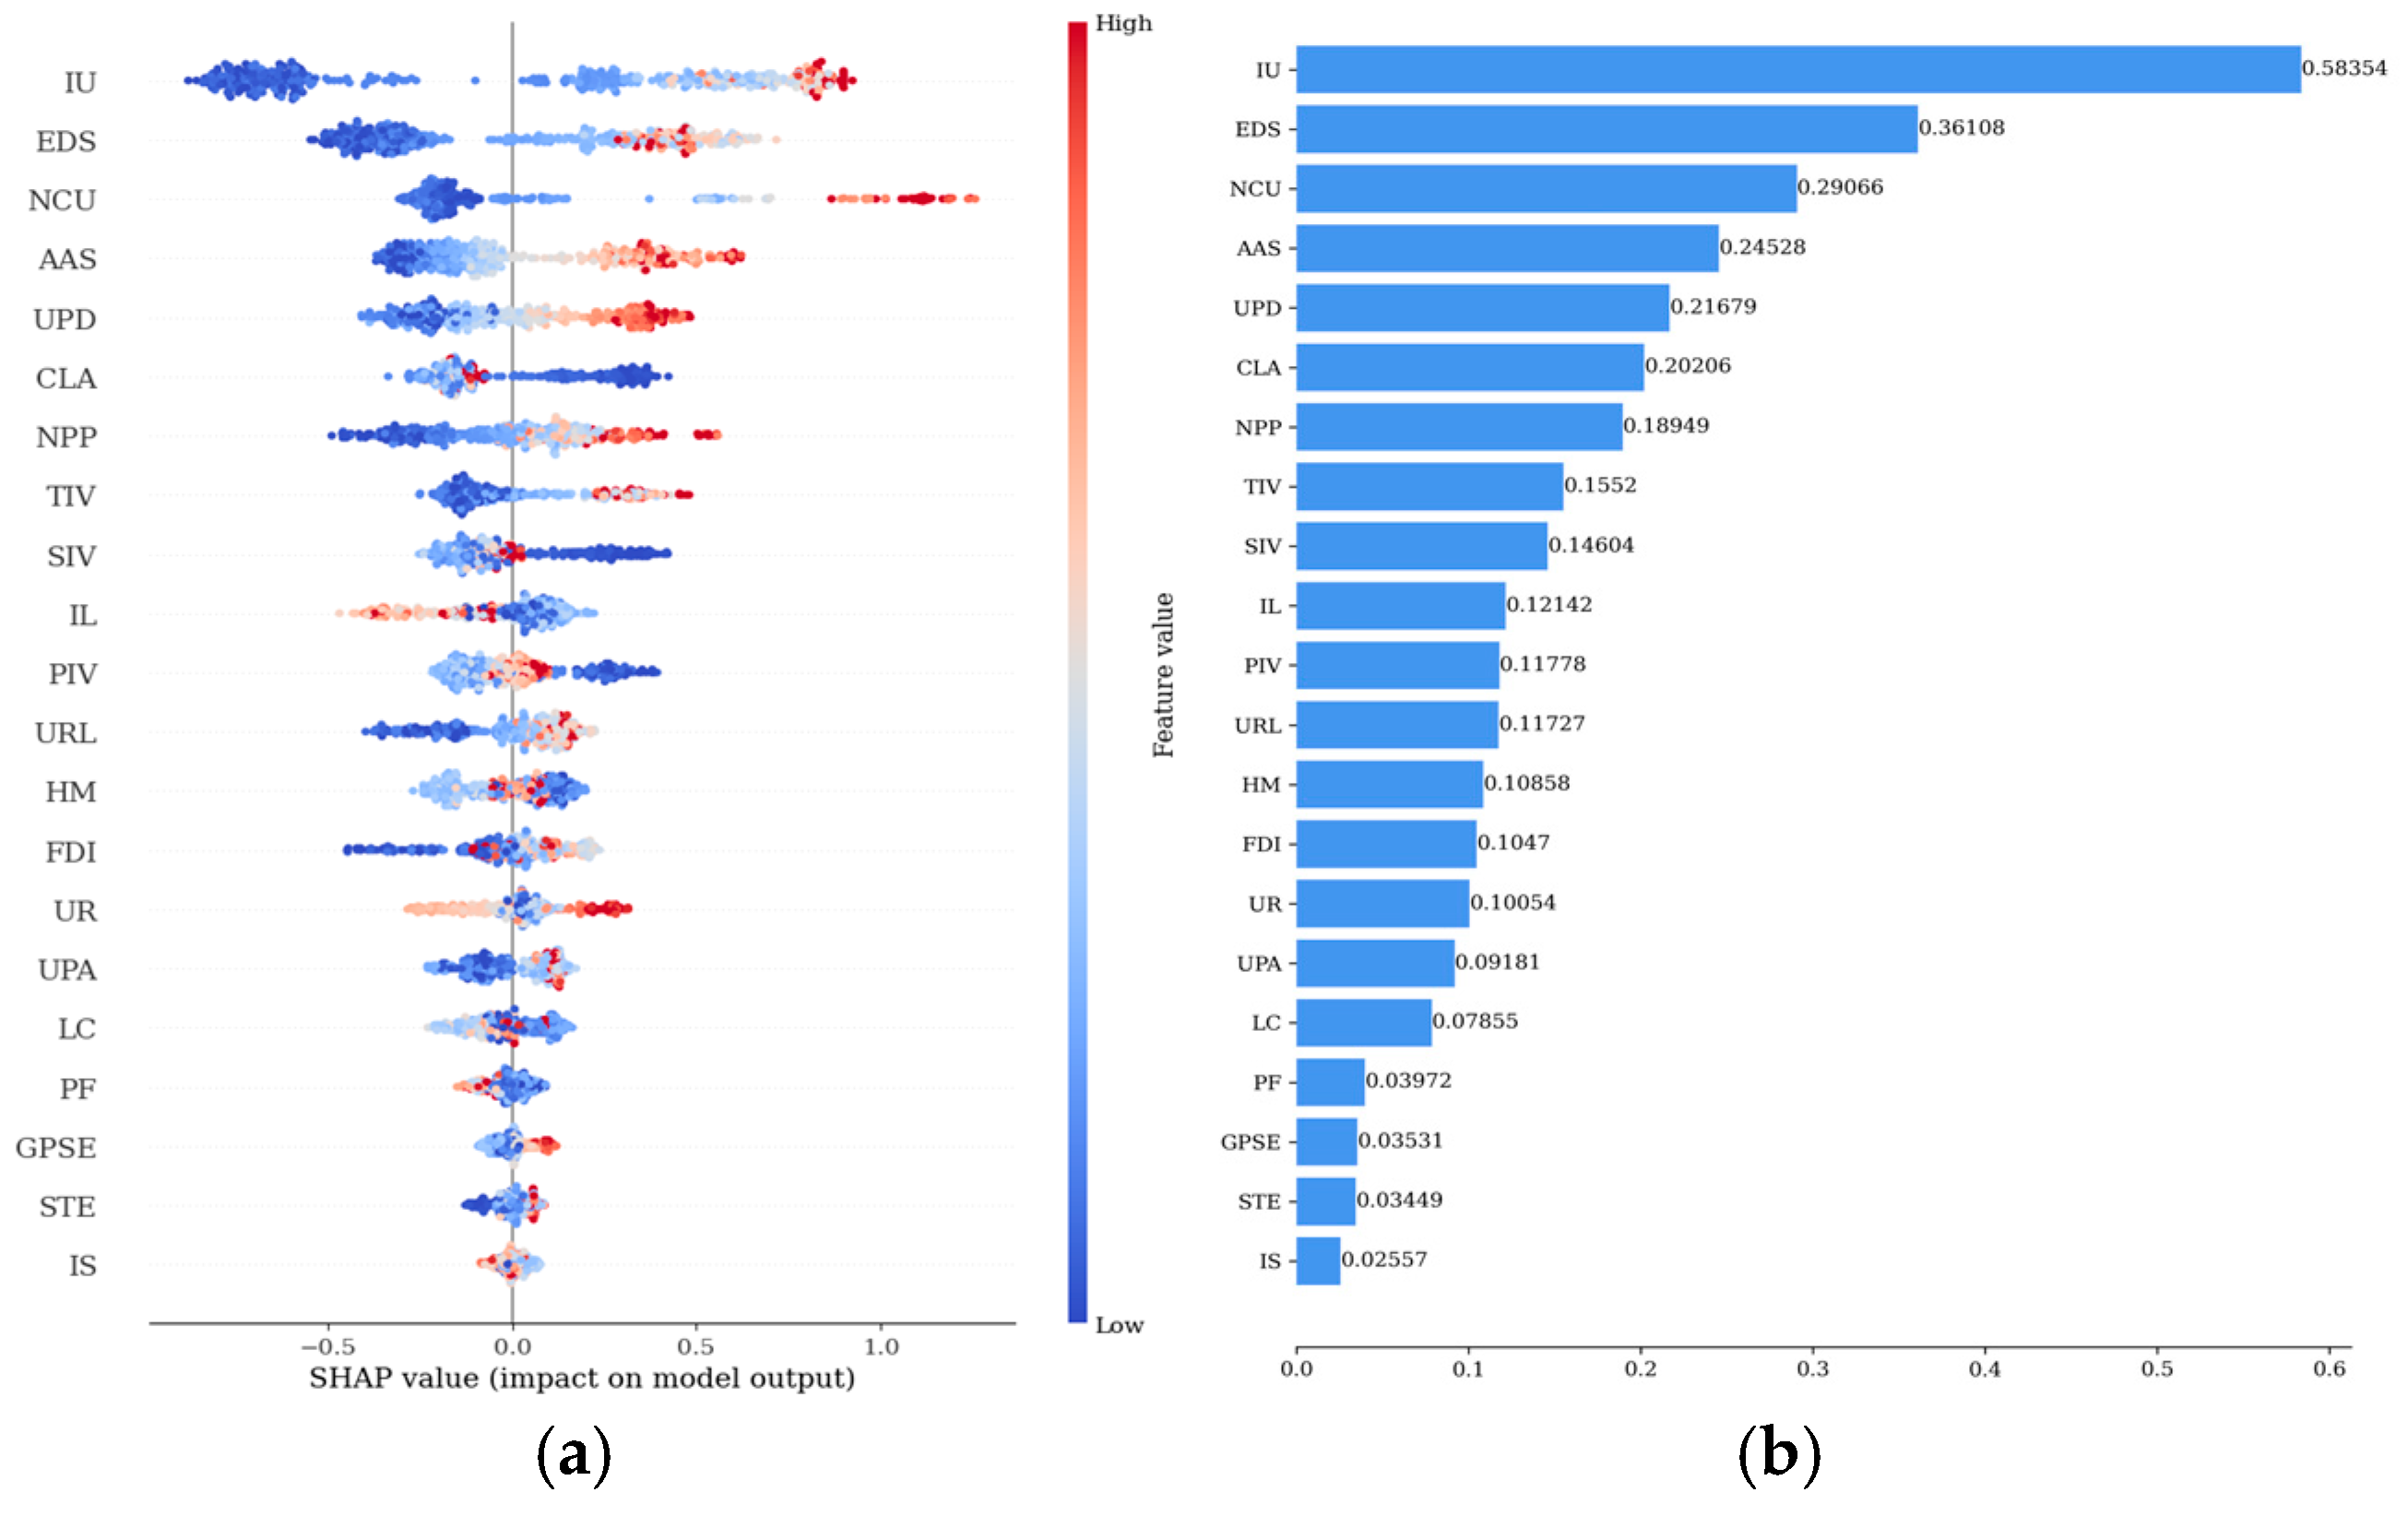
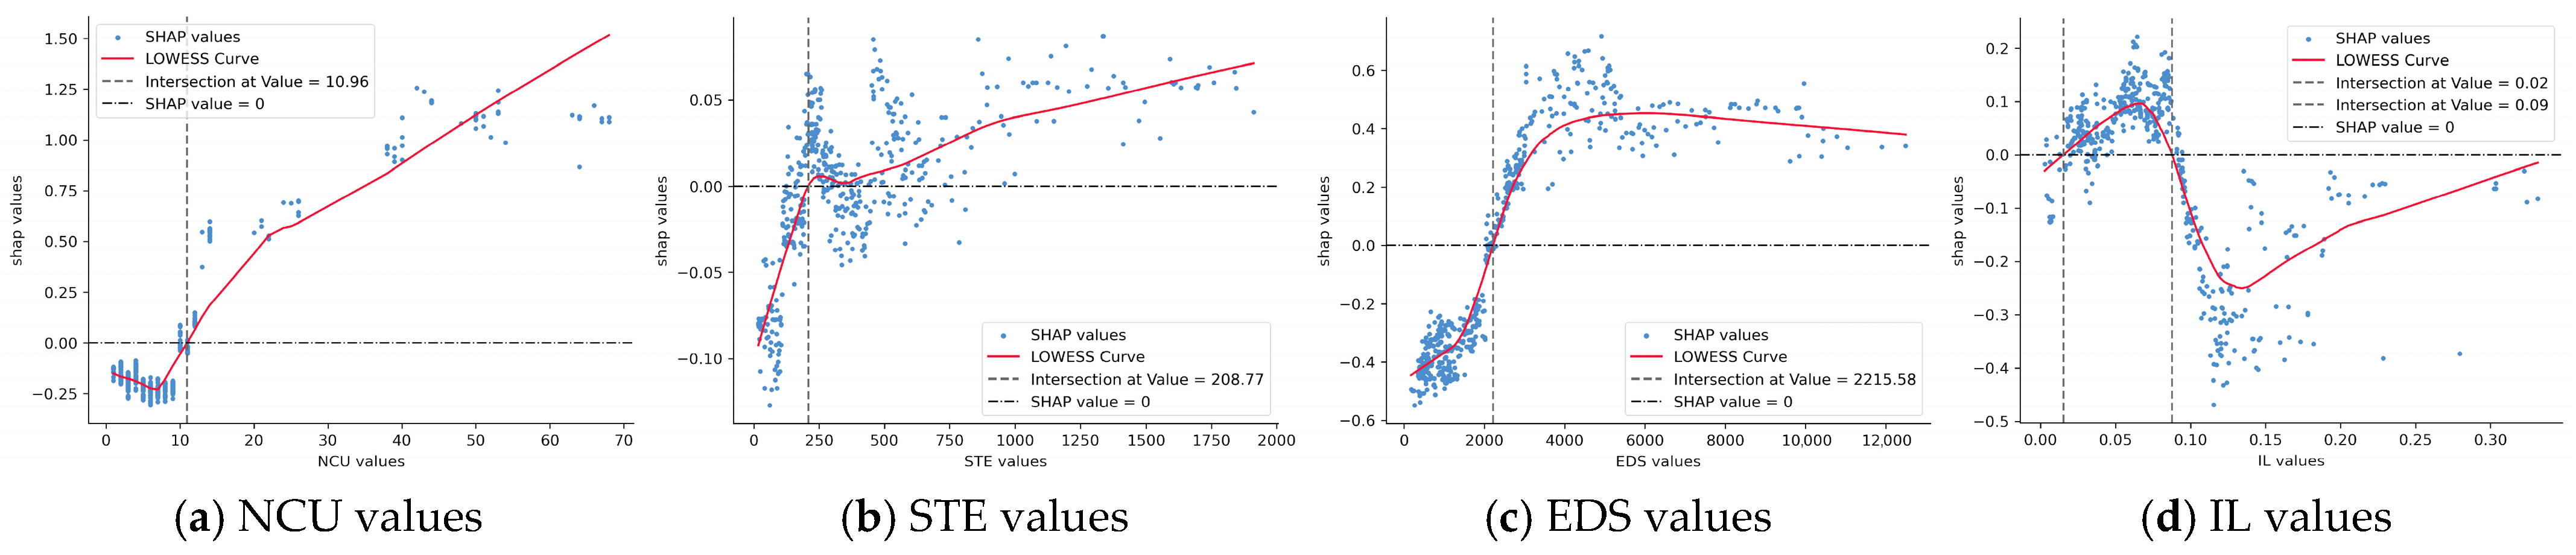
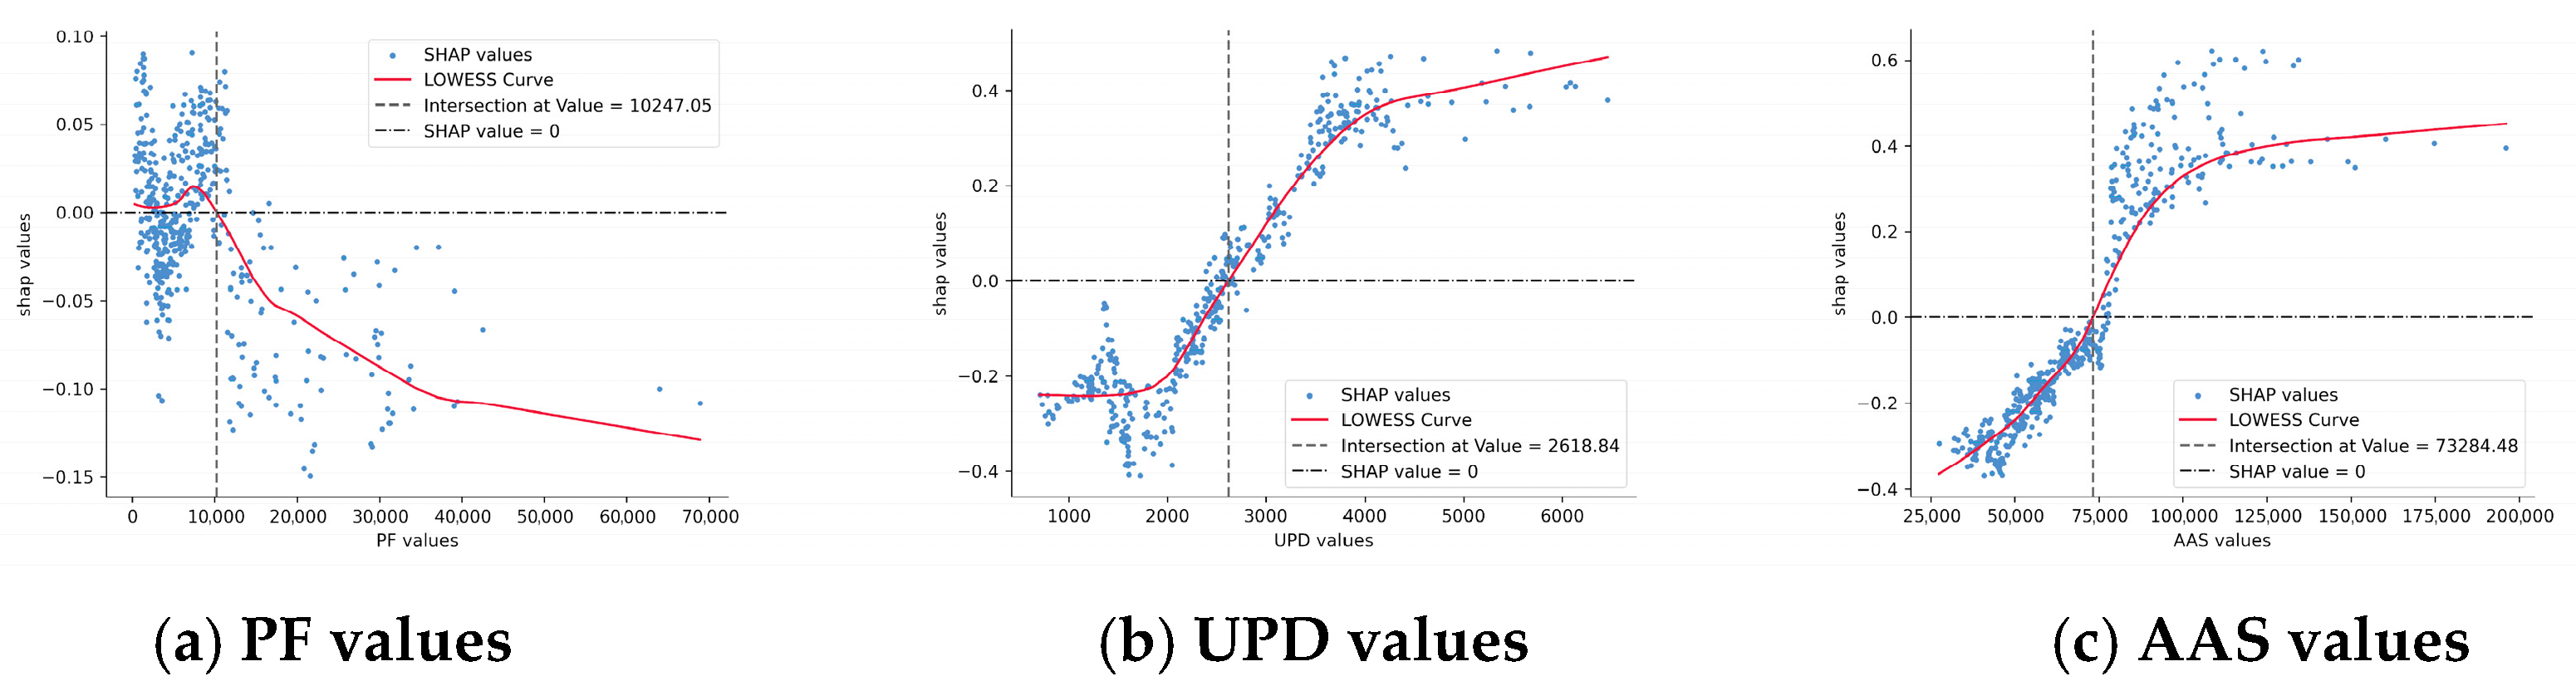
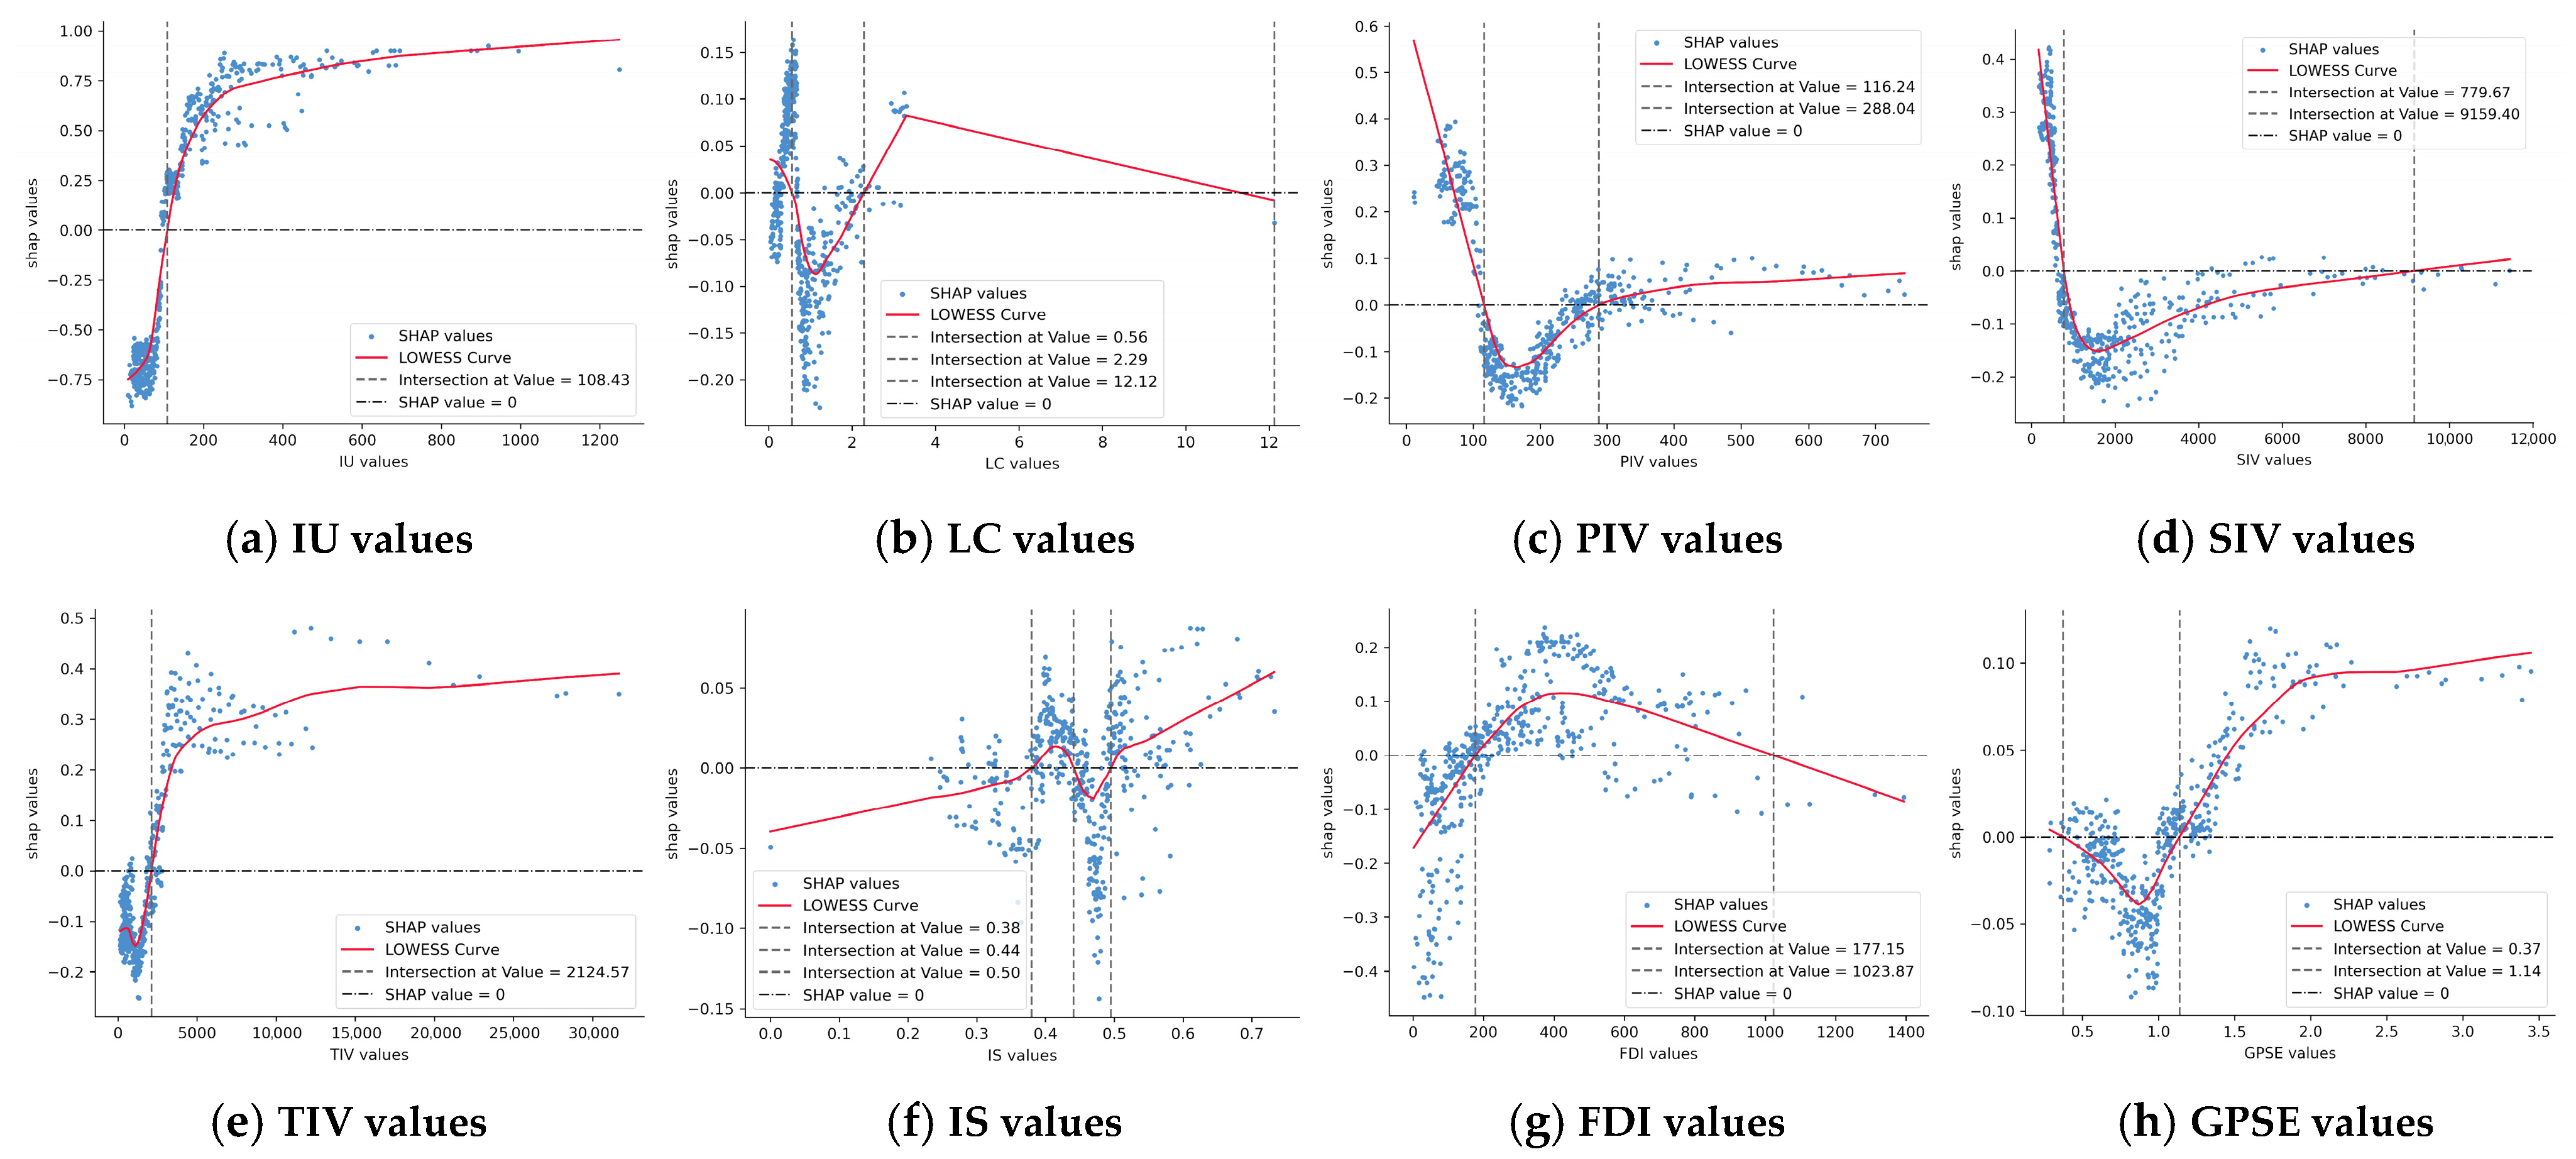
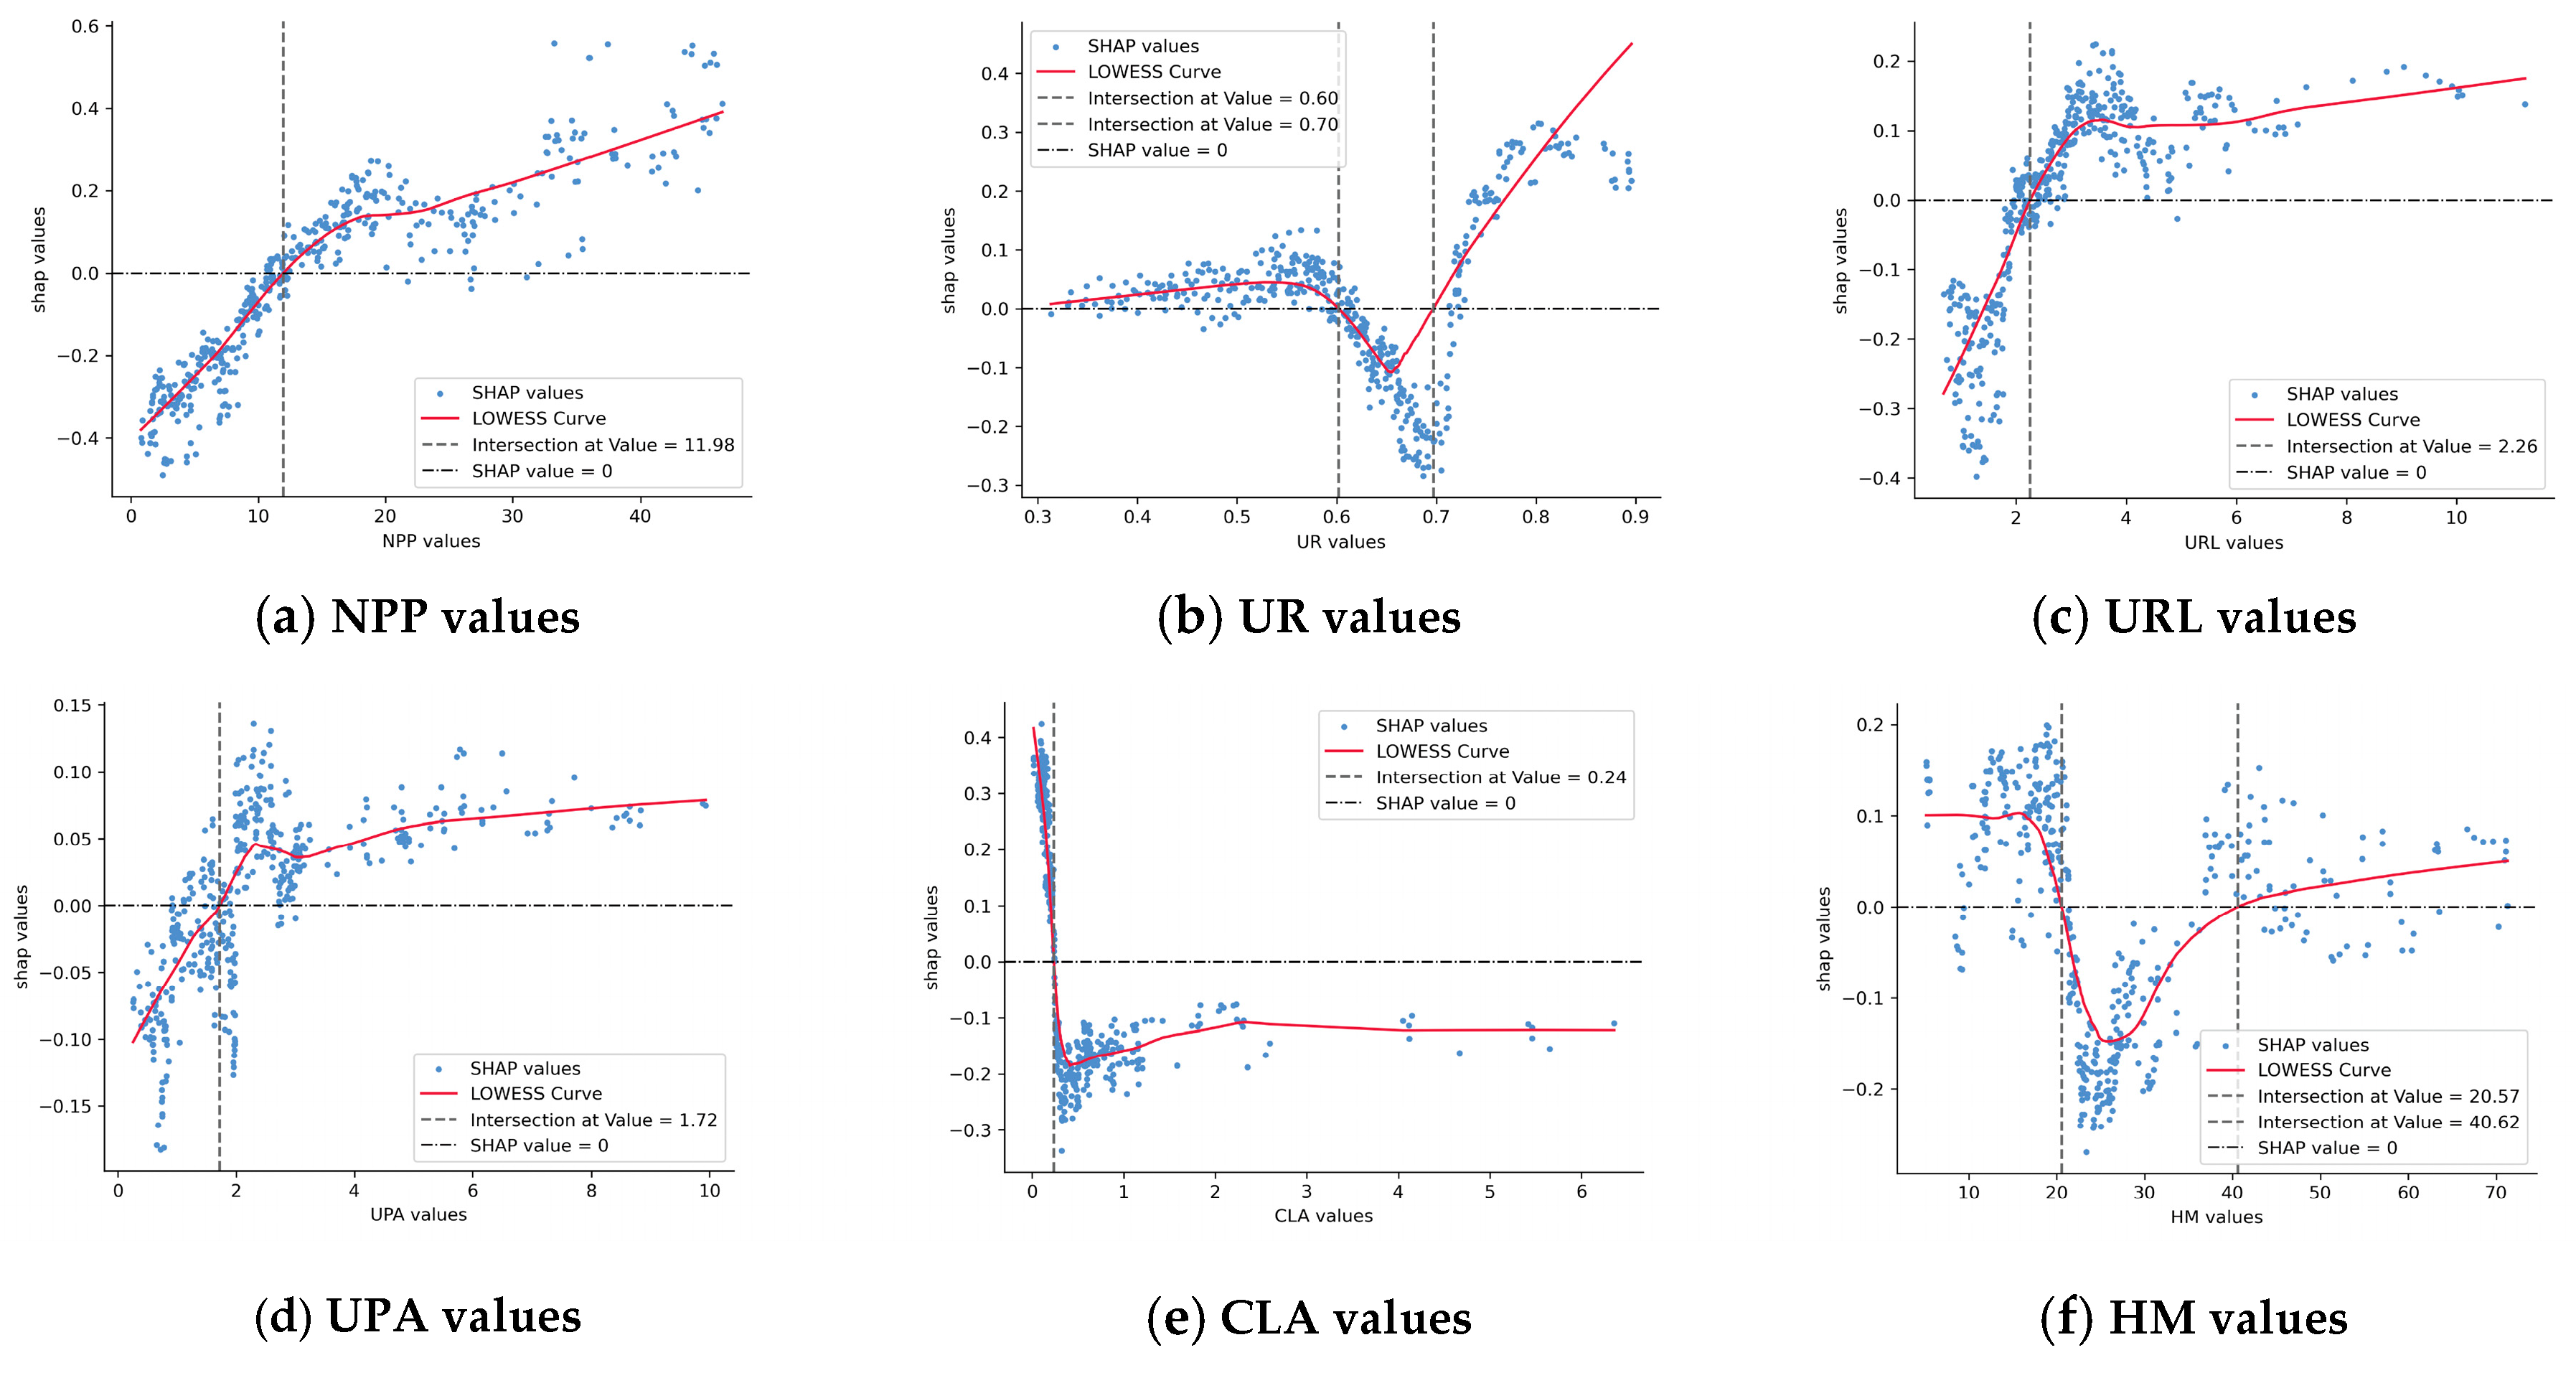
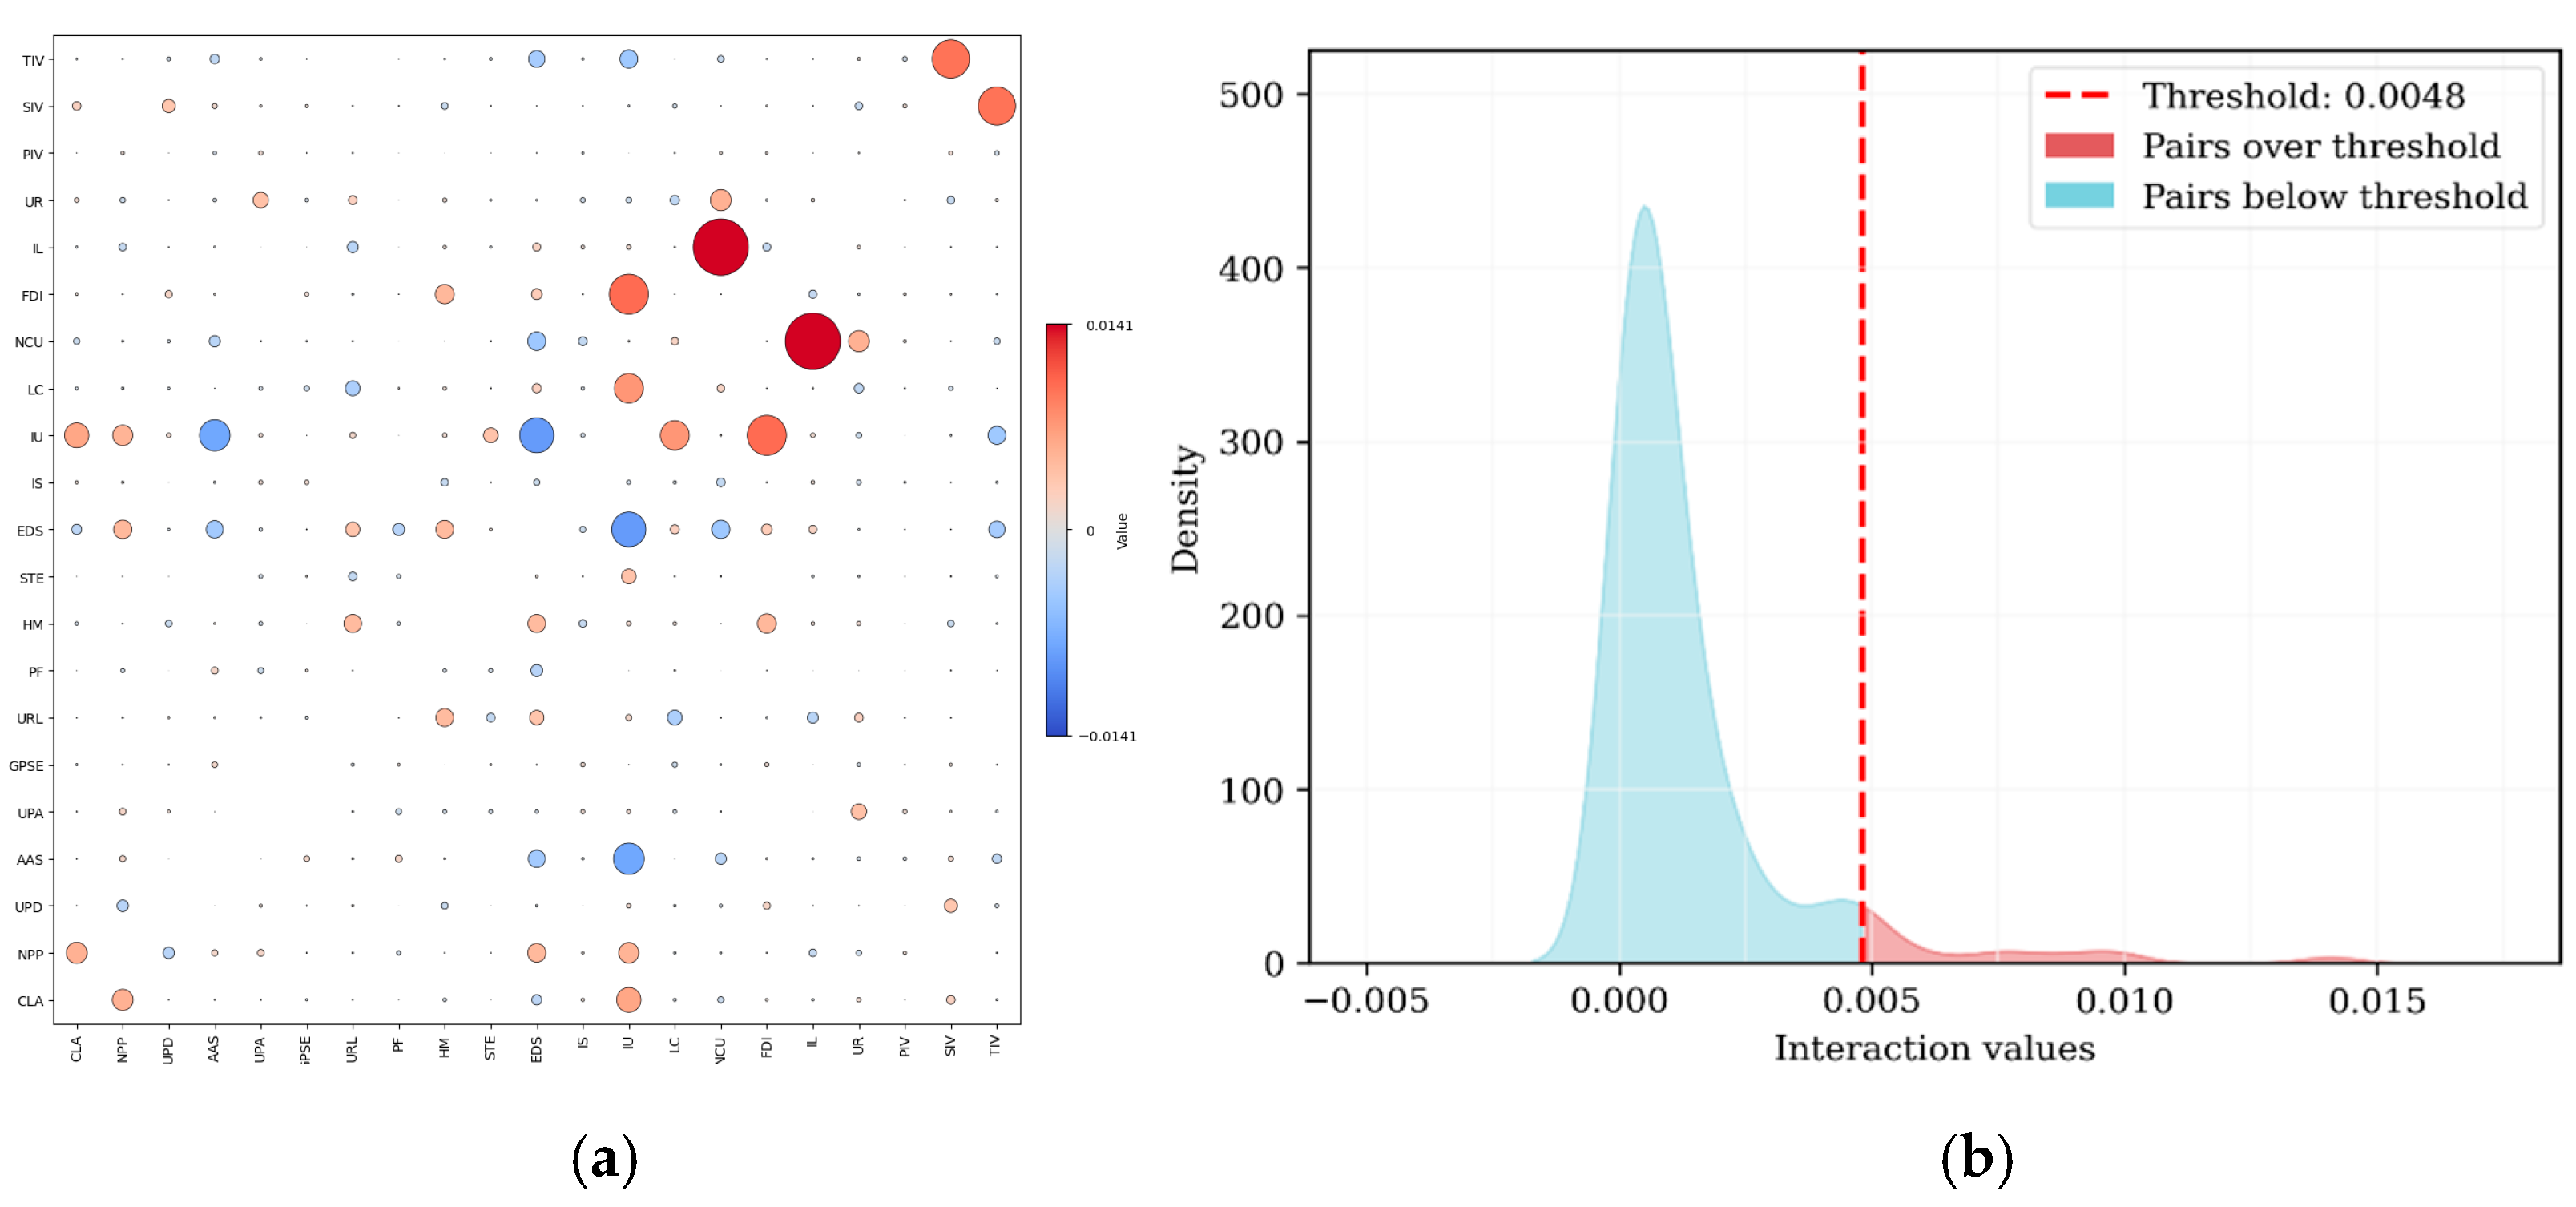
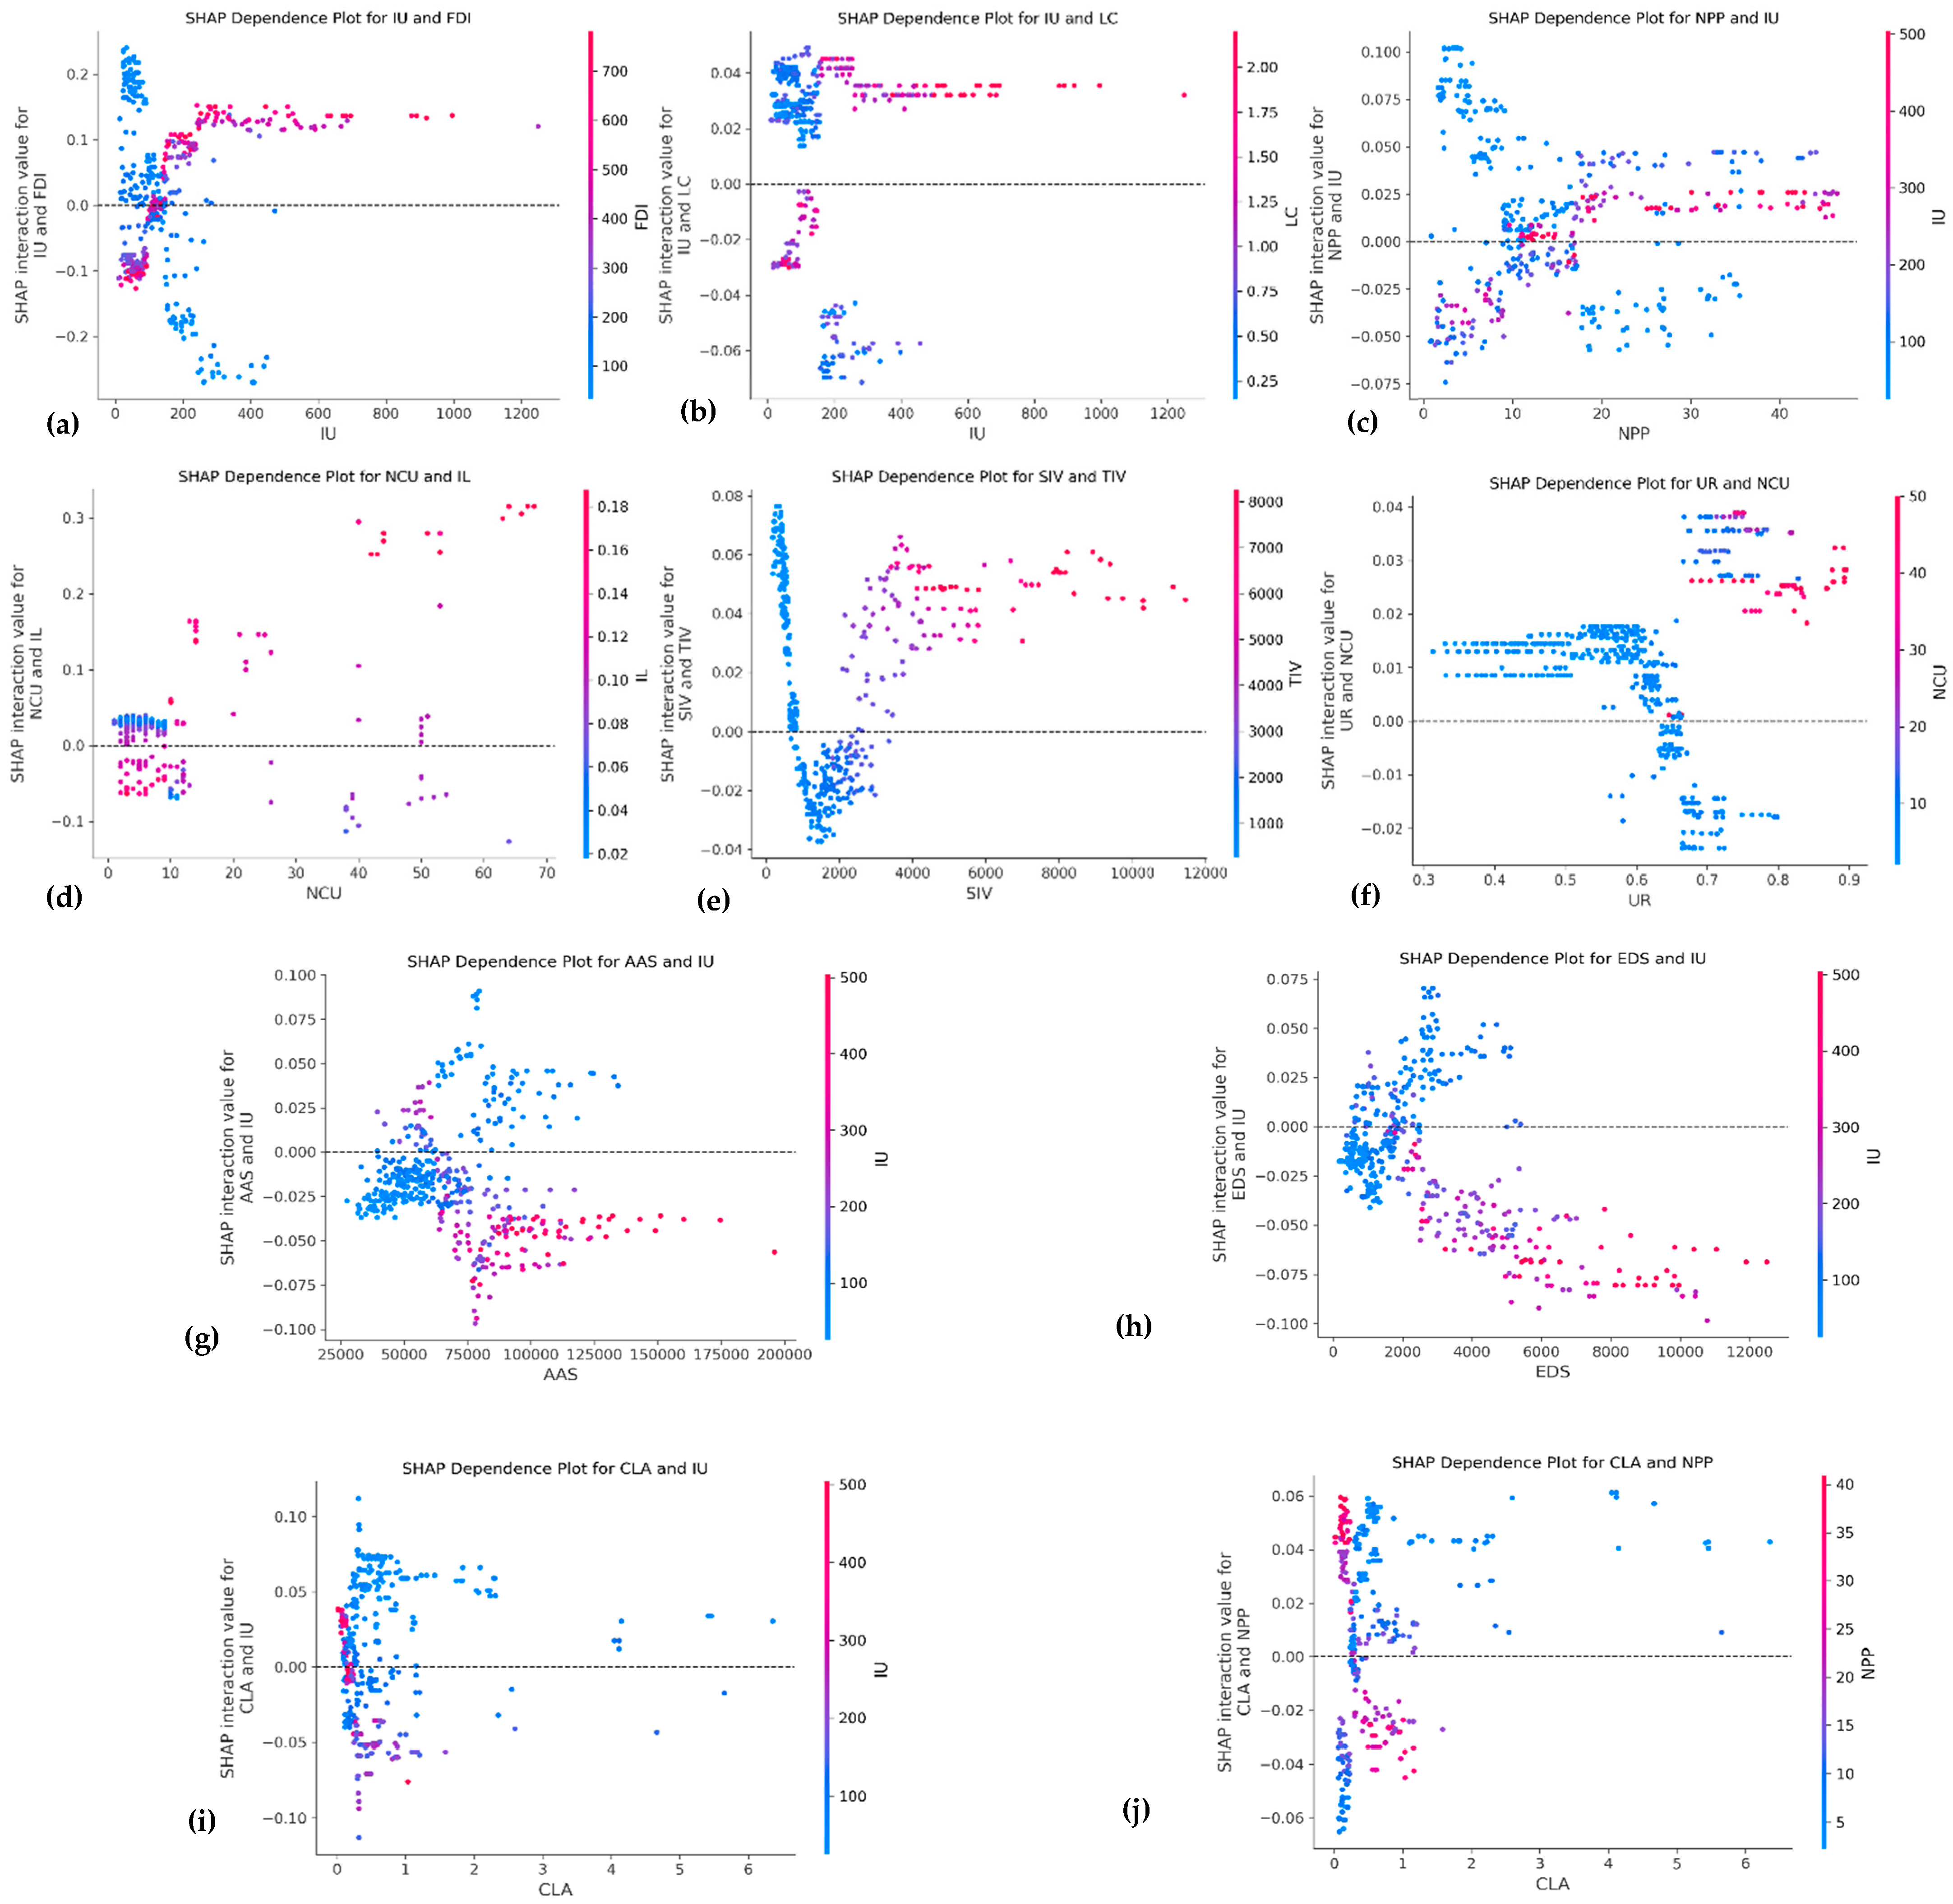
Disclaimer/Publisher’s Note: The statements, opinions and data contained in all publications are solely those of the individual author(s) and contributor(s) and not of MDPI and/or the editor(s). MDPI and/or the editor(s) disclaim responsibility for any injury to people or property resulting from any ideas, methods, instructions or products referred to in the content. |
© 2025 by the authors. Licensee MDPI, Basel, Switzerland. This article is an open access article distributed under the terms and conditions of the Creative Commons Attribution (CC BY) license (https://creativecommons.org/licenses/by/4.0/).