Abstract
Small- and medium-sized enterprises (SMEs) play a vital role in the global economy, driving innovation and economic growth, despite constraints on their financial and operational resources. In the competitive landscape of modern markets, continuous product design improvement has become essential for SMEs to meet dynamic user requirements, enhance satisfaction, and maintain competitiveness. Online reviews have emerged as valuable sources of user feedback, offering real-time, large-scale insights into user preferences. However, existing methods for leveraging online reviews in product design improvement have significant limitations, including insufficient attention paid to the hierarchical structure of different attributes when extracting product improvement attributes and a lack of quantitative attribute prioritization strategies. These shortcomings often result in suboptimal improvement and inefficient resource allocation, particularly for SMEs with limited resources. To address these challenges, this study proposed a novel online review-assisted method for product design improvement tailored to the needs of SMEs. The proposed method incorporates a hierarchical latent Dirichlet allocation model to extract and organize product attributes hierarchically, thereby enabling a comprehensive understanding of user requirements. Furthermore, a marginal utility-based approach is employed to prioritize product improvement attributes quantitatively, ensuring that the most impactful attributes are addressed efficiently. The effectiveness of the proposed method was demonstrated through a case study on the design improvement of a robotic vacuum cleaner developed using a typical SME in robotic cleaning solutions.
1. Introduction
Small- and medium-sized enterprises (SMEs) are pivotal to the global economy, representing approximately 90% of businesses and more than 50% of employment worldwide [1]. These enterprises are vital to economic growth and play a crucial role in product development and innovation [2]. They drive technological advancement and adapt to changing market requirements, thereby enhancing competitiveness and fostering sustainable development [3,4]. In 2023, the number of SMEs globally was estimated at approximately 358 million, with Asia hosting the largest share [5]. In the United States, SMEs are integral to economic vitality, with small businesses employing nearly half of the private workforce [6]. In the European Union, SMEs constitute 99.8% of all enterprises in the non-financial business sector, with the manufacturing sector being one of the most significant key sectors [7,8]. In China, SMEs represent over 99.8% of all enterprises, contributing to more than half of the country’s tax income and over 79.4% of employment [9].
Product design improvement is a continuous process in which enterprises analyze market conditions to propose improvement methods for certain product attributes after use and develop new generations of products [10]. Product attributes are the specific characteristics, features, or properties of a product that define its quality, functionality, performance, and user experience. Collectively, these attributes determine a product’s value and influence user satisfaction. In an era of rapidly changing user preferences and technological advancements, identifying and prioritizing product attributes that require improvement are essential for SMEs, as they directly impact their ability to remain competitive in dynamic and often resource-constrained markets, thus, allowing SMEs to better meet user requirements, enhance their satisfaction, and differentiate themselves from competitors [11]. By continuously improving their product offerings, SMEs can increase their market share, build stronger brand loyalty, and open doors to new opportunities in both the domestic and international markets, thereby driving sustainable growth and resilience in an increasingly competitive global economy [12].
Traditional product design improvements focus on the internal structure and inherent functions of a product by analyzing its shortcomings [13]. Currently, as increasing attention is being paid to the interaction between products and their users, product design improvement has gradually evolved into an optimization path centered on user requirements [14]. Considering the product attributes mentioned in user feedback, enterprises aim to improve product design, thereby enhancing user satisfaction [15,16]. Existing studies on gathering user requirements primarily rely on approaches such as questionnaires, surveys, or interviews, which can be time-consuming, labor-intensive, and costly [17,18]. With the rapid development of e-commerce, online review systems and word-of-mouth websites have become increasingly sophisticated, resulting in a surge in the volume of online reviews [19,20]. Compared with traditional methods such as questionnaires and interviews, online reviews offer advantages such as large data volumes, broad coverage, real-time updates, and high authenticity, providing a more accurate reflection of users’ real needs and preferences [21]. According to a McKinsey report, mining and analyzing online reviews are highly beneficial for improving product designs [22]. Therefore, online reviews can provide timely and accurate support for product design improvement.
When improving product design, SMEs are often constrained by limited financial and operational resources, which makes it impossible to improve all product attributes comprehensively [23]. Because user requirements exhibit a dynamic iterative trend, the pace of product updates and iterations is accelerated [24]. Therefore, strategically allocating limited resources for the most impactful product improvements plays an important role for SMEs to maintain their market competitiveness [25]. Currently, although some studies have already paid attention to strategies for product design improvement based on online user reviews, they often fell short of addressing the specific needs of SMEs, i.e., comprehensive understanding of user requirements, prioritizing product improvement attributes, and deciding which should be improved immediately.
One key limitation is the inadequate utilization of online reviews, with insufficient attention being paid to the hierarchical structure of different attributes during the acquisition of product improvement attributes. This oversight may lead SMEs to miss critical insights into the attributes most valued by users or the nuanced aspects of dissatisfaction, resulting in suboptimal product improvements. Additionally, current studies rarely account for the asymmetric effects of attribute performance on user satisfaction or provide a robust framework for quantitatively prioritizing product improvements. Consequently, SMEs may allocate their limited resources to less impactful design changes, neglect urgent user concerns, and weaken their competitive market position.
Therefore, this study proposed a new online review-assisted product design improvement method for extracting and prioritizing product improvement attributes with the goal of optimizing resource utilization, reducing production costs, and minimizing waste, which are particularly crucial for SMEs with limited financial and operational resources. First, by considering the hierarchical relationships between different attributes, the hierarchical latent Dirichlet allocation (hLDA) model was used to construct a hierarchical tree of different product attributes from which product improvement attributes could be extracted. Second, using the marginal utility calculation, priority ranking of the extracted product improvement attributes was performed. Finally, the effectiveness of the proposed method was demonstrated using the design improvement case of a robotic vacuum cleaner developed by Narwal Robotics, which is a typical SME specializing in the development of innovative robotic cleaning solutions.
The remainder of this paper is structured as follows. Section 2 provides a brief overview of the current approaches to product design improvement. Section 3 presents details of the proposed product design improvement method. A case study based on a robotic vacuum cleaner demonstrates the proposed method in Section 4. A detailed discussion is presented in Section 5. Finally, Section 6 summarizes the study, highlights the significance of the findings, and suggests directions for future research.
2. Literature Review
2.1. Product Design Improvement Based on Online Reviews
Chatterjee [26] first defined the term “online reviews”, describing them as public evaluations of products, services, or businesses posted on e-commercial platforms. These reviews aim to communicate both positive and negative experiences to a wide audience. Typically, online reviews combine text, images, videos, and ratings, and they have become prevalent across e-commercial platforms, including Taobao, JD, Amazon, and TripAdvisor [27]. Online reviews help users to assess products and services while making purchase decisions, enhance trust and credibility between buyers and sellers, and aid prospective customers in their decision-making process [21].
Improving product design is an ongoing process where companies gather user feedback after product use, identify areas for improvement based on this feedback, develop strategies to enhance the product, and provide guidance for future product iterations, all aimed at increasing user satisfaction [14,28]. Compared to traditional methods, such as user interviews and questionnaire distribution [17], online reviews have become an effective method for obtaining product improvement insights because of their convenience and practicality of information [29]. Therefore, screening valuable online reviews from vast amounts of data is essential [30,31]. Forman et al. [32] evaluated the usefulness of online reviews in the context of online communities by considering the expertise and attractiveness of reviewers as two criteria for assessing the usefulness of their reviews. Banerjee et al. [33] argued that reviewer characteristics (positivity, engagement, experience, reputation, competence, and sociability) directly impact the usefulness of reviews. Karimi and Wang [34] suggested that visual cues can influence users’ assessments of whether a review is useful. To identify useful reviews, Qi et al. [35] proposed an automatic filtering model for online reviews that predicted the helpfulness of reviews for product designers based on the feature extraction and helpfulness evaluation of reviews. Malik and Hussain [36] used six mainstream machine learning algorithms to predict review usefulness by considering review content, reviewer aspects, and other variables, employing stochastic gradient boosting (SGB) as a method of prediction, and they found that review content had the greatest impact on model prediction.
With the development of human-centered product design concepts, users have become increasingly willing to participate in product design processes [37]. It is crucial for companies to mine product attributes and determine the real needs of users from useful review information to enhance their competitiveness. Jin et al. [38] proposed a framework for selecting representative opinionated comparative sentence pairs related to specific product attributes from online reviews of competitive products to help designers conduct detailed analyses of competitors’ products. Zhang et al. [39] processed online review data from three Huawei Mate smartphones, extracted 11 customer-focused attribute features, and discussed the correlation between smartphone improvement and the feature focus and satisfaction of these 11 attributes. Lee et al. [40] proposed a method called Mining Perceptual Map (MPM) to automatically construct perceptual maps and radar charts from online consumer reviews to help companies position new products. Zhang et al. [41] developed a new integrated embedding method for generating semantic and contextual representations of words in review sentences to identify and extract innovative products ideas. Huang et al. [42] proposed the latent Dirichlet allocation–interval grey number quality function deployment (LDA–IGQFD) method, which utilized customer requirements (CRs) and competitive market information (CIs) from online user reviews to drive product development.
The above studies indicate that collecting and analyzing online reviews that are useful for product design improvement can provide strong data support for guiding product design improvement. From the listed research, the focus has shifted from initially focusing on review features that affect product design improvement to deeply analyzing user opinions and sentiment tendencies. Moreover, research results are mostly presented in the form of sentiment evaluations of product attributes.
2.2. Product Attribute Acquisition Based on Online Reviews
Product attributes generally refer to the features of a product, which play a crucial role in shaping user assessments and decisions [43]. Lancaster [44] argued that “consumers do not merely purchase products but acquire a variety of characteristics” and proposed the “Attribute Theory of Consumer Behavior”. He identified attributes that fulfill consumers’ physical, social, and emotional needs, advising that consumers assess products based on these factors [44]. By extracting descriptive attribute terms from large sets of online review texts, companies can develop more effective strategies for improving their products [39]. In previous research, scholars have proposed various attribute extraction methods, which can be divided into two categories: manual definition [45] and machine learning [46,47,48,49]. Manual definitions involve domain experts summarizing various product attributes and establishing an attribute table. This method is relatively accurate but lacks generality and dynamism and is time-consuming and labor intensive [45].
By contrast, machine learning methods utilize natural language processing (NLP) techniques to automatically extract product attributes through part-of-speech tagging [46], syntactic analysis [47], text pattern and syntactic dependency analysis [50], and other methods. These methods have been widely used in recent years and are currently the mainstream approaches for attribute acquisition. Machine learning-based methods include extraction based on high-frequency nouns or noun phrases [46], grammatical rules [49,50], and topic models [49]. Hu and Liu [46] pioneered work based on high-frequency noun extraction using part-of-speech tagging to extract nouns or noun phrases and association rules to find frequent item sets. They then supplemented low-frequency attribute words with neighboring words. Subsequent studies made several improvements to this method [47,48]. Xie, Wu and Zhu [50] proposed a sequential pattern-mining-based document-specific key-phrase extraction method that used wildcards (or gap constraints) to extract sequential patterns. In topic-model-based attribute extraction, the most representative method is latent Dirichlet allocation (LDA) [30], which identifies multiple topics in documents, determines the proportion of each topic in a document, and specifies the probability of assigning a particular word to each topic [51]. Tirunillai and Tellis [52] used LDA to analyze online review data and concept maps to express the key attributes of products and consumer brand identification. Kim and Kang [53] used a ratio analysis of words, latent semantic analysis (LSA), and LDA to extract vocabulary related to product-distinguishing attributes and conducted context and sentiment polarity analysis. Li et al. [54] generated a set of product attributes using the term frequency–inverse document frequency (TF–IDF) method and expert consultation and then used LDA to add more attributes to the product attribute set. Wang et al. [55] extracted product attributes of interest to users using the TF–IDF method and used the K-means algorithm to segment these attributes into functional modules.
The acquisition of product attributes is an important step in the process of product design improvement. Different attributes describe a product from different perspectives and express concepts at different granularity levels, thereby exhibiting a certain hierarchical relationship. This hierarchical relationship makes it difficult to clearly describe a product or express needs using single-level attributes alone. However, current research often focuses on the extraction of single-level attributes, neglecting the hierarchy of attributes. This can make it difficult to fully capture user requirements and the multidimensional characteristics of products during the product design improvement process.
2.3. Product Attribute Prioritization
Prioritizing the order of product attributes allows managers to clarify the importance of each attribute, allocate resources appropriately to improve attribute performance, and maximize consumer satisfaction [56]. Studies on attribute prioritization typically integrate sentiment analysis results after attribute identification, classify the attributes, and determine the sequence of improvements, thereby providing decision support for product improvement [57,58,59,60].
Among the many theories of requirement modeling, the Kano model proposed by Noriaki Kano [57,58] is an established tool for requirement analysis that can help product design teams identify the product attributes that are key to enhancing product value. The model classifies product attributes into five categories: must-be, one-dimensional, attractive, reverse, and indifferent attributes. Expanding upon the Kano model, scholars have consistently improved and deepened the theory of requirement analysis. Berger et al. [61] introduced two indicators to measure the overall perception of quality elements: the CS indicator, which reflects performance satisfaction, and the DS indicator, which represents dissatisfaction. Yang [62] proposed an extended method for Kano model classification based on Berger’s research by introducing four additional attribute element classification results related to user importance and satisfaction indicators. Wu and Wang [63] addressed the issues of imprecise user requirement language sources and discontinuous classification in the traditional Kano model by introducing a continuous fuzzy Kano evaluation method and establishing quantitative evaluation indicators for product attribute classification. Violante and Vezzetti [56] summarized the construction methods of the Kano model in current user requirement analysis research, categorizing these models into qualitative and quantitative types to assist quality managers and researchers in selecting suitable requirement analysis models. Sun et al. [64] proposed the customer–manufacturer Kano (CM-Kano) model to analyze the evolving opinions of users and manufacturers, thereby providing improvement strategies for product design. Song et al. [65] applied the Kano model to classify product attributes and used the grey theory and Markov chains to predict the temporal state of user requirement and support design decisions. However, there are limitations in current research utilizing the Kano model for customer requirement analysis. Despite the significant advantages of the Kano model for identifying and classifying customer requirements, the description of product attributes is relatively macroscopic and lacks an in-depth analysis of the complex relationships between specific attributes. Theories combined with the Kano model are mostly mathematical models, and there is a lack of applied research on the quantitative classification of the relationship between attributes and satisfaction.
Martilla and James [66] first proposed importance—performance analysis (IPA), which plots attributes on an importance—performance chart based on their importance and performance. Attributes are categorized into four quadrants to determine the priority of improvements and to help managers quickly understand user requirements and the performance and improvement space of products or services. Based on online reviews with numerical ratings, Nam and Lee [67] used IPA and LDA to calculate the importance of product attributes and numerical ratings to evaluate product performance. Albayrak [59] proposed asymmetric impact competitor analysis (AICA) based on the IPA model that considers both the asymmetric impact of product attributes on user satisfaction and competitor information related to product attributes using the asymmetric impact index of product attributes and relative performance values to determine attribute priority. Mikulić and Prebežac [60] used a backpropagation neural network for IPA based on online reviews to evaluate the importance of product attributes. Wu et al. [68] identified the priority of functional improvements for products or services using a dynamic IPA of online reviews. Li et al. [69] introduced a Kano-IPA model that preserves the conventional importance metrics used in IPA, while modifying priorities according to the Kano classification. Wang et al. [70] created a sentiment-driven IPA (SIPA) model to assess the classification of product features and inform product development strategies.
The above studies categorized attributes into different strategic intervals based on attribute performance, asymmetric impact, and importance and determined attribute priority based on these intervals. However, these studies did not quantify the relationship between attribute performance and satisfaction, making it difficult to determine attribute priority within the same strategic interval. This results in imprecise resource allocation during the product design improvement process, which affects the effectiveness of the product improvements.
3. Product Improvement Attribute Extraction and Prioritization Method
This study proposed an online review-assisted product improvement attribute extraction and prioritization method. As shown in Figure 1, the method consists of two parts: product improvement attribute extraction based on the hLDA model and product improvement attribute prioritization based on marginal utility.

Figure 1.
Framework of the product improvement attribute extraction and prioritization method.
In the first part, online review data, including review time, review score, review content, user credit rating, and number of likes, are collected from an e-commercial platform. A utility analysis is then conducted using user credit ratings, number of likes, and review time to filter out low-utility review content. Based on this, preprocessing is performed on the review contents, including data cleaning, word segmentation, tagging, and stop word removal, to obtain the effective review content, which is used as the input of the hLDA model. Finally, a hierarchical tree of product improvement attributes is generated, and the lowest-level attributes in the hierarchical tree are considered as product attributes that should be improved.
In the second part, by making use of the effective review content, a sentiment lexicon is constructed by adding synonyms, popular Internet terms, and domain-specific sentiment words extracted using the SO–pointwise mutual information (PMI) algorithm. By combining the sentiment lexicon with product improvement attributes, sentiment labels can be extracted through dependency syntax analysis from the review content and quantified to obtain sentiment values for each product improvement attribute. Next, based on the obtained sentiment values, the Kano model is adopted to classify the types of product improvement attributes. Finally, marginal utility functions are constructed according to the classified types of product improvement attributes, and the marginal utility of each attribute can be calculated to effectively prioritize the product improvement attributes.
3.1. Product Improvement Attribute Extraction Based on the hLDA Model
Before prioritizing product improvement attributes, it is necessary to extract them. Compared with the traditional method that only focuses on single-level attribute extraction, to reflect user requirements more accurately and comprehensively, this study used the hLDA model to construct a hierarchical tree of different product attributes, from which product improvement attributes could be extracted. The detailed steps related to product improvement attribute extraction are presented hereafter.
3.1.1. Data Collection and Preprocessing
Review data, including review time, review score, review content, user credit ratings, and number of likes, should first be gathered from the e-commercial platform. Then, by calculating the utility value of each review content, low-utility review content is eliminated. The utility value is calculated as follows:
Assume that represents the set of review content for a product, where represents the review content of the product and that , , , and represent the total utility, utility of user credit rating, utility of number of likes, and utility of timeliness for review, , respectively.
where G is the total number of credit ratings assigned to users by the e-commercial platform, and is the credit rating of the user corresponding to review content, .
where represents the number of likes for review content, , and represents the highest number of likes given by users among all online reviews of the product.
where represents the time when review content, , is posted, represents the starting time when review data were collected in this study, and represents the earliest posting time among all the online reviews of the product.
Considering that the total utility of reviews is affected by all three types of utility, we combine , , and to quantify the total utility of the review content. The equation is as follows:
where , , and represent the weights of , , and , respectively, with and
Online reviews with low utility values are filtered out, and the selected review content is preprocessed through steps such as data cleaning, word segmentation, tagging, and stop word removal to obtain effective review content. The obtained effective review content is then stored in a structured format for the product improvement attribute extraction step.
3.1.2. Product Improvement Attribute Extraction
Words in effective review content are merged to generate a word list that does not contain repetitive words. Then, word frequency analysis is performed based on the word list, and the frequency of each word in the review content is counted. Finally, a review content-word matrix is generated, which serves as the input for the hLDA model, and a hierarchical topic tree is generated using the hLDA model.
To obtain the hierarchical topic tree, the parameters of the hLDA model [71], including the parameter of the topic prior distribution, the parameter for the nested Chinese Restaurant Process (nCRP), the parameter of the Dirichlet distribution, and the tree depth parameter , should be set up to provide the foundation for subsequent posterior inference. Here, controls the sparsity of word distributions within each topic, governs the probability of review content generating new paths, controls the sparsity of topics within each review contents, and defines the number of layers in the hierarchical topic tree.
Once all relevant parameters of the hLDA model are defined, the hLDA model can assign initial topics to words in each review content. A topic is defined as a collection of related words collectively representing a specific concept or meaning. Subsequently, posterior inference is performed via Gibbs sampling [72] to iteratively update the topic assigned to each word in the review content. During the iteration process, topic assignments can be adjusted automatically based on the topic-word and review content-path distributions. This iteration stops when the topic-word and review content-path distributions converge to stable values. Thus, a hierarchical topic tree is generated.
Although a hierarchical topic tree reflects topics and their hierarchical relationships, it does not explicitly map these topics to specific product attributes or reveal the hierarchical relationships among them. Therefore, it is necessary to prune the hierarchical topic tree to obtain the hierarchical relationships of the product improvement attributes. The pruning steps are summarized as follows.
First, the number of review contents of each topic is compared with those of other topics at the same level from the bottom to the top, and the topics with fewer review contents are deleted to identify the topics that are most in line with user concerns. Second, the PMI algorithm [73], which evaluates the correlation between words, is iteratively applied to calculate the correlations of words in each topic, and words with a high correlation in each topic can be selected. Manual adjustments might be carried out in this step, to remove or combine certain words. Then, these selected words can be used to derive topics into product improvement attributes. Words referring to a specific characteristic, feature, or property of a product can be extracted directly as attributes. As for words that cannot be used directly as product improvement attributes, designers should consider them carefully and try to further classify them into certain product improvement attributes according to the user emotions or usage scenarios expressed by the words. Through this process, an initial hierarchical tree of the product improvement attributes can be constructed.
Finally, because the initial hierarchical tree of product improvement attributes may exhibit hierarchical gaps, indicating that the number of layers traversed from the root node to each leaf node is inconsistent, it is necessary to bridge the hierarchical gap by adding higher-level attributes above the leaf nodes or lower-level attributes below them in the initial hierarchical tree to generate the final hierarchical tree of the product improvement attributes, and the lowest-level attributes in the hierarchical tree are considered as the product attributes that should be improved.
3.2. Product Improvement Attribute Prioritization Based on Marginal Utility
3.2.1. Sentiment Analysis for Product Improvement Attributes
Sentiment analysis refers to the process of analyzing sentiment polarity and intensity in textual data using NLP and text mining techniques. In this study, sentiment analysis was employed to evaluate the performance of the extracted product improvement attributes quantitatively in preparation for subsequent marginal utility calculations. A comprehensive sentiment lexicon tailored to the required design domain can be obtained by adding synonyms, popular Internet terms, and domain-specific sentiment words extracted using the SO–PMI algorithm [74] to existing sentiment lexicon resources, such as Hownet [75] and NTUSD [76] in Chinese, or SentiWordNet 3.0 [77], SenticNet [78] and VADER [79] in English.
By combining the sentiment lexicon with product improvement attributes, sentiment labels can be extracted from the review content through a dependency syntax analysis. Once the sentiment labels have been extracted from the review content, it is necessary to quantify the sentiment words in the labels based on certain criteria. In general, sentiment words can be categorized into three types: sentiment polarity words, intensity adverbs, and negation words [80]. In this study, following the principle proposed by the Hownet sentiment lexicon, positive sentiment polarity words were assigned a utility value of 1, whereas negative sentiment polarity words were assigned a utility value of −1. If no sentiment polarity words were found, the utility value was set to 0. Intensity adverbs were assigned utility values based on their impact on sentiment intensity, ranging from high to low at 2, 1.8, 1.6, 1.4, 1, 0.8, and 0.5. If no intensity adverbs were present in the review content, the utility value was set to 1. If a negation word was present, the utility value was set to −1.
Considering the predefined utility values of the three types of sentiment words, the sentiment values of the words for each product improvement attribute assigned by the hLDA model can be obtained using the following equation:
where represents the sentiment value of word , and , , and represent the utility values of sentiment polarity words, intensity adverbs, and negation words corresponding to word , respectively. Subsequently, based on the sentiment value calculation results, words are classified to identify those that exhibit positive and negative sentiments. Finally, the phrases <word, sentiment value> for each review content are obtained.
The sentiment values of the product improvement attributes are calculated based on a single review, and the word sentiment values under the same product attribute are combined to obtain positive or negative sentiment values using the following equation:
where represents the positive sentiment value of attribute in review content , represents the total number of words for attribute in review content , and represents the sentiment value of word that is classified as a positive sentiment in the phrases <word, sentiment value> from review content for attribute .
where represents the negative sentiment value of attribute in review content , and represents the sentiment value of word that is classified as a negative sentiment in the phrases <word, sentiment value> from review content for attribute . The meanings of the remaining parameters are the same as those in Equation (6).
Finally, the calculation method for the overall sentiment value of the product improvement attributes is as follows:
where represents the sentiment value of attribute in review content , represents the overall sentiment value of attribute , and represents the total number of review contents containing attribute .
3.2.2. Product Improvement Attribute Classification
After calculating the positive and negative sentiment values of each product improvement attribute in each review, we constructed a regression equation based on the Kano model [81], as shown in Equation (10), to analyze the impact of attribute performance on user satisfaction.
where is the users’ overall evaluation of a product. Generally, e-commercial platforms invite users to evaluate a product. For example, some platforms use a scale of “one star” to “five stars” after shopping, where “one star” indicates the worst user experience and “five stars” is the best. As a result, this study assigned values of 1–5 to the accordingly. and are calculated using Equations (6) and (7), respectively: and are the reward coefficient and penalty coefficient of attribute , respectively, reflecting the degree of change in satisfaction caused by a slight change in attribute performance.
After constructing the regression equation, we determined the types of product improvement attributes based on the Kano model. The method involves the positional relationship of points A(1, ), B(−1, ), and O(0, 0) in the model. Specifically, the attribute type can be determined by comparing the parameters and of the straight line connecting points A and B with the thresholds and . The calculation of and is shown in Equations (11) and (12), respectively.
As shown in Figure 2, the specific steps of the attribute-type decision process are as follows:
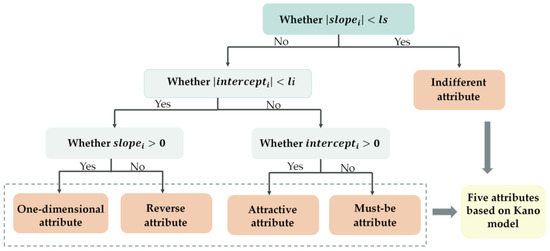
Figure 2.
Attribute-type decision process.
When the absolute value of is less than or equal to the threshold, , the straight line, , is essentially parallel to the horizontal axis, indicating that the attribute is an indifferent attribute. The indifferent attribute refers to aspect that is neither good nor bad, and it do not result in either user satisfaction or dissatisfaction.
When the absolute value of is less than or equal to the threshold , points A and B are considered to be on the same straight line as the origin. At this time, if of the straight line, , is greater than 0, the attribute is a one-dimensional attribute. The one-dimensional attribute results in satisfaction when fulfilled and dissatisfaction when not fulfilled. When of the straight line, , is less than or equal to 0, the attribute is a reverse attribute. The reverse attribute refers to a high degree of achievement resulting in dissatisfaction and to the fact that not all users are alike.
When the absolute value of of the straight line, , is greater than the threshold, , the straight line has deviated from the origin. At this time, if of the straight line, , is greater than 0, the attribute is an attractive attribute. The attractive attribute refers to the attribute that is not normally expected by users. When this attribute is achieved fully, users become satisfied, but it does not cause dissatisfaction when not fulfilled. If of the straight line, , is less than or equal to 0, the attribute is a must-be attribute. The must-be attribute refers to the attribute that users expect and take for granted. When this attribute is fulfilled, users remain neutral, but when it is not fulfilled, users become very dissatisfied.
3.2.3. Prioritization of Product Improvement Attributes
After identifying the types of product improvement attributes, the marginal utility is used to prioritize the improvement attributes. This method comprises three steps: satisfaction function construction, attribute marginal utility calculation, and attribute prioritization. The details of each step are as follows:
- (1)
- Satisfaction function construction
The satisfaction function describes the relationship between user satisfaction and attribute performance. The basic assumption is that a direct proportional relationship exists between user satisfaction () and product attribute performance (). This relationship is expressed by the following linear equation:
where and are curve parameters representing the slope and intercept, respectively.
Based on this, we set the satisfaction function as follows:
where represents user satisfaction with product improvement attribute , and represents the performance of product improvement attribute . Specifically, the satisfaction functions constructed for different types of attributes in this study are as follows:
For the must-be attribute, the satisfaction function is shown in Equation (15):
For the one-dimensional attribute, the satisfaction function is shown in Equation (16):
For the attractive attribute, the satisfaction function is shown in Equation (17):
For the reverse attribute, the satisfaction function is shown in Equation (18):
For the indifferent attribute, the satisfaction function is shown in Equation (19):
where and are the curve parameters. Because user overall satisfaction is influenced by various product attributes, this study constructed an overall satisfaction function and employed nonlinear regression to estimate the parameters of the above satisfaction functions. The overall user satisfaction function constructed in this study is as follows:
where represents the score of a specific review, is the overall user rating of the product, represents user satisfaction with the product improvement attribute, , is the weight of the product improvement attribute, , calculated using the TF-IDF algorithm [82], and represents the error.
- (2)
- Attribute marginal utility calculation
The marginal utility of an attribute refers to the additional user satisfaction or utility gained from a one-unit increase in the product attribute performance, assuming that all other factors remain constant. This study assumed that the attributes were independent and constructed a marginal utility function based on the satisfaction function described above. Here, marginal utility, , is defined as follows:
where , , and represent the changes in the overall user satisfaction, user satisfaction with the product improvement attribute, , and performance of the product improvement attribute, , respectively.
Therefore, we define a specific calculation equation for the marginal utility function of each attribute type as follows:
For must-be attributes, the marginal utility function can be obtained using Equation (22):
For one-dimensional attributes, the marginal utility function can be obtained using Equation (23):
For attractive attributes, the marginal utility function can be obtained using Equation (24):
For reverse attributes, the marginal utility function can be obtained using Equation (25):
For indifferent attributes, the marginal utility function can be obtained using Equation (26):
- (3)
- Prioritization of product improvement attributes
Finally, based on the marginal utility function, the marginal utility of each product improvement attribute is calculated using the current attribute performance level. Attributes are then prioritized according to their marginal utility values, where attributes with higher marginal utility indicate that their improvement can lead to a greater increase in user satisfaction and should, therefore, be prioritized for improvement.
4. Case Study
4.1. Product Improvement Attribute Extraction Based on Online Reviews
The effectiveness of the proposed method was demonstrated using the design improvement case of a robotic vacuum cleaner, NARWAL J4, developed by Narwal Robotics, which is a typical SME specializing in the development of innovative robotic cleaning solutions. Online reviews collected from the JD e-commercial platform served as experimental data. Figure 3 illustrates an example of an online review gathered from the JD e-commercial platform, including user credit rating, review score, review content, review time, and number of likes.

Figure 3.
Online review example of the JD e-commercial platform 1.
Using web crawling techniques in Python 3.11.5, 3349 online reviews of NARWAL J4 from 3 December 2023 to 2 June 2024 were collected. Examples of the collected review data are presented in Table 1, the review contents of which were translated into English.

Table 1.
Examples of the collected review data for NARWAL J4.
Subsequently, we conducted a utility analysis of the collected review data using the utility functions described in Section 3.1.1. For each review, the utility values of the user’s credit rating, number of likes, and timeliness were calculated. Based on previous studies and the metrics defined in this study, the weights for different utility values , , ) were adopted to calculate the total utility of each review content, as shown in Table 2. Considering the total utility, the top 80%, that is, a total of 2678 review contents, were selected for the following preprocessing step.
Table 2.
Example of utility calculation results for reviews.
After data preprocessing, including data cleaning, word segmentation and tagging, and the removal of stop words, 2420 effective review contents were obtained for the following steps of product improvement attribute extraction.
The words from 2420 effective review contents were merged to generate a word list that did not contain repetitive words. Word frequency analysis was then performed based on the word list to generate the review content-word matrix, which served as the input for the hLDA model.
In this case, the key parameters of the hLDA model were set as follows: , , , and . Subsequently, posterior inference was performed via Gibbs sampling to iteratively update the topic assigned to each word in the review content. When the model was iterated up to 100 times, the topic-word and review content-path distributions converged to stable values. A hierarchical topic tree was then generated, which included 11 primary topics and 110 secondary topics. Next, based on the hierarchical topic tree pruning steps mentioned in Section 3.1.2, the final hierarchical tree of the product improvement attributes (with 6 primary and 11 secondary attributes) was obtained, as shown in Figure 4. Specifically, during the manual adjustment phase, irrelevant topics, such as Topic 3–5 (e.g., “user”, “review”, “sticker”, “housework”) and Topic 9–4 (e.g., “order”, “baby”, “homework”, “J3”), are identified and removed. For certain words under specific topics, such as “cleaning”, “effect” or “mode”. The individual words, like “cleaning”, “effect” and “mode”, cannot be used to directly express a certain attribute of the product, but the combinations of these words, such as “cleaning effect” and “cleaning mode”, does convey much clearer improvement attributes. We trace back to the original review contents to understand their context better. The terms “cleaning effect” and “cleaning mode” are, thus, proposed to enhance the clarity and interpretability of the product improvement attributes. Finally, the 11 secondary attributes in Figure 4 were identified as the product improvement attributes, that is, cleaning effect, cleaning mode, noise, interaction mode, mapping, obstacle avoidance, appearance, delivery service, after-sales service, price, and material.
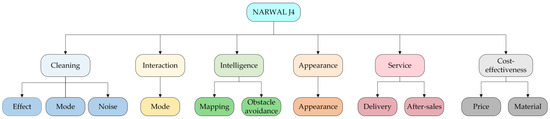
Figure 4.
Final hierarchical tree of the product improvement attributes.
4.2. Product Improvement Attribute Prioritization Based on Online Reviews
Before calculating the marginal utility, sentiment analysis was used to quantitatively evaluate the performance of the extracted product improvement attributes. First, a comprehensive sentiment lexicon containing 769 sentiment words tailored to the design domain of robotic devices was constructed by extending Hownet and NTUSD, two widely used Chinese sentiment lexicons, with synonyms, popular Internet terms, and domain-specific sentiment words extracted from crawled online review contents using the SO–PMI algorithm. Subsequently, by combining the sentiment lexicon with the obtained product improvement attributes of NARWAL J4, sentiment labels were extracted from the review content through dependency syntax analysis. The positive and negative sentiment values of the product improvement attributes in each review were then calculated. The calculation results are presented in Table 3.
Table 3.
Positive and negative sentiment values of product improvement attributes.
Finally, based on the results in Table 3, the sentiment values of the product improvement attributes for each review content were calculated using Equation (8). The overall sentiment value for each attribute was obtained using Equation (9). The quantitative results for the attribute sentiment values are presented in Table 4.
Table 4.
Quantitative results of the attribute sentiment value.
Next, using the positive sentiment value, negative sentiment value of product improvement attributes, and score of each review content for regression analysis, the reward coefficient , penalty coefficient , , and for each product improvement attribute can be calculated using Equations (11) and (12). In this case, was set to 0.005, and was set to 0.001. Following the attribute-type decision process shown in Figure 2, product improvement attributes were classified. The classification results for the 11 product improvement attributes are listed in Table 5.
Table 5.
Product attribute types.
Finally, based on the product improvement attribute types, the overall satisfaction function was constructed using Equation (20), and a nonlinear regression was performed to obtain estimates for and . Subsequently, using the value of , Equations (22) and (24) were applied to calculate the marginal utility values for each product improvement attribute. As shown in Table 6, the priority ranking of the product improvement attributes was as follows: after-sales service, obstacle avoidance, noise, cleaning effect, delivery service, interaction mode, price, appearance, cleaning mode, material, and mapping.
Table 6.
Marginal utility function parameters and marginal utility values of product improvement attributes.
By referring to the datasheet of NARWAL J4 and its successor, NARWAL J5, the authors attempt to determine which attributes of NARWAL J4 have been improved by the enterprise. A comparison of the results of the extracted product improvement attributes of the two types of robotic vacuum cleaners is shown in Figure 5. This comparison provides substantial evidence that supports the effectiveness of the proposed online review-assisted product design improvement method. The comparison between NARWAL J4 and NARWAL J5 indicated that most of the high-priority product improvement attributes identified by the method (blue rows in Figure 5), such as after-sales service and obstacle avoidance, were addressed by the enterprise. These improvements align with user expectations and are likely to significantly contribute to enhanced user satisfaction and market competitiveness. Conversely, low-priority attributes, such as mapping and material, did not improve (green rows in Figure 5). An interesting phenomenon observed in the analysis was the unimprovement of two high-priority attributes, noise and price, in NARWAL J5 (orange rows in Figure 5). We find that the noise made by NARWAL J5 is slightly louder than that made by NARWAL J4, which may be a side effect of increasing the suction power of J4, and the designers of the enterprise might consider that a 1 dB noise increase is acceptable to users when providing a new generation of product with higher suction power. Additionally, the price of the successor of NARWAL J4 is increased by the enterprise. This observation suggests a potential misalignment between user-centric priorities and design decisions made during the development of NARWAL J5; thus, it may not yield substantial improvements in user satisfaction. Although there may be strategic motivations behind this change, such as aligning with technological advancements or differentiating the product from its competitors, it is essential for SMEs to carefully evaluate the tradeoffs involved.
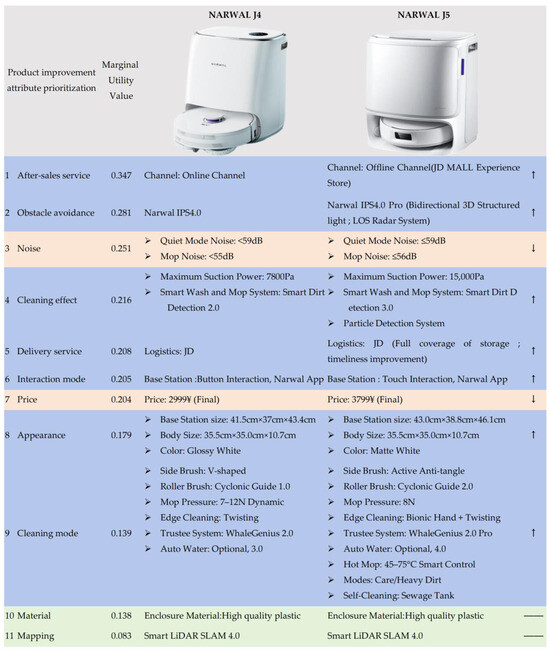
Figure 5.
Comparison of the extracted product improvement attributes of NARWAL J4 and NARWAL J5.
5. Discussions
5.1. Main Findings
To assist SMEs in improving product design, this study proposed a method for product attribute extraction and prioritization based on online reviews. Compared with traditional methods, the main findings of the proposed method are as follows:
- This study employed the hLDA model to extract multi-level attributes from online reviews, thereby providing a more nuanced depiction of user concerns at various requirement levels. This enables SMEs to promptly pinpoint the most urgently needed attributes, offering more detailed decision support for subsequent development and improvement strategies, and ultimately enhancing overall user satisfaction and market competitiveness;
- This study approached this issue from the perspective of the asymmetric relationship between attribute performance and consumer satisfaction, integrating the marginal utility for the priority ranking of product improvement attributes and measuring how much each attribute, at its current performance level, could increase satisfaction if slightly improved. This approach allows for a refined determination of the improvement order, even within the same strategic interval, aiding SMEs in allocating limited resources more strategically to maximize overall user satisfaction;
- The performance evaluation of the proposed method has been conducted by comparing with the Importance-Performance Analysis (IPA) approach [83], which can also be used for ranking the priority of product improvement attributes. The comparison results show that the proposed method outperforms the IPA model in terms of attribute extraction comprehensiveness and priority ranking accuracy. According to the principle of IPA approach, the priority ranking of product improvement attributes can be obtained by mapping the attributes into four-quadrant matrix based on their importance and performance. However, when two attributes with different levels of importance and satisfaction fall within the same quadrant, it becomes challenging to determine the precise order of improvement. For example, the ranking result obtained by IPA approach shows the satisfaction level of the attribute “Delivery service” is lower than that of the attribute “Cleaning mode”, but its importance level is higher. When importance and satisfaction matrix are intertwined in such manner, it becomes difficult to determine the priority between the attributes “Delivery service” and “Cleaning mode”.
5.2. Implementations
This subsection outlines the implementation of the proposed method in real-world product development process. Specifically, we discuss how the method can be integrated into existing product development workflows to improve the iterative design and complement the traditional multi-criteria decision-making (MCDM) techniques.
- The proposed method is primarily designed for the “redesign” process, rather than the typical new product development (NPD) process. Specifically, the proposed method focuses on extracting product attributes that require improvement for the next-generation product by analyzing online reviews provided by users. Currently, various design methods have been proposed to support the new product development process, such as the Comprehensive Design Methodology [84], the V-model [85], VDI 2221 [86], and Axiomatic Design [87]. While each method has its unique focus, they generally follow a structured, iterative process that begins with specifying the user requirements and leads through various stages, such as functional analysis, conceptual design, detailed design, prototyping, validation and verification, and iterative improvement. Therefore, in the context of existing product development workflows, the proposed approach can be considered an effective tool to support both of the user requirement specification and the iterative improvement stages, which helps the SMEs to achieve the iterative design improvement by extracting the user requirements from online review and providing data-driven evidence of areas where improvements are most required by the users.
- Currently existing MCDM methods, such as AHP [88], ANP [89], TOPSIS [90], and DEMATEL [8], have been widely used in NPD to facilitate quantitative analysis of multiple attributes. These methods rely on expert input and subjective judgment to assign weights and prioritize the importance of various product attributes. While these methods have advantages, such as low cost and the ability to analyze multiple attributes quantitatively, they are dependent on expert panels and typically require structured surveys or consultations, which can introduce biases or fail to capture the full spectrum of user preferences. In contrast, the proposed method extracts the product attributes which should be improved directly from online reviews provided by users and rank them. This makes the proposed method more objective and data-driven, as it reflects the real-world preferences and concerns of actual users, rather than relying on the opinions of a small group of experts. By analyzing a large volume of user-generated content, the proposed method offers insights that are more representative of the broader user base and provides a more comprehensive understanding of user needs. Another key advantage of the proposed method is its scalability and adaptability. Traditional MCDM methods are typically more static, as they require predefined stages of expert input. The proposed method in this study, however, is dynamic, allowing for real-time updates as new user feedback is collected. This ensures that SMEs can continuously adjust their product development based on current user needs, rather than relying on periodic surveys or expert opinions. Considering the advantages of the proposed method compared with existing MCDM methods, the proposed method could be used as an effective support to complement the existing MCDM techniques by providing the necessary input data for attribute selection. The attributes derived from the online reviews, but not from the expert opinions, could serve as a more objective and accurate basis for the decision-making process, aligning with the principles of MCDM while adding an extra layer of robustness and relevance to the attribute selection.
5.3. Limitations with Opportunities for the Future Study
Although the proposed method facilitates effective product design improvements, the inherent complexity of product design and the varied and dynamic nature of online reviews imply that this study had several limitations.
- This study collected review data from an e-commercial platform and used online reviews of a robotic vacuum cleaner for the empirical analysis. Although this method verified the effectiveness of the method constructed by the research institute to a certain extent, owing to the use of a single data source and the industry scope, it is not clear whether the same results can be achieved in other industries and using other data sources. Specifically, e-commercial platforms typically collected review data only from actual buyers, thereby partly excluding noise introduced by non-buyers. By contrast, data sources such as specialized communities and social media often encompassed review data from non-buyers, along with anecdotal experiences unrelated to product quality, which could introduce additional noise and potentially compromised the proposed method’s applicability. Moreover, this study demonstrated the method’s applicability using only a single product category—the robotic vacuum cleaner. However, compared with robotic vacuum cleaner, products such as automobiles or heavy machinery involved a larger array of attributes and more complex user requirements, which means the applicability of this method to more complex products such as automobiles or heavy machinery remains to be verified. To further enhance the robustness and applicability of the method, future research could conduct empirical analysis by collecting review data from multiple data sources, such as social media, specialized communities, and professional review websites. Additionally, cross-industry tests may be conducted on various product types to thoroughly evaluate the performance of the research framework in diverse settings.
- This study conducted a static analysis of review data within a specific time period to prioritize product improvement attributes, but this method did not fully consider the characteristics of user requirements evolving over time. Although this static analysis can provide enterprises with certain product improvement suggestions in the short term, the rapid changes in market and user requirements have placed higher requirements on SMEs. Therefore, it may be necessary to further consider dynamic analysis on the basis of marginal utility to formulate a better priority ranking of product improvement attributes. If we only rely on static analysis of current review data, we may ignore the changing trends of user requirements hidden behind these review data, which will make it difficult for enterprises to grasp the growth or decline of user requirements in advance and make timely adjustments to product design improvements. For example, after collecting the latest review data, enterprises immediately conduct static analysis, but this results only reflect the user requirements status at the current time period, without considering how these requirements will fluctuate or change in the future. For SMEs with relatively limited resources, this lack of forward-looking decision making may make it more difficult for them to survive and compete in a fierce market environment. Future research could incorporate the time dimension into its analytical framework by establishing dynamic evaluation and monitoring models—for example, through phased or rolling-window analyses—to capture shifts in user requirement and update attribute priority rankings on an ongoing basis. Concurrently, techniques such as time-series analysis and dynamic Bayesian networks could be applied to historical data to combine the potential trend of future requirements with the results of current static analysis, helping SMEs to be more forward-looking in product improvement attribute prioritization decisions.
- In this study, the priority ranking of product attributes that should be improved was mainly measured from the perspective of user satisfaction. However, as illustrated in Section 4, two high-priority attributes, that is, noise and price, were not improved in NARWAL J5. These design improvement decisions made by the enterprise may not yield substantial improvements in user satisfaction; however, there may be strategic motivations behind these design changes, such as alignment with technological advancements, increasing development cost or differentiating products from competitors. Therefore, in real-world situations, SMEs must also consider other factors, besides user satisfaction. If the dynamics of competitive products or technological advancements are ignored, and the SME focuses on online review analysis of the product, it may cause the SME to miss an opportunity to gain an advantage in an increasingly competitive market. Future research could consider introducing an analysis of competitive and technological factors when prioritizing attributes. It is essential for SMEs to consider competitive and technological factors, collect relevant information, and quantitatively evaluate the tradeoffs involved. In terms of methods, the quality function deployment model can be integrated. The core idea of this model is not only to focus on how effectively the product meets various consumer requirements and the relative importance of these requirements, but also to consider the different degree to which both the product and its competitors fulfill the same requirements in order to measure their competitive gap, and combine technological factors to make comprehensive considerations, so as to formulate improvement strategies and resource investment plans more targeted. Therefore, this idea can be combined with the product improvement attribute prioritization method based on marginal utility proposed in this study, that is, not only accounting for the marginal utility of different product improvement attributes but also fully considering the competitive gap between the product and its competitors in those attributes, along with relevant technological factors. Through this, we can leverage the advantage of marginal utility in evaluating requirement-side value while simultaneously ensuring that the requirement to achieve maximal competitive advantage at minimal cost is satisfied, so as to achieve more accurate and more practical product improvement attribute priority ranking.
- With the rapid development of artificial intelligence (AI) technology, generative AI has shown significant potential in various domains. By training large-scale datasets and combining deep learning algorithms, generative AI models (such as large language models) can not only generate high-quality content similar to training data but also conduct in-depth real-time analysis and understand complex scenarios and dynamic data, providing the possibility for more accurate decision making. In the future, the method proposed in this study can be deeply integrated with generative AI to form a more intelligent product improvement framework and is expected to achieve significant improvements in the following two aspects. First, this study currently mainly uses a sentiment analysis method based on a sentiment lexicon, which requires manual updating and expansion of the sentiment lexicon. When faced with large amounts of review data, this method is often difficult to rely on manual labor to comprehensively annotate various sentiment words, resulting in certain limitations on the effect of sentiment analysis. In contrast, if the generative AI model trained on a large-scale review data is used, it will be possible to automatically identify and classify sentiments on large amounts of review data with less manual intervention, greatly improving efficiency and accuracy. Second, owing to generative AI approaches, data that simulate user behavior can be generated, helping SMEs predict potential user requirements, providing considerably richer data support for marginal utility analysis and improving the scientific nature of priority sorting. As a result, by applying generative AI to product design improvement, SMEs can not only understand user requirements more comprehensively but also formulate more forward-looking improvement strategies, achieve accurate resource investment and continuous optimization of product design, and take the initiative in fierce market competition.
6. Conclusions
Based on the need for product design improvement, this study proposed a new method to aid SMEs in extracting and prioritizing product attributes for improvement based on online reviews. By evaluating the usefulness of user reviews, extracting multi-level attributes, and constructing a nonlinear satisfaction function based on the asymmetry of user satisfaction, the proposed method can more finely explore the need for product improvement at different levels and quantitatively analyze the marginal utility of attribute improvement for overall satisfaction under the current performance level. Both the theoretical analysis and empirical verification results indicated that this method is highly feasible for effectively identifying product improvement attributes and scientifically dividing priorities, which is of great significance in helping SMEs allocate their limited resources in a more targeted manner and improve user satisfaction and market competitiveness.
Author Contributions
Conceptualization, K.W. and J.X.; Methodology, K.W.; Software, A.L.; Validation, C.Z. and J.L.; Formal Analysis, B.E.; Investigation, Z.G.; Resources, Z.G.; Data Curation, Z.H.; Writing—Original Draft Preparation, A.L. and Q.M.; Writing—Review and Editing, C.Z.; Visualization, A.L.; Supervision, B.E. and C.Z.; Project Administration, K.W.; Funding Acquisition, K.W., C.Z. and J.L. All authors have read and agreed to the published version of the manuscript.
Funding
This research was supported by the Social Science Foundation of Shaanxi Province (Grant No. 2024R073), National Social Science Foundation of China (Grant No. 24FGLB120), the National Natural Science Foundations of China (Grant No. 72471193 and 72101204), Aeronautical Science Foundation of China (Grant No. 2024Z072053001), and the project “European Lighthouse to Manifest Trustworthy and Green AI” (ENFIELD) from the European Union’s Horizon Europe research and innovation program (Grant No. 101120657).
Data Availability Statement
The raw data supporting the conclusions of this article will be made available by the authors on request.
Conflicts of Interest
The authors declare no conflicts of interest.
Note
| 1. | Screenshot reproduced from JD.com with anonymized user information (accessed June 2024). |
References
- Mittal, S.; Khan, M.A.; Romero, D.; Wuest, T. A critical review of smart manufacturing & Industry 4.0 maturity models: Implications for small and medium-sized enterprises (SMEs). J. Manuf. Syst. 2018, 49, 194–214. [Google Scholar] [CrossRef]
- Horte, S.A.; Barth, H.; Chibba, A.; Florén, H.; Frishammar, J.; Halila, F.; Rundquist, J.; Tell, J. Product development in SMEs: A literature review. Int. J. Technol. Intell. Plan. 2008, 4, 299–325. [Google Scholar] [CrossRef]
- Tonis, R. SMEs role in achieving sustainable development. J. Econ. Dev. Environ. People 2015, 4, 41–50. [Google Scholar] [CrossRef]
- Wang, S.; Zhang, H. Digital Transformation and Innovation Performance in Small- and Medium-Sized Enterprises: A Systems Perspective on the Interplay of Digital Adoption, Digital Drive, and Digital Culture. Systems 2025, 13, 43. [Google Scholar] [CrossRef]
- Statista. Estimated Number of Small and Medium Sized Enterprises (SMEs) Worldwide from 2000 to 2023. Available online: https://www.statista.com/statistics/1261592/global-smes/#statisticContainer (accessed on 10 November 2024).
- Bruner, J.; Grimm, A. A Profile of US Exporters and Importers of Services, 2017. Surv. Curr. Bus. 2019, 99, 138–149. [Google Scholar]
- Skolud, B.; Krenczyk, D.; Kalinowski, K.; Ćwikła, G.; Grabowik, C. Integration of manufacturing functions for SME. Holonic-based approach. In Proceedings of the International Joint Conference SOCO’16-CISIS’16-ICEUTE’16, San Sebastián, Spain, 19–21 October 2016. [Google Scholar]
- Zheng, C.; Du, Y.; Sun, T.; Eynard, B.; Zhang, Y.; Li, J.; Zhang, X. Multi-agent collaborative conceptual design method for robotic manufacturing systems in small-and mid-sized enterprises. Comput. Ind. Eng. 2023, 183, 109541. [Google Scholar] [CrossRef]
- Min, Z.; Sawang, S.; Kivits, R.A. Proposing circular economy ecosystem for Chinese SMEs: A systematic review. Int. J. Environ. Res. Public Health 2021, 18, 2395. [Google Scholar] [CrossRef] [PubMed]
- Tucker, C.; Kim, H. Predicting emerging product design trend by mining publicly available customer review data. In Proceedings of the 18th International Conference on Engineering Design (ICED 11), Impacting Society through Engineering Design, Vol. 6: Design Information and Knowledge, Copenhagen, Denmark, 15–19 August 2011. [Google Scholar]
- Healy, B.; O’Dwyer, M.; Ledwith, A. An exploration of product advantage and its antecedents in SMEs. J. Small Bus. Enterp. Dev. 2018, 25, 129–146. [Google Scholar] [CrossRef]
- Wolff, J.A.; Pett, T.L. Small-firm performance: Modeling the role of product and process improvements. J. Small Bus. Manag. 2006, 44, 268–284. [Google Scholar] [CrossRef]
- Meinel, M.; Eismann, T.T.; Baccarella, C.V.; Fixson, S.K.; Voigt, K.-I. Does applying design thinking result in better new product concepts than a traditional innovation approach? An experimental comparison study. Eur. Manag. J. 2020, 38, 661–671. [Google Scholar] [CrossRef]
- Sepehr, S.; Head, M. Understanding the role of competition in video gameplay satisfaction. Inf. Manag. 2018, 55, 407–421. [Google Scholar] [CrossRef]
- Wang, Y.; Wu, J.; Ye, X.; Wu, Y. Product Competitive Analysis Model Based on Consumer Preference Satisfaction Similarity: Case Study of Smartphone UGC. Systems 2025, 13, 38. [Google Scholar] [CrossRef]
- Jiang, H.; Sabetzadeh, F.; Zhang, C. An Intelligent Adaptive Neuro-Fuzzy Inference System for Modeling Time-Series Customer Satisfaction in Product Design. Systems 2024, 12, 224. [Google Scholar] [CrossRef]
- Hsiao, Y.-H.; Chen, L.-F.; Chang, C.-C.; Chiu, F.-H. Configurational path to customer satisfaction and stickiness for a restaurant chain using fuzzy set qualitative comparative analysis. J. Bus. Res. 2016, 69, 2939–2949. [Google Scholar] [CrossRef]
- Vogt, M.; Marten, F.; Braun, M. A survey and statistical analysis of smart grid co-simulations. Appl. Energy 2018, 222, 67–78. [Google Scholar] [CrossRef]
- Ahani, A.; Nilashi, M.; Yadegaridehkordi, E.; Sanzogni, L.; Tarik, A.R.; Knox, K.; Samad, S.; Ibrahim, O. Revealing customers’ satisfaction and preferences through online review analysis: The case of Canary Islands hotels. J. Retail. Consum. Serv. 2019, 51, 331–343. [Google Scholar] [CrossRef]
- Qu, S.; Zhang, Y.; Ji, Y.; Wang, Z.; Geng, R. Online-Review-Driven Products Ranking: A Hybrid Approach. Systems 2023, 11, 148. [Google Scholar] [CrossRef]
- Hennig-Thurau, T.; Gwinner, K.P.; Walsh, G.; Gremler, D.D. Electronic word-of-mouth via consumer-opinion platforms: What motivates consumers to articulate themselves on the internet? J. Interact. Mark. 2004, 18, 38–52. [Google Scholar] [CrossRef]
- Schlesselman, J.M.; Pardo-Castellote, G.; Farabaugh, B. OMG data-distribution service (DDS): Architectural update. In Proceedings of the IEEE MILCOM 2004. Military Communications Conference, 2004, Monterey, CA, USA, 31 October–3 November 2004. [Google Scholar]
- Chen, S.; Shen, T. Resource constraints and firm innovation: When less is more? Chin. J. Popul. Resour. Environ. 2023, 21, 172–180. [Google Scholar] [CrossRef]
- Dong, C.; Yang, Y.; Chen, Q.; Wu, Z. A complex network-based response method for changes in customer requirements for design processes of complex mechanical products. Expert Syst. Appl. 2022, 199, 117124. [Google Scholar] [CrossRef]
- Xu, X.; Dou, Y.; Qian, L.; Jiang, J.; Yang, K.; Tan, Y. Quality improvement method for high-end equipment’s functional requirements based on user stories. Adv. Eng. Inform. 2023, 56, 102017. [Google Scholar] [CrossRef]
- Cui, Q.; Lu, J.; Yin, X. Causality enhanced deep learning framework for quality characteristic prediction via long sequence multivariate time-series data. Meas. Sci. Technol. 2025, in press. [CrossRef]
- Pocchiari, M.; Proserpio, D.; Dover, Y. Online reviews: A literature review and roadmap for future research. Int. J. Res. Mark. 2024, in press. [CrossRef]
- Yang, Y.; Zuo, Q.; Zhang, K.; Li, X.; Yu, W.; Ji, L. Research on Multistage Heterogeneous Information Fusion of Product Design Decision-Making Based on Axiomatic Design. Systems 2024, 12, 222. [Google Scholar] [CrossRef]
- Zhou, K.; Yao, Z. Analysis of Customer Satisfaction in Tourism Services Based on the Kano Model. Systems 2023, 11, 345. [Google Scholar] [CrossRef]
- Chen, P.-Y.; Dhanasobhon, S.; Smith, M.D. All Reviews Are Not Created Equal: The Disaggregate Impact of Reviews and Reviewers at amazon.com Com (May 2008). 2008. Available online: https://ssrn.com/abstract=918083 (accessed on 10 November 2024).
- Yin, D.; Bond, S.D.; Zhang, H. Anxious or angry? Effects of discrete emotions on the perceived helpfulness of online reviews. MIS Q. 2014, 38, 539–560. [Google Scholar] [CrossRef]
- Forman, C.; Ghose, A.; Wiesenfeld, B. Examining the relationship between reviews and sales: The role of reviewer identity disclosure in electronic markets. Inf. Syst. Res. 2008, 19, 291–313. [Google Scholar] [CrossRef]
- Banerjee, S.; Bhattacharyya, S.; Bose, I. Whose online reviews to trust? Understanding reviewer trustworthiness and its impact on business. Decis. Support Syst. 2017, 96, 17–26. [Google Scholar] [CrossRef]
- Karimi, S.; Wang, F. Online review helpfulness: Impact of reviewer profile image. Decis. Support Syst. 2017, 96, 39–48. [Google Scholar] [CrossRef]
- Qi, J.; Zhang, Z.; Jeon, S.; Zhou, Y. Mining customer requirements from online reviews: A product improvement perspective. Inf. Manag. 2016, 53, 951–963. [Google Scholar] [CrossRef]
- Malik, M.; Hussain, A. An analysis of review content and reviewer variables that contribute to review helpfulness. Inf. Process. Manag. 2018, 54, 88–104. [Google Scholar] [CrossRef]
- Li, Y.; Qin, Z.; Xu, W.; Guo, J. A holistic model of mining product aspects and associated sentiments from online reviews. Multimed. Tools Appl. 2015, 74, 10177–10194. [Google Scholar] [CrossRef]
- Jin, J.; Ji, P.; Gu, R. Identifying comparative customer requirements from product online reviews for competitor analysis. Eng. Appl. Artif. Intell. 2016, 49, 61–73. [Google Scholar] [CrossRef]
- Zhang, H.; Rao, H.; Feng, J. Product innovation based on online review data mining: A case study of Huawei phones. Electron. Commer. Res. 2018, 18, 3–22. [Google Scholar] [CrossRef]
- Lee, A.J.; Yang, F.-C.; Chen, C.-H.; Wang, C.-S.; Sun, C.-Y. Mining perceptual maps from consumer reviews. Decis. Support Syst. 2016, 82, 12–25. [Google Scholar] [CrossRef]
- Zhang, M.; Fan, B.; Zhang, N.; Wang, W.; Fan, W. Mining product innovation ideas from online reviews. Inf. Process. Manag. 2021, 58, 102389. [Google Scholar] [CrossRef]
- Huang, S.; Zhang, J.; Yang, C.; Gu, Q.; Li, M.; Wang, W. The interval grey QFD method for new product development: Integrate with LDA topic model to analyze online reviews. Eng. Appl. Artif. Intell. 2022, 114, 105213. [Google Scholar] [CrossRef]
- Zeithaml, V.A. Consumer perceptions of price, quality, and value: A means-end model and synthesis of evidence. J. Mark. 1988, 52, 2–22. [Google Scholar] [CrossRef]
- Lancaster, K.J. A new approach to consumer theory. J. Political Econ. 1966, 74, 132–157. [Google Scholar] [CrossRef]
- Blei, D.M.; Jordan, M.I. Modeling annotated data. In Proceedings of the 26th Annual International ACM SIGIR Conference on Research and Development in Informaion Retrieval, Toronto, ON, Canada, 28 July–1 August 2003. [Google Scholar]
- Hu, M.; Liu, B. Mining and summarizing customer reviews. In Proceedings of the Tenth ACM SIGKDD International Conference on Knowledge Discovery and Data Mining, Seattle, WA, USA, 22–25 August 2004. [Google Scholar]
- Lau, R.Y.; Li, C.; Liao, S.S. Social analytics: Learning fuzzy product ontologies for aspect-oriented sentiment analysis. Decis. Support Syst. 2014, 65, 80–94. [Google Scholar] [CrossRef]
- Marrese-Taylor, E.; Velásquez, J.D.; Bravo-Marquez, F. A novel deterministic approach for aspect-based opinion mining in tourism products reviews. Expert Syst. Appl. 2014, 41, 7764–7775. [Google Scholar] [CrossRef]
- Yang, L.; Liu, B.; Lin, H.; Lin, Y. Combining local and global information for product feature extraction in opinion documents. Inf. Process. Lett. 2016, 116, 623–627. [Google Scholar] [CrossRef]
- Xie, F.; Wu, X.; Zhu, X. Efficient sequential pattern mining with wildcards for keyphrase extraction. Knowl.-Based Syst. 2017, 115, 27–39. [Google Scholar] [CrossRef]
- Teh, Y.W. A hierarchical Bayesian language model based on Pitman-Yor processes. In Proceedings of the 21st International Conference on Computational Linguistics and 44th Annual Meeting of the Association for Computational Linguistics, Sydney, Australia, 17–21 July 2006. [Google Scholar]
- Tirunillai, S.; Tellis, G.J. Mining marketing meaning from online chatter: Strategic brand analysis of big data using latent dirichlet allocation. J. Mark. Res. 2014, 51, 463–479. [Google Scholar] [CrossRef]
- Kim, S.G.; Kang, J. Analyzing the discriminative attributes of products using text mining focused on cosmetic reviews. Inf. Process. Manag. 2018, 54, 938–957. [Google Scholar] [CrossRef]
- Li, Q.; Yang, Y.; Li, C.; Zhao, G. Energy vehicle user demand mining method based on fusion of online reviews and complaint information. Energy Rep. 2023, 9, 3120–3130. [Google Scholar] [CrossRef]
- Wang, J.; Zhao, Z.; Liu, Y.; Guo, Y. Research on the role of influencing factors on hotel customer satisfaction based on BP neural network and text mining. Information 2021, 12, 99. [Google Scholar] [CrossRef]
- Violante, M.G.; Vezzetti, E. Kano qualitative vs. quantitative approaches: An assessment framework for products attributes analysis. Comput. Ind. 2017, 86, 15–25. [Google Scholar] [CrossRef]
- Kano, N.; Seraku, N.; Takahashi, F.; Tsuji, S. Attractive quality and must-be quality. J. Jpn. Soc. Qual. Control 1984, 14, 147–156. [Google Scholar] [CrossRef]
- Sauerwein, E.; Bailom, F.; Matzler, K.; Hinterhuber, H.H. The Kano model: How to delight your customers. In Proceedings of the International Working Seminar on Production Economics, Igls, Austria, 19–23 February 1996. [Google Scholar]
- Albayrak, T. The inclusion of competitor information in the three-factor theory of customer satisfaction. Int. J. Contemp. Hosp. Manag. 2019, 31, 1924–1936. [Google Scholar] [CrossRef]
- Mikulić, J.; Prebežac, D. Accounting for dynamics in attribute-importance and for competitor performance to enhance reliability of BPNN-based importance–performance analysis. Expert Syst. Appl. 2012, 39, 5144–5153. [Google Scholar] [CrossRef]
- Berger, C.; Blauth, R.; Boger, D. Kano’s methods for understanding customer-defined quality. Cent. Qual. Manag. J. 1993, 2, 3–36. [Google Scholar]
- Yang, C.-C. The refined Kano’s model and its application. Total Qual. Manag. Bus. Excell. 2005, 16, 1127–1137. [Google Scholar] [CrossRef]
- Wu, M.; Wang, L. A continuous fuzzy Kano’s model for customer requirements analysis in product development. Proc. Inst. Mech. Eng. Part B J. Eng. Manuf. 2012, 226, 535–546. [Google Scholar] [CrossRef]
- Sun, H.; Guo, W.; Wang, L.; Rong, B. An analysis method of dynamic requirement change in product design. Comput. Ind. Eng. 2022, 171, 108477. [Google Scholar] [CrossRef]
- Song, W.; Ming, X.; Xu, Z. Integrating Kano model and grey–Markov chain to predict customer requirement states. Proc. Inst. Mech. Eng. Part B J. Eng. Manuf. 2013, 227, 1232–1244. [Google Scholar] [CrossRef]
- Martilla, J.A.; James, J.C. Importance-performance analysis. J. Mark. 1977, 41, 77–79. [Google Scholar] [CrossRef]
- Nam, S.; Lee, H.C. A text analytics-based importance performance analysis and its application to airline service. Sustainability 2019, 11, 6153. [Google Scholar] [CrossRef]
- Wu, J.; Wang, Y.; Zhang, R.; Cai, J. An approach to discovering product/service improvement priorities: Using dynamic importance-performance analysis. Sustainability 2018, 10, 3564. [Google Scholar] [CrossRef]
- Li, S.; Lu, H.; Kong, J.; Yu, Z.; Wang, R. Lean improvement of the stage shows in theme park based on consumer preferences correlation deep mining. Multimed. Tools Appl. 2020, 79, 24487–24506. [Google Scholar] [CrossRef]
- Wang, A.; Zhang, Q.; Zhao, S.; Lu, X.; Peng, Z. A review-driven customer preference measurement model for product improvement: Sentiment-based importance–performance analysis. Inf. Syst. e-Bus. Manag. 2020, 18, 61–88. [Google Scholar] [CrossRef]
- Blei, D.M.; Griffiths, T.L.; Jordan, M.I. The nested Chinese restaurant process and bayesian nonparametric inference of topic hierarchies. Journal of the ACM (JACM) 2010, 57, 1–30. [Google Scholar] [CrossRef]
- Liu, X.; Wang, S.; Lu, S.; Yin, Z.; Li, X.; Yin, L.; Tian, J.; Zheng, W. Adapting Feature Selection Algorithms for the Classification of Chinese Texts. Systems 2023, 11, 483. [Google Scholar] [CrossRef]
- Church, K.; Hanks, P. Word association norms, mutual information, and lexicography. Comput. Linguist. 1990, 16, 22–29. [Google Scholar]
- Salton, G.; Buckley, C. Term-weighting approaches in automatic text retrieval. Inf. Process. Manag. 1988, 24, 513–523. [Google Scholar] [CrossRef]
- Hownet. Available online: https://openhownet.thunlp.org/ (accessed on 18 July 2024).
- NTUSD. Available online: https://github.com/ntunlplab/NTUSD (accessed on 18 July 2024).
- Sentiwordnet 3.0. Available online: https://github.com/aesuli/SentiWordNet/blob/master/data/SentiWordNet_3.0.0.txt (accessed on 20 August 2024).
- SenticNet. Available online: https://sentic.net/senticnet.zip (accessed on 20 August 2024).
- VADER. Available online: https://github.com/cjhutto/vaderSentiment/blob/master/vaderSentiment/vader_lexicon.txt (accessed on 20 August 2024).
- Taboada, M.; Brooke, J.; Tofiloski, M.; Voll, K.; Stede, M. Lexicon-based methods for sentiment analysis. Comput. Linguist. 2011, 37, 267–307. [Google Scholar] [CrossRef]
- Xu, Q.; Jiao, R.J.; Yang, X.; Helander, M.; Khalid, H.M.; Opperud, A. An analytical Kano model for customer need analysis. Design studies 2009, 30, 87–110. [Google Scholar] [CrossRef]
- Zhang, L.; Xu, A.; An, L.; Li, M. Bayesian Inference of System Reliability for Multicomponent Stress-Strength Model under Marshall-Olkin Weibull Distribution. Systems 2022, 10, 196. [Google Scholar] [CrossRef]
- Abalo, J.; Varela, J.; Manzano, V. Importance values for Importance–Performance Analysis: A formula for spreading out values derived from preference rankings. J. Bus. Res. 2007, 60, 115–121. [Google Scholar] [CrossRef]
- Pahl, G.; Beitz, W.; Feldhusen, J.; Grote, K.-H. Engineering Design: A Systematic Approach; Springer: London, UK, 2007. [Google Scholar]
- Zheng, C.; Eynard, B.; Qin, X.; Li, J.; Bai, J.; Gomes, S.; Zhang, Y. A requirement-driven architecture definition approach for conceptual design of mechatronic systems. Integr. Comput.-Aided Eng. 2019, 26, 361–382. [Google Scholar] [CrossRef]
- Jänsch, J.; Birkhofer, H. The development of the guideline VDI 2221-the change of direction. In Proceedings of the 9th International Design Conference, Dubrovnik, Croatia, 15–18 May 2006. [Google Scholar]
- Suh, N.P. Axiomatic design theory for systems. Res. Eng. Des. 1998, 10, 189–209. [Google Scholar] [CrossRef]
- Ho, W.; Xu, X.; Dey, P.K. Multi-criteria decision making approaches for supplier evaluation and selection: A literature review. Eur. J. Oper. Res. 2010, 202, 16–24. [Google Scholar] [CrossRef]
- Mei, Y.; Ye, J.; Zeng, Z. Entropy-weighted ANP fuzzy comprehensive evaluation of interim product production schemes in one-of-a-kind production. Comput. Ind. Eng. 2016, 100, 144–152. [Google Scholar] [CrossRef]
- Zheng, C.; An, Y.; Wang, Z.; Qin, X.; Eynard, B.; Bricogne, M.; Le Duigou, J.; Zhang, Y. Knowledge-based engineering approach for defining robotic manufacturing system architectures. Int. J. Prod. Res. 2023, 61, 1436–1454. [Google Scholar] [CrossRef]
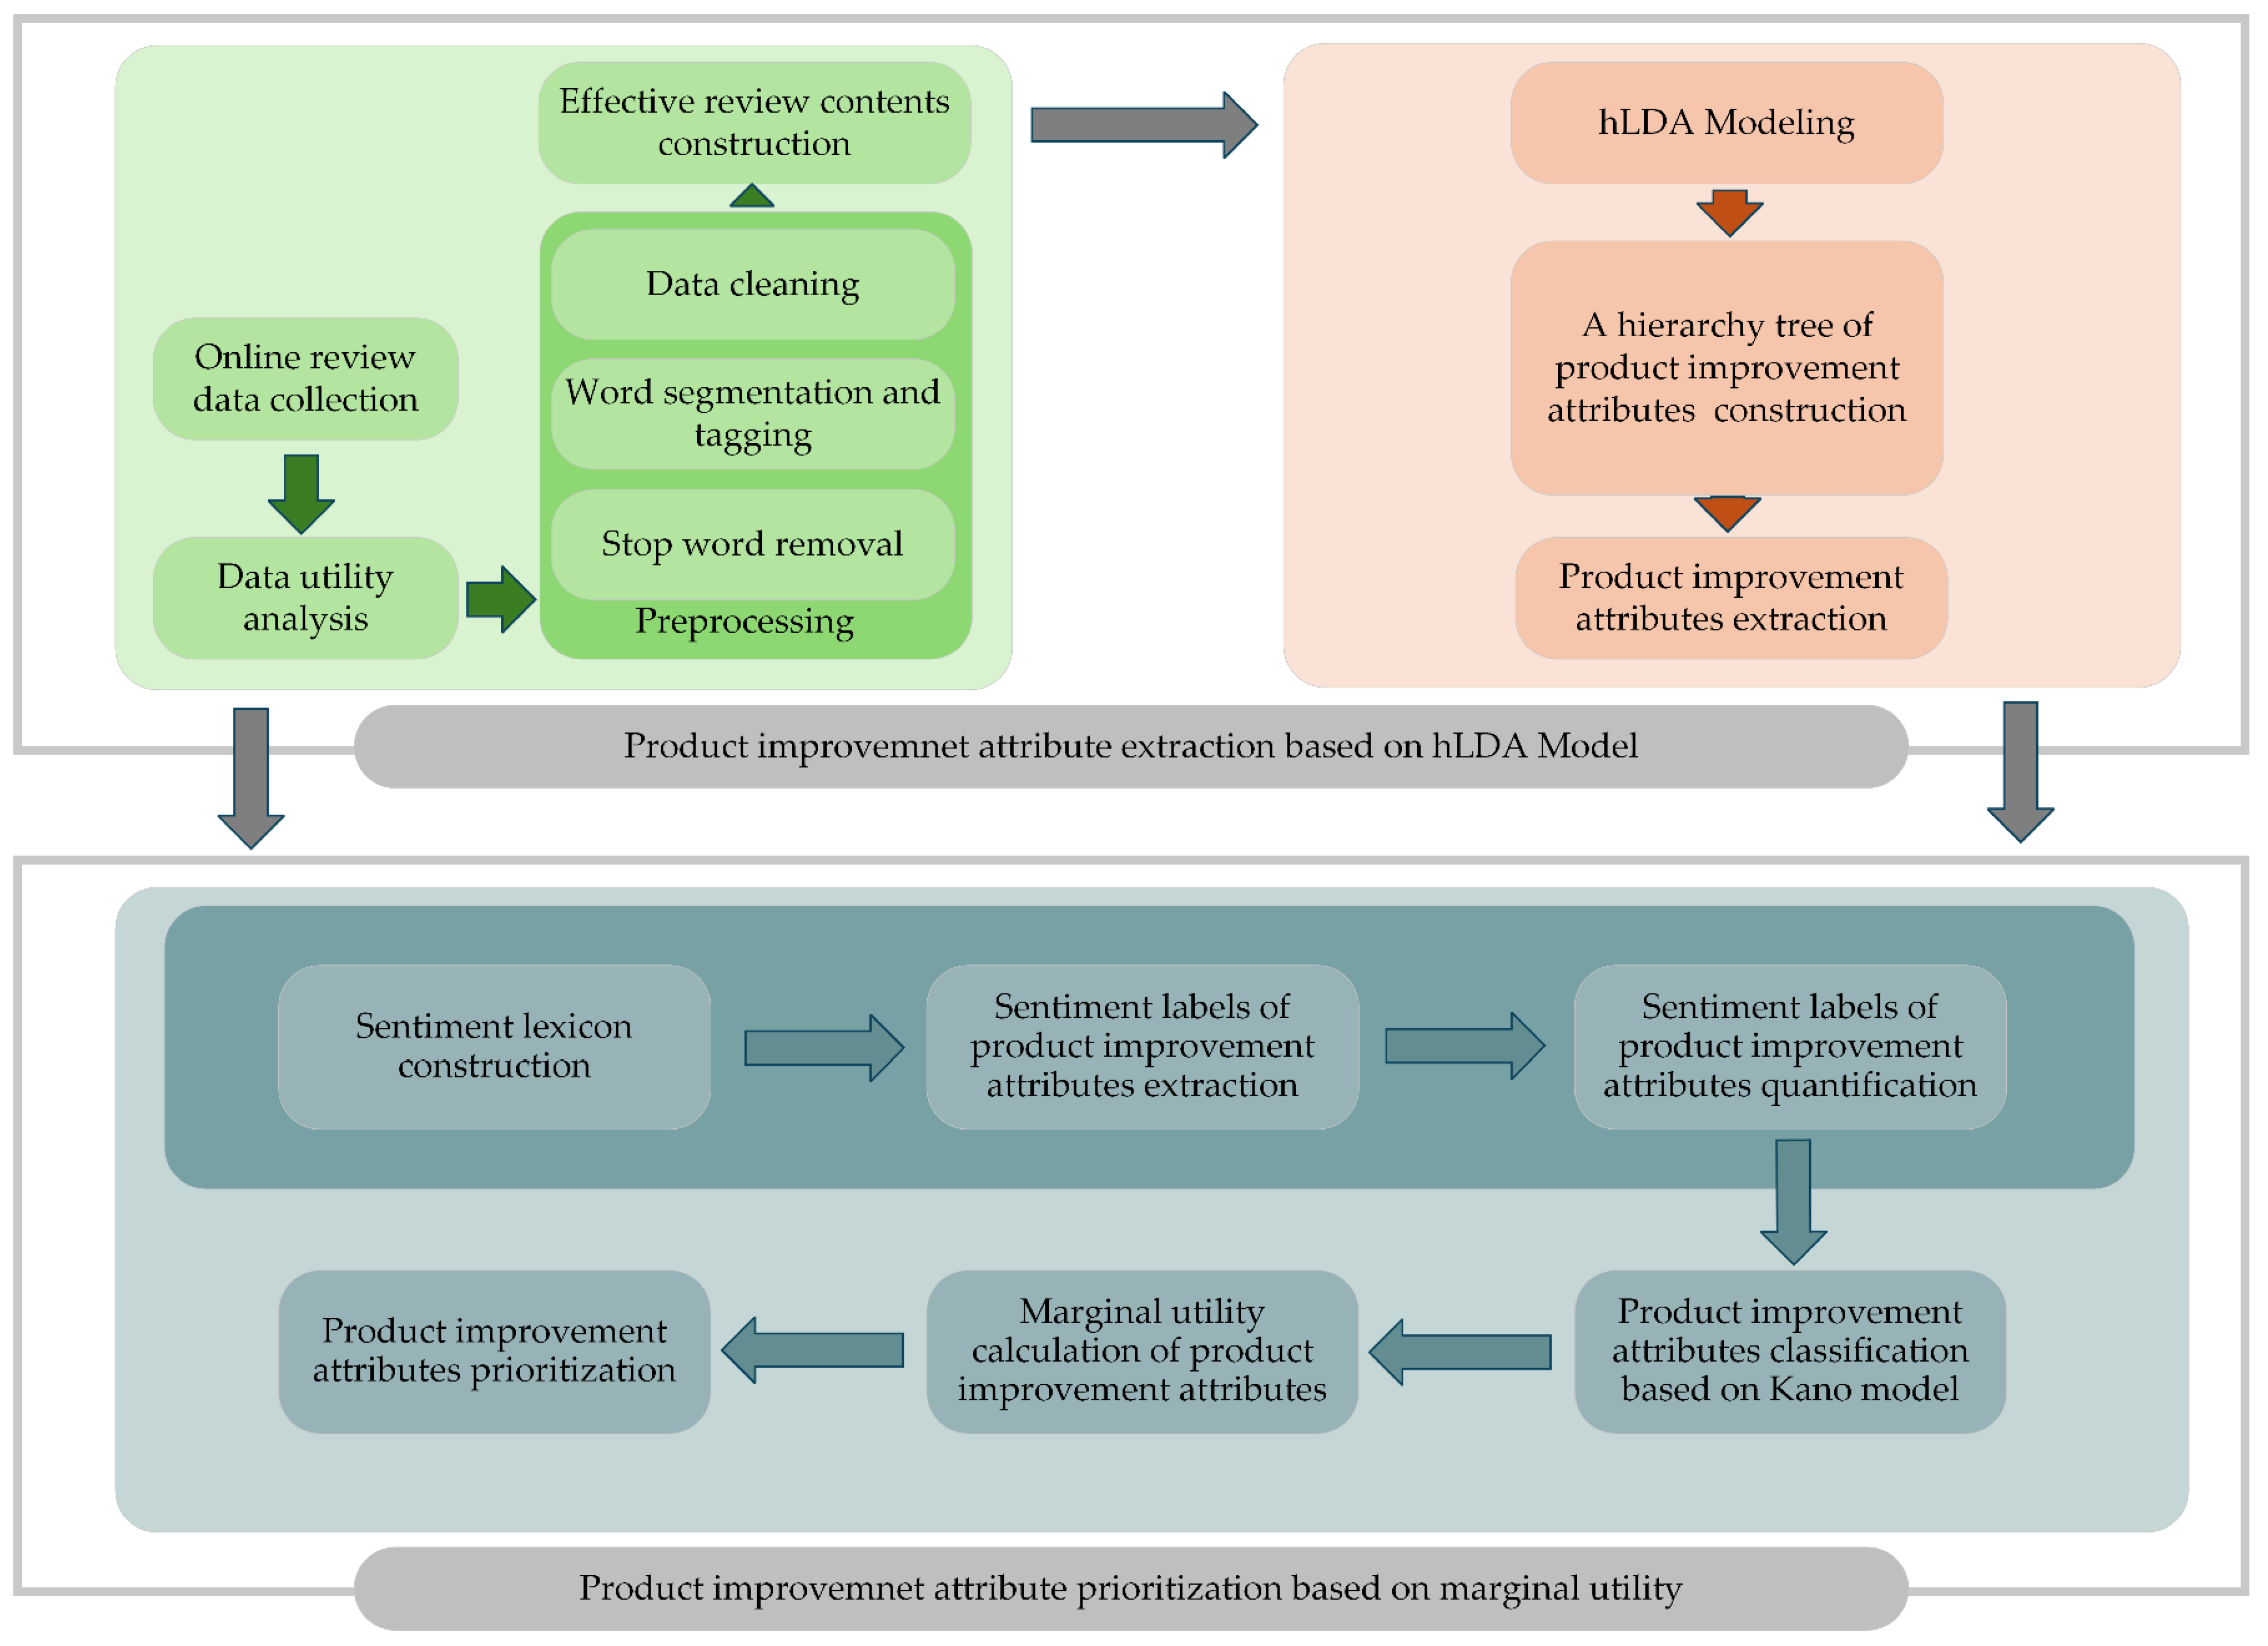

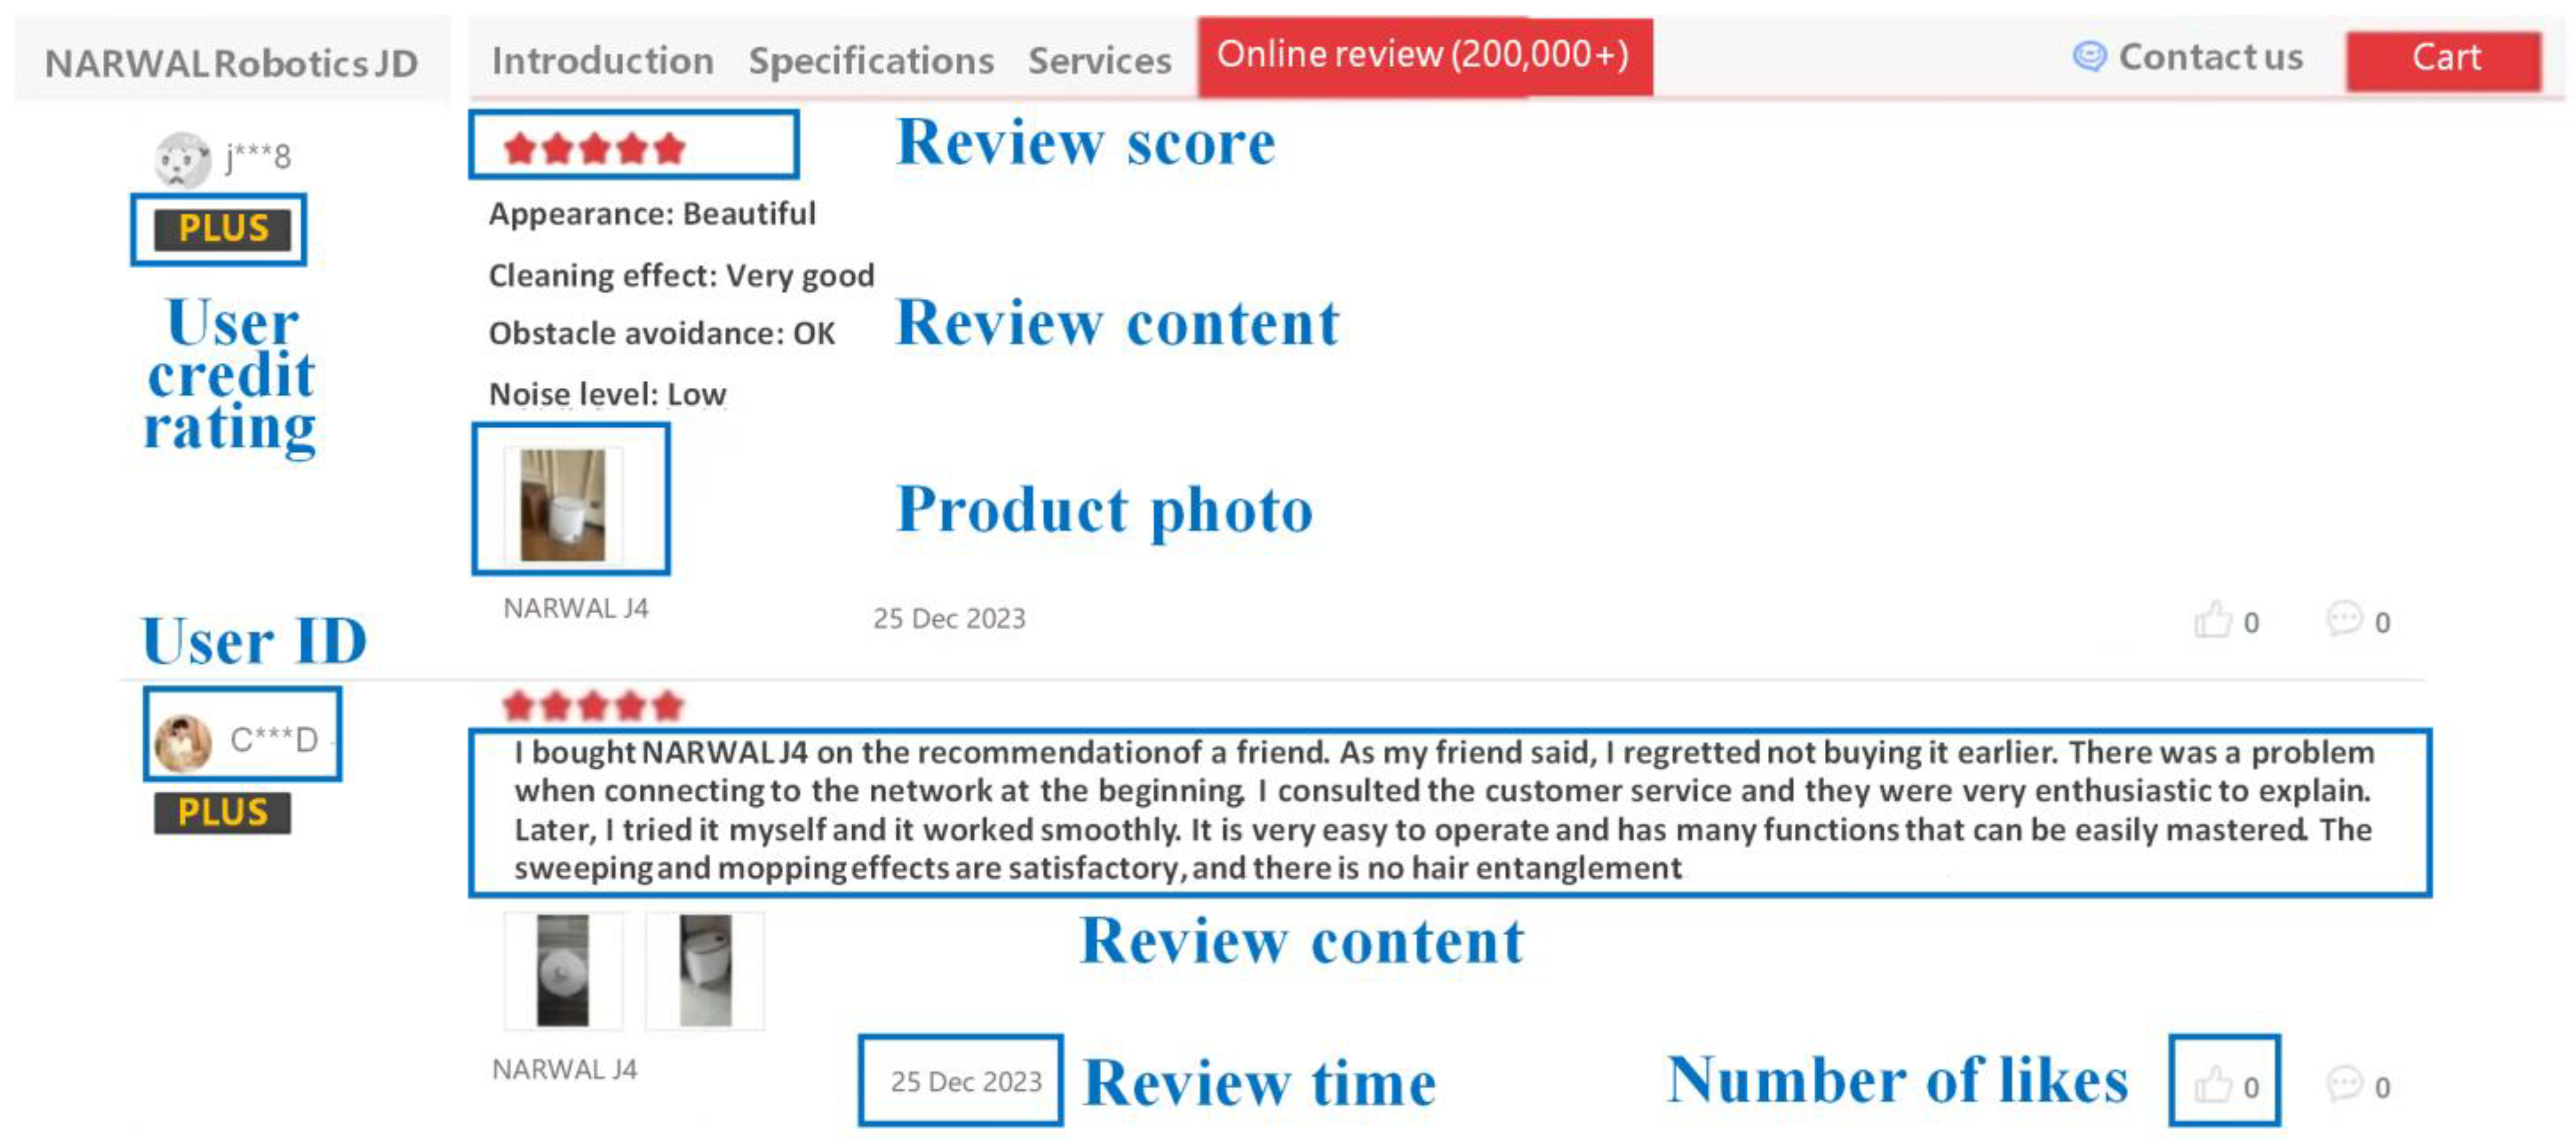
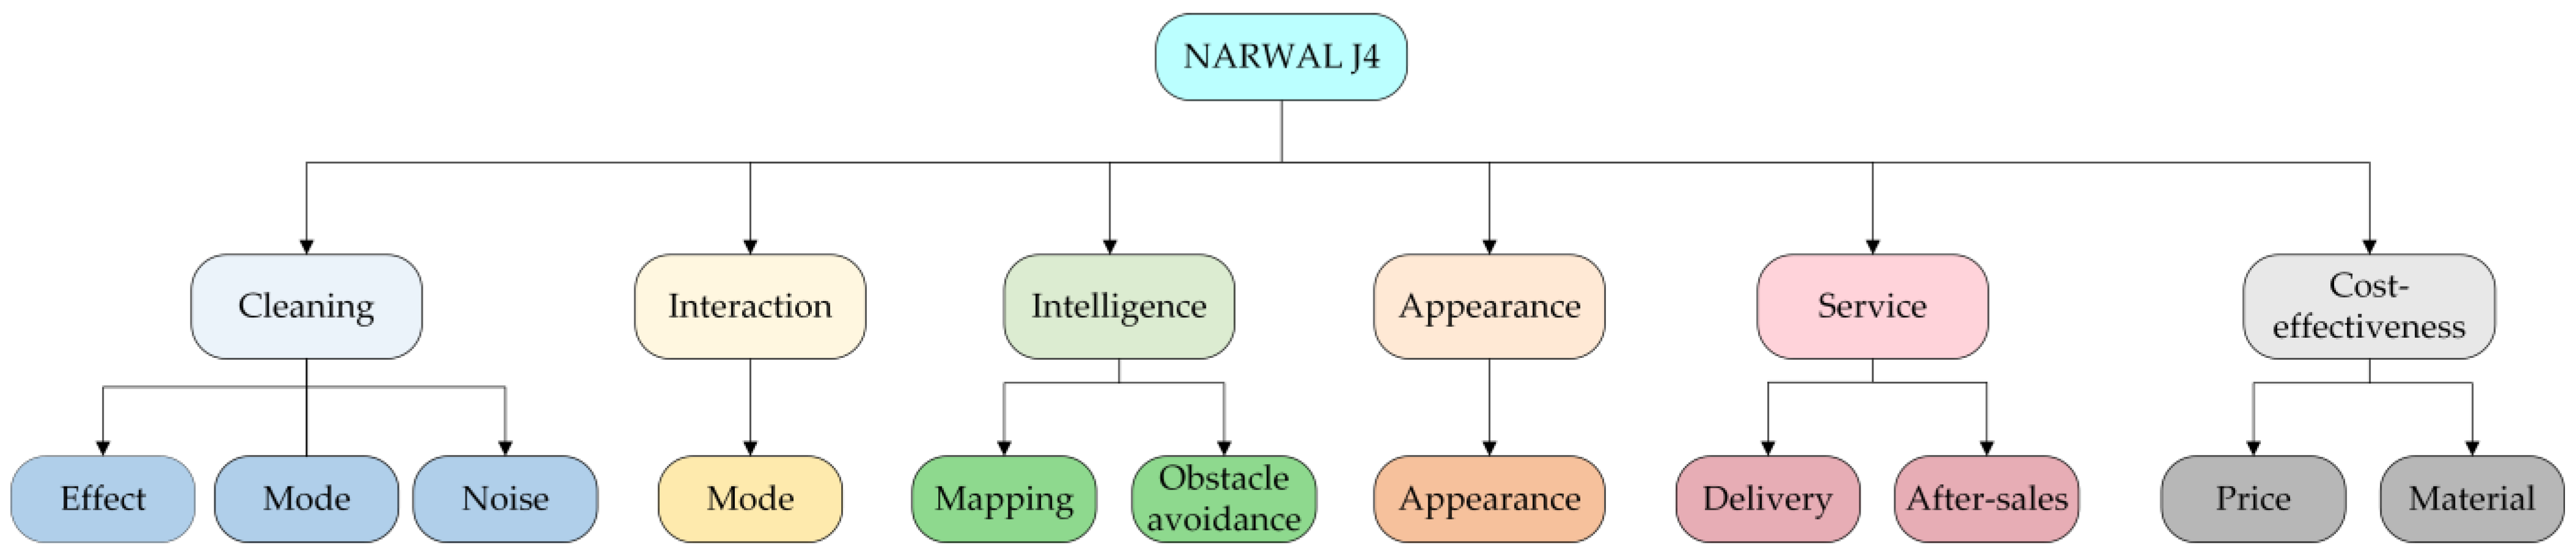
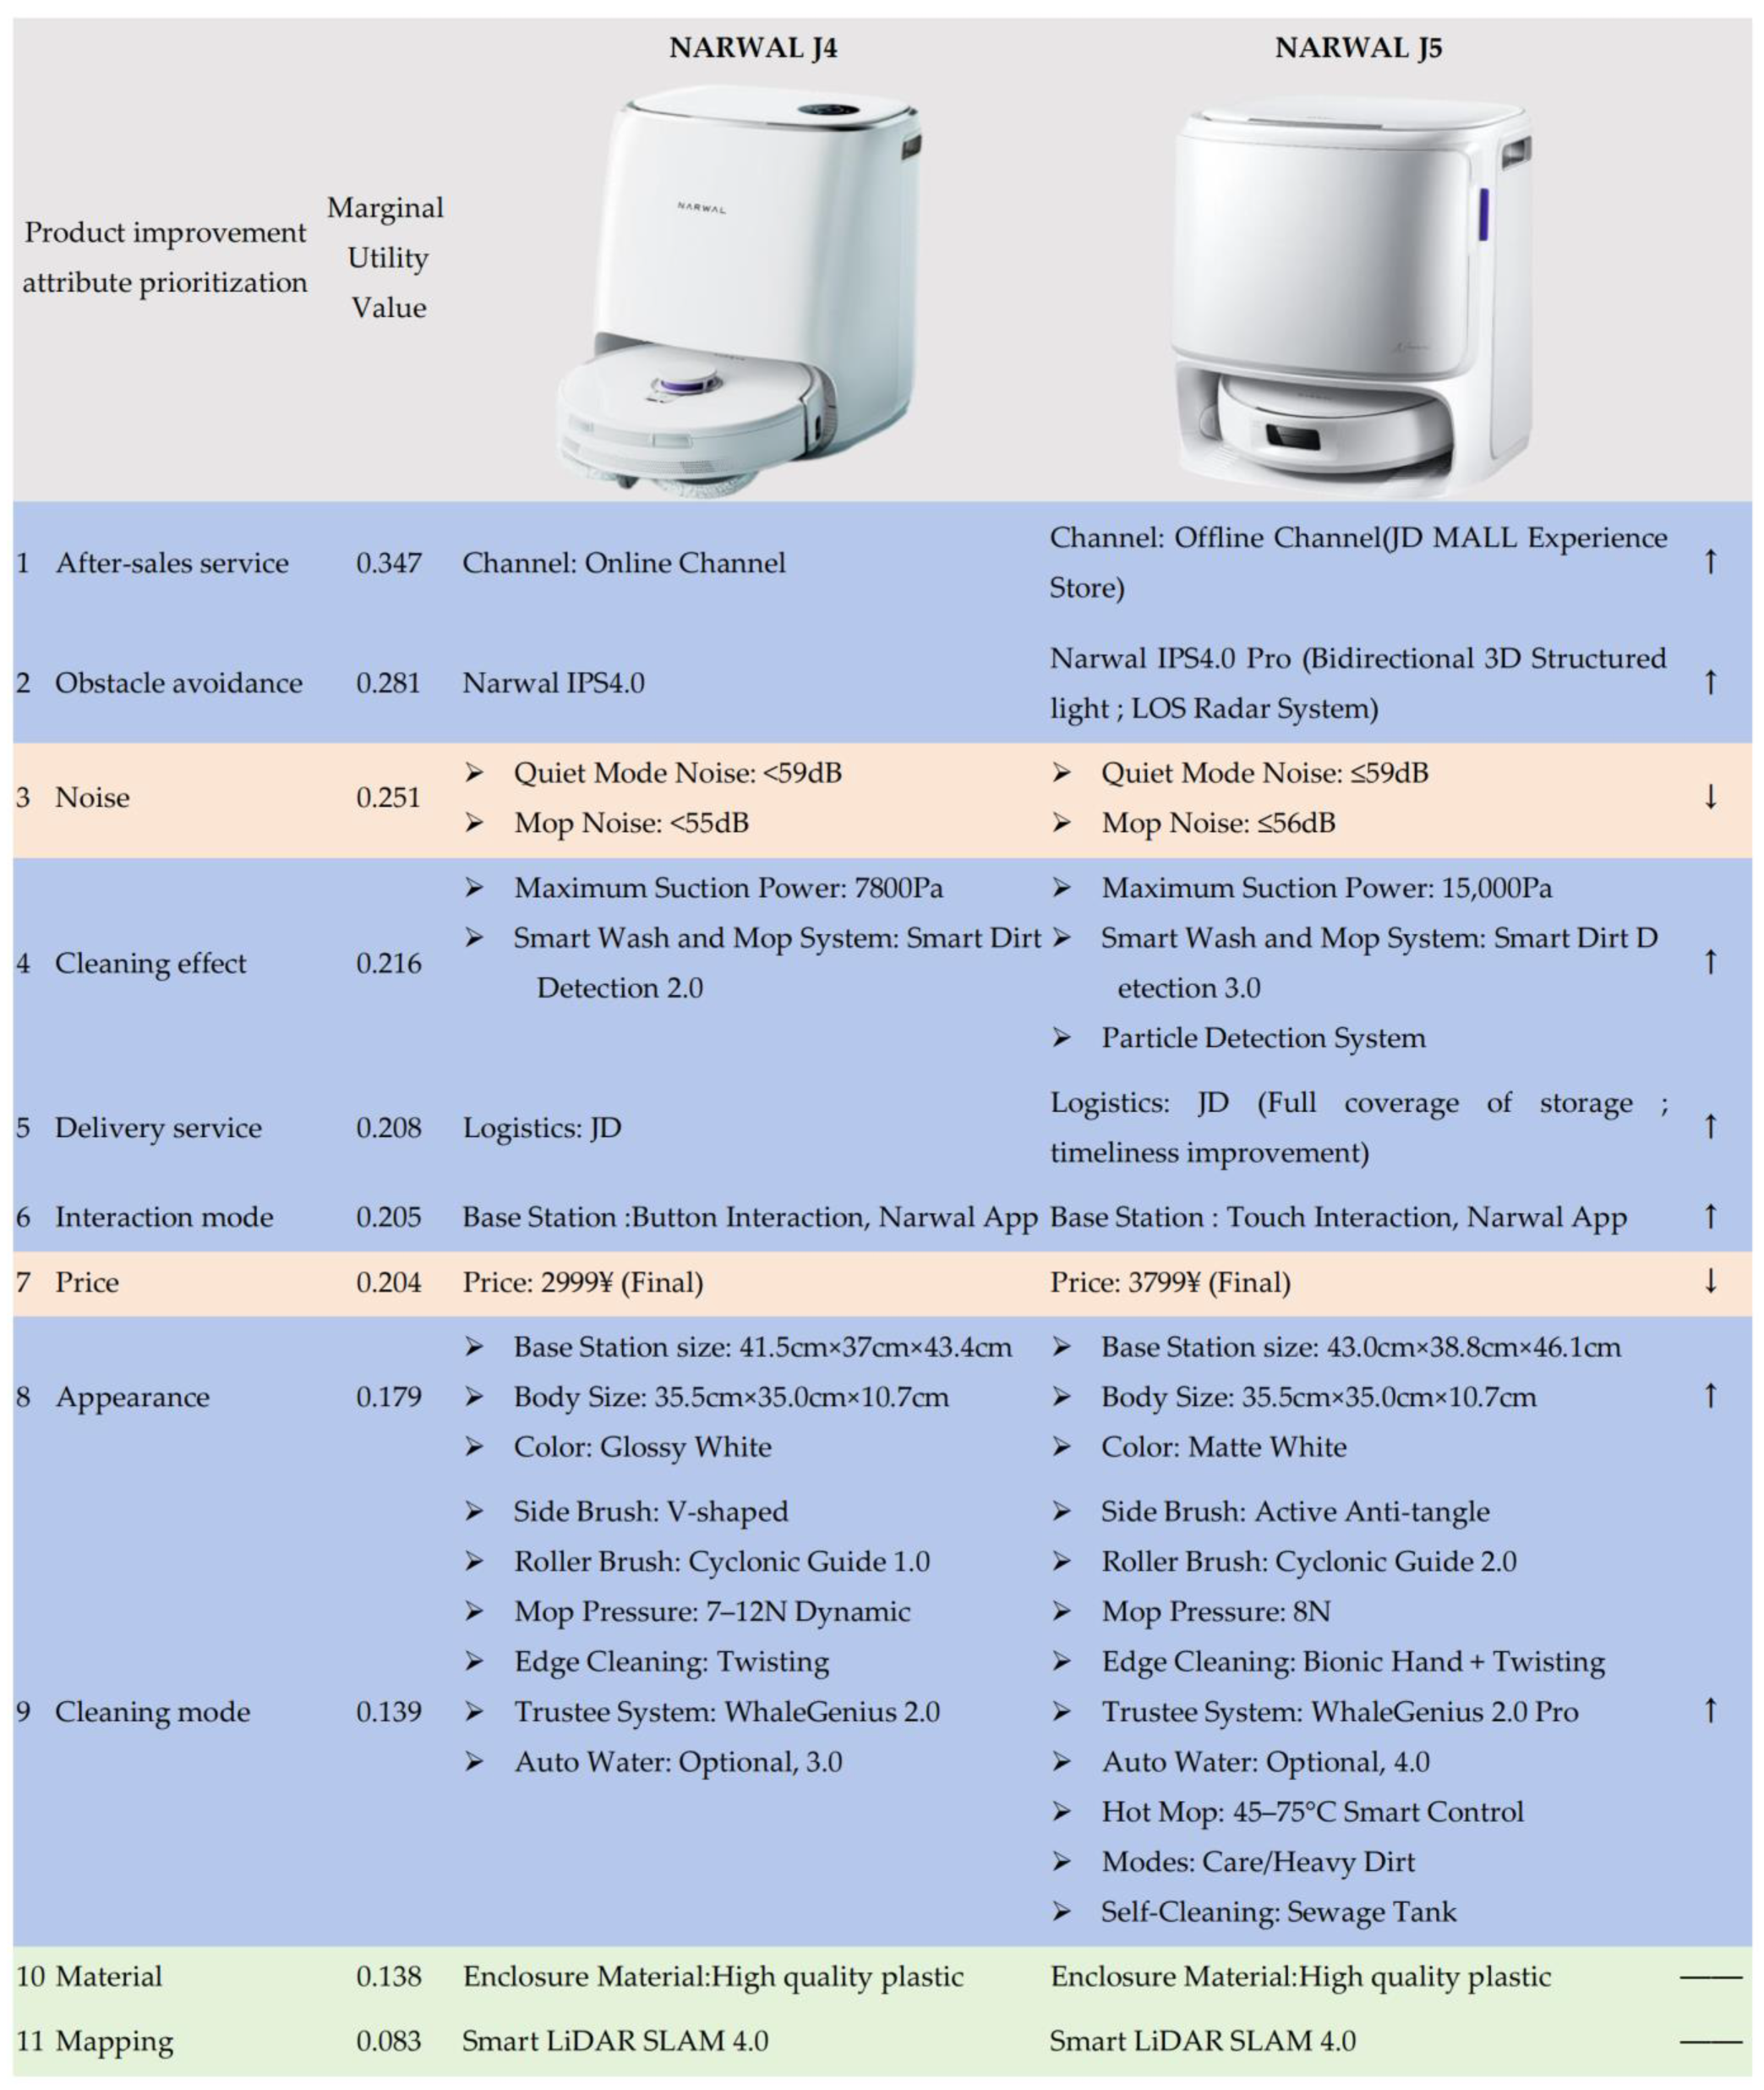
Disclaimer/Publisher’s Note: The statements, opinions and data contained in all publications are solely those of the individual author(s) and contributor(s) and not of MDPI and/or the editor(s). MDPI and/or the editor(s) disclaim responsibility for any injury to people or property resulting from any ideas, methods, instructions or products referred to in the content. |
© 2025 by the authors. Licensee MDPI, Basel, Switzerland. This article is an open access article distributed under the terms and conditions of the Creative Commons Attribution (CC BY) license (https://creativecommons.org/licenses/by/4.0/).