Article

The Impact of Cooperation Network Evolution on Communication Technology Innovation: A Network Interaction Perspective

1
School of Economics and Management, Jiangsu University of Science and Technology, Zhenjiang 212100, China
2
Research Center of Fluid Machinery Engineering and Technology, Jiangsu University, Zhenjiang 212013, China
3
School of Management and Economics, Kunming University of Science and Technology, Kunming 650093, China
*
Author to whom correspondence should be addressed.
Systems 2025, 13(2), 126; https://doi.org/10.3390/systems13020126
Submission received: 11 January 2025 / Revised: 12 February 2025 / Accepted: 14 February 2025 / Published: 17 February 2025
(This article belongs to the Section Systems Practice in Social Science)

Abstract

:
Seeking inter-organisation cooperation is an important way to achieve communication technology innovation, and dynamic networked cooperation deserves more attention. The present paper aims to reveal the influence of cooperation network evolution on communication technological innovation. Based on the cooperative patent in the communications industry in China during the years 2002–2021, this paper constructs negative binomial regression models to analyse the impact of network structure and node evolution characteristics on communication technological innovation and the interaction between them. The results show that, at the level of network structure, the clustering coefficient always significantly negatively impacts technological innovation. The influence of network closure has changed from positive to negative. For network nodes, the influence of centrality on technological innovation has changed from positive to negative. The impact of structural holes is always positive. Regarding network interaction, the interaction between clustering coefficient and centrality changes from positive to negative, but the interaction with structural holes is always negative. The positive effect of network closure interacting with network node characteristics diminishes. This study can fill the research gap in network interaction and dynamic networks and provide a reference for innovative organisations to find suitable partners for promoting communication technology innovations.

1. Introduction

Communication technology refers to the technical systems used to store, transmit, and display information [1], such as computers, mobile phones, and social media. The development of communication technology provides more communication media and working methods to improve the work efficiency of enterprises [2]. The increasing complexity of the innovation environment has led enterprises to increasingly rely on communication technology to enhance their competitiveness [3]. Some scholars have pointed out that communication technology will become a key fundamental technology for enterprises and society after 2030 and will change the direction of the development of products and services. Therefore, accelerating communication technology innovation is key for innovation entities in adapting to future innovation developments [4].
In most studies on communication technologies, scholars emphasise the necessity of communication technologies and analyse their impact on organisational innovation [5], firm outsourcing [6], innovation resilience [7], and the institutional environment [8]. However, in reality, understanding the factors influencing the development of communication technology also needs to be considered in order to utilise communication technology for innovation and social development. Research presented by Kalmanek [9] shows that communication technology innovation has three elements: demand, knowledge, and favourable economic conditions. As research advances, scholars find that communication technologies have become large-scale networked digital platforms. Different entities communicate and cooperate in the platform to form an innovation ecosystem [10]. In the face of increasingly complex technology demand, it is difficult for innovative organisations to achieve communication technological innovation independently [11]. Zhang et al. [12] explored the dynamics of the communication technology innovation ecosystem, emphasising the need for inter-organisational cooperation.
Multi-entity collaborative innovation has become the new normal of industrial technology development. With the deepening of the complexity of technological innovation, the collaboration pattern between innovative organisations has gradually evolved towards networks [13]. Networks can accelerate technological convergence, promote the flow of heterogeneous information resources between innovative organisations, and enhance their innovative strength [14]. Therefore, establishing cooperation networks is essential for technological innovation [15]. Scholarly research has focused on the formation and evolution of cooperative networks [16] and the impact of networks on innovation [17]. In the study of network influence, some scholars analyse the influence of networks on innovation from the perspective of network relationships [18], mainly focusing on network density, network aggregation, and network closure [19]. Some other scholars believe that, in addition to network relationships, innovative organisations in different positions have different information resources and cooperation opportunities in the network, which can also affect technological innovation [20]. According to Wang and Wu [21], enterprises in network centres can obtain innovative knowledge and resources more effectively than other organisations, thus improving their innovation ability. Research by Zhao et al. [22] showed that the centrality in a competitive network contributes to the innovation of enterprises. Structural holes can reduce the cost of collecting information and enhance the control ability of nodes [23]. Ma et al. [24] research suggests that structural holes have a nonlinear impact on exploratory innovation.
Although scholars have conducted in-depth research on communication technology innovation and cooperation networks, there are still areas for improvement. First, most studies have explored the impact of the development of communication technology, but few have looked at how collaboration, especially networked collaboration, affects communication technology innovation. Second, most studies analyse the influence of a single characteristic of a network on technological innovation. However, the interaction between the network dimensions is ignored [25]. Finally, most scholars focus on the impact of static networks on innovation [26]. The purpose of cooperation network formation is the dynamic interaction of technology transfer and resource integration. At different stages, cooperation networks will bring differentiated influence to technological innovation [27].
In order to fill the gap in the existing research, this study intends to contribute in the following ways: Firstly, we explore the influencing factors of communication technology innovation from the perspective of cooperation networks. Secondly, we consider the impact of multiple network characteristics on technological innovation. Finally, based on the dynamic evolution perspective, we analyse the differentiated effect of different stages of cooperation networks on technological innovation.
The remainder of the paper proceeds as follows. Section 2 elaborates on the relevant theories and puts forward the research hypothesis. Section 3 details the research methodology of this paper, including data collection, network construction, variable measurement, and model construction. In Section 4, we conduct an empirical analysis and obtain the results of the hypothesis testing. We discuss the results in Section 5. The theoretical contributions and managerial implications of this study are summarised, and future research directions are proposed in Section 6.

2. Theory and Research Hypotheses

Technical cooperation can reduce the risk of complex technologies being researched and developed, and the scale effect brought by the networks can promote the rapid flow of innovative resources [28]. However, the regularisation of the networks may create constraints on the innovative activities of innovative organisations [29]. Cooperation networks evolve based on dynamic cooperation between innovative organisations. The allocation of resources within the networks and short-term goals will change as the networks evolve. Therefore, cooperation networks will have differentiated impacts on technological innovation in different evolution stages.
Cooperation networks can be abstracted as topological networks containing only nodes and edges [30]. Innovative organisations represent the network nodes. The cooperation relations between innovative organisations represent the edges, and the intricate cooperation relations constitute the network structure. Therefore, cooperation networks can be divided into network structures and nodes. This paper puts forward research hypotheses from the following aspects: network structure evolution, network node evolution, and the interaction between them. The network structure includes a clustering coefficient and a network closure. Network nodes include centrality and structural holes.

2.1. The Effect of Network Structure Evolution on Technological Innovation

Networks can be described as aggregating into cohesive subgroups. Network cohesion describes the way in which participants are divided into different subgroups [31]. The degree of network clustering refers to the degree to which a pair of relationships in a network is surrounded by a common third party, reflecting the cohesion between nodes [20]. Some nodes in the network exchange information frequently, and many knowledge exchanges will form small groups with close relations, which can be quantified using the clustering coefficient.
Research has shown that embedding a cohesive network structure can negatively impact the ability to innovate [32]. As networks evolve, too much aggregation can lead to the homogenisation of technical knowledge. Homogenising technological knowledge can lead to innovative organisations falling into technological lock-in and path dependence, preventing the entry of new partners [33], and thus creating technological barriers [20]. Technical barriers can restrict technology exchange among innovative organisations and reduce their ability to respond to changes, inhibiting technological innovation.
Hypothesis 1.
The clustering coefficient always negatively affects technological innovation in the network evolution process.
Network closure reflects the closure and redundancy of the networks [34], and the most prominent features brought about by it are repeated information and stable links [35]. In a closed network, there are more direct connections and fewer opportunities for outward expansion. Network closures provide many opportunities for participation in problem solving and mutual consultation [36] and simplify the exchange of knowledge within the network.
At the beginning of network evolution, the knowledge spillover costs are high. Network closure can reduce the initial costs of technological R&D and provide a basis for information sharing among innovative organisations [37], thus enabling them to continuously integrate resources to generate new knowledge and technologies [38]. However, as the network evolves and the technical knowledge matures, redundant information accumulates. The networks’ need for openness is increasing, and a closed structure will limit the influx of new ideas [39]. In this case, technological innovation will be inhibited.
Hypothesis 2.
In the network evolution process, the positive effect of a network’s closure on technological innovation is gradually weakened.

2.2. The Effect of Network Nodes Evolution on Technological Innovation

The most commonly used metric for network location is centrality, a concept that describes the location of nodes according to how core or marginal they are in the network. Freeman [40] divides centrality into three indicators: degree centrality, betweenness centrality, and closeness centrality. This paper mainly examines the influence of betweenness centrality on innovation. The higher the betweenness centrality, the more network nodes can reach many other nodes through a small number of intermediate channels [41]. Therefore, this index can reflect the importance of network nodes [42].
In cooperation networks, the superiority and authority of the network centre position enable the innovative organisation in this position to dominate a large amount of information and numerous resources [43]. Network nodes at the centre have easier access to rich network knowledge and are more likely to establish cooperative relationships with other nodes. With the evolution of the network, the innovation organisation’s resources and adaptability to the external environment are more demanding [20]. If the innovation organisation has a higher position in the network and can mobilise more heterogeneous knowledge and technical resources, it is easier to cross the existing technology field and achieve technological innovation.
Hypothesis 3.
Centrality always positively affects technological innovation in the network evolution process.
Most nodes are not directly connected to each other in the network but instead form connections through intermediary nodes, resulting in visual holes in the network, namely, structural holes. The structure hole refers to the gap between non-related parties in the network [44]. The structural hole index of Burt involves four aspects: effective size, efficiency, constraint, and hierarchy. Among them, the most commonly used index is the constraint. The smaller the index, the more abundant the structural holes, which have unique advantages in resource acquisition and information control [45].
The knowledge field required for technological innovation is different in the cooperation networks. Innovative organisations occupying structural holes have more technology-sharing opportunities and can grasp heterogeneous technical information [46]. In addition, the location advantage of the structural holes facilitates the rapid identification and judgement of information [47]. Structural holes can help innovative organisations screen potential partners and thus promote technological innovation [48].
Hypothesis 4.
Structural holes always positively affect technological innovation in the network evolution process.

2.3. The Effect of Network Structure and Network Nodes’ Interactive Evolution on Technological Innovation

In cooperation networks, the clustering coefficient affects the relationship between centrality and technological innovation by influencing the social capital and technological environment of innovative organisations [24]. In the early stage, aggregation improves the cooperation and knowledge-sharing efficiency of innovative organisations, thus increasing the effective absorption and integration of technological knowledge by innovative organisations with strong centrality [49]. However, as networks have evolved and local knowledge has been effectively absorbed and utilised, the aggregation has begun to limit the exposure of highly centralised innovative organisations to diverse external technological knowledge [29].
The links between innovative organisations in a more aggregated network are adequate and regulated, and the information transmitted in the network may tend to be homogeneous [41]. It can limit the flexibility of access to technical information for innovative organisations occupying structural holes. At the same time, the information redundancy caused by homogeneous information limits the advantages of structural holes in access to heterogeneous information. Acquiring technologically diverse knowledge is hindered, and technological innovation is inhibited.
Hypothesis 5.
In the process of network evolution, the positive effect of the interaction between the clustering coefficient and centrality on technological innovation is gradually weakened.
Hypothesis 6.
The interaction between the clustering coefficient and structural holes always negatively affects technological innovation in the network evolution process.
In the early stages, technology development relies on the rapid accumulation of knowledge by innovative organisations with high centrality. More external heterogeneous technology may lead to more scattered knowledge, which does not benefit forming core technological advantages for innovative organisations with high centrality. At this stage, closed networks can help highly central innovative organisations filter redundant information and reduce the risk of technical leaks, enhancing the efficiency of the network’s technical communication [50]. With the evolution of the networks, the disadvantage of closed networks is gradually becoming more prominent. Innovative organisations with strong centrality are likelier to form a “technology lock” in the networks. As a result, technological innovation will be inhibited.
Initially, the cooperative relationship between innovative organisations has yet to be stable. Network closure ensures that technical information within the networks is relatively transparent, making the advantages of structural holes more prominent. As the network evolves, the network’s technical structure stabilises, and network closure reduces the inflow of heterogeneous information. The scope of the knowledge gathered by the structural holes is narrowed [51]. The benefits of structural holes for the networks are temporary [52].
Hypothesis 7.
In the process of network evolution, the positive effect of the interaction between network closure and centrality on technological innovation is gradually weakened.
Hypothesis 8.
In the process of network evolution, the positive effect of the interaction between network closure and structural holes on technological innovation is gradually weakened.
The theoretical model is shown in Figure 1.

3. Methodology

3.1. Sample Selection and Data Collation

This article selects the communications industry technologies as the research object based on contemporaneity and data availability. Patents are the result of technological innovation and they provide the only available well-established resource that reflects innovative activities [53]. Cooperative patents can reflect the development of technical innovation cooperation [54]. Therefore, this paper applies cooperation patents in the communications industry to construct and analyse cooperation networks. The source of the patents is the China National Intellectual Property Administration patent database. The patent search process is as follows:
First, we used typical technical names as keywords for patent searches. Keywords include “big data networks”, “ultra-broadband”, “cloud computing”, “high-speed optical”, and “optical fibre”. Second, since patents generally have a three-year review period [22], the period is set from 1 January 2002, to 31 December 2021, to ensure data integrity. Subsequently, 10,096 patents are obtained. Third, only patents with two or more filing institutions are retained. A total of 451 cooperative patents are selected. Finally, each patent’s applicant, date, and region are recorded. The trends of cooperation patents in the communications industry from 2002 to 2021 are shown in Figure 2.
As can be seen from Figure 2, cooperative patents in the communications industry have experienced three stages: the initial stage (2002–2010), the fluctuating stage (2011–2016), and the development stage (2017–2021). In 2002–2010, the number of cooperative patents was small. In 2011–2016, the change in the number of cooperative patents fluctuated but slightly increased. In 2017–2021, cooperative patents grew from 47 in 2017 to 97 in 2021. Although the number is rising, the proportion is always low. The period of subsequent research on network evolution is divided into three stages: 2002–2010, 2011–2016, and 2017–2021.

3.2. Network Construction

The adjacency matrix is an effective tool for network construction. The rows and columns are network nodes with the same name and arrangement order, and the matrix elements represent the network edges; that is, the represent the relationships between the network nodes. In this paper, the cooperation networks of different stages are constructed through the cooperative patent of the communications industry. The organisations applying for cooperative patents represent the nodes. The number of cooperative relationships between the organisations represents the edges. The technology cooperation networks are expressed in the adjacency matrix A = ( a i j ) , in which a i j is
a i j = n   cooperation   frequency   of   i   and   j ; 0   there   is   no   cooperation   between   i   and   j .

3.3. Variables’ Measurement

3.3.1. Dependent Variable

The dependent variable is technological innovation. Therefore, the number of patents of innovative organisations is used to measure technological innovation.

3.3.2. Independent Variables

Independent variables include network structure and node factors. According to theory and research hypothesis, network structure factors include clustering coefficient and network closure, and network node factors include centrality and structural holes.
The following formula can calculate the clustering coefficient C ( i ) of the entity i with degree k i :
C ( i ) = 2 E i k i ( k i 1 )
where E i represents the number of links between the network node, i , and the junction point.
Network closure is measured by dividing all actual relationships among innovative organisations by the number of possible connections within the networks [34]. The calculation formula is as follows:
N C i = 2 L i n i ( n i 1 )
where N C i represents the network closure value of the entity i . L i is the number of links that actually exist among innovative organisations. n i indicates the number of nodes in the ego network where the entity i resides.
This paper uses betweenness centrality to measure the centrality of innovative organisations in the networks. The formula of the betweenness centrality is shown in Equation (4).
C A B i = j < k g j k ( i ) / g j k
where C A B i is the betweenness centrality of the entity i . g j k is the shortest distance between j and k , and g j k ( i ) is the shortest distance passing through i between j and k .
Network constraint indices (CIs) can be used to measure the structural holes of innovative organisations. We calculate the CIs based on the following formula:
C i j = ( p i j + q p i q p q i ) 2 ( q i , j )
where C i j represents the extent to which i is constrained by j . p i j is the proportion of relationships that entity i invested in connecting with entity j . Then, we use ( 2 - C I s ) to measure the structural holes [55].

3.3.3. Control Variables

In each model, we control for several variables that might provide alternative explanations for the hypothesised effect of cooperation networks on technological innovation.
Firstly, in addition to the four independent variables examined in this paper, there are also some network indicators that affect technological innovation. We choose the ego network size to control the model. The scale of an individual network represents the number of organisations in the individual network. To a certain extent, it can determine the richness of external resources an organisation can access, which will impact technological innovation. The ego network size can be measured using Ucinet6.232 software.
Secondly, the background, environment, and prospects of technological innovation are different in different regions of innovation organisations. This paper sets up regional dummy variables to control the influence of geographical characteristics on technological innovation and assigns values to the different areas where innovation organisations are located.
Finally, different organisations have different technological innovation goals and different cooperation potential. This paper sets up organisational dummy variables to control the influence of organisational characteristics on technological innovation. Among them, the enterprise is set as “1”, the university is set as “2”, and the research institute is set as “3”.

3.4. Research Method and Model Construction

The number of patents measures the dependent variable in this study, which belongs to the non-negative count variable. The OLS regression models can lead to biassed and invalid estimates for this variable type. Therefore, scholars often use Poisson and negative binomial regression as nonlinear regression models to solve such problems. Poisson regression emphasises that the expectation and variance in the dependent variable must be equal, which is inconsistent with most practical situations. It is more likely that the variance in the dependent variable is significantly greater than the expected value; that is, the sample is “over-dispersed”. Negative binomial regression is an improvement of Poisson regression, which can solve the problem of “over-dispersion” in samples. The variance in the number of patents is likely to be greater than the expected value, so the negative binomial regression model is chosen for analysis in this paper.
The research models are based on negative binomial regression and the research hypotheses. Model 1 investigates the effect of the clustering coefficient on technological innovation, and the expression is as follows:
E ( p a t e n t s i / C i , E S i , G C i , O C i ) = exp ( α i + β 1 C i + β 2 E S i + β 3 G C i + β 4 O C i + ε i )
Model 2 investigates the influence of network closure on technological innovation. The expression is as follows:
E ( p a t e n t s i / N C i , E S i , G C i , O C i ) = exp ( α i + β 1 N C i + β 2 E S i + β 3 G C i + β 4 O C i + ε i )
Model 3 investigates the influence of betweenness centrality on technological innovation, and the expression is as follows:
E ( p a t e n t s i / B C i , E S i , G C i , O C i ) = exp ( α i + β 1 B C i + β 2 E S i + β 3 G C i + β 4 O C i + ε i )
Model 4 investigates the influence of structural holes on technological innovation, and the expression is as follows:
E ( p a t e n t s i / S H i , E S i , G C i , O C i ) = exp ( α i + β 1 S H i + β 2 E S i + β 3 G C i + β 4 O C i + ε i )
Model 5 investigates the interaction between the clustering coefficient and betweenness centrality on technological innovation, and the expression is as follows:
E ( p a t e n t s i / C i , B C i , E S i , G C i , O C i ) = exp ( α i + β 1 C i + β 2 B C i + β 3 C i × B C i + β 4 E S i + β 5 G C i + β 6 O C i + ε i )
Model 6 investigates the interaction between the clustering coefficient and structural holes in technological innovation, and the expression is as follows:
E ( p a t e n t s i / C i , S H i , E S i , G C i , O C i ) = exp ( α i + β 1 C i + β 2 S H i + β 3 C i × S H i + β 4 E S i + β 5 G C i + β 6 O C i + ε i )
Model 7 investigates the interaction between network closure and betweenness centrality on technological innovation, and the expression is as follows:
E ( p a t e n t s i / N C i , B C i , E S i , G C i , O C i ) = exp ( α i + β 1 N C i + β 2 B C i + β 3 N C i × B C i + β 4 E S i + β 5 G C i + β 6 O C i + ε i )
Model 8 investigates the interaction between network closure and structural holes in technological innovation, and the expression is as follows:
E ( p a t e n t s i / N C i , S H i , E S i , G C i , O C i ) = exp ( α i + β 1 N C i + β 2 S H i + β 3 N C i × S H i + β 4 E S i + β 5 G C i + β 6 O C i + ε i )

4. Results

4.1. Analysis of Evolution Characteristics of Cooperation Networks

The Gephi0.10.1 software visualises the different stages of cooperative networks in the communications industry. The visualisation of the cooperation networks in three phases is shown in Figure 3. In 2002–2010, the network was sparse, with only 24 innovative organisations. In 2011–2016, the network scale gradually expanded, and the complex cooperative relationship between the innovative organisations began to be established. In 2017–2021, the number of innovative organisations increased and showed a denser state. On the whole, the network evolution was dynamic and unbalanced.
Table 1 shows the structure index of the networks in the communications industry. The network size increased monotonically from 24 to 388. The edges rose from 15 to 335. These results show that more and more innovative organisations have established technical partnerships. The density decreased from 0.054 to 0.005. This indicates that the network could have been sparse. The average distance increased monotonically from 1.211 to 2.724. This highlights that the difficulty of cooperation among innovative organisations was gradually growing, and the speed of information dissemination needed to be higher. The clustering coefficient was consistently greater than 0.5 during the evolution of the network, indicating a high degree of aggregation. Meanwhile, the clustering coefficient rose from 0.6 to 0.85 and then reduced to 0.75. There was a tendency for network agglomeration to decrease in the later stages. The average degree increased monotonically from 1.25 to 1.73. The cooperation between innovative organisations needed to be more extensive.
The regional distribution of the innovative organisations of networks is shown in Figure 4. In 2002–2010, the top five regions were Guangdong, Shanghai, Jiangsu, Beijing, and Zhejiang. In 2011–2016, Jiangsu rose first, followed by Guangdong, Beijing, Shanghai, and Zhejiang. In 2017–2021, Beijing rose first, followed by Guangdong, Jiangsu, and Shanghai. Regarding regional distribution, Beijing and the southeast coastal region have more innovative organisations. For the agglomeration degree, the top five regions accounted for 79.16%, 68.21%, and 56.96% of the total, respectively. The spatial aggregation of the innovative organisations was high initially and then gradually decreased as the network evolved.
Table 2 shows the innovative organisation types in the communications industry. Enterprises are the predominant type of organisation. The number of universities increased gradually with the network evolution, and the proportion increased first and then decreased. The number of research institutes also steadily increased with the network evolution, but the proportion first reduced and then increased.
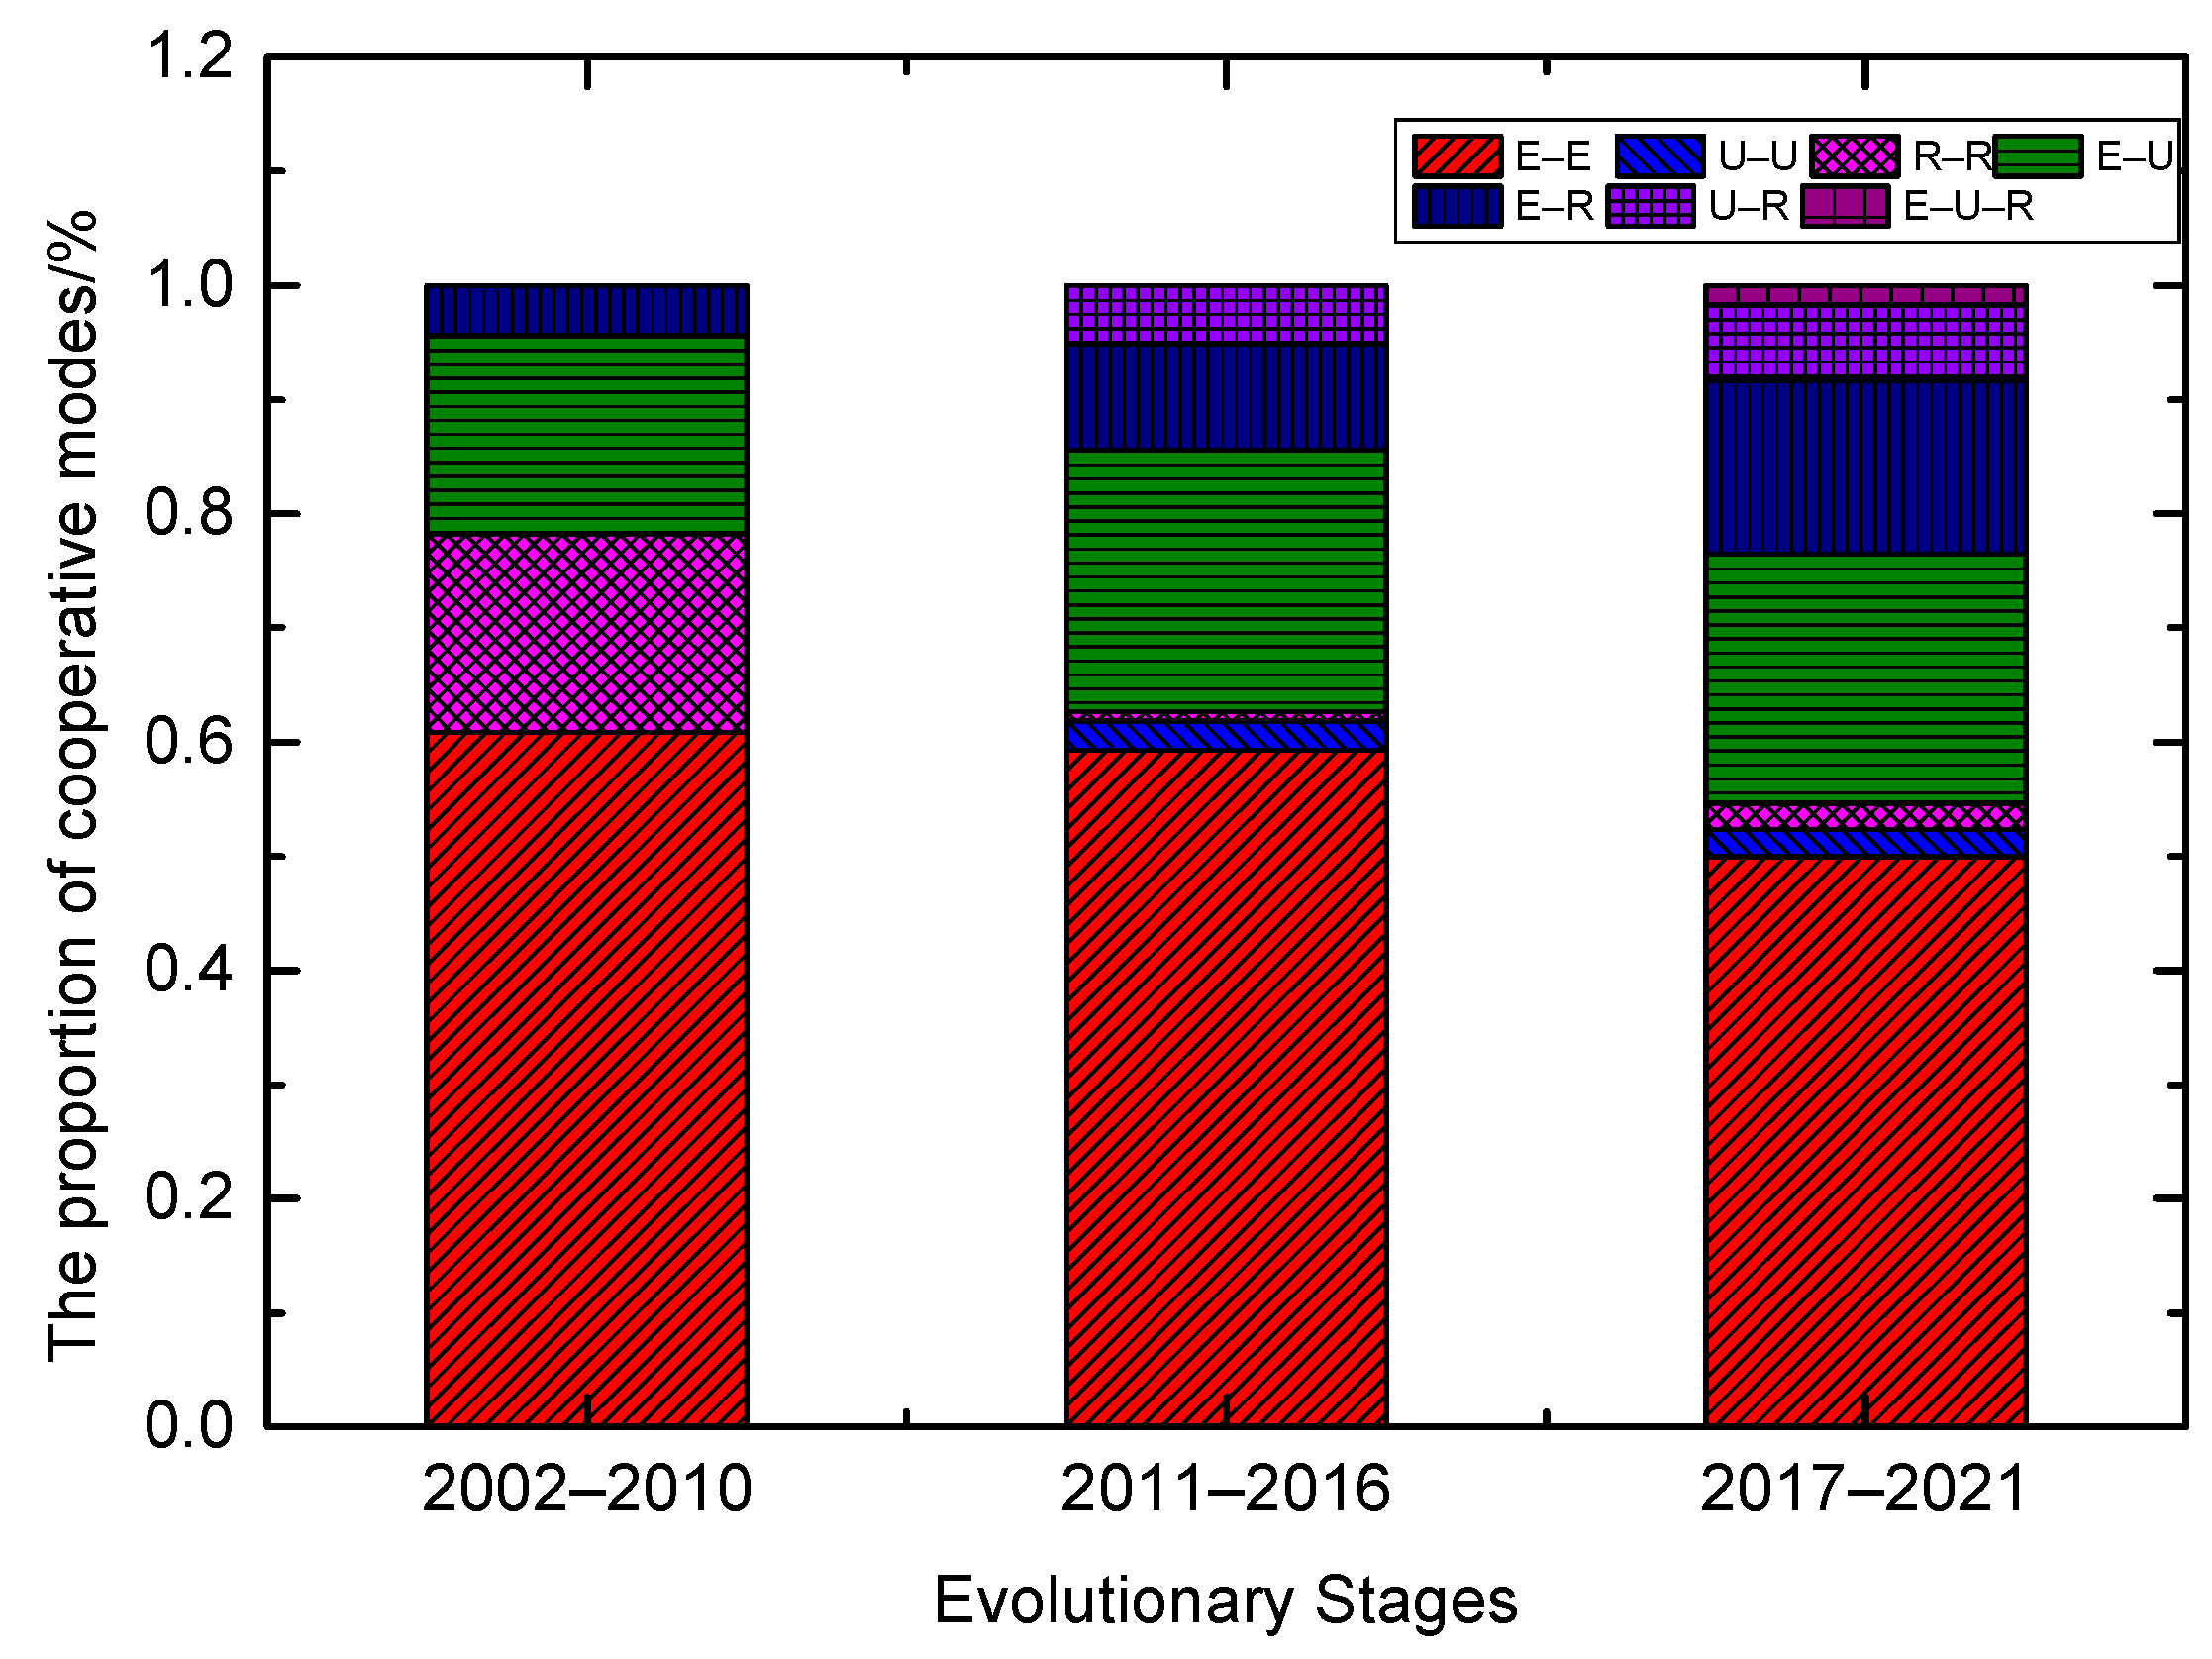
Different partnerships have formed between innovative organisations. Figure 5 shows the characteristics of cross-organisational cooperation. Most innovative organisations have E-E mode relationships between them. The proportion of cross-organisational cooperation (E-U, E-R, U-R, and E-U-R) accounted for 21.74%, 37.29%, and 45.36% in the three stages, respectively. The degree of cross-organisational cooperation gradually improved and reached a medium level.

4.2. Descriptive Statistics and Correlation Analysis

The means, standard deviations, and correlations of the variables are shown in Table 3, Table 4 and Table 5. The correlation between the independent variables is primarily below 0.7. The correlation coefficient between NC and ES in the first stage and between SH and ES in the first, second, and third stages is more significant than 0.7 and exists in the same model. A VIF test is required to verify that the model is not multicollinear.
The VIF value of the models is shown in Table 6. The VIF values of all models are lower than 10, so there is no apparent multicollinearity between the variables.

4.3. Regression Analysis

The negative binomial regression results are shown in Table 7, Table 8 and Table 9. The Wald χ2 of each model in the three stages of network evolution is significant, indicating a good fit of the data to the model.
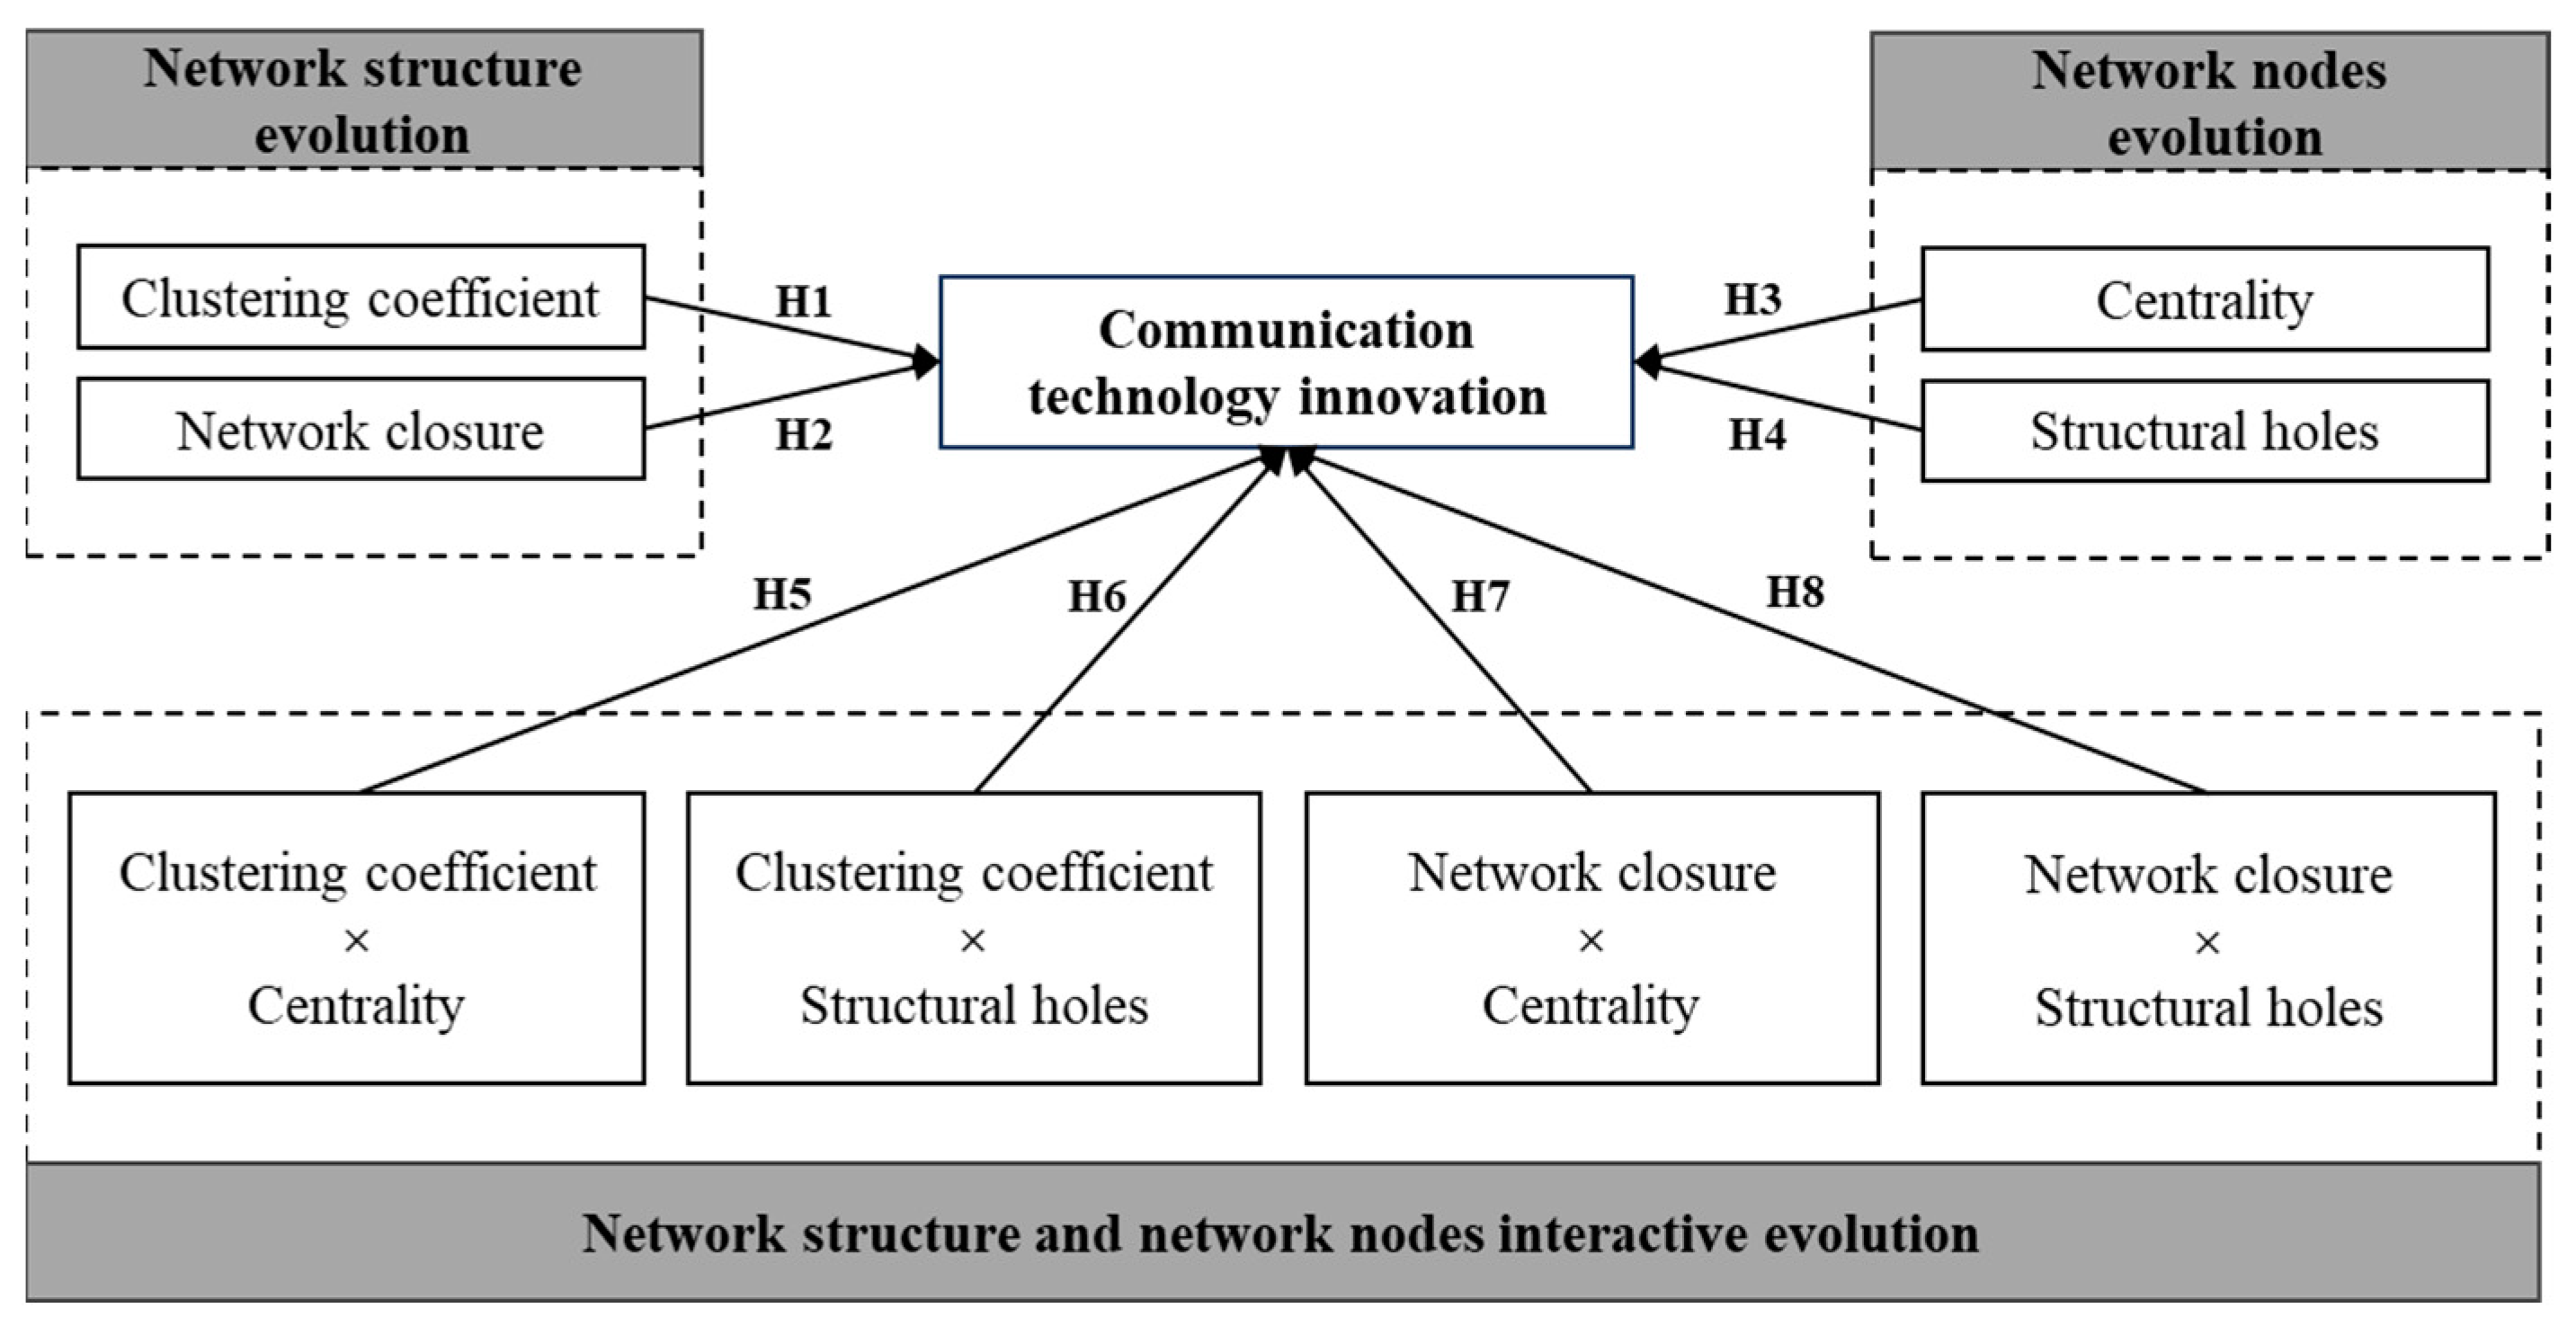
Regarding network structure, the impact of the clustering coefficient is always negative and highly significant ( β = 3.082 , 0.944 , 0.878 ). This shows that aggregation always significantly negatively affects technological innovation in the communications industry in network evolution. Hypothesis 1 is verified. Network closure has a significant positive effect at the beginning ( β = 16.884 , p < 0.05 ), a non-significant impact in the second stage ( β = 0.172 ), and a significant negative effect in the third stage ( β = 1.565 , p < 0.01 ). The positive effect of network closure is diminishing as the network evolves. Hypothesis 2 is supported.
In terms of network nodes, the betweenness centrality has a significant favourable influence in the first stage ( β = 4.955 , p < 0.01 ), a non-significant impact in the second stage ( β = 0.027 ), and a significant adverse effect in the third stage ( β = 3.385 , p < 0.01 ). This means that the effect of centrality shifts from positive to negative as the network evolves. Therefore, Hypothesis 3 is not supported. The influence of structural holes is always positive and highly significant ( β = 5.955 , 2.805 , 3.103 ). This shows that structural holes can always facilitate the technological innovation of the communications industry in network evolution. Hypothesis 4 is supported.
For the case of the interaction between network structure and network nodes, the interaction between the clustering coefficient and betweenness centrality is significantly positive in the first and second stages ( β = 0.293 , 2.381 ). Still, the negative effect is significant in the third stage ( β = 5.687 , p < 0.01 ). This shows that the combined effect of network clustering and centrality significantly positively influences the technological innovation of the communications industry in the early stage of network evolution. Still, the impact turns out to be negative. Hypothesis 5 is supported. The influence of the interaction between the clustering coefficient and structural holes is always negative and significant ( β = 3.523 , 0.946 , 0.837 ). The combined effect of network aggregation and structural holes hurts the technological innovation of the communications industry during the network evolution. Hypothesis 6 is supported. The impact of the interaction between network closure and betweenness centrality is significantly positive in the first stage ( β = 10.494 , p < 0.01 ), insignificant in the second stage ( β = 6.522 ), and significantly negative in the third stage ( β = 2.276 , p < 0.05 ). The combined impact of network closure and centrality shifts from positive to negative as the network evolves. Hypothesis 7 is accepted. Network closure and structural holes interact significantly and positively in the first and second stages ( β = 8.583 , 1.649 ), but they are insignificant in the third stage ( β = 2.080 ). The interaction of network closure and structural holes could initially facilitate technological innovation, but this facilitation diminished as the network evolved. Hypothesis 8 is supported.

4.4. Robustness Tests

In the robustness test, we measure technological innovation by recording the number of patents of innovative organisations with a one-year lag, as shown in Table 10, Table 11 and Table 12. The results of the robustness tests agree with the original results, so they are plausible.

5. Discussion

5.1. Discussion on Network Structure

Network clustering consistently negatively affects technological innovation. It differs from the findings of Bai, Wu, Liu, and Xu [41]. Iino et al. [56] argue that there is a threshold for the effect of the clustering coefficient on technological innovation. Increased network aggregation fosters trust between partners when the clustering coefficient is small. However, network aggregation can inhibit innovation when the clustering coefficient is high enough because partners’ knowledge tends to overlap and be redundant. The clustering coefficient is always greater than 0.5 in the evolution process of networks. In this case, the innovative organisations cluster to form local groups, which will hinder the entities’ absorption of technological diversity in the long-term evolution of the networks.
The effect of network closure on technological innovation has changed from positive to negative. This is inconsistent with the conclusions reached by Ma and Zeng [57] in their study of the petroleum equipment industry. They believe that, for unique industries such as petroleum equipment, companies will pay more attention to existing partners and partners with whom they have strong ties. However, the high technical complexity of the communications industry leads to the need for openness in innovative organisations. Initially, network closure can give an innovative organisation a deeper understanding of its existing knowledge. However, when an organisation is deeply entrenched in existing knowledge, its ability to explore new ideas is limited.

5.2. Discussion on Network Nodes

The influence of centrality on technological innovation has changed from positive to negative. In the study of static networks, scholars have mostly confirmed the role of centrality in promoting innovation [58], but they have not considered the dynamic nature of networks. As a network evolves into a mature stage, innovative organisations may change partners at any time. Innovative organisations with strong centrality may be more constrained by network criteria and have lower flexibility than those with low centrality. On the other hand, innovative organisations with strong centrality always occupy superior resources, resulting in marginal organisations gradually losing their innovation enthusiasm, which is not conducive to the healthy development of the industry.
The impact of the structural holes is always positive and highly significant. Some studies confirm the positive effects of structural holes [20]. Structural holes can lead to more heterogeneous technical information in networks with a high level of resource homogeneity, thus reducing network redundancy. However, some studies have shown that the effect of structural holes is not entirely positive [24]. The diversity of information brought about by structural holes can distract developers. In this study, we find that structural holes have always been significant in promoting technological innovation, indicating that communication technology has a high demand for open cooperation and diverse information. At the same time, standardised management can help innovative organisations avoid the adverse effects of structural holes to a certain extent.

5.3. Discussion on Network Structure and Network Nodes’ Interaction

The interaction between clustering and centrality on technological innovation changes from positive to negative. This is a different view from the findings of previous studies [59]. In the early stages, appropriate aggregation accelerates the flow of technology and the interest in sharing knowledge. The advantages of acquiring knowledge by centrally located innovative organisations are magnified. As networks evolve, the network norms formed by the highly clustered network will weaken the information control advantage of innovative organisations with strong centrality. The interaction between clustering and structural holes in technological innovation is always negative. The network tends to be saturated with frequent connections between innovative organisations in highly aggregated networks. The differences in technology are reduced, and the advantage of the structural holes is weakened.
The interaction between network closure and centrality changes from positive to negative. In the early stages, technological innovation depends on the internal pull of the central innovative organisations and the external force of the closed structure. As the network evolves and the need for openness of innovative organisations increases, the duplicate and redundant information caused by network closure and centrality will limit technological innovation. The interaction of network closure and structural holes can initially facilitate technological innovation. However, this facilitation effect is no longer significant as the network evolves. Most previous studies focus on choosing an open or closed network [60] but ignore the impact of open organisations embedded in a closed network. In the initial stage of network establishment, network closure can enhance network institutional norms, while the structural hole attribute of innovative organisation can bring heterogeneous information. With the evolution of the network, closed networks limit the efficiency of innovative organisations occupying structural holes to obtain heterogeneous knowledge, thus creating a disincentive for technological innovation.

6. Conclusions, Implications, and Future Work

This paper reveals the influence of cooperation networks’ evolution on technological innovation. The research conclusions are detailed here.
Firstly, regarding network structure, the clustering coefficient always negatively impacts technological innovation. The effect of network closure has changed from positive to negative. Secondly, regarding network nodes, the impact of centrality has varied from positive to negative. The influence of structural holes is always positive and highly significant. Finally, the interaction between the clustering coefficient and centrality on technological innovation changes from positive to negative. The interaction between the clustering coefficient and structural holes is always negative. The interaction between network closure and centrality changes from positive to negative. Initially, the interaction of network closure and structural holes can facilitate technological innovation. However, this facilitation effect was no longer significant over time.
This research has some theoretical contributions. Firstly, this paper explores the impact of cooperative networks on communication technology innovation, enriching the study of factors influencing communication technology. Secondly, compared with previous studies that only consider the impact of a single network index on innovation [61], we consider the impact of multiple network indicators interaction on communication technology innovation, which provides a richer perspective for studying network effect. Finally, compared with static network research [62], this paper explores the effect of cooperation networks in different stages on communication technology innovation, which provides a foundation for dynamic network research.
The management implications are enumerated: Firstly, during the development of communication technology, in order to reduce the negative influence of network aggregation, the innovative organisations that occupy a central position should pay attention to the dynamics of partner selection to avoid the constraints of technical cooperation. Innovative organisations in the “edge” position should actively search for knowledge and expand the scale of cooperation. Secondly, structural holes can facilitate communication technology innovation, regardless of the network evolution stage. Therefore, the managers of innovation organisations should actively occupy the dominant information position in the network, obtain diversified information, and dare to innovate communication technology. Finally, in the early stage, innovative organisations can form a closed cooperation mode through direct cooperation to promote the aggregation of technical knowledge. After technology development has taken shape, innovative organisations should quickly adjust their cooperation mode, expand their partners’ choices, and enhance their openness to cooperation.
In the future, this research can be expanded from the following aspects: Firstly, the communications industry chosen in this paper belongs to the high-tech industry. In the future, sample data from other industries will be further selected for analysis to explore the heterogeneity of different industries. Secondly, patents are a suitable variable for measuring technological innovation, but there are still some limitations, such as informal cooperation and regional biases. In the future, we will enrich the research of technological innovation through interviews [32,63], questionnaires [64], technical publications, industry project reports [65], and other data sources.

Author Contributions

Conceptualisation, X.Y.; methodology, X.Y.; resources, X.Y.; writing—original draft, X.Y.; visualisation, S.Q.; writing—review and editing, S.Q.; software, L.K. All authors have read and agreed to the published version of the manuscript.

Funding

This research was funded by the Humanities and Social Science Youth Foundation of the Ministry of Education of China, named “Research on the evolution mechanism and optimisation strategy of the dual innovation network of industrial key general purpose technologies” (grant number: 23YJC630209); The Social Science Youth Foundation of Jiangsu Province, named “Research on mechanism and policy optimisation of Jiangsu manufacturing industry chain upgrading driven by dual innovation networks of key general purpose technologies” (grant number: 24ZHC005); and The China Postdoctoral Science Foundation (grant number: 2023M731350).

Data Availability Statement

The raw data supporting the conclusions of this article will be made available by the authors on request.

Conflicts of Interest

The authors declare no conflicts of interest.

References

  1. Lloyd, M.; Kroeze, J.H. The Role of ICT within Small and Medium Enterprises in Gauteng. Commun. IBIMA 2011, 2011, 369288. [Google Scholar]
  2. Wu, S.; Cheng, P.; Yang, F. Study on the impact of digital transformation on green competitive advantage: The role of green innovation and government regulation. PLoS ONE 2024, 19, e0306603. [Google Scholar] [CrossRef] [PubMed]
  3. Chege, S.M.; Wang, D.; Suntu, S.L. Impact of information technology innovation on firm performance in Kenya. Inf. Technol. Dev. 2020, 26, 316–345. [Google Scholar] [CrossRef]
  4. Yrjola, S.; Ahokangas, P.; Matinmikko-Blue, M. Value Creation and Capture From Technology Innovation in the 6G Era. IEEE Access 2022, 10, 16299–16319. [Google Scholar] [CrossRef]
  5. Marusic, Z.; Aleksic, A.; Bach, M.P.; Omazic, M.A.; Zoroja, J. Determinants of Innovation in Hotel and Travel Agency Service Industry: Impact of Information and Communication Technologies and Enterprise Readiness. Interdiscip. Descr. Complex Syst. 2019, 17, 209–225. [Google Scholar] [CrossRef]
  6. Alderete, M.V. Do information and communication technology access and innovation increase outsourcing in small and medium enterprises? JISTEM—J. Inf. Syst. Technol. Manag. 2013, 10, 303–322. [Google Scholar] [CrossRef]
  7. Ashiru, F.; Nakpodia, F.; You, J.J. Adapting emerging digital communication technologies for resilience: Evidence from Nigerian SMEs. Ann. Oper. Res. 2023, 327, 795–823. [Google Scholar] [CrossRef] [PubMed]
  8. Sklyar, T.; Sokolova, E.; IOP. Driving forces for information and communication technology innovations in smart health in St. Petersburg. In Proceedings of the 2nd International Scientific Conference on Digital Transformation on Manufacturing, Infrastructure and Service (DTMIS), Saint Petersburg, Russia, 21–22 November 2018. [Google Scholar]
  9. Kalmanek, C. The Essential Elements of Successful Innovation. Acm Sigcomm Comput. Commun. Rev. 2012, 42, 105–109. [Google Scholar] [CrossRef]
  10. Soto-Acosta, P.; Del Giudice, M.; Scuotto, V. Emerging issues on business innovation ecosystems: The role of information and communication technologies (ICTs) for knowledge management (KM) and innovation within and among enterprises. Introduction to the special issue: ICTs in KM and innovation. Balt. J. Manag. 2018, 13, 298–302. [Google Scholar] [CrossRef]
  11. Yuan, J.; Pan, Y.; Jiang, Q. Mechanism of High-Tech Enterprises’ Technological Practices Affected by the Split Fault of Knowledge Innovation Network. Comput. Intell. Neurosci. 2022, 2022, 2984136. [Google Scholar] [CrossRef] [PubMed]
  12. Zhang, X.; Cui, R.; Ji, Y. Exploring Innovation Ecosystem with Multi-Layered Heterogeneous Networks of Global 5G Communication Technology. Sustainability 2024, 16, 1380. [Google Scholar] [CrossRef]
  13. Wang, L.; Wang, Y.; Lou, Y.; Jin, J. Impact of different patent cooperation network models on innovation performance of technology-based SMEs. Technol. Anal. Strateg. Manag. 2020, 32, 724–738. [Google Scholar] [CrossRef]
  14. Tan, J.; Wang, L.; Zhang, H.; Li, W. Disruptive innovation and technology ecosystem: The evolution of the intercohesive public-private collaboration network in Chinese telecommunication industry. J. Eng. Technol. Manag. 2020, 57, 101573. [Google Scholar] [CrossRef]
  15. Huggins, R.; Prokop, D. Network structure and regional innovation: A study of university-industry ties. Urban Stud. 2017, 54, 931–952. [Google Scholar] [CrossRef]
  16. Losacker, S. ‘License to green’: Regional patent licensing networks and green technology diffusion in China. Technol. Forecast. Soc. Change 2022, 175, 121336. [Google Scholar] [CrossRef]
  17. Liu, J.; Wang, Q.; Wei, C. Unleashing Green Innovation in Enterprises: The Transformative Power of Digital Technology Application, Green Human Resource, and Digital Innovation Networks. Systems 2024, 12, 11. [Google Scholar] [CrossRef]
  18. Feng, Z.; Cai, H.; Chen, Z.; Zhou, W. Influence of an interurban innovation network on the innovation capacity of China: A multiplex network perspective. Technol. Forecast. Soc. Change 2022, 180, 121651. [Google Scholar] [CrossRef]
  19. Fan, D.; Wu, X. Spatial Correlation Network Analysis of Industrial Green Technology Innovation Efficiency in China. Systems 2023, 11, 240. [Google Scholar] [CrossRef]
  20. Jin, Y.; Cao, X. An Empirical Analysis on the Impact of Innovation Network Structure on Crossover Innovation Performance of Emerging Technologies. Comput. Intell. Neurosci. 2022, 2022, 8312086. [Google Scholar] [CrossRef] [PubMed]
  21. Wang, J.P.; Wu, X.Y. Network location, product innovation strategy and innovation performance: Taking Chinese manufacturing enterprises as samples. Res. Econ. Manag. 2020, 41, 131–144. [Google Scholar]
  22. Zhao, R.; Zhang, H.; Zhang, M.Y.; Qu, F.; Xu, Y. Competitor-Weighted Centrality and Small-World Clusters in Competition Networks on Firms’ Innovation Ambidexterity: Evidence from the Wind Energy Industry. Int. J. Environ. Res. Public Health 2023, 20, 3339. [Google Scholar] [CrossRef] [PubMed]
  23. Burt, R.S. Structural holes and good ideas. Am. J. Sociol. 2004, 110, 349–399. [Google Scholar] [CrossRef]
  24. Ma, D.; Zhang, Y.-R.; Zhang, F. The Influence of Network Positions on Exploratory Innovation: An Empirical Evidence from China’s Patent Analysis. Sci. Technol. Soc. 2020, 25, 184–207. [Google Scholar] [CrossRef]
  25. Zaheer, A.; Soda, G. Network Evolution: The Origins of Structural Holes. Adm. Sci. Q. 2009, 54, 1–31. [Google Scholar] [CrossRef]
  26. Waniek, M.; Holme, P.; Rahwan, T. Hiding in Temporal Networks. IEEE Trans. Netw. Sci. Eng. 2022, 9, 1645–1657. [Google Scholar] [CrossRef]
  27. Cabeza-Pulles, D.; Fernandez-Perez, V.; Isabel Roldan-Bravo, M. Internal networking and innovation ambidexterity: The mediating role of knowledge management processes in university research. Eur. Manag. J. 2020, 38, 450–461. [Google Scholar] [CrossRef]
  28. Safadi, H.; Johnson, S.L.; Faraj, S. Who Contributes Knowledge? Core-Periphery Tension in Online Innovation Communities. Organ. Sci. 2021, 32, 752–775. [Google Scholar] [CrossRef]
  29. Li, L.; Lin, H.; Lyu, Y. Technology cluster coupling and invulnerability of industrial innovation networks: The role of centralised structure and technological turbulence. Scientometrics 2022, 127, 1209–1231. [Google Scholar] [CrossRef]
  30. Peng, Y.; Zhao, Y.; Dong, J.; Hu, J. Adaptive opinion dynamics over community networks when agents cannot express opinions freely. Neurocomputing 2025, 618, 129123. [Google Scholar] [CrossRef]
  31. Tseng, C.-Y.; Lin, S.-C.; Pai, D.-C.; Tung, C.-W. The relationship between innovation network and innovation capability: A social network perspective. Technol. Anal. Strateg. Manag. 2016, 28, 1029–1040. [Google Scholar] [CrossRef]
  32. Tortoriello, M.; McEvily, B.; Krackhardt, D. Being a Catalyst of Innovation: The Role of Knowledge Diversity and Network Closure. Organ. Sci. 2015, 26, 423–438. [Google Scholar] [CrossRef]
  33. Su, J.; Ma, Z.; Zhu, B.; Xie, H.; Oteng, A.F.; Hu, W. Collaborative Innovation Network, Knowledge Base, and Technological Innovation Performance-Thinking in Response to COVID-19. Front. Psychol. 2021, 12, 648276. [Google Scholar] [CrossRef]
  34. Ter Wal, A.L.J.; Alexy, O.; Block, J.; Sandner, P.G. The Best of Both Worlds: The Benefits of Open-specialised and Closed-diverse Syndication Networks for New Ventures’ Success. Adm. Sci. Q. 2016, 61, 393–432. [Google Scholar] [CrossRef]
  35. Li, T.; Kouyoumdjieva, S.T.; Karlsson, G.; Hui, P. Data Collection and Node Counting by Opportunistic Communication. In Proceedings of the 2019 IFIP Networking Conference (IFIP Networking), Warsaw, Poland, 20–22 May 2019. [Google Scholar]
  36. Nan, D.; Markus, A.; Oerlemans, L. Draw to a close: Inventor triad dynamics and invention quality. Ind. Innov. 2024, 1–32. [Google Scholar] [CrossRef]
  37. Li, H.Y.; Liu, Q.; Ye, H.Z. Digital Development Influencing Mechanism on Green Innovation Performance: A Perspective of Green Innovation Network. IEEE Access 2023, 11, 22490–22504. [Google Scholar] [CrossRef]
  38. Crescenzi, R.; Rodriguez-Pose, A.; Storper, M. The territorial dynamics of innovation: A Europe-United States comparative analysis. J. Econ. Geogr. 2007, 7, 673–709. [Google Scholar] [CrossRef]
  39. Carnabuci, G.; Dioszegi, B. Social networks, cognitive style, and innovative performance:A contingency perspective. Acad. Manag. J. 2015, 58, 881–905. [Google Scholar] [CrossRef]
  40. Freeman, L.C. Centrality in social networks: Conceptual clarification. Soc. Netw. 1979, 1, 215–239. [Google Scholar] [CrossRef]
  41. Bai, X.; Wu, J.; Liu, Y.; Xu, Y. Research on the impact of global innovation network on 3D printing industry performance. Scientometrics 2020, 124, 1015–1051. [Google Scholar] [CrossRef]
  42. Martin Gonzalez, A.M.; Dalsgaard, B.; Olesen, J.M. Centrality measures and the importance of generalist species in pollination networks. Ecol. Complex. 2010, 7, 36–43. [Google Scholar] [CrossRef]
  43. Gilsing, V.; Nooteboom, B.; Vanhaverbeke, W. Network embeddedness and the exploration of novel technologies: Technological distance, betweenness centrality and density. In Proceedings of the 5th International Symposium on Management of Technology, Hangzhou, China, 1–3 June 2007; pp. 301–305. [Google Scholar]
  44. Burt, R.S. Structural Holes: The Social Structure of Competition; Harvard University Press: Cambridge, MA, USA, 1992. [Google Scholar]
  45. Rice, J.C.; Rivard, D. The dual role of indicators in optimal fisheries management strategies. ICES J. Mar. Sci. 2007, 64, 775–778. [Google Scholar] [CrossRef]
  46. Tortoriello, M.; Reagans, R.; Mcevily, B. Bridging the Knowledge Gap: The Influence of Strong Ties, Network Cohesion, and Network Range on the Transfer of Knowledge Between Organisational Units. Organ. Sci. 2012, 23, 1024–1039. [Google Scholar] [CrossRef]
  47. Lu, Q.; Zhou, Y.; Chen, J.; Deng, Y. How do director networks improve digital innovation in China? An explanation grounded in knowledge-based view. Int. J. Technol. Manag. 2025, 97, 242–274. [Google Scholar] [CrossRef]
  48. Fleming, L. Recombinant uncertainty in technological search. Manag. Sci. 2001, 47, 117–132. [Google Scholar] [CrossRef]
  49. Schilling, M.A.; Phelps, C.C. Interfirm Collaboration Networks: The Impact of Large-Scale Network Structure on Firm Innovation. Manag. Sci. 2007, 53, 1113–1126. [Google Scholar] [CrossRef]
  50. Dyer, J.H.; Nobeoka, K. Creating and managing a highperformance knowledge-sharing network: The Toyota case. Strateg. Manag. J. 2000, 21, 345–365. [Google Scholar] [CrossRef]
  51. Cheng, C.C.J.; Shiu, E.C. The inconvenient truth of the relationship between open innovation activities and innovation performance. Manag. Decis. 2015, 53, 625–647. [Google Scholar] [CrossRef]
  52. Soda, G.; Zaheer, U.A. Network memory: The influence of past and current networks on performance. Acad. Manag. J. 2004, 47, 893–906. [Google Scholar] [CrossRef]
  53. Trajtenberg, M. Patents as Indicators of Innovation, Economic Analysis of Product Innovation; Harvard University Press: Cambridge, MA, USA, 1990. [Google Scholar]
  54. Ma, Y.; Yang, X.; Qu, S.; Kong, L. Research on the formation mechanism of big data technology cooperation networks: Empirical evidence from China. Scientometrics 2022, 127, 1273–1294. [Google Scholar] [CrossRef]
  55. Guan, J.; Zhang, J.; Yan, Y. The impact of multilevel networks on innovation. Res. Policy 2015, 44, 545–559. [Google Scholar] [CrossRef]
  56. Iino, T.; Noue, H.I.; Saito, Y.U.; Todo, Y. How does the global network of research collaboration affect the quality of innovation? Jpn. Econ. Rev. 2021, 72, 5–48. [Google Scholar] [CrossRef]
  57. Ma, S.; Zeng, G. Effects of Network Closure on Cooperative Innovation: Evidence from Dongying’s Petroleum Equipment Industry in China. Chin. Geogr. Sci. 2019, 29, 517–527. [Google Scholar] [CrossRef]
  58. Woods, J.; Galbraith, B.; Hewitt-Dundas, N. Network Centrality and Open Innovation: A Social Network Analysis of an SME Manufacturing Cluster. IEEE Trans. Eng. Manag. 2022, 69, 351–364. [Google Scholar] [CrossRef]
  59. Gnyawali, D.R.; Madhavan, R. Cooperative networks and competitive dynamics: A structural embeddedness perspective. Acad. Manag. Rev. 2001, 26, 431–445. [Google Scholar] [CrossRef]
  60. Choi, H.; Zo, H. Network Closure Versus Structural Hole: The Role of Knowledge Spillover Networks in National Innovation Performance. IEEE Trans. Eng. Manag. 2022, 69, 1011–1021. [Google Scholar] [CrossRef]
  61. Yu, S.-H.; Chen, H.-C. External knowledge, intraorganisational networks and exploratory innovation: An empirical examination. Innov.-Organ. Manag. 2020, 22, 250–269. [Google Scholar] [CrossRef]
  62. Cen, J.; Zhou, L.; Zhang, Z. Who are building technical knowledge mansions? Impact of patent cooperation networks on the generic technology R&D performance of emerging enterprises. Technol. Anal. Strateg. Manag. 2022, 34, 1384–1401. [Google Scholar] [CrossRef]
  63. Qiao, G.; Hou, S.; Chen, Q.; Xiang, G.; Prideaux, B. Role of Body in Travel: Wheelchair Users’ Experience From a Multi-Sensory Perspective. J. Travel Res. 2024. [Google Scholar] [CrossRef]
  64. Qiao, G.; Chen, H.; Li, G.; Liu, H.; Wang, X. The role of filial piety in filial tourism: An intergenerational analysis of decision-making. Asia Pac. J. Tour. Res. 2024, 29, 1017–1031. [Google Scholar] [CrossRef]
  65. Lavie, D.; Drori, I. Collaborating for Knowledge Creation and Application: The Case of Nanotechnology Research Programs. Organ. Sci. 2012, 23, 704–724. [Google Scholar] [CrossRef]
Figure 1. The theoretical model of this paper.
Systems 13 00126 g001
Figure 2. Trends of cooperation patents in the communications industry.
Systems 13 00126 g002
Figure 3. Visualisation of cooperation networks.
Systems 13 00126 g003
Figure 4. The regional distribution of innovative organisations.
Systems 13 00126 g004
Figure 5. The characteristics of cross-organisational cooperation in the communications industry.
Systems 13 00126 g005
Table 1. The structure index of the networks.
Network Index2002–20102011–20162017–2021
Number of nodes24151388
Number of edges15129335
Density0.0540.0110.005
Average distance1.2111.9482.724
Clustering coefficient0.60.850.75
Average degree1.251.711.73
Table 2. The number and proportion of innovative organisation types.
Organisation Type2002–20102011–20162017–2021
NumberProportionNumberProportionNumberProportion
Enterprises1562.50%11475.50%27671.13%
Universities312.50%2214.57%4912.63%
Research institutes625.00%159.93%6316.24%
Table 3. The descriptive statistics and correlation analysis of variables (2002–2010).
MeanStd. Dev12345678
TI11.4223.541.00
C0.130.34−0.151.00
NC0.920.16−0.50 *−0.64 *1.00
BC0.070.250.87 *−0.10−0.67 *1.00
SH1.030.180.76 *−0.35−0.50 *0.92 *1.00
ES2.250.530.61 *0.54 *−0.99 *0.77 *0.58 *1.00
GC15.217.660.19−0.58 *0.250.210.36−0.181.00
OC1.630.88−0.120.31−0.06−0.19−0.280.02−0.201.00
Note: * p < 0.1.
Table 4. The descriptive statistics and correlation analysis of variables (2011–2016).
MeanStd. Dev12345678
TI8.8217.361.00
C0.270.44−0.19 *1.00
NC0.870.20−0.19 *−0.75 *1.00
BC0.050.610.48 *−0.04−0.35 *1.00
SH1.010.160.55 *−0.30 *−0.40 *0.51 *1.00
ES2.713.310.48 *0.11−0.54 *0.98 *0.57 *1.00
GC15.056.930.11−0.03−0.030.09−0.06−0.011.00
OC1.340.650.19 *−0.21 *0.14−0.050.09−0.06−0.011.00
Note: * p < 0.1.
Table 5. The descriptive statistics and correlation analysis of variables (2017–2021).
MeanStd. Dev12345678
TI10.5525.271.00
C0.260.43−0.091.00
NC0.850.21−0.27 *−0.71 *1.00
BC0.020.210.25 *−0.05−0.30 *1.00
SH1.040.190.48 *−0.25 *−0.49 *0.40 *1.00
ES2.732.860.33 *0.15 *−0.54 *0.93 *0.48 *1.00
GC16.167.72−0.01−0.01−0.050.060.080.071.00
OC1.450.760.12 *−0.11 *0.06−0.050.06−0.050.071.00
Note: * p < 0.1.
Table 6. The VIF values of the model in the communications industry.
VIF (2002–2010)VIF (2011–2016)VIF (2017–2021)
Model 11.661.041.02
Model 27.921.221.21
Model 32.551.544.24
Model 41.861.261.17
Model 57.309.224.83
Model 61.461.381.25
Model 71.639.056.76
Model 89.511.371.32
Table 7. The results of negative binomial regression in the communications industry (2002–2010).
Model 1Model 2Model 3Model 4Model 5Model 6Model 7Model 8
ES1.449 ***5.521 ***−1.372 *−0.6800.900 *1.449 ***−1.614 *2.061 ***
GC−0.0090.0350.001−0.0050.047−0.009−0.008−0.007
OC0.3540.1300.2940.3450.1010.3540.3430.352
C−3.082 *** −2.327 *−3.830 ***
NC 16.884 ** −14.000 *12.244 ***
BC 4.955 *** 1.320 7.212 ***
SH 5.955 *** −1.570 4.558 ***
C×BC 0.293 ***
C×SH −3.523 ***
NC×BC 10.494 ***
NC×SH 8.583 ***
Constant−1.348−26.71 ***4.250 **−3.122 ***−0.781−1.3484.781 **−11.20 ***
Wald χ2255.6 ***12.14 ***134.94 ***48.31 ***12.14 ***255.6 ***323.97 ***75.02 ***
Log likelihood−72.938−75.013−73.193−73.479−76.599−72.938−72.913−73.266
Note: * p < 0.1, ** p < 0.05, *** p < 0.01.
Table 8. The results of negative binomial regression in the communications industry (2011–2016).
Model 1Model 2Model 3Model 4Model 5Model 6Model 7Model 8
ES0.092 **0.082 ***0.080−0.0050.064 ***0.097 *0.0170.136 **
GC0.0180.0220.0220.0190.0230.0180.0240.020
OC0.692 ***0.878 ***0.877 ***0.689 ***0.886 ***0.702 ***0.882 ***0.783 ***
C−0.944 *** −1.478 ***−0.159
NC 0.172 7.142 ***3.216
BC −0.027 −2.560 *** −9.569 ***
SH 2.805 *** 2.144 *** 4.145 ***
C×BC 2.381 **
C×SH −0.946 ***
NC×BC 6.522
NC×SH 1.649 **
Constant0.718 *0.0920.250−2.131 ***0.2500.690 *0.352−1.209 *
Wald χ248.55 ***116.37 ***221.61 ***142.91 ***106.06 ***40.18 ***77.15 ***31.29 ***
Log likelihood−451.890−458.671−458.723−450.452−458.546−452.748−458.126−455.169
Note: * p < 0.1, ** p < 0.05, *** p < 0.01.
Table 9. The results of negative binomial regression in the communications industry (2017–2021).
Model 1Model 2Model 3Model 4Model 5Model 6Model 7Model 8
ES0.393 **0.051 **0.359 ***0.0010.259 *0.414 *0.255 *0.523
GC0.0040.0030.0020.0060.0010.0050.0020.002
OC0.592 ***0.722 ***0.700 ***0.562 ***0.712 ***0.598 ***0.711 ***0.623 ***
C−0.878 ** −1.120 ***−1.695
NC −1.565 *** 0.5510.722
BC −3.385 *** −5.906 *** −6.397 *
SH 3.103 *** 2.707 *** 3.484 ***
C×BC −5.687 ***
C×SH −0.837 *
NC×BC −2.276 **
NC×SH 2.080
Constant0.3692.237 ***0.173−2.121 ***0.4140.2750.424−2.034
Wald χ229.22 ***69.41 ***46.61 ***177.76 ***23.51 ***24.88 ***27.48 ***24.35 ***
Log likelihood−1221.25−1225.08−1223.99−1194.54−1231.68−1223.85−1231.61−1225.26
Note: * p < 0.1, ** p < 0.05, *** p < 0.01.
Table 10. Results of dependent variable lag (2002–2010).
Model 1Model 2Model 3Model 4Model 5Model 6Model 7Model 8
ES1.486 ***6.020 ***−1.461 *−0.6880.926 **1.486 ***−5.4823.577 ***
GC−0.0060.0390.002−0.0010.053−0.006−0.005−0.005
OC0.4500.2110.3940.4360.1670.4500.4380.438
C−3.160 *** −1.906−4.395 ***
NC 18.660 *** −11.46514.049 ***
BC 5.170 *** 2.187 ** 7.012 **
SH 6.109 *** −2.600 ** 4.431 **
C×BC 2.410 *
C×SH −3.612 ***
NC×BC 10.799 ***
NC×SH 8.792 ***
Constant−1.475−29.51 ***4.389 **−3.316 ***−0.874−1.4754.842 **−11.59 ***
Wald χ2211.46 ***56.89 ***188.11 ***44.41 ***12.28 ***211.46 ***336.11 ***66.10 ***
Log likelihood−76.411−78.107−76.509−76.977−79.822−76.411−76.347−76.767
Note: * p < 0.1, ** p < 0.05, *** p < 0.01.
Table 11. Results of dependent variable lag (2011–2016).
Model 1Model 2Model 3Model 4Model 5Model 6Model 7Model 8
ES0.094 ***0.838 ***0.1100.0110.075 ***0.098 ***0.0370.129 ***
GC0.0270.0290.0290.0260.0300.0260.0300.278
OC0.785 ***0.953 ***0.952 ***0.782 ***0.958 ***0.791 ***0.955 ***0.861 ***
C−0.766 *** −1.234 ***0.843
NC 0.037 5.400 **2.265
BC −0.156 −2.315 *** −7.443 ***
SH 2.466 *** 2.172 *** 3.376 **
C×BC 1.523
C×SH −0.788 ***
NC×BC 5.030
NC×SH 1.345 **
Constant0.4780.0480.023−2.006 ***0.0800.4630.159−1.092 *
Wald χ249.29 ***216.74 ***382.04 ***185.12 ***104.2 ***44.45 ***97.34 ***37.28 ***
Log likelihood−460.170−464.603−464.580−457.976−464.540−460.560−464.273−462.292
Note: * p < 0.1, ** p < 0.05, *** p < 0.01.
Table 12. Results of dependent variable lag (2017–2021).
Model 1Model 2Model 3Model 4Model 5Model 6Model 7Model 8
ES0.406 **0.046 *0.366 ***−0.0070.266 **0.430 *0.264 *0.543 *
GC0.0060.0060.0050.0080.0040.0070.0040.005
OC0.628 ***0.767 ***0.746 ***0.584 ***0.759 ***0.634 ***0.758 ***0.657 ***
C−0.901 ** −1.128 ***−1.317
NC −1.665 *** 0.1280.621
BC −3.325 *** −5.798 *** −5.350 *
SH 3.201 *** 2.899 *** 3.533 **
C×BC −4.435 *
C×SH −0.874 *
NC×BC −2.297 **
NC×SH 2.162
Constant0.3312.2970.120−2.202 ***0.3590.2290.365−2.171
Wald χ230.47 ***59.82 ***47.06 ***182.24 ***23.26 ***26.01 ***29.40 ***25.32 ***
Log likelihood−1225.08−1228.12−1228.08−1201.43−1234.32−1227.08−1234.16−1228.38
Note: * p < 0.1, ** p < 0.05, *** p < 0.01.
Disclaimer/Publisher’s Note: The statements, opinions and data contained in all publications are solely those of the individual author(s) and contributor(s) and not of MDPI and/or the editor(s). MDPI and/or the editor(s) disclaim responsibility for any injury to people or property resulting from any ideas, methods, instructions or products referred to in the content.

