Article

Digital Transformation for Sustainability in Industry 4.0: Alleviating the Corporate Digital Divide and Enhancing Supply Chain Collaboration

1
Business School, Huaqiao University, Quanzhou 362021, China
2
Business School, Liaoning University, Shenyang 110036, China
3
Sunwah International Business School, Liaoning University, Shenyang 110036, China
*
Author to whom correspondence should be addressed.
Systems 2025, 13(2), 123; https://doi.org/10.3390/systems13020123
Submission received: 22 January 2025 / Revised: 12 February 2025 / Accepted: 14 February 2025 / Published: 17 February 2025
(This article belongs to the Special Issue Sustainable Business Model Innovation in the Era of Industry 4.0)

Abstract

:
The swift advancement of digital technologies under Industry 4.0 has significantly transformed business operations and supply chain management. These advancements hold the potential to improve efficiency, reduce waste, and foster sustainable development; however, they also create challenges due to the uneven adoption of digital technologies across enterprises. (1) Background: The adoption of digital technologies across supply chains is uneven, resulting in a digital divide between enterprises. This disparity disrupts supply chain collaboration and alignment with sustainable practices. (2) Methods: This research examines how the corporate digital divide affects the supply–demand imbalance by employing a quantitative method to identify obstacles and strategies for improving collaboration. This research employs a quantitative approach, specifically multiple regression analysis, to investigate how the digital divide among enterprises affects the supply–demand imbalance and to identify strategies for overcoming collaboration barriers. The research utilizes firm-level data from the Chinese stock market and accounting research databases and performs robustness checks, including methods such as the instrumental variable approach and the Heckman two-stage model, to ensure the validity of the findings. (3) Results: The study finds that the corporate digital divide exacerbates imbalances in both upstream and downstream chains. Elevating supply chain resilience has effectively alleviated this relationship. Specifically, the strengthening of resource resilience and process resilience has effectively alleviated the impact of the corporate digital divide on the supply–demand imbalance in the upstream supply chain, while the enhancement of system resilience and product resilience has effectively mitigated the impact of the corporate digital divide on the supply–demand imbalance in the downstream supply chain. Heterogeneity analysis indicates that the impact of the digital divide in supply chain enterprises on supply–demand imbalance varies under different conditions of network centrality, supply chain concentration, government digital focus, and enterprise nature. (4) Conclusions: To foster sustainability in Industry 4.0, enterprises must bridge the corporate digital divide and enhance supply chain collaboration. It is recommended to mitigate upstream supply chain disruptions caused by the digital divide by improving resource and process resilience while alleviating downstream impacts through strengthened system and product resilience. Furthermore, fostering collaborative digital development among enterprises is essential for optimizing supply chain sustainability.

1. Introduction

The rapid advancement of Industry 4.0 technologies, such as artificial intelligence (AI), the Internet of Things (IoT), and big data analytics, has fundamentally transformed business operations and supply chain management [1]. These technologies provide significant advantages, including enhanced operational efficiency, real-time decision-making, and optimized resource allocation, while also driving sustainable business model innovations [2]. However, the adoption of these technologies across supply chain enterprises remains highly uneven, creating a corporate digital divide that disrupts supply chain coordination and supply–demand alignment [3].
To systematically analyze this issue, this study adopts a dual-theoretical approach, integrating the Technology–Organization–Environment (TOE) framework and Diffusion of Innovation (DOI) theory. The TOE framework explains the determinants of digital adoption at the firm level through three key dimensions [4]. Technological factors include IT infrastructure, data interoperability, and the extent of Industry 4.0 technology adoption. Organizational factors encompass strategic commitment to digital transformation, workforce digital competencies, and operational adaptability. Environmental factors refer to regulatory pressures, competitive market dynamics, and the digitalization level of supply chain partners. These factors collectively shape firms’ digital transformation trajectories, influencing their ability to integrate into digitalized supply chain ecosystems.
Complementing the TOE framework, DOI theory provides a lens to understand the varying rates of Industry 4.0 technology adoption [5]. Early adopters leverage digital solutions to gain a competitive edge, while laggards face structural constraints related to resources, operational processes, and organizational inertia, further exacerbating the corporate digital divide. These disparities in digitalization levels across supply chain enterprises have profound implications for supply–demand alignment, contributing to imbalances within the supply chain [6]. For example, digitally advanced firms utilize IoT-enabled real-time demand forecasting, while less digitalized firms rely on traditional, experience-based forecasting methods and manual processes [7]. This divergence results in information asymmetry and an amplified bullwhip effect [8], leading to inefficiencies in inventory management, production scheduling, and resource allocation [9].
Beyond these operational inefficiencies, the supply–demand imbalance also disrupts collaborative decision-making, risk management, and firms’ responsiveness to market volatility [10]. The absence of inter-organizational digital collaboration mechanisms exacerbates production misalignment, suboptimal resource utilization, and reduced innovation potential, ultimately hindering supply chain adaptability and operational efficiency [11]. Given these challenges, supply chain resilience emerges as a key mechanism for mitigating the negative effects of the corporate digital divide [12]. Resilience enables firms to respond to digital disparities by incorporating resource flexibility, process adaptability, system interoperability, and product agility, ensuring continued operational stability in complex market environments.
Unlike traditional linear supply chains that rely on sequential decision-making and struggle to accommodate the dynamic demands of Industry 4.0, resilient supply chains leverage decentralized coordination frameworks to enhance digital adaptability [13]. For instance, the extended agent-oriented smart factory (xAOSF) framework facilitates intelligent agent-based decision-making, improving digital synchronization across supply chain stakeholders and mitigating the risks associated with digital asymmetry [14]. By reinforcing resilience at the resource, process, system, and product levels, firms can counteract the negative effects of digital disparities on supply–demand balance.
This study examines how the corporate digital divide in supply chain enterprises affects supply–demand imbalances. Additionally, it explores how enhancing supply chain resilience across four dimensions—resources, processes, systems, and products—can mitigate the negative consequences of the digital divide. By integrating insights from Industry 4.0, digital transformation, and supply chain resilience literature, this study fills a critical research gap by investigating the interplay between corporate digital disparities and supply chain resilience. The findings contribute theoretically to digital transformation and supply chain management research and offer practical insights for firms aiming to navigate digital asymmetries and foster more adaptive, resilient, and sustainable supply chain ecosystems.
The structure of this article is as follows: Section 2 presents a review of the relevant literature, Section 3 introduces the theoretical framework, Section 4 and Section 5 describe the research methodology and empirical analysis, Section 6 and Section 7 discuss the mechanism and heterogeneity analyses, and Section 8 and Section 9 provide the discussion and conclusions.

2. Literature Review

2.1. Theoretical Foundations of Digital Transformation in Industry 4.0

In the context of Industry 4.0, digital transformation has become a key driver for enhancing competitiveness, particularly in supply chain management [7]. The varying adoption levels of digital technologies among supply chain enterprises have resulted in a corporate digital divide, which disrupts supply chain coordination and supply–demand balance. The TOE framework and the DOI theory provide theoretical support for understanding this phenomenon. The TOE framework explains the determinants of digital adoption at the enterprise level from three dimensions: technological capability, organizational readiness, and external environmental pressure [15]. Meanwhile, the DOI theory describes how innovations spread across enterprises, classifying them into different adopter categories and revealing the uneven nature of digital adoption [16].
The TOE framework identifies three key factors influencing digital adoption [17]. Technological factors include the availability and complexity of digital tools such as AI and cloud computing. Organizational factors encompass firm size, managerial support, and financial resources, with larger firms and those with strong digital leadership being more likely to adopt new technologies. Environmental factors involve market competition, regulatory policies, and supply chain partner influence. The uneven distribution of these factors among enterprises leads to disparities in digitalization levels, thereby disrupting supply chain efficiency and coordination.
Existing studies support the applicability of the TOE framework in supply chain digital adoption. Kakhki and Sajadi (2024) pointed out that enterprises’ adoption of business analytics (BA) technology is influenced by a combination of TOE factors, emphasizing that customized digital strategies are more effective than generic solutions [15]. Duan et al. (2022) examined digital adoption in supply chain financing for SMEs and found that the combination of technological level, information-sharing capability, and supply chain capacity determines enterprises’ digital performance, further validating the relevance of the TOE framework [18]. Chatha et al. (2024) analyzed manufacturing firms and highlighted the critical role of aligning socio-technical factors with external environments for supply chain integration (SCI), showing that well-structured organizations are more likely to succeed in digital transformation [19]. Tian et al. (2021) studied the impact of competitive pressure on supply chain integration, revealing that market competition drives digitalization in customer integration but has a more complex effect on internal integration [20]. Additionally, Tarofder et al. (2019) validated the adoption model of Web 2.0 in supply chain management, finding that managerial support is particularly crucial for firms with limited digital experience, underscoring the significance of organizational factors in technology adoption [21].
In summary, the TOE framework provides a systematic theoretical foundation for understanding the key determinants of enterprise digital adoption. Therefore, this study adopts the TOE framework to analyze the critical factors influencing digital transformation in supply chain enterprises and explores their impact on supply chain coordination.
The DOI theory complements the TOE framework by explaining the diffusion process of digital adoption. Supply chain enterprises can be classified into innovators, early adopters, early majority, late majority, and laggards, with leading firms typically adopting digital technologies first while others lag behind [22]. This asynchronous digitalization process leads to technological misalignment, where digitally advanced firms rely on predictive analytics and automation while less digitalized firms continue using traditional methods. The gap in digital adoption levels among enterprises results in lower supply chain efficiency, hinders real-time decision-making, and threatens overall supply chain coordination.
Grabham and Manu (2022) explored the diffusion of platform thinking in the construction supply chain, suggesting that the industry’s fragmented management has long hindered the penetration of innovative technologies, whereas the promotion of platform thinking could optimize supply chain structures and serve as a reference for future innovations [23]. Qader et al. (2023) examined the diffusion of innovation in the halal meat supply chain, finding that relative advantage, compatibility, and complexity, as outlined in DOI theory, are key determinants of technological adoption [24]. Additionally, Moraes et al. (2025) applied the DOI framework to analyze the adoption of blockchain in supply chain management (SCM), identifying 16 major barriers, such as scalability and privacy concerns, and proposing a three-stage adoption framework covering technology introduction, adoption decision-making, and implementation, to facilitate blockchain integration [5].
Overall, the DOI theory provides theoretical support for understanding the differentiated adoption process of digital technologies among supply chain enterprises and reveals the mechanisms of technological diffusion within supply chain networks. Therefore, this study incorporates the DOI framework to investigate how the corporate digital divide affects supply chain coordination.
By integrating the TOE framework and DOI theory, this study provides a comprehensive understanding of digital transformation in supply chains. The TOE framework identifies the determinants of digital adoption, while the DOI theory explains the dynamic process of technological diffusion. Together, they offer a systematic theoretical foundation for analyzing the corporate digital divide in supply chains and its impact on supply chain coordination.

2.2. Digital Transformation and Supply Chain Collaboration in Industry 4.0

The advancement of Industry 4.0 technologies has facilitated real-time data sharing, improved supply chain visibility, and enhanced collaboration [25]. Research highlights how AI-powered decision systems, blockchain-enabled traceability, and IoT-driven real-time monitoring contribute to more resilient supply chain ecosystems [26]. Existing research indicates that the improvement of supply chain collaboration efficiency depends on firms’ ability to integrate core digitalized processes, including smart factory systems (which enable automated production planning and quality control) [27], autonomous warehousing solutions (such as decentralized coordination mechanisms based on the agent-oriented smart factory framework) [28], and big-data-driven logistics optimization (which utilizes real-time analytics for accurate demand forecasting and inventory management) [29].
However, the process of realizing the benefits of digital transformation within the supply chain often faces significant challenges [30]. Disparities in digital capabilities among enterprises diminish collaborative efficiency across the supply chain. Highly digitalized enterprises can swiftly respond to market changes and optimize supply chain resources, whereas less digitalized enterprises struggle to collaborate efficiently due to inadequate technological capabilities [31]. Such disparities manifest in disrupted information flows, decision-making failures, and inefficient resource allocations, ultimately weakening the overall supply chain collaboration. Based on the aforementioned research, existing studies predominantly focus on the digital transformation of individual enterprises, with limited analysis of how these technologies enable comprehensive collaboration at the supply chain level. The unequal adoption of digital technologies not only hinders the full application of Industry 4.0 advancements but also limits their potential contributions to supply chain sustainability and resilience.

2.3. Digital Factors Contributing to the Supply–Demand Imbalance

Challenges in supply chain collaboration often result in mismatches between supply and demand, which are further exacerbated by inconsistencies in digital adoption. Research shows that differences in digitalization significantly impact companies’ ability to react to demand changes and modify production, thereby exacerbating the supply–demand imbalance within the supply chain [32].
Supply–demand imbalance, a key challenge in supply chain management, is shaped not only by fluctuations in market demand and external environmental factors but also by the uneven integration of digital technologies in the era of Industry 4.0. Research reveals that while highly digitalized enterprises optimize production and inventory management through precise demand forecasting and real-time data analysis, less digitalized enterprises, lacking timely information and resource adjustment capabilities, often struggle to synchronize their operations with the rest of the supply chain [33]. This imbalance leads not only to overstocking or stockouts but also to broader resource waste and declining production efficiency. While the existing literature has explored how digital transformation improves supply–demand alignment within the supply chain, it has insufficiently analyzed the specific role of the digital divide in driving such imbalances.

2.4. The Evolution of Supply Chain Resilience in the Context of Industry 4.0

The research scope of traditional supply chain resilience has primarily focused on addressing supply chain disruptions, mitigating risks, and facilitating recovery [34]. However, in the era of Industry 4.0, its scope has expanded to include supporting digital transformation, advancing intelligent decision-making, and enhancing point-to-point collaboration [35]. Existing research has found that supply chain resilience improves efficiency and promotes sustainable optimization through four core dimensions: resource flexibility, process adaptability, system flexibility, and product agility [36].
Resource flexibility allows firms to dynamically allocate and utilize resources, thus reducing the negative effects of technological disparities. For instance, cloud computing and shared manufacturing enable less digitalized enterprises to leverage external resources to enhance supply chain management capabilities [37]. Process adaptability reflects a firm’s ability to optimize production processes and operational models to align with digitalized supply chains. For example, AI-powered decision-making systems and end-to-end visibility (enabled by IoT and big data analytics) minimize decision-making delays, allowing less digitalized firms to respond efficiently to demand fluctuations [38]. System flexibility allows enterprises to adjust supply chain strategies in response to market and technological changes. For example, blockchain-enabled smart contracts improve supply chain transparency and trust among partners, while API integration facilitates seamless data exchange, enabling low-digitization firms to connect with more advanced digital supply chains [39]. Product agility enables firms to swiftly adapt product designs and supply chain strategies to market fluctuations. Illustratively, modular production and digital twin technology allow enterprises to optimize supply chain decision making and enhance their responsiveness to market dynamics [40].
In summary, supply chain resilience plays a crucial role in narrowing the digital gap among enterprises. Future research should further explore how supply chain resilience can bridge the digital divide between supply chain partners, enhancing overall coordination and sustainability.

2.5. Research Gaps and Study Objectives

To sum up, while considerable advancements have been made in the literature on digital transformation during Industry 4.0, there are still several areas that require further exploration. First, existing research predominantly centers on the digital transformation of individual companies, with little attention given to how the digital divide influences collaboration within the supply chain. Second, there is a notable absence of comprehensive theoretical frameworks and empirical data on how the corporate digital divide contributes to the supply–demand imbalance. Third, research on mechanisms for mitigating the corporate digital divide and enhancing supply chain collaboration is underdeveloped, particularly in terms of empirical validation.
Building on these divides, this research seeks to investigate how digital transformation for sustainability can be achieved in the context of Industry 4.0 by systematically analyzing the influence of the corporate digital divide on the supply–demand imbalance and identifying strategies for mitigating this divide. By integrating theoretical frameworks with empirical analysis, this study seeks to provide new insights and evidence-based recommendations for fostering a collaborative, resilient, and sustainable supply chain.

3. Theoretical Analysis and Research Hypotheses

In the era of Industry 4.0, digital transformation has become a cornerstone for enhancing supply chain collaboration and fostering sustainability [41]. However, the uneven adoption of advanced technologies such as AI, the IoT, and blockchain has led to a growing corporate digital divide within supply chains. This divide disrupts information symmetry, resource allocation, and collaborative decision making, ultimately exacerbating the supply–demand imbalance [42]. While prior research has examined the impact of digital transformation on individual enterprises, there is still limited understanding of how the digital divide influences supply-chain-wide collaboration and sustainability, especially in the context of Industry 4.0 [43].
The corporate digital divide manifests as disparities in technological infrastructure, organizational readiness, and environmental adaptability among supply chain partners. These disparities hinder the establishment of effective digital collaboration mechanisms, which are critical for aligning supply and demand. Enterprises with a low level of digitalization often struggle to integrate into digitally advanced ecosystems, resulting in inefficiencies in information flow, resource allocation, and decision making [44]. This misalignment not only escalates operational costs but also creates imbalances in profit distribution and intensifies conflicts of interest, ultimately undermining supply chain resilience and sustainability [45].
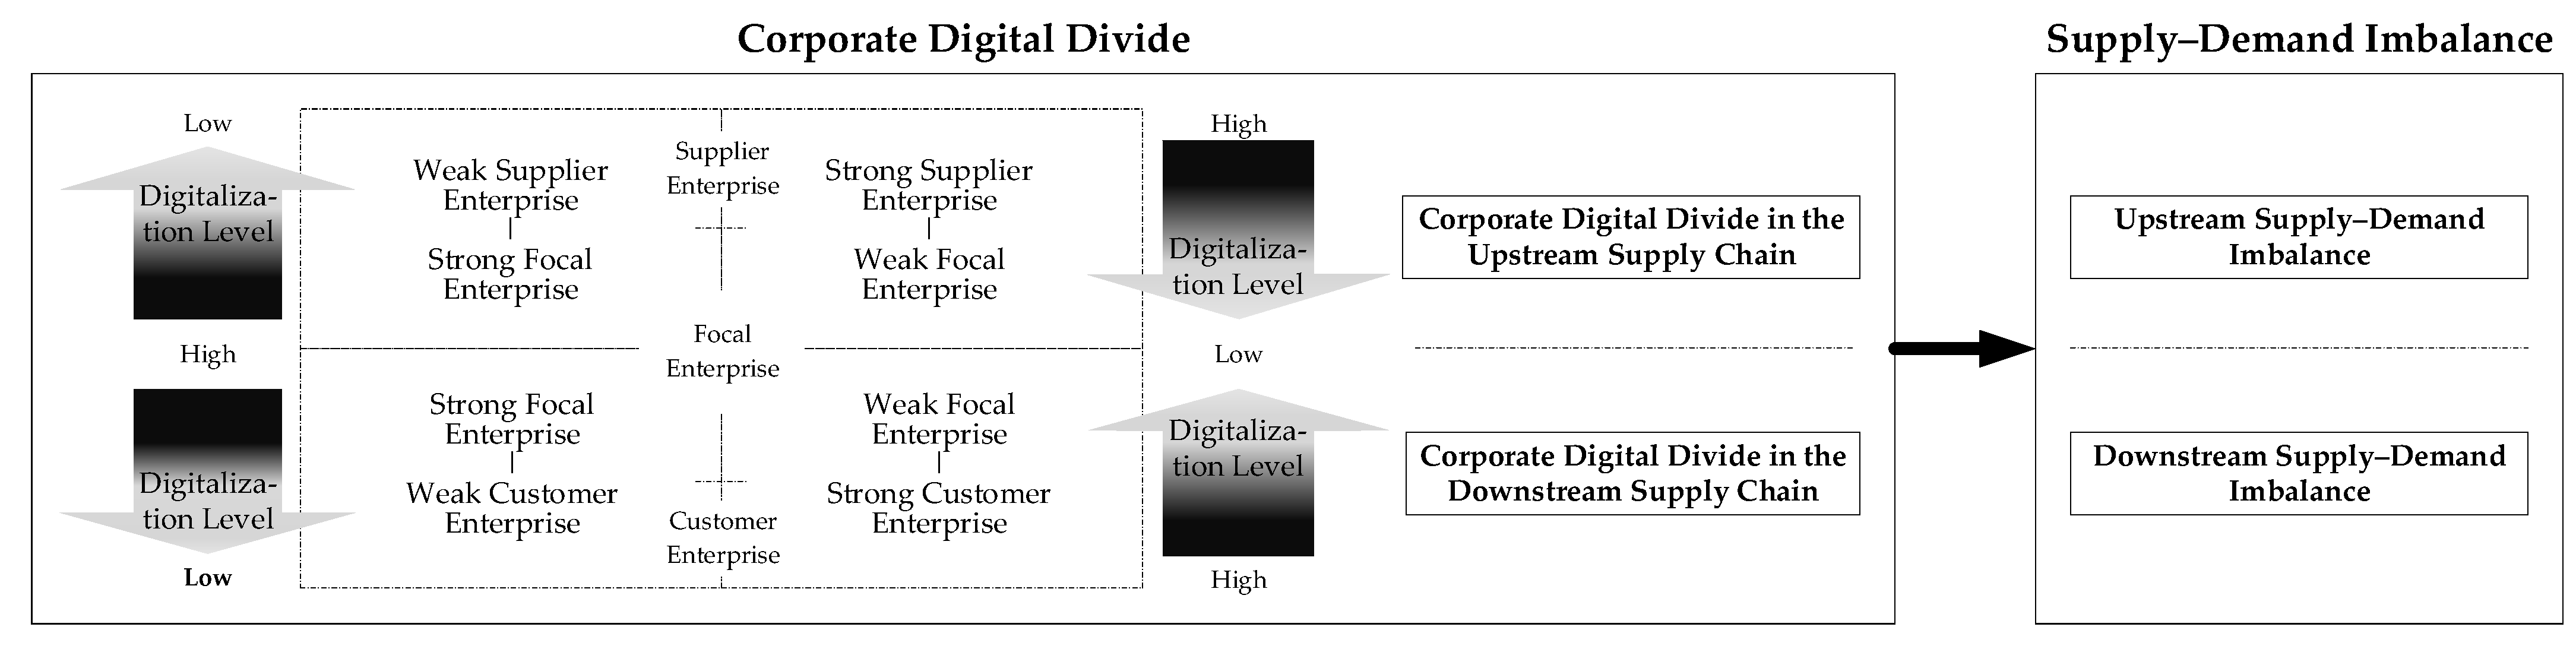
To systematically analyze the impact of the corporate digital divide on supply–demand imbalances, this study adopted a focal enterprise perspective. The focal enterprise is situated between upstream suppliers and downstream customers, and its digital transformation level relative to these partners determines the nature and extent of the supply–demand imbalance. By examining the upstream and downstream dynamics separately, this study provides a granular understanding of how digital disparities disrupt supply chain coordination.

3.1. The Corporate Digital Divide and the Supply–Demand Imbalance in the Upstream Supply Chain

The upstream supply chain is particularly vulnerable to the corporate digital divide, as suppliers often face resource and capability constraints that limit their ability to match the digital transformation efforts of focal enterprises.
When the focal enterprise’s digital transformation exceeds that of its suppliers, resource and capability mismatches emerge. Digital transformation often leads focal enterprises to set higher standards for supplier inputs, requiring advanced technological capabilities and resource flexibility [46]. However, suppliers with limited digital adoption may fail to meet these demands, leading to supply–demand mismatches. For example, in a smart factory context, suppliers lacking IoT-enabled predictive maintenance capabilities may struggle to deliver components that meet the focal enterprise’s real-time production needs [47]. To compensate for supplier deficiencies, focal enterprises may adopt vertical integration strategies, acquiring upstream resources directly [48]. While this approach accelerates the focal enterprise’s digital transformation, it marginalizes suppliers, eroding their profitability and intensifying supply–demand conflicts. This dynamic is particularly evident in industries where autonomous warehousing solutions are critical, as suppliers without such capabilities are often excluded from collaborative networks [49]. Additionally, digital transformation reduces geographical constraints, enabling focal enterprises to collaborate with more digitally advanced suppliers [50]. When focal enterprises replace existing suppliers, established partnerships are disrupted, leading to severe supply–demand imbalances. This phenomenon is amplified in ecosystems where agent-oriented storage and retrieval (AOSR) systems are employed, as suppliers lacking interoperability with these systems face exclusion [51].
Alternatively, when the focal enterprise’s digital transformation falls behind that of its suppliers, obstacles to innovation diffusion emerge. According to the DOI theory, the successful implementation of digital innovations by suppliers depends on their partners’ ability to adopt and utilize these technologies [52]. If the focal enterprise’s digital capabilities fall short, suppliers lose opportunities for digital validation and enhancement, reducing their motivation to maintain the partnership. This dynamic is particularly relevant in smart factory environments, where interoperability and real-time data exchange are critical. Furthermore, digitally advanced suppliers may leverage their capabilities to bypass the focal enterprise and collaborate directly with downstream customers. For instance, suppliers using blockchain-enabled traceability systems can establish direct relationships with end consumers, reducing their reliance on the focal enterprise [53]. This market encroachment disrupts existing supply–demand relationships and exacerbates imbalances.
Based on this analysis, the following hypothesis is proposed.
Hypothesis 1. 
The corporate digital divide between the focal enterprise and its suppliers, stemming from differences in their digital transformation levels, amplifies the supply–demand imbalance in the upstream supply chain.

3.2. The Corporate Digital Divide and the Supply–Demand Imbalance in the Downstream Supply Chain

The downstream supply chain is equally susceptible to the corporate digital divide, as customer enterprises’ digital transformation levels influence their ability to collaborate with focal enterprises.
When the focal enterprise’s digital transformation exceeds that of its customers, resource optimization and market misalignment occur. Digital transformation enables focal enterprises to optimize resource allocation and develop innovative, high-value products [54]. However, if customer enterprises lack comparable digital capabilities, they may struggle to integrate these products into their operations. For example, in industries reliant on autonomous warehousing, customers without IoT-enabled inventory management systems may fail to effectively distribute the focal enterprise’s products, leading to supply–demand mismatches [55]. Additionally, digitally advanced focal enterprises can leverage real-time data analytics to identify market opportunities and reduce reliance on existing customers [56]. This may involve withholding supply–demand information or directly encroaching on customer markets, distorting supply–demand perceptions and exacerbating imbalances.
Otherwise, when the focal enterprise’s digital transformation falls behind that of its customers, inefficiencies in cost management and the breakdown of partnerships occur. Focal enterprises with outdated production models may fail to offer cost advantages or added value to digitally advanced customers [57]. This inefficiency may prompt customers to seek alternative suppliers, disrupting existing supply–demand relationships. Furthermore, if the focal enterprise’s digital capabilities fall short of customer requirements, customers may develop new supply channels with more technologically aligned partners [58]. This reconfiguration weakens the focal enterprise’s position in the supply chain, leading to significant supply–demand disruptions.
Based on this analysis, the following hypothesis is proposed.
Hypothesis 2. 
The corporate digital divide between the focal enterprise and its customers, resulting from disparities in their digital transformation levels, exacerbates the supply–demand imbalance in the downstream supply chain.
The research model is presented in Figure 1.

4. Materials, Methods, and Research Design

4.1. Data Sources and Sample Selection

This study takes Chinese A-share listed companies from the Shanghai and Shenzhen stock exchanges as the research subjects. These enterprises are required to meet stringent listing criteria, such as a minimum registered capital of 50 million Chinese Yuan (CNY) and sustained profitability over the past three years, ensuring that the sampled firms possess a stable financial foundation [59]. Additionally, A-share listed companies are typically large in scale, with extensive business operations, transparent data disclosure, and strict regulatory oversight. These characteristics enhance the authenticity and accessibility of the data used in this study, thereby ensuring the reliability and generalizability of the research findings. Furthermore, as key participants in China’s rapidly evolving digital economy [60], these enterprises play a critical role in supply chains, offering a representative perspective on the impact of the digital divide on supply–demand coordination. This contributes to a deeper understanding of the issue and provides a scientific basis for relevant policy formulation.
Considering the significant changes in accounting standards for listed companies in China in 2007 [61], the availability of relevant research data, and the fact that large-scale digital transformation in Chinese enterprises mostly occurred in the last decade—a period during which the digital divide has often emerged—this study defined the time window as 2007–2021.
The sample was subsequently paired with the disclosed suppliers and customers, creating a dataset composed of corresponding “focal enterprise–supplier enterprise” and “focal enterprise–customer enterprise” pairs, resulting in a total of 5392 initial samples. The data processing steps were as follows: (1) 499 samples without disclosed suppliers or customers were removed, as incomplete supply chain relationship data would hinder accurate measurement of digital divide effects and supply–demand imbalance; (2) 852 samples were excluded by removing companies with special statuses, such as special treatment (ST) and special treatment with delisting risk warning (*ST), to ensure data reliability, since companies in financial distress or facing delisting may exhibit abnormal business operations, introducing bias into the analysis; (3) 709 samples with missing data were eliminated to maintain data completeness, as incomplete financial or operational information could distort empirical results and affect the robustness of statistical inferences; (4) to mitigate the influence of outliers on regression results, continuous variables were winsorized at the 1% and 99% levels, reducing extreme value bias, ensuring that excessively high or low values do not disproportionately affect estimation results and improving the robustness of the analysis (The basic principle of winsorization is to replace extreme values in the dataset with specified percentile values. In this research, values below the 1st percentile are replaced with the 1st percentile value, and values above the 99th percentile are replaced with the 99th percentile value. This approach helps to reduce the impact of extreme values on statistical analysis results). The final dataset comprised 1264 “focal enterprise–supplier” observations and 2281 “focal enterprise–customer” observations. Data were sourced from the CSMAR database (CSMAR database website: https://data.csmar.com/ [accessed on 1 January 2025]), processed using Excel 2010, and analyzed with Stata 17.0.

4.2. Model Specification

To evaluate the hypotheses presented earlier, this study developed the following research models:
Bullwhip i , s , t   = β 0 + β 1 Divide i , s , t + Σ Controls i , t + Ind + Year + ε i , t
Bullwhip i , c , t   = β 0 + β 1 Divide i , c , t + Σ Controls i , t + Ind + Year + ε i , t
In Model (1), Bullwhipi,s,t denotes the supply–demand imbalance between the focal enterprise (i) and its upstream supplier enterprise (s) in year (t), and Dividei,s,t represents the digital divide between the focal enterprise (i) and its upstream supplier enterprise (s) in year (t). In Model (2), Bullwhipi,c,t symbolizes the supply–demand imbalance between the focal enterprise (i) and its downstream customer enterprise (c) in year (t), and Dividei,c,t indicates the digital divide between the focal enterprise (i) and its downstream customer enterprise (c) in year (t). In both models, Controlsi,t illustrates a set of control variables, while Ind and Year refer to the industry and year fixed effects, respectively. The term εi,t shows the random disturbance.
This research constructs the research model in this way because existing studies on digitalization and the bullwhip effect mainly explore the impact of a firm’s own digitalization level on the bullwhip effect [62]. However, the bullwhip effect arises from the distortion and amplification of supply–demand information as it propagates upstream rather than being solely influenced by a single upstream or downstream enterprise. Therefore, considering only the impact of an individual firm’s digital transformation on the bullwhip effect, without accounting for the differences in digitalization levels among upstream, midstream, and downstream firms from a supply chain perspective, cannot fully explain the effects of digitalization on the bullwhip effect. Based on this, we incorporate digitalization disparities among upstream, midstream, and downstream enterprises in our model construction and discuss the effects separately for the upstream and downstream of the supply chain (The models involved in the mechanism test section (Models (9)–(16)) and the models in the heterogeneity analysis section (Models (17)–(24)) are also studied separately for the upstream and downstream of the supply chain).

4.3. Variable Measurement

4.3.1. Supply–Demand Imbalance

This study assessed the supply–demand imbalance in the supply chain by examining fluctuations in the supply and demand patterns within a corporation itself. The research adopts the method of Shan et al. (2014) [63] to construct models (3) and (4) to calculate the supply–demand fluctuation (AR) of individual enterprises. In model (3), Production represents the enterprise’s quarterly production volume, Demand represents the enterprise’s quarterly sales revenue, and Var indicates the volatility. Specifically, Var (Production) measures the quarterly volatility of production, while Var (Demand) captures the quarterly volatility of demand. Model (4) provides the calculation for Production, where Cogsi,t denotes the cost of goods sold for enterprise (i) in quarter (t), and Invi, and Invi,t−1 represent the net inventory levels for enterprise (i) at the end of quarter (t) and quarter (t − 1), respectively.
AR = Var ( Production ) Var ( Demand )
Production i , t   = Cogs i , t + Inv i , t Inv i , t 1
Based on the calculated supply–demand volatility (AR), the supply–demand imbalance (Bullwhip) within the supply chain was further computed. This study constructed Models (5) and (6). In Model (5), Bullwhipi,s,t represents the upstream supply–demand imbalance occurring between the focal enterprise (i) and its supplier enterprise (s) in year (t). In Model (6), Bullwhipi,c,t captures the downstream supply–demand imbalance occurring between the focal enterprise (i) and its customer enterprise (c) in year (t).
Bullwhip i , s , t   =   AR s , t AR i , t = VAR ( Production s , t ) / VAR ( Demand s , t ) VAR ( Production i , t ) / VAR ( Demand i , t )
Bullwhip i , c , t   =   AR i , t AR c , t = VAR ( Production i , t ) / VAR ( Demand i , t ) VAR ( Production c , t ) / VAR ( Demand c , t )

4.3.2. Corporate Digital Divide

Regarding the measurement of the corporate digital divide in the supply chain, this study took the focal enterprise as the reference point and constructed Models (7) and (8) to measure the gap in the digitalization level between the focal enterprise and its upstream and downstream partners, respectively. Here, Digitali,t represents the digitalization level of focal enterprise i in year t, Digitals,t represents the digitalization level of upstream enterprise s in year t, and Digitalc,t represents the digitalization level of downstream enterprise c in year t. Model (7) was used to measure the digitalization level gap between focal enterprise i and supplier enterprise s, i.e., the digital divide in the upstream supply chain, denoted as Dividei,s,t. Model (8) was used to measure the gap in the digitalization level between focal enterprise i and customer enterprise c, i.e., the digital divide in the downstream supply chain, denoted as Dividei,c,t.
It is particularly noteworthy that in this study, the variables Dividei,s,t and Dividei,c,t have a directional nature. Specifically, when the values of these variables are positive, it indicates that the digitalization level of the focal enterprise i is higher than that of the upstream enterprise s or downstream enterprise c. Conversely, when the value is negative, it implies that the focal enterprise i has a lower digitalization level than the upstream enterprise s or downstream enterprise c. To preserve this characteristic of the corporate digital divide variables and ensure consistency with the logical framework of our hypotheses, we retained the directionality of these variables and did not take the absolute values of Dividei,s,t and Dividei,c,t, as doing so would obscure the directional information embedded in the variables.
Divide i , s , t   = Digital i , t Digital s , t
Divide i , c , t   = Digital i , t Digital c , t
After clarifying the calculation method for the digital divide, the measurement of digital transformation was the next issue to address. The existing research primarily employs the following measurement approaches for digital transformation: (1) conducting text analysis on phrases related to digitalization in corporate annual reports [64]; (2) calculating the proportion of intangible assets related to digital development in the company’s total intangible assets [56]; (3) using the Digital Maturity Index [65]; (4) using firm-level technology adoption [66]. Among these methods, approach (1), which uses text analysis to count the frequency of digital-related terms, is relatively subjective. It is more suitable for showing a company’s willingness or inclination toward digital development rather than describing the specific status of the digital transformation already undertaken by the company. Approach (2), which calculates the proportion of digital intangible assets, is more objective because the digital development level reflected by clear financial data is less prone to distortion. Additionally, eliminating dimensionality makes the digital development levels of different companies comparable. Although the index construction processes of approaches (3) and (4) are more comprehensive, they are still difficult to fully promote and apply to Chinese listed companies.
Overall, to more effectively assess the corporate digital divide in the supply chain, this study adopted the second approach to measure the digital transformation level of individual enterprises. Specifically, the financial statement notes in the annual reports of publicly listed companies, sourced from the CSMAR database, disclose information on intangible assets. This study measured the digital transformation level by calculating the ratio of intangible assets related to digital technologies to total intangible assets based on the year-end intangible asset details [56]. As described in the section on robustness tests, this study validated the empirical results by using the text analysis method as an alternative measure of corporate digital transformation [64].

4.3.3. Control Variables

The changes in supply and demand relationships caused by the corporate digital divide in the supply chain may be influenced by the characteristics and governance factors of the focal enterprise. To ensure the quality of the empirical analysis, this study also includes the control variables shown in Table 1.

5. Empirical Analysis

5.1. Descriptive Statistics

Table 2 provides the descriptive statistics for the key variables, highlighting the fundamental characteristics of the data. The mean value of Bullwhipi,s,t is 1.445, with a maximum of 11.802 and a minimum of 0.028, while the mean value of Bullwhipi,c,t is 1.213, with a maximum of 15.768 and a minimum of 0.028. This indicates that the issue of supply–demand imbalance in the supply chain is prevalent among Chinese listed companies in the sample. The mean value of Dividei,s,t is −0.029, with a maximum of 0.571 and a minimum of −1.000, while the mean value of Dividei,c,t is −0.028, with a maximum of 1.000 and a minimum of −1.000. This suggests that companies exhibit varying levels of digitalization, with some having a high level of digital transformation while others have not engaged in digital development. Therefore, studying the impact of the digital divide on the bullwhip effect holds significant practical relevance. Notably, the mean value of Sizei,t is 22.032, with a maximum of 24.965 and a minimum of 19.303, indicating that the sample in this study consists of large-sized listed companies with total assets exceeding 1 billion United States Dollars (USD). Other variables show no significant differences compared to the existing literature, suggesting that the selection and calculation of variables are reasonable and accurate, making them suitable for further research.

5.2. Baseline Regression

Table 3 illustrates the effects of the corporate digital divide (Divide) on the supply–demand imbalance (Bullwhip). Columns (1) and (2) show the results for the divide between the focal enterprise and its upstream suppliers (column 1), as well as downstream customers (column 2), without accounting for control variables. In columns (3) and (4), the regression outcomes are presented after incorporating control variables into the models from columns (1) and (2), respectively. A comparison shows that the adjusted R2 (Adj_R2) in column (3) is significantly higher than in column (1), and the adjusted R2 in column (4) is higher than in column (2), suggesting that the model specifications with control variables for various enterprise financial and governance factors are more robust.
In column (3) of Table 3, the coefficient for the upstream digital divide (Dividei,s,t) is 0.399, which is statistically significant at the 5% level. This suggests that a greater digital divide between the focal enterprise and its upstream suppliers contributes to a greater supply–demand imbalance in the upstream chain, thereby confirming Hypothesis 1. From an economic perspective, a one standard deviation increase in the upstream digital divide leads to a 5.854% rise in the supply–demand imbalance between the focal enterprise and its suppliers (calculated as 0.399 × 0.212/1.445 × 100%).
In column (4) of Table 3, the coefficient for the downstream digital divide (Dividei,c,t) is 0.222, which is statistically significant at the 5% level. This indicates that a growing digital divide between the focal enterprise and its downstream customers significantly worsens the supply–demand imbalance in the downstream supply chain, thereby supporting Hypothesis 2. From an economic perspective, an increase of one standard deviation in the downstream digital divide leads to a 4.319% increase in the supply–demand imbalance between the focal enterprise and its customers (calculated as 0.222 × 0.236/1.213 × 100%).
In conclusion, although digital transformation plays a crucial role in improving the supply chain efficiency within the context of Industry 4.0, the digital divide among corporations exacerbates supply–demand imbalances both upstream and downstream, posing a significant challenge to supply chain collaboration. This digital divide not only disrupts immediate supply–demand alignment but also threatens the long-term resilience of the supply chain. As the Industry 4.0 era progresses, companies are increasingly leveraging real-time data, AI, and big data analytics to enhance their decision-making processes. However, the significant divide in digital capabilities hinders collaboration, especially in responding to market demand fluctuations, production scheduling, and risk management. The supply–demand imbalance amplified by the corporate digital divide further weakens overall supply chain collaboration. Therefore, this study continued to explore ways to alleviate the threats posed by the corporate digital divide to supply chain collaboration.

5.3. Robustness Tests

5.3.1. Lagged Explanatory Variable Treatment

To mitigate the endogeneity problem arising from potential bidirectional causality, we employed a lagged explanatory variable approach. Specifically, the study lagged the corporate digital divide variables by one year before performing the regression with the dependent variable. As presented in columns (1) and (2) of Table 4, the coefficients for the lagged corporate digital divide variables, Dividei,s,t−1 and Dividei,c,t−1, are 0.824 and 0.404, respectively, both of which are statistically significant at the 1% level. These results indicate that a greater digital divide between the focal enterprise and its suppliers or customers in the prior year contributes to a more pronounced supply–demand imbalance in the current year, both upstream and downstream in the supply chain. This finding supports the validity of the hypothesis in this study, even after accounting for mutual causality.

5.3.2. Instrumental Variable Approach

The level of digitalization within enterprises is influenced by the development of digital technologies, which, in turn, depends on the widespread availability and use of the internet. On the one hand, internet usage is closely linked to the availability of dial-up access technologies. Historically, regions with higher fixed-line telephone penetration have been more likely to experience broader adoption of digital technologies by enterprises [57]. On the other hand, the internet serves as a crucial platform for economic agents to acquire information. For instance, microblogs such as Weibo—a key product of internet technology—offer insights into the activities of local enterprises. The extent of enterprise engagement on platforms such as Weibo can serve as a strong indicator of how regional development correlates with the growth of the internet [58].
Therefore, referring to the aforementioned existing studies, this research employs instrumental variables to address potential endogeneity concerns. Specifically, the study utilized the interaction between the number of fixed-line telephones in each prefecture-level city in 1984 and the number of internet ports in each year, along with the average number of enterprise entities in the upstream and downstream sectors within the region that have active Weibo accounts, as instruments.
Columns (1) and (2) of Table 5 display the coefficients for the explanatory variables, Dividei,s,t and Dividei,c,t, which are 2.664 and 6.448, respectively. Both coefficients are statistically significant at the 10% and 5% levels. This finding indicates that, after resolving the endogeneity issue with the instrumental variable method, the digital divide between enterprises in both upstream and downstream segments still significantly worsens the supply–demand imbalance, offering additional empirical evidence supporting the hypotheses put forward in this study.

5.3.3. Heckman Two-Stage Test

Given that the disclosure of upstream and downstream enterprises by listed companies is optional, and many of their suppliers or customers are not publicly listed, the dataset used in this study may be influenced by selection bias. To address the potential endogeneity and its effect on the regression results, we utilized the Heckman two-stage model for estimation.
In the first stage, we employed a dummy variable that indicates whether the focal enterprise discloses its suppliers and customers as the dependent variable and conducted a Probit regression, controlling for enterprise characteristics and governance factors. In the second stage, we included the inverse Mills ratio (IMR) from the first stage and performed a subsequent regression, as shown in columns (1) and (2) of Table 6. The coefficients for the explanatory variables, Dividei,s,t and Dividei,s,t are 0.400 and 0.221, respectively, both statistically significant at the 10% and 5% levels. The IMR coefficients are 0.021 and 0.016, respectively, but are not statistically significant. This indicates that, after addressing the endogeneity issue due to sample selection bias, the empirical support for the hypotheses remains valid.

5.3.4. Alternative Dependent Variable Measurement

To address the supply–demand imbalance in both upstream and downstream supply chain segments, the dependent variable was redefined as a binary variable. Specifically, the variable was assigned a value of 1 when the bullwhip ratio exceeds 1 and 0 when it is less than or equal to 1. After adjusting the measurement approach for the dependent variable, Logit regression was applied for estimation. The corresponding regression results are shown in columns (1) and (2) of Table 7. The coefficients for the variables Dividei,s,t and Dividei,c,t are 0.907 and 0.404, respectively, and they are statistically significant at the 1% and 10% levels. These findings indicate that the empirical evidence supporting the hypotheses remains robust.

6. Mechanism Test

With the advent of Industry 4.0, digital technologies have become essential to supply chain operations. Nonetheless, the digital divide, resulting from differences in digital capabilities among businesses, has severely impacted collaboration within the supply chain. Strengthening supply chain resilience is anticipated to improve collaboration across supply chain entities [67].
Viewed from a socio-ecological standpoint, the supply chain, in a dynamic and interconnected context, is no longer a fixed system entirely managed by decision makers but rather a complex social system with natural adaptive learning capabilities [34]. Supply chain resilience not only restores equilibrium between members after disruptions but also facilitates the system’s adaptation to supply–demand imbalances. As per co-evolution theory, improving resilience at the individual enterprise level lays the groundwork for bolstering the overall resilience of the supply chain [68]. By fostering proactive adaptation and responses to changes in the environment, supply chain resilience ensures the ongoing refinement of the system.
Studies have indicated that the multi-dimensional aspects of supply chain resilience are evident in areas such as resource allocation, process management, system design, and product acceptance [69]. By strengthening resilience in these dimensions, companies can better manage the uncertainties caused by the digital divide and reduce collaboration challenges. Additionally, multi-dimensional resilience serves as a buffer to adapt to disruptions from the digital divide between companies. Even during supply–demand imbalances, resilience ensures the ongoing functionality of the supply chain.
To further explore how supply chain resilience in the era of Industry 4.0 can address the collaboration challenges posed by the digital divide, this study investigated the specific functions of resilience in mitigating the impact of the corporate digital divide on upstream and downstream supply–demand imbalances. The analysis focused on the aspects of resources, processes, systems, and products.

6.1. Resource Resilience

Resource resilience directly impacts the extent of supply chain risk propagation and the level of risk that enterprises can bear [70]. With the progress of digital transformation in Industry 4.0, resource resilience has gained significant importance as businesses navigate the divide between traditional and digital models. Initially, when the focal enterprise experiences a divide between its traditional production model and its digital transformation model, its sufficient resource reserves enable it to manage and develop both models separately. By finding a balance, the focal enterprise can not only use digital transformation to promote the evolution of the traditional model but also ensure the smooth progress of the digital transformation through mature processes and system designs. Even if the digital capabilities of the focal enterprise do not match those of upstream or downstream enterprises, leveraging its resource resilience allows the focal enterprise to effectively overcome its dependence on suppliers or customers, thereby alleviating the supply–demand imbalance caused by the corporate digital divide.
In addition, the enhancement of resource resilience provides the focal enterprise that has already achieved a high level of digital transformation with more room for development. With a rich resource base, the focal enterprise can diversify its range of products and services. This, in turn, compels supplier enterprises to accelerate digital transformation to maintain their market position and meet the focal enterprise’s needs. At the same time, downstream customers, to protect their profit margins and avoid being displaced by the focal enterprise’s digital products, will also accelerate their digital transformation to meet the focal enterprise’s sales demands. Thus, enhancing resource resilience aids in reducing the supply–demand imbalance caused by the digital divide among businesses and promotes improved collaboration between upstream and downstream entities within the supply chain.
In the resource aspect of supply chain resilience, a highly resilient enterprise typically has a diverse resource base, where multiple resources can fulfill similar functions. The availability of redundant resources within the enterprise indicates the strength of its resource reserves. Therefore, this study used the level of redundant resources as a proxy to assess resource resilience. Previous research often measured the long-term potential of redundant resources through the equity–debt ratio and evaluated short-term capacity using the quick ratio [71]. To capture both long-term and short-term aspects of redundant resources, this study combined the equity–debt ratio and the quick ratio to create a measure of resource resilience (Resilience_Resourcei,t). A higher value reflects stronger resource resilience in the enterprise.
This study established Models (9) and (10) to examine the role of resource resilience in alleviating the supply–demand imbalance exacerbated by the digital divide between upstream and downstream enterprises in the supply chain.
Bullwhip i , s , t   = β 0 + β 1 Divide i , s , t + β 2 Resilience_Resource i , t + β 3 Divide i , s , t × Resilience_Resource i , t + Σ Controls i , t + Ind + Year + ε i , t
Bullwhip i , c , t   = β 0 + β 1 Divide i , c , t + β 2 Resilience_Resource i , t + β 3 Divide i , c , t × Resilience_Resource i , t + Σ Controls i , t + Ind + Year + ε i , t
Column (1) of Table 8 presents the coefficient of the interaction term between the upstream supply chain’s digital divide and the focal enterprise’s resource resilience (Dividei,s,t × Resilience_Resourcei,t), which is −0.409 and is significant at the 10% level. This indicates that enhancing the resource resilience of the focal enterprise can reduce the impact of the corporate digital divide on the supply–demand imbalance in the upstream supply chain. On the other hand, as shown in column (2) of Table 8, the coefficient for the interaction term between the downstream supply chain’s digital divide and the enterprise’s resource resilience (Dividei,c,t × Resilience_Resourcei,t) is 0.020, which does not show statistical significance.
It is clear that enhancing resource resilience helps to mitigate the impact of the corporate digital divide on the supply–demand imbalance in the supply chain. However, this effect is only observed upstream. Therefore, when the digital divide is present in the upstream supply chain, the focal enterprise should focus more on strengthening resource resilience by optimizing resource reserves and diversifying supplier risks to minimize the negative impact of the digital divide. On the other hand, the situation in the downstream supply chain demonstrates that resource resilience alone is not enough to fully resolve the issues caused by the digital divide. Along with advancing digital transformation, the focal enterprise must also explore other dimensions of supply chain resilience to facilitate better collaborative growth across the supply chain.

6.2. Process Resilience

Process resilience not only impacts the operational efficiency of individual enterprises within the supply chain but also shapes the overall potential for optimizing the supply chain [72]. Strong process resilience indicates that individual processes within the supply chain are highly efficient, while the collaboration between these processes is highly agile. A supply chain with robust process resilience can better control the costs associated with each stage, from raw material procurement to final product delivery, thereby reducing the impact of external disruptions on supply–demand relationships. For an enterprise with strong process resilience, they can not only gain a clear understanding of the overall operational status of the supply chain but also precisely position their roles and influence within it. When the focal enterprise and its upstream or downstream partners are misaligned in their digital transformation efforts, process resilience becomes crucial. It allows the focal enterprise to adaptively modify process sequences or implement backup strategies to reduce the impact of the corporate digital divide on supply chain collaboration.
In the context of the process dimension of supply chain resilience, previous research frequently assessed process resilience by evaluating the production capacity levels of enterprises [73]. The measurement of an enterprise’s capacity level includes ratio methods, such as total asset turnover, net profit margin, and the proportion of fixed assets, as well as functional methods, such as cost functions and stochastic frontier production functions. Since an enterprise’s capacity level reflects the relationship between actual and potential production capabilities, a single ratio derived from financial indicators cannot comprehensively capture capacity utilization. Compared with the stochastic frontier production function, cost functions require the estimation of numerous input values related to output, which introduces larger error fluctuations. Based on existing research, this study uses the enterprise’s capacity level, measured using the stochastic frontier production function, as a proxy variable for process resilience (Resilience_Processi,t). The stochastic frontier was jointly constructed using total assets, operating income, and the number of employees. The enterprise’s capacity level was represented by the ratio of the actual output to the frontier output. A higher value indicates a higher capacity level, signifying stronger process resilience within the enterprise.
This research utilized Models (11) and (12) to analyze the role of process resilience in reducing the supply–demand imbalance caused by the corporate digital divide in the upstream and downstream segments of the supply chain.
Bullwhip i , s , t   = β 0 + β 1 Divide i , s , t + β 2 Resilience_Process i , t + β 3 Divide i , s , t × Resilience_Process i , t + Σ Controls i , t + Ind + Year + ε i , t
Bullwhip i , c , t   = β 0 + β 1 Divide i , c , t + β 2 Resilience_Process i , t + β 3 Divide i , c , t × Resilience_Process i , t + Σ Controls i , t + Ind + Year + ε i , t
As indicated in column (1) of Table 9, the coefficient of the interaction term between the digital divide in the upstream supply chain and the focal enterprise’s process resilience (Dividei,s,t × Resilience_Processi,t) is −9.655, which is significant at the 1% level. This implies that enhanced process resilience in the focal enterprise reduces the impact of the enterprise digital divide on the supply–demand imbalance in upstream supply chain collaboration. In contrast, as shown in column (2) of Table 9, the coefficient for the interaction term between the digital divide in the downstream supply chain and the focal enterprise’s process resilience (Dividei,c,t × Resilience_Processi,t) is 0.448, which is not statistically significant, suggesting that process resilience does not effectively address the supply–demand imbalance in the downstream supply chain collaboration.
It is obvious that improving process resilience helps mitigate the impact of the corporate digital divide on the supply–demand imbalance in the supply chain. However, this effect is only observed upstream. Therefore, when the digital divide occurs in the upstream supply chain, the focal enterprise should focus on optimizing workflows, introducing flexible process adjustments, and establishing backup strategies to minimize disruptions caused by the divide. In contrast, the performance of the downstream supply chain highlights that process resilience alone cannot fully resolve the challenges brought by the digital divide. In the downstream, supply–demand collaboration is likely to depend more on the digital capabilities and adaptive responses of customer enterprises, which cannot be entirely offset by the focal enterprise’s internal process resilience.

6.3. System Resilience

System resilience is crucial for an enterprise’s capacity to quickly detect supply chain risks and evaluate their potential impacts [69]. In the context of Industry 4.0, where digital transformation is reshaping supply chains, enhanced system resilience helps enterprises better navigate the uncertainties and complexities brought on by digitalization, thereby improving supply chain collaboration and reducing the impact of the digital divide. By reducing the supply chain risks faced by individual enterprises, system resilience alleviates tensions in supply–demand relationships, fostering improved collaboration across the supply chain.
An enterprise with robust system resilience can rapidly identify deficiencies in its production and operational processes. When the focal enterprise is unable to receive adequate digital transformation support from its supply chain partners, system resilience facilitates resource allocation adjustments that help mitigate potential disruptions. This ability helps to avoid major losses caused by challenges associated with digital transformation and minimizes the digital divide’s negative impact on supply–demand collaboration in the supply chain. Additionally, an enterprise with greater system resilience can better manage the direction and pace of its digital transformation, thereby reducing the risk of a major digital divide between upstream and downstream supply chain partners. Such resilience acts as a buffer, alleviating the supply–demand imbalance caused by the corporate digital divide and enhancing overall supply chain stability.
The strength of an enterprise’s system resilience is influenced by its ability to promptly adjust the allocation of critical resources. Building on this, this study constructed a composite indicator to measure the system resilience (Resilience_Systemi,t) by incorporating changes in various critical resources. Based on prior research [74], six dimensions were chosen to represent the changes in the allocation of key resources within enterprises: sales intensity (selling expenses/operating income), management intensity (administrative expenses/operating income), research and development (R&D) intensity (net intangible assets/operating income), capital intensity (fixed assets/number of employees), fixed asset renewal rate (net fixed assets/original fixed assets), and debt intensity (total liabilities/total assets).
The method for calculating the system resilience indicator is outlined as follows: first, the differences between each of the six dimensions and their respective industry averages were calculated. These differences were then standardized, and their absolute values were summed. Finally, the median of this indicator was used as a threshold for grouping. Enterprises with values above the median were assigned a value of 1, indicating proactive resource allocation adjustments and stronger system resilience, while those with values at or below the median were assigned a value of 0, reflecting passive resource allocation and weaker system resilience.
Models (13) and (14) were developed in this study to evaluate the role of system resilience in mitigating the supply–demand imbalance caused by the corporate digital divide between upstream and downstream enterprises in the supply chain.
Bullwhip i , s , t   = β 0 + β 1 Divide i , s , t + β 2 Resilience_System i , t + β 3 Divide i , s , t × Resilience_System i , t + Σ Controls i , t + Ind + Year + ε i , t
Bullwhip i , c , t   = β 0 + β 1 Divide i , c , t + β 2 Resilience_System i , t + β 3 Divide i , c , t × Resilience_System i , t + Σ Controls i , t + Ind + Year + ε i , t
As presented in column (1) of Table 10, the coefficient of the interaction term between the upstream supply chain’s digital divide and the focal enterprise’s system resilience (Dividei,s,t × Resilience_Processi,t) is −0.053, which is not statistically significant, implying that system resilience does not effectively reduce the supply–demand imbalance in the upstream supply chain. However, in column (2) of Table 10, the coefficient for the interaction term between the downstream supply chain’s digital divide and the enterprise’s system resilience (Dividei,c,t × Resilience_Processi,t) is −0.428, which is significant at the 10% level. This indicates that greater system resilience in the focal enterprise helps mitigate the supply–demand imbalance caused by the corporate digital divide in the downstream supply chain.
It is evident that enhancing system resilience helps mitigate the impact of the corporate digital divide on the supply–demand imbalance in the supply chain. However, this alleviating effect is primarily evident in the downstream segment. When the corporate digital divide occurs in the downstream supply chain, the focal enterprise should focus on enhancing its ability to dynamically adjust the allocation of critical resources, optimize system configurations, and improve decision-making efficiency to mitigate disruptions caused by the digital divide. By doing so, the focal enterprise can better align with the digital capabilities of downstream partners and reduce collaboration challenges. However, the performance of the upstream supply chain suggests that system resilience alone is insufficient to fully address the risks posed by the corporate digital divide. In the upstream, supply–demand collaboration heavily depends on the ability of supplier enterprises to integrate and align with the focal enterprise’s digital transformation. This dependency cannot be fully compensated for by the focal enterprise’s internal system resilience.

6.4. Product Resilience

Product resilience indicates how well an enterprise’s products are recognized within the supply chain and their ability to adapt to external demand fluctuations [75]. In Industry 4.0, where sustainable digital transformation reshapes supply chain dynamics, product resilience becomes increasingly important for maintaining effective supply chain collaboration. Strengthening product resilience enhances the enterprise’s error tolerance and its capacity to correct errors. When the products of the focal enterprise fail to meet or align with the digital transformation needs of upstream and downstream supply chain partners, maintaining lower levels of obsolete inventory helps minimize sales pressures and potential losses. This, in turn, reduces the severity of supply–demand conflicts caused by misaligned interests within the supply chain.
Moreover, product resilience is closely linked to an enterprise’s ability to adjust and update its product offerings. Through proactive digital transformation initiatives that facilitate product iteration and upgrades, the focal enterprise can narrow the gap between the actual value of its products and market expectations. This capability not only enhances the competitiveness of the focal enterprise’s products but also helps mitigate the supply–demand imbalance caused by the corporate digital divide within the supply chain.
Based on related studies, the foundation for building product resilience lies in effective long-term inventory management strategies, which reflect a company’s ability to balance supply and demand by minimizing obsolete products and optimizing inventory levels [76]. Therefore, this study adopted inventory levels as a proxy variable to measure product resilience (Resilience_Producti,t). Specifically, the ratio of inventory to operating income was used as the measurement indicator to ensure data comparability. This indicator is a reverse measure, meaning that a higher value indicates weaker product resilience. A lower inventory ratio suggests that the focal enterprise is more adept at managing product obsolescence, aligning its offerings with market demands, and effectively supporting supply chain collaboration.
This study developed Models (15) and (16) to examine how product resilience helps mitigate the supply–demand imbalance resulting from the digital divide between upstream and downstream supply chain partners.
Bullwhip i , s , t   = β 0 + β 1 Divide i , s , t + β 2 Resilience_Product i , t + β 3 Divide i , s , t × Resilience_Product i , t + Σ Controls i , t + Ind + Year + ε i , t
Bullwhip i , c , t   = β 0 + β 1 Divide i , c , t + β 2 Resilience_Product i , t + β 3 Divide i , c , t × Resilience_Product i , t + Σ Controls i , t + Ind + Year + ε i , t
As indicated in column (1) of Table 11, the coefficient for the interaction term between the digital divide in the upstream supply chain and the focal enterprise’s product resilience (Dividei,s,t × Resilience_Producti,t) is −0.142, which is not statistically significant. This suggests that product resilience does not effectively mitigate the supply–demand imbalance in the upstream supply chain. However, column (2) of Table 11 shows that the coefficient for the interaction term between the digital divide in the downstream supply chain and the enterprise’s product resilience (Dividei,c,t × Resilience_Producti,t) is 0.661, which is significant at the 10% level. This implies that lower product resilience in the focal enterprise intensifies the supply–demand imbalance caused by the corporate digital divide in the downstream supply chain.
It is noticeable that strengthening product resilience is an effective approach to alleviating the supply–demand imbalance caused by the digital divide in the supply chain. However, this alleviating effect is primarily observed in the downstream segment. When the digital divide occurs in the downstream supply chain, the focal enterprise should prioritize improving inventory management strategies, actively updating product designs, and aligning product iterations with market demand to alleviate disruptions caused by the digital divide. By doing so, the focal enterprise can better adapt to the evolving digital capabilities of downstream partners, reducing conflicts and enhancing supply–demand collaboration. Nevertheless, the performance of the upstream supply chain indicates that product resilience alone is insufficient to fully address the challenges posed by the digital divide. Upstream, the supply–demand imbalance is more closely tied to the ability of suppliers to align their offerings with the focal enterprise’s product transformation needs. This dependency cannot be entirely offset by the focal enterprise’s internal product resilience.

7. Heterogeneity Analysis

7.1. Structural Characteristics of the Supply Chain

The supply chain network centrality generally refers to the core position or importance of a specific company within the entire supply chain [77]. Key types include degree centrality, closeness centrality, betweenness centrality, and eigenvector centrality. In a supply network, an enterprise’s betweenness centrality reflects its “bridge” function within the supply chain [78]. The higher the betweenness centrality of the focal enterprise, the more the flow of information and resources between upstream and downstream entities depends on it. By undergoing digital transformation, the focal enterprise can improve its capacity to streamline the flow of information and resources, thereby mitigating the supply–demand imbalance resulting from the digital divide between upstream and downstream entities.
According to the study by Shi et al. (2019) [79], although the degree centrality, closeness centrality, and eigenvector centrality can also provide valuable information about network structure and node influence, betweenness centrality is more commonly used to assess the probability that a node lies on the shortest path between any two other nodes in the network. In other words, betweenness centrality better reflects the unique function of the focal enterprise in connecting different entities within the supply chain. Therefore, this study calculated betweenness centrality (Betweeni,t) by following the method suggested by Shi et al. (2019) and developed Models (17) and (18) to explore how the focal enterprise’s betweenness centrality influenced the relationship between the corporate digital divide and the supply–demand imbalance in the supply chain.
Bullwhip i , s , t   = β 0 + β 1 Divide i , s , t + β 2 Between i , t + β 3 Divide i , s , t × Between i , t + Σ Controls i , t + Ind + Year + ε i , t
Bullwhip i , c , t   = β 0 + β 1 Divide i , c , t + β 2 Between i , t + β 3 Divide i , c , t × Between i , t + Σ Controls i , t + Ind + Year + ε i , t
As presented in column (1) of Table 12, the coefficient for the interaction term between the upstream supply chain’s digital divide and the focal enterprise’s betweenness centrality (Dividei,s,t × Betweeni,t) is −0.766, which is significant at the 1% level. This suggests that a higher betweenness centrality of the focal enterprise is associated with a less severe supply–demand imbalance caused by the corporate digital divide in the upstream supply chain. In column (2) of Table 12, the coefficient for the interaction term between the downstream supply chain’s digital divide and the enterprise’s betweenness centrality (Dividei,c,t × Betweeni,t) is 0.035, which is not statistically significant, indicating that an increase in betweenness centrality does not reduce the impact of the corporate digital divide in the downstream supply chain on the supply–demand imbalance. These findings suggest that a high betweenness centrality in the focal enterprise can significantly reduce the effect of the corporate digital divide on supply–demand imbalances in the upstream supply chain.

7.2. Relational Characteristics of the Supply Chain

The closeness of an enterprise’s relationships with other entities in the supply chain plays a crucial role in determining the success of its digital transformation [80]. A close partnership between the focal enterprise and its upstream and downstream partners enables them to receive greater support during the digitalization process, thereby reducing the challenges of digital transformation. Conversely, a distant relationship between the focal enterprise and its upstream and downstream partners hinders digital collaboration, preventing the supply chain from achieving overall transformation and optimization.
Based on existing research [81], this study uses supplier concentration and customer concentration to measure the closeness of the focal enterprise’s relationships with its upstream and downstream partners (HHI_supi,t/HHI_cusi,t). A higher supplier or customer concentration indicates a closer relationship between the focal enterprise and its upstream or downstream supply chain partners. This study develops Models (19) and (20) to explore how the focal enterprise’s supply chain concentration influences the link between the corporate digital divide and supply–demand imbalances within the supply chain.
Bullwhip i , s , t   = β 0 + β 1 Divide i , s , t + β 2 HHI_sup i , t + β 3 Divide i , s , t × HHI_sup i , t + Σ Controls i , t + Ind + Year + ε i , t
Bullwhip i , c , t   = β 0 + β 1 Divide i , s , t + β 2 HHI_cus i , t + β 3 Divide i , c , t × HHI_cus i , t + Σ Controls i , t + Ind + Year + ε i , t
Column (1) of Table 13 shows that the coefficient for the interaction term between the upstream supply chain’s digital divide and supplier concentration (Dividei,s,t × HHI_supi,t) is −0.013, which is not statistically significant. This suggests that an increase in supplier concentration does not effectively alleviate the supply–demand imbalance caused by the digital divide in the upstream supply chain. In comparison, column (2) of Table 13 indicates that the coefficient for the interaction term between the digital divide in the downstream supply chain and customer concentration (Dividei,c,t × HHI_cusi,t) is −0.027, which is significant at the 1% level. This suggests that, as the customer concentration rises, the supply–demand imbalance caused by the digital divide in downstream supply chain entities is notably reduced. These results suggest that the closer the relationship between the focal enterprise and its customer enterprises, the less likely it is that demand information transmitted from customer enterprises to the focal enterprise will be distorted. As a result, the focal enterprise receives more accurate downstream demand information, which helps reduce the severity of the supply–demand imbalance caused by the corporate digital divide in the downstream supply chain.

7.3. Government Digital Focus

The progress of Industry 4.0 is closely related to the level of government attention to digital development. Local governments’ digital focus is reflected not only in policy guidance but also in funding support, talent development, and infrastructure construction, all of which contribute to advancing Industry 4.0 [82]. For example, if the government implements policies such as smart manufacturing and industrial internet in a region and provides corresponding tax incentives or financial subsidies, it could accelerate the adoption of intelligent and automated production methods by enterprises in that area, leading to a worsening of digital issues between enterprises across regions. Therefore, the higher the digital focus of the local government where the core enterprise is located, the greater the impact of the digital divide between supply chain enterprises on the supply–demand imbalance.
This study used text analysis to calculate the word frequency of terms related to the digital economy in the government work reports of the municipal governments where the enterprises were located. First, a keyword dictionary was constructed with reference to the study by Tao and Ding (2022) [83] (The keyword dictionary includes terms covering various aspects of intelligence, such as smart manufacturing and intelligent systems, as well as the concept of smart technologies, including smart cities and smartification. Other relevant terms include cloud computing, cloud adoption, cloud platforms, and cloud services, along with big data, data security, data services, data governance, and data sharing. Additionally, terms related to industrial internet, internet of things, blockchain, robotics, 5G, digital technologies, digitalization, and the digital economy are also included.). Second, the government digital focus (Digipolicyi,t) in the city where the focal enterprise was located was measured by the proportion of keywords related to the digital economy in the government work report to the total word count. A higher value of this indicator indicates a greater focus of the government on digital economy policies. This study used Models (21) and (22) to explore how the digital focus of the local government influences the relationship between the digital divide of enterprises and supply–demand imbalance.
Bullwhip i , s , t   = β 0 + β 1 Divide i , s , t + β 2 Digipolicy i , t + β 3 Divide i , s , t × Digipolicy i , t + Σ Controls i , t + Ind + Year + ε i , t
Bullwhip i , c , t   = β 0 + β 1 Divide i , c , t + β 2 Digipolicy i , t + β 3 Divide i , c , t × Digipolicy i , t + Σ Controls i , t + Ind + Year + ε i , t
As shown in column (1) of Table 14, the coefficient for the interaction term between the upstream supply chain’s digital divide and the government digital focus in the location of the focal enterprise (Dividei,s,t × Digipolicyi,t) is 0.299, which is statistically significant at the 5% level. This suggests that the greater the government’s digital attention in the location of the focal enterprise, the more severe the supply–demand imbalance caused by the corporate digital divide in the upstream supply chain. In column (2) of Table 14, the coefficient for the interaction term between the downstream supply chain’s digital divide and the government’s digital attention in the location of the focal enterprise (Dividei,c,t × Digipolicyi,t) is 0.069, which is not statistically significant, indicating that government’s digital focus does not influence the relationship between the corporate digital divide and supply–demand imbalance in the downstream supply chain. These findings suggest that a higher level of the government’s digital focus in the location of the focal enterprise amplifies the effect of the corporate digital divide on the supply–demand imbalance in the upstream supply chain.

7.4. Nature of the Enterprise

The nature of an enterprise influences its digital transformation process. From the perspective of corporate culture, state-owned enterprises (SOEs) usually bear more social responsibilities rather than being purely market-oriented [54]. This cultural background may allow SOEs to adopt a more stable approach in their digital transformation, resulting in fewer instances of digital divide issues. In contrast, non-state-owned enterprises (NSOEs) focus more on market efficiency and innovation. However, their digital transformation may face more challenges and resource constraints, which could lead to more pronounced digital divide issues. As a result, when the core enterprise is a state-owned enterprise, the impact of the digital divide on supply–demand imbalance may be smaller.
This study set the nature of the enterprise (SOEi,t) as a dummy variable, with state-owned enterprises as 1 and non-state-owned enterprises as 0. This study used Models (23) and (24) to explore how the nature of an enterprise influenced the relationship between the digital divide of enterprises and supply–demand imbalance.
Bullwhip i , s , t   = β 0 + β 1 Divide i , s , t + β 2 SOE i , t + β 3 Divide i , s , t × SOE i , t + Σ Controls i , t + Ind + Year + ε i , t
Bullwhip i , c , t   = β 0 + β 1 Divide i , c , t + β 2 SOE i , t + β 3 Divide i , c , t × SOE i , t + Σ Controls i , t + Ind + Year + ε i , t
As presented in column (1) of Table 15, the coefficient for the interaction term between the upstream supply chain’s digital divide and the nature of the focal enterprise (Dividei,s,t × SOEi,t) is −0.663, which is significant at the 5% level. This suggests that when the focal enterprise is state-owned, the supply–demand imbalance caused by the digital divide in the upstream supply chain is less severe. In column (2) of Table 15, the coefficient for the interaction term between the downstream supply chain’s digital divide and the nature of the focal enterprise (Dividei,c,t × SOEi,t) is 0.227, which is not statistically significant, indicating that the nature does not affect the impact of the digital divide in the downstream supply chain on the supply–demand imbalance. These findings suggest that when the focal enterprise is state-owned, the impact of the digital divide in the upstream supply chain on the supply–demand imbalance is significantly alleviated.

8. Discussion

8.1. Research Findings

In the context of Industry 4.0, digital transformation has become essential for all businesses. However, differences in digital adoption across companies have created a digital divide within the supply chain, presenting considerable challenges for collaboration. This study explored the effects of the corporate digital divide on the supply–demand imbalance within the supply chain and presents the following key findings:
First, the corporate digital divide intensifies the supply–demand imbalance in the supply chain. Regardless of whether the digital divide exists between the focal enterprise and its upstream suppliers or downstream customers, a greater divide aggravates the imbalance. This, in turn, makes supply chain collaboration more difficult.
Second, improving supply chain resilience is essential for mitigating the impact of the corporate digital divide on supply–demand imbalances. Resource and process resilience is particularly effective in addressing imbalances in the upstream supply chain. By optimizing resource allocation, improving inventory management, and implementing flexible workflows, these resilience aspects enable the focal enterprise to bridge gaps with suppliers and maintain stability. On the other hand, system and product resilience has a stronger influence on reducing imbalances in the downstream supply chain. These dimensions help the focal enterprise adapt to market changes, refresh product offerings, and better meet customer demands, thus lessening the adverse effects of the corporate digital divide.
Third, the impact of the corporate digital divide on the supply–demand imbalance exhibits heterogeneity influenced by environmental factors. Due to the supply chain structure, a higher betweenness centrality of the focal enterprise within the network allows it to better control the flow of information and resources, thereby reducing the impact of the digital divide on upstream supply–demand imbalances and effectively mitigating disruptions. Due to supply chain relationships, greater supply chain concentration around the focal enterprise reduces the impact of the digital divide on downstream supply–demand imbalances, as stronger relational ties foster trust and collaboration, making it easier to adapt to digital capability gaps and improving overall supply chain cooperation. Due to the high level of digital focus of the local government where the core enterprise is located, the greater the government’s attention to digital development, the more severe the digital divide issue becomes, leading to a more intense supply–demand imbalance in the upstream supply chain. Due to the nature of the enterprise, when the core enterprise is a state-owned enterprise, the impact of the digital divide on upstream supply–demand imbalance is significantly alleviated, and it is important to consider the cultural differences between enterprises with different ownership structures when exploring the relationship between the digital divide and supply–demand imbalance in the context of Industry 4.0.

8.2. Theoretical Contributions

Firstly, this study expanded the research on the corporate digital divide by shifting the focus from individual corporations to the supply chain level. It provided a fresh perspective for examining how digital transformation influences overall supply chain collaboration. In the context of Industry 4.0, the widespread use of digital technologies increases the need for effective supply chain collaboration [1]. However, most existing research has focused on the digital transformation of individual companies or organizations, neglecting the disparities in digitalization across different supply chain nodes and their consequences [3,5,6,8,9,10,11]. By emphasizing vertical interactions within the supply chain, this study shifted the focus of the digital divide from horizontal relationships to upstream and downstream collaboration. It systematically analyzed how the corporate digital divide disrupts supply chain coordination and exacerbates the supply–demand imbalance, thereby addressing a key research gap.
Secondly, this study developed a comprehensive research model to examine how the corporate digital divide disrupts supply chain collaboration through supply–demand relationships. As we transition into Industry 4.0, supply chains are evolving toward greater digitalization, intelligence, and integration [7,27,28,29]. However, this shift has highlighted significant divides in digital capabilities across different supply chain nodes, especially between the focal enterprise and its upstream and downstream partners in terms of digital transformation progress [30,84]. While much of the existing research has concentrated on how digital transformation impacts individual corporate performance [31,32,33], it often overlooks the effects of the digital divide within the supply chain on supply–demand fluctuations and collaboration effectiveness. This study investigated the various ways in which an enterprise’s digital divide influences supply–demand collaboration across both upstream and downstream segments of the supply chain, and it presented a theoretical model to clarify the mechanisms by which this divide impacts overall supply chain efficiency.
Finally, this study explored how supply chain resilience mitigates the negative impact of the corporate digital divide on supply–demand imbalances. In the era of Industry 4.0, supply chain resilience has become essential for enterprises to adapt to complex environmental changes and improve collaboration efficiency [14,35]. However, existing research often treats the supply chain as a unified entity [43], neglecting the differences between upstream and downstream enterprises in terms of resources, processes, and system capabilities. This study identified four critical dimensions of supply chain resilience—resource, process, system, and product resilience [13,36,37,38,39,40]—and examined their distinct roles in reducing the effects of the corporate digital divide on both upstream and downstream enterprises. These insights offer theoretical and practical guidance for addressing digital divide challenges and strengthening the sustainable collaboration capacity within the supply chain.

8.3. Practical Implications

This study highlighted the significant challenges posed by the corporate digital divide to supply chain collaboration and its subsequent impact on supply–demand imbalances. Based on the findings, several managerial and policy implications can be derived to assist firms in navigating the digital transformation process and mitigating the negative effects of the digital divide.

8.3.1. Managerial Implications

The first implication concerns fostering the improvement of digitalization across the entire supply chain. Enterprises with a high level of digitalization, regardless of their position in the supply chain (upstream, midstream, or downstream), should actively engage with their suppliers and customers in discussions about digital development to enhance the overall digitalization of the supply chain. Specifically, high-digitalization enterprises can tailor training programs for their supply chain partners, provide digital tools, and promote the standardization of digital technologies to ensure that all parties in the supply chain are equipped with the necessary skills and infrastructure. This would help reduce the digital divide and facilitate smoother collaboration.
The second implication concerns strengthening the resilience of the supply chain. To mitigate the impact of the digital divide on the upstream supply–demand imbalance, firms should prioritize building resilience at the resource and process levels. By improving resource allocation efficiency and implementing flexible workflows, firms can quickly adapt to disruptions in the upstream supply chain. Additionally, businesses should strengthen system and product resilience, particularly in downstream segments, by focusing on optimizing inventory management and reinforcing strategic transformations to ensure agility in responding to market demand fluctuations.
The third implication concerns improving the operating environment of the supply chain. Given that enterprises with higher network centrality are better positioned to control the flow of information and resources within the supply chain, such firms should actively leverage their leadership role in the supply chain. For example, network-central enterprises can promote the construction of digital platforms within the supply chain to facilitate real-time communication and data sharing, which helps mitigate the impact of the digital divide on supply–demand imbalances. Additionally, these enterprises can strengthen supply chain coordination by regularly leading meetings focused on supply chain coordination, further consolidating their relationships with suppliers and customers to enhance overall trust within the supply chain, thus improving supply chain coordination.
The last implication involves companies customizing their digital transformation strategies based on the level of support for digital development provided by local governments and their ownership structure. Specifically, the greater the disparity in local governments’ digital focus, the more likely it is for companies to fall behind in the transformation process. Therefore, companies with lower digital capabilities should strengthen communication and cooperation with local governments, actively seek policy support and resource subsidies, and utilize government-provided digital infrastructure and financial resources to address gaps in their digital transformation efforts. Moreover, state-owned enterprises are more likely to receive government support and resources during digital transformation, so these companies should focus on improving supply chain coordination by concentrating resources, enhancing technological platforms, and promoting information sharing. In contrast, private enterprises need to focus more on independent innovation and the application of digital technologies. Especially when resources are limited, these companies should be more flexible in responding to the impact of the digital divide in the supply chain on the supply–demand imbalance.

8.3.2. Policy Implications

The first policy recommendation is that local governments should continue to strengthen the development of digital infrastructure. Particularly in regions with significant economic disparities, governments in underdeveloped areas should proactively raise awareness of the need to bridge the digital divide and make tangible efforts toward it. Public policies should then encourage enterprises to adopt digital technologies and provide financial support for digital transformation through subsidies, tax incentives, and other means. This could significantly improve the digital capability gap between enterprises and those in regions with higher levels of digitalization.
The second policy implication concerns encouraging collaboration across different sectors. Policymakers should foster collaboration between the public and private sectors to create an ecosystem that supports digital transformation across industries. This can include creating forums for knowledge exchange, providing joint research initiatives, and supporting the development of open-source technologies. Cross-sector partnerships will help reduce the digital divide and enhance the overall efficiency and resilience of supply chains.
The final implication concerns addressing regional disparities in digital development. Policymakers must recognize that the digital divide is not uniform across regions, and regional disparities should be addressed through targeted interventions. Governments should prioritize regions that are behind in digital development by offering targeted incentives for investments in digital infrastructure and ensuring fair access to digital technologies. This approach will help reduce the negative impact of the digital divide on supply–demand imbalances in remote or underdeveloped areas.

8.4. Limitations and Future Outlook

Firstly, this study focuses solely on listed companies, which may lead to issues with sample representativeness. Future research should consider expanding the sample to include non-listed companies in order to gain a more comprehensive understanding of how the digital divide affects supply–demand imbalances.
Secondly, although this study is centered on China, future research could compare the impact of the digital divide on the supply–demand imbalance in supply chain companies across different regions or countries. This would provide a broader perspective on the global supply chain landscape.
Thirdly, this study primarily relies on quantitative analysis and lacks qualitative validation through case studies or expert interviews. Future research could combine these methods to explore in-depth the challenges and strategies companies face during their digital transformation processes, offering more practical guidance.
Additionally, this study does not fully explore the specific digital limitations faced by upstream, focal, or downstream enterprises. Future research could focus on identifying which parts of the supply chain are most affected by the digital divide, providing more targeted recommendations.

9. Conclusions

Focusing on Industry 4.0, this study explored how the corporate digital divide affects supply chain collaboration. It specifically examined how the digital divide influences the supply–demand imbalance in both upstream and downstream supply chain segments while also considering potential solutions through the concept of supply chain resilience.
The findings revealed that the corporate digital divide significantly exacerbates the supply–demand imbalance in both the upstream and downstream supply chains, disrupting overall supply chain collaboration. As the digital divide between supply chain partners widens, the severity of the supply–demand imbalance intensifies. This underscores the necessity of addressing the digital divide as a key barrier to the long-term development of supply chains in Industry 4.0.
Additionally, the study emphasized the crucial role of supply chain resilience in mitigating the adverse effects of the corporate digital divide. Specifically, enhancing resource and process resilience proves particularly effective in alleviating the supply–demand imbalance in the upstream supply chain, where collaboration heavily depends on supplier adaptability and resource optimization. In contrast, system and product resilience are more effective in addressing the downstream imbalance, where fluctuations in demand and customer expectations require agile responses and tailored product solutions. These findings emphasize the importance of developing differentiated resilience strategies tailored to the unique dynamics of upstream and downstream supply chains.
This study makes significant contributions to the theoretical framework of corporate digital divide research by shifting the focus from horizontal dynamics to vertical relationships within the supply chain. By deepening the understanding of how disparities in the progress of digital transformation affect supply chain collaboration, this study enriches the existing literature. Additionally, it provides practical insights for policymakers and corporate practitioners in advocating for collaborative digital transformation initiatives, robust digital governance frameworks, and targeted resilience-building strategies to bridge the corporate digital divide and foster harmonious, efficient supply chain ecosystems.
Future research could examine the evolving relationship between supply chain innovation and strategies for addressing the corporate digital divide. Exploring the potential of emerging technologies such as blockchain, AI, and the IoT to improve supply chain inclusivity could provide valuable insights into the field of supply chain sustainability. Understanding how these technologies can bridge the corporate digital divide and promote supply chain collaboration is crucial for addressing the challenges posed by Industry 4.0.

Author Contributions

Conceptualization, Q.L.; methodology, Q.L. and W.T.; software, Q.L., W.T. and H.Z.; validation, Q.L., W.T. and H.Z.; writing—original draft, Q.L.; writing—review and editing, Q.L., W.T. and H.Z.; supervision, H.Z. All authors have read and agreed to the published version of the manuscript.

Funding

This research was funded by the Social Science Foundation Project of Fujian Province (grant number: FJ2024C081), the High-Level Talent Research Startup Fund Project of Huaqiao University (grant number: 23SKBS028), the Shenyang Social Science Federation (grant number: SYSK2023-01-182) and Liaoning University (grant number: 2025lslybkt-079).

Data Availability Statement

The data supporting this study’s findings are available from the corresponding author upon request.

Conflicts of Interest

The authors declare no conflicts of interest.

References

  1. Dolgui, A.; Ivanov, D. 5G in Digital Supply Chain and Operations Management: Fostering Flexibility, End-to-end Connectivity and Real-time Visibility through Internet-of-everything. Int. J. Prod. Res. 2022, 60, 442–451. [Google Scholar] [CrossRef]
  2. Dixit, C.; Haleem, A.; Javaid, M. Role of Digital Supply Chain in Industry 4.0: A Bibliometric Analysis. J. Ind. Integr. Manag. Innov. Entrep. 2024, 9, 495–518. [Google Scholar] [CrossRef]
  3. Shakina, E.; Parshakov, P.; Alsufiev, A. Rethinking the Corporate Digital Divide: The Complementarity of Technologies and the Demand for Digital Skills. Technol. Forecast. Soc. Chang. 2021, 162, 120405. [Google Scholar] [CrossRef]
  4. Aniceski, T.A.; Miranda, L.T.P.; Canciglieri, O., Jr.; Benitez, G.B. The Four Smarts of Industry 4.0 and barriers for technology deployment: A TOE perspective. Comput. Ind. Eng. 2024, 193, 110345. [Google Scholar] [CrossRef]
  5. Moraes, K.K.; Ganga, G.M.D.; Godinho, M.; Santa-Eulalia, L.A.; Tortorella, G.L. Overcoming Technological Barriers for Blockchain Adoption in Supply Chains: A Diffusion of Innovation (DOI)-Informed Framework Proposal. Supply Chain Manag. Int. J. 2025, 30, 19–49. [Google Scholar] [CrossRef]
  6. Verma, N.K.; Chatterjee, A.K. Process Flexibility in the Presence of Product Modularity: Does Modularity Help? Int. J. Prod. Res. 2023, 256, 108723. [Google Scholar] [CrossRef]
  7. Zrelli, I.; Rejeb, A. A Bibliometric Analysis of IoT Applications in Logistics and Supply Chain Management. Helion 2024, 10, 36578. [Google Scholar] [CrossRef] [PubMed]
  8. Weisz, E.; Herold, D.M.; Kummer, S. Revisiting the Bullwhip Effect: How can AI Smoothen the Bullwhip Phenomenon? Int. J. Logist. Manag. 2023, 34, 98–120. [Google Scholar] [CrossRef]
  9. Sharma, S.K.; Sharma, R.; Jindal, A. An Integrated Structural Model for Supply Chain Vulnerability Influencing Factors in Manufacturing Enterprises. J. Model. Manag. 2024, 19, 1510–1534. [Google Scholar] [CrossRef]
  10. Lotfi, A.; Samouei, P. Revenue Sharing Contract in Competitive Supply Chain Network Coordination: Location based on VMI Policy and Bullwhip Effect. Int. J. Syst. Sci. Oper. Logist. 2024, 11, 2357076. [Google Scholar] [CrossRef]
  11. Bratucu, G.; Ciobanu, E.; Chitu, I.B.; Litra, A.V.; Zamfirache, A.; Balasescu, M. The Use of Technology Assisted by Artificial Intelligence Depending on the Companies’ Digital Maturity Level. Electronics 2024, 13, 1687. [Google Scholar] [CrossRef]
  12. Huang, K.; Wang, K.D.; Lee, P.K.C.; Yeung, A.C.L. The Impact of Industry 4.0 on Supply Chain Capability and Supply Chain Resilience: A Dynamic Resource-based View. Int. J. Prod. Econ. 2023, 269, 108913. [Google Scholar] [CrossRef]
  13. Bhuiyan, J.; Mazumder, R.; Afrose, S.; Hasan, M. Industry-4, Big Data, and Blockchain Research Prospects in Supply Chain Domain: A Bibliometric Review. Bus. Perspect. Rev. 2024, 6, 1–17. [Google Scholar] [CrossRef]
  14. Din, F.U.; Henskens, F.; Paul, D.; Wallis, M. Revitalising and Validating the Novel Approach of xAOSF Framework under Industry 4.0 in Comparison with linear SC. In Proceedings of the 2018 IEEE Region Ten Symposium (TENSYMP), Sydney, Australia, 4–6 July 2018; pp. 265–270. [Google Scholar]
  15. Kakhki, M.D.; Sajadi, S.M. Business Analytics Affordances for Supply Chain Value Creation: A Technology-Organization-Environment Perspective. Int. J. Prod. Econ. 2024, 276, 109367. [Google Scholar] [CrossRef]
  16. Patnaik, P.; Bakkar, M. Exploring Determinants Influencing Artificial Intelligence Adoption, Reference to Diffusion of Innovation Theory. Technol. Soc. 2024, 79, 102750. [Google Scholar] [CrossRef]
  17. Hu, H.; Zhao, M.Y.; Zhang, X.Y. Network Evolution of Diffusion in Enterprise Digitalization and Intellectualization Transformation: A Technology-Organization-Environment Framework Perspective. PLoS ONE 2023, 18, 295327. [Google Scholar] [CrossRef] [PubMed]
  18. Duan, W.C.; Hu, H.Z.; Zhang, Y.T. What Determines the Performance of Small and Medium-Sized Enterprises Supply Chain Financing? A Qualitative Comparative Analysis of Fuzzy Sets Based on the Technology-Organization-Environment Framework. Front. Psychol. 2022, 13, 976218. [Google Scholar] [CrossRef] [PubMed]
  19. Chatha, K.A.; Jajja, M.S.S.; Gillani, F.; Farooq, S. Examining the Effects of the Technology-Organization-Environment Framework on Operational Performance Through Supply Chain Integration of the Firm. Benchmarking-Int. J. 2024, 31, 1797–1825. [Google Scholar] [CrossRef]
  20. Tian, M.; Huo, B.F.; Park, Y.; Kang, M.G. Enablers of Supply Chain Integration: A Technology-Organization-Environment View. Ind. Manag. Data Syst. 2021, 121, 1871–1895. [Google Scholar] [CrossRef]
  21. Tarofder, A.K.; Answeri, A.; Haque, A.; Sherief, S.R. Validating Technology-Organization- Environment (TOE) Framework in Web 2.0 Adoption in Supply Chain Management. Ind. Eng. Manag. Syst. 2019, 18, 482–494. [Google Scholar] [CrossRef]
  22. Yang, J.Y.; Park, K. Diffusion Model of Digital Transformation Based on Diffusion of Innovation and Chasm Theory: Analysis on the DX Case of Global Electronic Components Company. Korean Manag. Rev. 2024, 53, 57–82. [Google Scholar] [CrossRef]
  23. Grabham, S.; Manu, E. Diffusion of Platform Thinking as an Innovation in the Construction Supply Chain. Proc. Inst. Civ. Eng.-Manag. Procure. Law 2022, 175, 119–130. [Google Scholar] [CrossRef]
  24. Qader, G.; Shahid, Z.A.; Junaid, M.; Shaikh, I.M.; Qureshi, M.A. The Role of Diffusion of Innovation Theory Towards the Adoption of Halal Meat Supply Chain. J. Islam. Mark. 2023, 14, 1211–1228. [Google Scholar] [CrossRef]
  25. Karadayi-Usta, S. Sustainable Additive Manufacturing Supply Chains with a Plithogenic Stakeholder Analysis: Waste Re-duction through Digital Transformation. CIRP J. Manuf. Sci. Technol. 2024, 55, 261–271. [Google Scholar] [CrossRef]
  26. Krishnan, R.; Phan, P.Y.; Krishnan, S.N.; Agarwal, R.; Sohal, A. Industry 4.0-driven Business Model Innovation for Supply Chain Sustainability: An Exploratory Case Study. Bus. Strategy Environ. 2024, 34, 276–295. [Google Scholar] [CrossRef]
  27. Rojek, I.; Jasiulewicz-Kaczmarek, M.; Piszcz, A.; Galas, K.; Mikolaewski, D. Review of the 6G-Based Supply Chain Management within Industry 4.0/5.0 Paradigm. Electronics 2024, 13, 2624. [Google Scholar] [CrossRef]
  28. Belly, Z.; Pajic, V.; Kilibanda, M.; Andrejic, M. Enhancing Distribution Efficiency Through OTIF Performance Evaluation. Mathematics 2024, 12, 3372. [Google Scholar] [CrossRef]
  29. Younis, H.; Wuni, I.Y. Application of Industry 4.0 Enablers in Supply Chain Management: Scientometric Analysis and Critical Review. Heliyon 2023, 9, E21292. [Google Scholar] [CrossRef]
  30. Kandil, T.T. Artificial Intelligence (AI) and Alleviating Supply Chain Bullwhip Effects: Social Network Analysis-based Review. J. Glob. Oper. Strateg. Sourc. 2024. ahead-of-print. [Google Scholar] [CrossRef]
  31. Dolgui, A.; Ivanov, D.; Rozhkov, M. Does the Ripple Effect Influence the Bullwhip Effect? An Integrated Analysis of Structural and Operational Dynamics in the Supply Chain. Int. J. Prod. Res. 2020, 58, 1285–1301. [Google Scholar] [CrossRef]
  32. Tiwari, M.K.; Bidanda, B.; Geunes, J.; Fernandes, K.; Dolgui, A. Supply Chain Digitization and Management. Int. J. Prod. Res. 2024, 62, 2918–2926. [Google Scholar] [CrossRef]
  33. Teng, Y.Q.; Lin, B.Q. New Energy Supply Chain Configuration Diversified Development: The Role of the Digital Economy. IEEE Trans. Eng. Manag. 2024, 71, 8140–8152. [Google Scholar] [CrossRef]
  34. Wieland, A.; Durach, C.F. Two Perspectives on Supply Chain Resilience. J. Bus. Logist. 2021, 42, 315–322. [Google Scholar] [CrossRef]
  35. Chouhan, M.; Rajesh, R.; Sahu, R. Resilience Enhancers and Barriers Analysis for Industry 4.0 in Supply Chains using Grey Influence Analysis (GINA). J. Ind. Inf. Integr. 2025, 43, 100735. [Google Scholar] [CrossRef]
  36. Dubey, R.; Gunaekaran, A.; Childe, S.J.; Common, S.F.; Roubaud, D.; Forop, C. Empirical Investigation of Data Analytics Capability and Organizational Flexibility as Complements to Supply Chain Resilience. Int. J. Prod. Res. 2021, 59, 110–128. [Google Scholar] [CrossRef]
  37. Rashid, A.; Rasheed, R.; Ngah, A.H.; Amirah, N.A. Unleashing the Power of Cloud Adoption and Artificial Intelligence in Optimizing Resilience and Sustainable Manufacturing Supply Chain in the USA. J. Manuf. Technol. Manag. 2024, 35, 1329–1353. [Google Scholar] [CrossRef]
  38. Chen, X.H.; He, C.C.; Chen, Y.; Xie, Z.Y. Internet of Things (IoT)-Blockchain-Enabled Pharmaceutical Supply Chain Resilience in the Post-Pandemic Era. Front. Eng. Manag. 2023, 10, 82–95. [Google Scholar] [CrossRef]
  39. Wang, L.; Zeng, Y.; Xu, Y.S.; Chi, M.; Wu, H.T. The Effect of Blockchain on Construction Supply Chain Resilience: A Mediated Moderation Model. AIN Shams Eng. J. 2025, 16, 103253. [Google Scholar] [CrossRef]
  40. Ivanov, D. Intelligent Digital Twin (IDT) for Supply Chain Stress-Testing, Resilience, and Viability. Int. J. Prod. Econ. 2023, 263, 108938. [Google Scholar] [CrossRef]
  41. Wei, S.; Liu, W.H.; Choi, T.M.; Dong, J.X.; Long, S.S. The Influence of Key Components and Digital Technologies on Manufacturer’s Choice of Innovation Strategy. Eur. J. Oper. Res. 2024, 315, 1210–1220. [Google Scholar] [CrossRef]
  42. Wei, J.Y.; Zhang, X.W.; Tamamine, T. Digital Transformation in Supply Chains: Assessing the Spillover Effects on Midstream Firm Innovation. J. Innov. Knowl. 2024, 9, 100483. [Google Scholar] [CrossRef]
  43. Wang, D.P.; Wang, Z.; Zhang, B.Q.; Zhu, L.D. Vendor-managed Inventory Supply Chain Coordination based on Commitment-penalty Contracts with Bilateral Asymmetric Information. Enterp. Inf. Syst. 2022, 16, 508–525. [Google Scholar] [CrossRef]
  44. Lim, M.K.; Li, Y.; Wang, C.; Tseng, M.L. A Literature Review of Blockchain Technology Applications in Supply Chains: A Comprehensive Analysis of Themes, Methodologies and Industries. Comput. Ind. Eng. 2021, 154, 107133. [Google Scholar] [CrossRef]
  45. Ahmed, S.; Abd Aziz, N.; Haque, R.; Senathirajah, A.R.B.; Qazi, S.Z. Digital Transformation in Malaysian Manufacturing: A Study of Change Sensing and Seizing Capabilities. Cogent Bus. Manag. 2024, 11, 2392046. [Google Scholar] [CrossRef]
  46. Guo, C.H.; Ke, Y.; Zhang, J.K. Digital Transformation along the Supply Chain. Pac.-Basin Financ. J. 2023, 80, 102088. [Google Scholar] [CrossRef]
  47. Cha, C.W.; Lee, J.; Jun, S.; Kang, K.; Chang, T.W. A Maturity Model for Diagnosing the Capabilities of Smart Factory Solution Suppliers and Its Pilot Application. Systems 2023, 11, 569. [Google Scholar] [CrossRef]
  48. Matarazzo, M.; Penco, L.; Profumo, G.; Quaglia, R. Digital Transformation and Customer Value Creation in made in Italy SMEs: A Dynamic Capabilities Perspective. J. Bus. Res. 2021, 123, 642–656. [Google Scholar] [CrossRef]
  49. Grover, A.K.; Ashraf, M.H. Autonomous and IoT-driven Intralogistics for Industry 4.0 Warehouses: A Thematic Analysis of the Literature. Transp. J. 2024, 63, 42–61. [Google Scholar] [CrossRef]
  50. Millán, J.M.; Lyalkov, S.; Burke, A.; Millán, A.; Van Stel, A. Digital Divide among European Entrepreneurs: Which Types Benefit most from ICT Implementation? J. Bus. Res. 2021, 125, 533–547. [Google Scholar] [CrossRef]
  51. Din, F.U.; Paul, D.; Ryan, J.; Henskens, F.; Wallis, M. AOSR 2.0: A Novel Approach and Thorough Validation of an Agent-Oriented Storage and Retrieval WMS Planner for SMEs, under Industry 4.0. Future Internet 2021, 16, 155. [Google Scholar] [CrossRef]
  52. Balta, M.E.; Papadopoulos, T.; Spanaki, K. Business Model Pivoting and Digital Technologies in Turbulent Environments. Int. J. Entrep. Behav. Res. 2023, 10, 1–27. [Google Scholar] [CrossRef]
  53. Zhang, H.M.; Lou, Z.K.; Yan, Y.; Hou, F.J. Supplier Encroachment and Quality Disclosure Strategy in an E-supply Chain with Block Chain Technology. J. Syst. Sci. Syst. Eng. 2024, 33, 682–715. [Google Scholar] [CrossRef]
  54. Chen, Y.Y.; Ren, J. How does Digital Transformation Improve ESG Performance? Empirical Research from 396 Enterprises. Int. Entrep. Manag. J. 2025, 21, 27. [Google Scholar] [CrossRef]
  55. Li, S.; Shi, H.Z.; Sowah, J.S.; Zhai, K.R. Customers’ Block Chain Adoption and Suppliers’ Provision of Trade Credit: A Pre-Registered Report. Pac. -Basin Financ. J. 2024, 86, 102444. [Google Scholar] [CrossRef]
  56. Shen, Z.X.; Zhu, S.J.; Tao, C.; Wen, X. How does Digital Transformation Affect the Maturity Mismatch of Corporate In-vestment and Financing? From a Dual Perspective of Asset and Liability. J. Financ. Econ. 2024, 50, 139–153. [Google Scholar]
  57. Huang, Q.H.; Yu, Y.Z.; Zhang, S.L. Internet Development and Productivity Growth in Manufacturing Industry: Internal Mechanism and China Experiences. China Ind. Econ. 2019, 8, 5–23. [Google Scholar]
  58. Yang, G.Q.; Wang, H.S.; Fang, H.S.; Yue, Z.Y. Carbon Reduction Effect of Digital Economy: Theoretical Analysis and Empirical Evidence. China Ind. Econ. 2023, 5, 80–98. [Google Scholar]
  59. Li, Z.W.; Hyung, D.E.; Lee, D.Y. Financial Flexibility and Corporate Financing Efficiency. Int. Rev. Financ. Anal. 2025, 98, 103892. [Google Scholar] [CrossRef]
  60. Dai, J.H.; Xu, S.L. Analysis on the Influence of Innovation Factors on the Digital Transformation of Chinese Manufacturing Enterprises: Empirical Evidence from A-Share Listed Companies in Manufacturing Industry. Int. J. Technol. Manag. 2025, 97, 144–161. [Google Scholar] [CrossRef]
  61. Wen, Y.D. Goodwill impairment, M&A, and industry development-Empirical evidence from listed companies in China. PLoS ONE 2023, 18, 290442. [Google Scholar]
  62. Gao, J.; Gao, Y.; Guan, T.; Liu, S.S.; Ma, T. Inhibitory Influence of Supply Chain Digital Transformation on Bullwhip Effect Feedback Difference. Bus. Process Manag. J. 2024, 30, 135–157. [Google Scholar] [CrossRef]
  63. Shan, J.; Yang, S.T.; Yang, S.L.; Zhang, J. An Empirical Study of the Bullwhip Effect in China. Prod. Oper. Manag. 2014, 23, 537–551. [Google Scholar] [CrossRef]
  64. Zhang, X.Y.; Zhang, X.D. From Shock to Adaptation: Evaluating the Mechanisms of Trade Friction on Firms’ Total Factor Productivity Through the Lens of Digital Transformation. Systems 2025, 12, 471. [Google Scholar] [CrossRef]
  65. Hentati, H.; Boulila, N. Digital Maturity Index for Accounting Firms. J. Account. Organ. Change 2024, 20, 748–772. [Google Scholar] [CrossRef]
  66. Avenyo, E.K.; Bell, J.F.; Nyamwena, J. Determinants of Digital Technologies’ Adoption in South African Manufacturing: Evidence from a Firm-Level Survey. South Afr. J. Econ. 2024, 92, 235–259. [Google Scholar] [CrossRef]
  67. Adobor, H.; McMullen, R.S. Supply Chain Resilience: A Dynamic and Multidimensional Approach. Int. J. Logist. Manag. 2018, 4, 1451–1471. [Google Scholar] [CrossRef]
  68. Jovanovic, M.; Sjodin, D.; Parida, V. Co-evolution of Platform Architecture, Platform Services, and Platform Governance: Expanding the Platform Value of Industrial Digital Platforms. Technovation 2022, 118, 102218. [Google Scholar] [CrossRef]
  69. Dolgui, A.; Ivanov, D.; Sokolov, B. Ripple Effect in the Supply Chain: An Analysis and Recent Literature. Int. J. Prod. Res. 2018, 56, 414–430. [Google Scholar] [CrossRef]
  70. Zhao, L. Blockchain Adoption and Contract Coordination Driven by Supplier Encroachment and Retail Service: An Analysis from Consumers’ Information Traceability Awareness. Technol. Soc. 2023, 73, 102237. [Google Scholar] [CrossRef]
  71. Cai, J.H.; Jia, L.S.; Shou, Y.Y. Does R&D Intensity Contribute to Soliciting Trade Credit? The Moderating Effects of Financial Slack and Firm Visibility. Nankai Bus. Rev. 2023, 6, 1–29. [Google Scholar]
  72. Bodendorf, F.; Dentler, S.; Franke, J. Digitally enabled Supply Chain Integration through Business and Process Analytics. Ind. Mark. Manag. 2023, 114, 14–31. [Google Scholar] [CrossRef]
  73. Xu, Y.; Chen, L.; Liu, M.F. Influencing Mechanism of International Production Capacity Cooperation on the Capacity Utilization Rate of Enterprises. Econ. Geogr. 2023, 5, 150–159. [Google Scholar]
  74. Zhu, Q.; Hu, S.C.; Shen, W. Why do some Insider CEOs make more Strategic Changes than Others? The Impact of Prior Board Experience on new CEO Insiderness. Strateg. Manag. J. 2020, 41, 1933–1951. [Google Scholar] [CrossRef]
  75. Hosseini, S.; Ivanov, D.; Dolgui, A. Review of Quantitative Methods for Supply Chain Resilience Analysis. Transp. Res. Part E-Logisitics Transp. Rev. 2019, 125, 285–307. [Google Scholar] [CrossRef]
  76. Mao, Q.L.; Wang, K.L. How does Internet Development Optimize Enterprise Resource Allocation: A Perspective from Enterprise Inventory Adjustments. China Ind. Econ. 2023, 8, 137–154. [Google Scholar]
  77. Hong, J.; Xiong, H.; Zhou, Z.Y. Does Supply Chain Network Centrality Enhance or Impede Firm Innovation: Evidence from China. Emerg. Mark. Financ. Trade 2024, 60, 2068–2080. [Google Scholar] [CrossRef]
  78. Gao, D.; Wang, Z.Y.; Zhang, W. Supply Chain Network, Digital Transformation, and Investment Efficiency. Appl. Econ. 2024, 8, 2394704. [Google Scholar] [CrossRef]
  79. Shi, J.Y.; Yang, J.H.; Li, Y.X.; Zhang, Q.W. A Slight Move in One Part May Affect the Situation as a Whole: Supply Network Location, Operational Risk and Corporate Performance. China Ind. Econ. 2019, 9, 136–154. [Google Scholar]
  80. Zhu, X.C.; Zhao, Q.; Yao, X.Y. How Inventory Flexibility affects Productivity: The Moderating Roles of Digital Transformation and Supply Chain Concentration. J. Manuf. Technol. Manag. 2024, 35, 1554–1580. [Google Scholar] [CrossRef]
  81. Li, P.C.; Guo, X.C.; Wang, F.Z.; Zhang, Q.F. Digital Transformation and Corporate Innovation Boundaries: Role of Supply Chain Concentration and Transparency. Int. Rev. Financ. Anal. 2025, 98, 103922. [Google Scholar] [CrossRef]
  82. Zhou, B.R.; Zheng, L. Technology-Pushed, Market-Pulled, or Government-Driven? The Adoption of Industry 4.0 Technologies in a Developing Economy. J. Manuf. Technol. Manag. 2023, 34, 115–138. [Google Scholar] [CrossRef]
  83. Tao, C.Q.; Ding, Y. How Does the Digital Economic Policy Affect the Innovation of Manufacturing Enterprises: From the Perspective of Suitable Supply. Contemp. Financ. Econ. 2022, 3, 16–27. [Google Scholar]
  84. Mazzoni, L.; Pinelli, F.; Riccaboni, M. Measuring Corporate Digital Divide through Websites: Insights from Italian Firms. Ehr Data Sci. 2024, 13, 51. [Google Scholar] [CrossRef]
Figure 1. Research model.
Systems 13 00123 g001
Table 1. Summary of variables.
SortVariable NameCodeDefinition and Measurement
Explained
variable
Supply–Demand ImbalanceBullwhipSee Model (5)–Model (6) for details
Explanatory
variable
Corporate Digital DivideDivideSee Model (7)–Model (8) for details
Control
variables
Corporate SizeSizeThe natural logarithm of total assets
Corporate AgeAgeThe number of years since the enterprise was founded
Corporate PerformanceRoaThe ratio of profit to year-end assets
Cash FlowCashThe difference between the net change in cash and cash equivalents and the net cash flow from financing activities
Tobin’QTQThe ratio of market value to total assets
DualityDualThe chairman and CEO being the same person is coded as 1; otherwise, it is coded as 0
Ownership ConcentrationOwnerThe proportion of shares held by the largest shareholder
Year Dummy VariablesYear2007–2021
Industry Dummy VariablesIndustryIndustry code
Table 2. Summary of the descriptive statistics.
VariableNMeanSDMinMedinaMax
Bullwhipi,s,t12641.4451.4510.0281.11111.802
Bullwhipi,c,t22811.2131.0120.0281.00015.786
Dividei,s,t1264−0.0290.212−1.000−0.0010.571
Dividei,c,t2281−0.0280.236−1.0000.0001.000
Sizei,t333222.0321.24819.30321.84924.965
Agei,t333216.7645.8922.00016.00032.000
Roai,t33320.0420.051−0.1140.0400.207
Cashi,t3332−2.45918.804−21.722−17.21721.621
TQi,t33321.9031.2290.7061.4898.725
Duali,t33320.1870.3900.0000.0001.000
Owneri,t33320.2200.1850.0010.2000.673
Note: The total number of annual observations for enterprises is 3332. Of these, 1264 observations correspond to the “focal enterprise–supplier enterprise” relationship, while 2281 observations correspond to the “focal enterprise–customer enterprise” relationship. There are 213 enterprise-year observations that include both supplier and customer enterprises within the same sample.
Table 3. Baseline regression results.
Variable(1)(2)(3)(4)
Bullwhipi,s,tBullwhipi,c,tBullwhipi,s,tBullwhipi,c,t
Dividei,s,t0.400 **/0.399 **/
(0.171)/(0.172)/
Dividei,c,t/0.235 **/0.222 **
/(0.099)/(0.103)
Sizei,t//−0.0350.057 **
//(0.047)(0.029)
Agei,t//0.022−0.006
//(0.015)(0.005)
Roai,t//2.524 ***−0.525
//(0.922)(0.385)
Cashi,t//−0.005 **−0.001
//(0.002)(0.001)
TQi,t//0.068−0.018
//(0.049)(0.022)
Duali,t//−0.106−0.101 *
//(0.088)(0.054)
Owneri,t//−0.260−0.260 *
//(0.264)(0.133)
Ind//YesYes
Year//YesYes
Constant2.065 ***1.417 ***2.128 *0.241
(0.370)(0.309)(1.233)(0.732)
N1264228112642281
Adj_R20.0640.0360.0770.042
Note: * p < 0.1, ** p < 0.05, and *** p < 0.01, with standard errors in parentheses, adjusted for robustness.
Table 4. Robustness test results for the lagged explanatory variable treatment.
Variable(1)(2)
Bullwhipi,s,tBullwhipi,c,t
Dividei,s,t−10.824 ***/
(0.281)/
Dividei,c,t−1/0.404 ***
/(0.149)
Controlsi,tYesYes
IndYesYes
YearYesYes
Constant−1.604−1.659 *
(1.719)(0.967)
N4971101
Adj_R20.2310.050
Note: * p < 0.1 and *** p < 0.01, with standard errors in parentheses, adjusted for robustness.
Table 5. Robustness test results for the instrumental variable approach.
Variable(1)(2)
Bullwhipi,s,tBullwhipi,c,t
Dividei,s,t2.664 */
(1.547)/
Dividei,c,t/6.448 **
/(2.635)
Controlsi,tYesYes
IndYesYes
YearYesYes
Constant2.9479.301 **
(2.269)(4.189)
N12642281
Adj_R2//
Note: * p < 0.1, ** p < 0.05, this research analyzes data at the supply chain level rather than the firm level, resulting in a relatively smaller sample size due to stringent matching criteria, where reporting different significance levels helps uncover potential trends. Additionally, standard errors in parentheses are adjusted for robustness.
Table 6. Robustness test results for the Heckman two-stage test.
Variable(1)(2)
Bullwhipi,s,tBullwhipi,c,t
Dividei,s,t0.400 */
(0.214)/
Dividei,c,t/0.221 **
/(0.102)
IMR0.0210.016
(0.185)(0.155)
Controlsi,tYesYes
IndYesYes
YearYesYes
Constant1.5890.247
(1.473)(0.732)
N33323332
Adj_R2//
Note: * p < 0.1, ** p < 0.05, this research analyzes data at the supply chain level rather than the firm level, resulting in a relatively smaller sample size due to stringent matching criteria, where reporting different significance levels helps uncover potential trends. Additionally, standard errors in parentheses are adjusted for robustness.
Table 7. Robustness test results for the alternative dependent variable measurement.
Variable(1)(2)
Bullwhipi,s,tBullwhipi,c,t
Dividei,s,t0.907 ***/
(0.346)/
Dividei,c,t/0.404 *
/(0.238)
Controlsi,tYesYes
IndYesYes
YearYesYes
Constant2.4160.580
(2.490)(1.700)
N12622261
Adj_R2//
Note: * p < 0.1, *** p < 0.01, this research analyzes data at the supply chain level rather than the firm level, resulting in a relatively smaller sample size due to stringent matching criteria, where reporting different significance levels helps uncover potential trends. Additionally, standard errors in parentheses are adjusted for robustness.
Table 8. Results of the alleviating effect of resource resilience.
Variable(1)(2)
Bullwhipi,s,tBullwhipi,c,t
Dividei,s,t0.450/
(0.400)/
Dividei,c,t/0.188
/(0.134)
Resilience_Resourcei,t0.062 *0.002
(0.033)(0.007)
Dividei,s,t × Resilience_Resourcei,t−0.409 */
(0.208)/
Dividei,c,t × Resilience_Resourcei,t/0.020
/(0.014)
Controlsi,tYesYes
IndYesYes
YearYesYes
Constant0.6291.271 *
(1.933)(0.685)
N7051623
Adj_R20.0700.056
Note: * p < 0.1, this research analyzes data at the supply chain level rather than the firm level, resulting in a relatively smaller sample size due to stringent matching criteria, where reporting different significance levels helps uncover potential trends. Additionally, standard errors in parentheses are adjusted for robustness.
Table 9. Results of the alleviating effect of process resilience.
Variable(1)(2)
Bullwhipi,s,tBullwhipi,c,t
Dividei,s,t6.504 ***/
(1.680)/
Dividei,c,t/−0.034
/(1.070)
Resilience_Processi,t−2.201 ***−0.577
(0.739)(0.392)
Dividei,s,t × Resilience_Processi,t−9.655 ***/
(2.442)/
Dividei,c,t × Resilience_Processi,t/0.448
/(1.635)
Controlsi,tYesYes
IndYesYes
YearYesYes
Constant2.6511.669 **
(1.627)(0.736)
N6861595
Adj_R20.0780.056
Note: ** p < 0.05, *** p < 0.01, this research analyzes data at the supply chain level rather than the firm level, resulting in a relatively smaller sample size due to stringent matching criteria, where reporting different significance levels helps uncover potential trends. Additionally, standard errors in parentheses are adjusted for robustness.
Table 10. Results of the alleviating effect of system resilience.
Variable(1)(2)
Bullwhipi,s,tBullwhipi,c,t
Dividei,s,t−0.133/
(0.306)/
Dividei,c,t/0.501 ***
/(0.115)
Resilience_Systemi,t0.0890.160 ***
(0.121)(0.046)
Dividei,s.t × Resilience_Systemi,t−0.053/
(0.355)/
Dividei.c.t × Resilience_Systemi,t/−0.428 *
/(0.218)
Controlsi,tYesYes
IndYesYes
YearYesYes
Constant1.0611.248 *
(1.865)(0.655)
N7051623
Adj R20.0570.066
Note: * p < 0.1, *** p < 0.01, this research analyzes data at the supply chain level rather than the firm level, resulting in a relatively smaller sample size due to stringent matching criteria, where reporting different significance levels helps uncover potential trends. Additionally, standard errors in parentheses are adjusted for robustness.
Table 11. Results of the alleviating effect of product resilience.
Variable(1)(2)
Bullwhipi,s,tBullwhipi,c,t
Dividei,s,t−0.129/
(0.348)/
Dividei,c,t/0.076
/(0.177)
Resilience_Producti,t0.3840.539 ***
(0.282)(0.183)
Dividei,s,t × Resilience_Producti,t−0.142/
(1.216)/
Dividei,c,t × Resilience_Producti,t/0.661 *
/(0.350)
Controlsi,tYesYes
IndYesYes
YearYesYes
Constant0.7711.118
(1.811)(0.696)
N7051623
Adj_R20.0570.066
Note: * p < 0.1, *** p < 0.01, this research analyzes data at the supply chain level rather than the firm level, resulting in a relatively smaller sample size due to stringent matching criteria, where reporting different significance levels helps uncover potential trends. Additionally, standard errors in parentheses are adjusted for robustness.
Table 12. Results of the heterogeneity analysis of supply chain structural characteristics.
Variable(1)(2)
Bullwhipi,s,tBullwhipi,c,t
Dividei,s,t0.830 ***/
(0.276)/
Dividei,c,t/−0.004
/(0.198)
Betweeni,t−0.316 ***−0.055
(0.101)(0.074)
Dividei,s,t × Betweeni,t−0.766 ***/
(0.290)/
Dividei,c,t × Betweeni,t/0.035
/(0.315)
Controlsi,tYesYes
IndYesYes
YearYesYes
Constant−0.329−0.546
(1.365)(0.887)
N11571201
Adj_R20.0580.052
Note: *** p < 0.01, this research analyzes data at the supply chain level rather than the firm level, resulting in a relatively smaller sample size due to stringent matching criteria, where reporting different significance levels helps uncover potential trends. Additionally, standard errors in parentheses are adjusted for robustness.
Table 13. Results of the heterogeneity analysis of supply chain relational characteristics.
Variable(1)(2)
Bullwhipi,s,tBullwhipi,c,t
Dividei,s,t0.475 **/
(0.201)/
Dividei,c,t/0.349 ***
/(0.105)
HHI_supi,t−0.003/
(0.004)/
Dividei,s,t × HHI_supi,t−0.013/
(0.031)/
HHI_cusi,t/0.004 **
/(0.002)
Dividei,c,t × HHI_cusi,t/−0.027 ***
/(0.010)
Controlsi,tYesYes
IndYesYes
YearYesYes
Constant1.9310.054
(1.280)(0.761)
N12542178
Adj_R20.0760.047
Note: ** p < 0.05, *** p < 0.01, this research analyzes data at the supply chain level rather than the firm level, resulting in a relatively smaller sample size due to stringent matching criteria, where reporting different significance levels helps uncover potential trends. Additionally, standard errors in parentheses are adjusted for robustness.
Table 14. Results of the heterogeneity analysis of the government’s digital focus.
Variable(1)(2)
Bullwhipi,s,tBullwhipi,c,t
Dividei,s,t−1.430 */
(0.761)/
Dividei,c,t/−0.210
/(0.467)
Digipolicyi,t−0.0100.063 ***
(0.025)(0.014)
Dividei,s,t × Digipolicyi,t0.299 **/
(0.125)/
Dividei,c,t × Digipolicyi,t/0.069
/(0.069)
Controlsi,tYesYes
IndYesYes
YearYesYes
Constant1.775−0.031
(1.239)(0.767)
N12642281
Adj_R20.1110.070
Note: * p < 0.1, ** p < 0.05, *** p < 0.01, this research analyzes data at the supply chain level rather than the firm level, resulting in a relatively smaller sample size due to stringent matching criteria, where reporting different significance levels helps uncover potential trends. Additionally, standard errors in parentheses are adjusted for robustness.
Table 15. Results of the heterogeneity analysis of the nature of the enterprise.
Variable(1)(2)
Bullwhipi,s,tBullwhipi,c,t
Dividei,s,t0.610 ***/
(0.198)/
Dividei,c,t/0.135
/(0.161)
SOEi,t−0.197 *0.068
(0.101)(0.102)
Dividei,s,t × SOEi,t−0.663 **/
(0.327)/
Dividei,c,t × SOEi,t/0.227
/(0.195)
Controlsi,tYesYes
IndYesYes
YearYesYes
Constant1.775−0.031
(1.239)(0.767)
N12642281
Adj_R20.1110.070
Note: * p < 0.1, ** p < 0.05, *** p < 0.01, this research analyzes data at the supply chain level rather than the firm level, resulting in a relatively smaller sample size due to stringent matching criteria, where reporting different significance levels helps uncover potential trends. Additionally, standard errors in parentheses are adjusted for robustness.
Disclaimer/Publisher’s Note: The statements, opinions and data contained in all publications are solely those of the individual author(s) and contributor(s) and not of MDPI and/or the editor(s). MDPI and/or the editor(s) disclaim responsibility for any injury to people or property resulting from any ideas, methods, instructions or products referred to in the content.

