Article

Panoramic Video Synopsis on Constrained Devices for Security Surveillance

Department of Computer and Information Security, and Convergence Engineering for Intelligent Drone, Sejong University, Seoul 05006, Republic of Korea
*
Author to whom correspondence should be addressed.
Systems 2025, 13(2), 110; https://doi.org/10.3390/systems13020110
Submission received: 18 December 2024 / Revised: 30 January 2025 / Accepted: 7 February 2025 / Published: 11 February 2025
(This article belongs to the Special Issue Digital Solutions for Participatory Governance in Smart Cities)

Abstract

:
As the global demand for surveillance cameras increases, the digital footage data also explicitly increases. Analyzing and extracting meaningful content from footage is a resource-depleting and laborious effort. The traditional video synopsis technique is used for constructing a small video by relocating the object in the time and space domains. However, it is computationally expensive, and the obtained synopsis suffers from jitter artifacts; thus, it cannot be hosted on a resource-constrained device. In this research, we propose a panoramic video synopsis framework to address and solve the problems of the efficient analysis of objects for better governance and storage. The surveillance system has multiple cameras sharing a common homography, which the proposed method leverages. The proposed method constructs a panorama by solving the broad viewpoints with significant deviations, collisions, and overlapping among the images. We embed a synopsis framework on the end device to reduce storage, networking, and computational costs. A neural network-based model stitches multiple camera feeds to obtain a panoramic structure from which only tubes with abnormal behavior were extracted and relocated in the space and time domains to construct a shorter video. Comparatively, the proposed model achieved a superior accuracy matching rate of 98.7% when stitching the images. The feature enhancement model also achieves better peak signal-to-noise ratio values, facilitating smooth synopsis construction.

1. Introduction

The Internet of Things (IoT) has become a promising technology in the last decade because it provides better resource management, increases productivity, and enhances worker safety. Moreover, IoT has helped automate small-scale manufacturing plants to make processes cost-effective. Today’s smart surveillance systems heavily rely on IoT devices to provide compact end-to-end services. Further, IoT devices have significantly increased computational power; thus, more applications are hosted on them to make daily activities simple and easy. In the last decades, the number of monitoring cameras, which record massive footage, has considerably increased, depleting storage space. The International Data Corporation [1] projected that the estimated data throughput will grow to 175 zettabytes by 2025. A human operator is responsible for analyzing and monitoring the video footage, which often takes longer to explore, and humans skip crucial information because they are susceptible to errors. The human operator may also suspect information overload in a video surveillance system, which refers to a situation where the volume of data generated by the surveillance system exceeds the human operator’s capacity to process, analyze, and generate an alert.
The United Nations on Drugs and Crime [2] stated that public space disturbances or crimes are committed using equipment, such as guns or knives. Thus, the early detection and notification of such activities to the appropriate authority is crucial. Crime investigation agencies view hours of video footage to obtain evidence if several cameras are in the vicinity, and their examination takes considerable time. The video synopsis technique is used to create a shorter video from the hours of footage, saving storage and improving efficiency for analysis [3]. The resultant synopsis video contains many unnecessary objects, and viewing it is difficult because it suffers from collision, distortion, and jittering effects [4].
The traditional synopsis technique is not applicable to constructing a synopsis of only abnormal objects from multiple videos. In real-life scenarios, a conventional surveillance system consists of numerous camera panels monitoring various public spaces. However, the mounted cameras share joint view angles, which are substantial, leading to extracting similar video footage from multiple cameras, increasing storage space, and depleting computational resources. Therefore, to mitigate this problem, we suggested a panoramic video synopsis framework (PVSF) that stitches multiple cameras to create a panoramic view plane, extracting and shifting only the abnormal object to create a synopsis. Several images are combined using the panoramic stitching model to produce a panorama image, as depicted in Figure 1. The main contributions of this paper are listed below.
  • This study is the first to construct a synopsis from a panoramic view for resource-constrained devices. The crucial part of the PVSF is the panoramic stitching model, which efficiently stitches the parallax view obtained from multiple images and outperforms traditional stitching techniques. A customized dataset of parallax images is created because the current standard dataset is too small to train the model.
  • The detector used in the PVSF is trained on a sizable dataset consisting of images of weapons, such as guns and knives. The detector inferences only the abnormal object using the resource-constrained device. Thus, the PVSF can easily extract and shift only abnormal tubes in the space and time domains, stitching them to create a synopsis video.
  • The PVSF constructs a synopsis that is not vulnerable to noise or distortion, as the quality enhancement model helps blend and enhance the quality of the foreground objects and background, smoothing the stitched frames.
This article is structured as follows. Section 2 describes the problem definition and Section 3 briefly reviews the existing studies. Next, Section 4 explains each component of the proposed framework. Then, Section 5 presents the experimental validation of the framework, Section 6 presents the discussion, and Section 7 concludes the study.

2. Problem Definition

Image stitching is a technique that combines multiple overlapping images to construct a panoramic image. The image-stitching process relies on determining a relationship between the overlapping images and transforming them to match them. Blending is performed on stitched images to remove the noise and achieve a seamless stitch. Identifying a key feature (f) in Image A and aligning and placing the same key feature with (f′) in Image B is challenging and error-prone, as depicted in Figure 2i. The alignment between the images based on the strips is presented in Figure 2ii. As illustrated in Figure 2ii, the optical flow in the images is orthogonal to the strips; thus, the assigned errors reduce the cumulative values. The image strips are aligned by recognizing important spots, matching them across overlapping regions, and then warping the images with a homography transformation. The overlapping areas provide a seamless transition across the image plane. The shift and the wrap in the image strips for the alignment are showcased in Figure 2ii.
Seamless stitching is paramount to the performance of the resultant synopsis because the proposed PVSF inputs the panoramic image to construct the synopsis. However, the existing image-stitching techniques are vulnerable to various challenges.
  • Wide viewpoint and significant deviation: In real-life scenarios, cameras tend to shoot images casually where the variability in the scene does not change the camera setting (i.e., the surveillance cameras are fixed for monitoring). Thus, the acquired footage is exposed to a wide baseline, significant deviation, and illumination changes. The existing techniques suffer when dealing with the wide baseline problem; thus, adopting a feature enhancement model can significantly solve this problem and increase the stitching quality.
  • Minimum features in the overlapping region: Significant proportions of the background features are infused in the scene, causing background clutter. Background clutter is observed in low-texture regions and images of landscapes in a natural scene (e.g., forests, lakes, and sky).
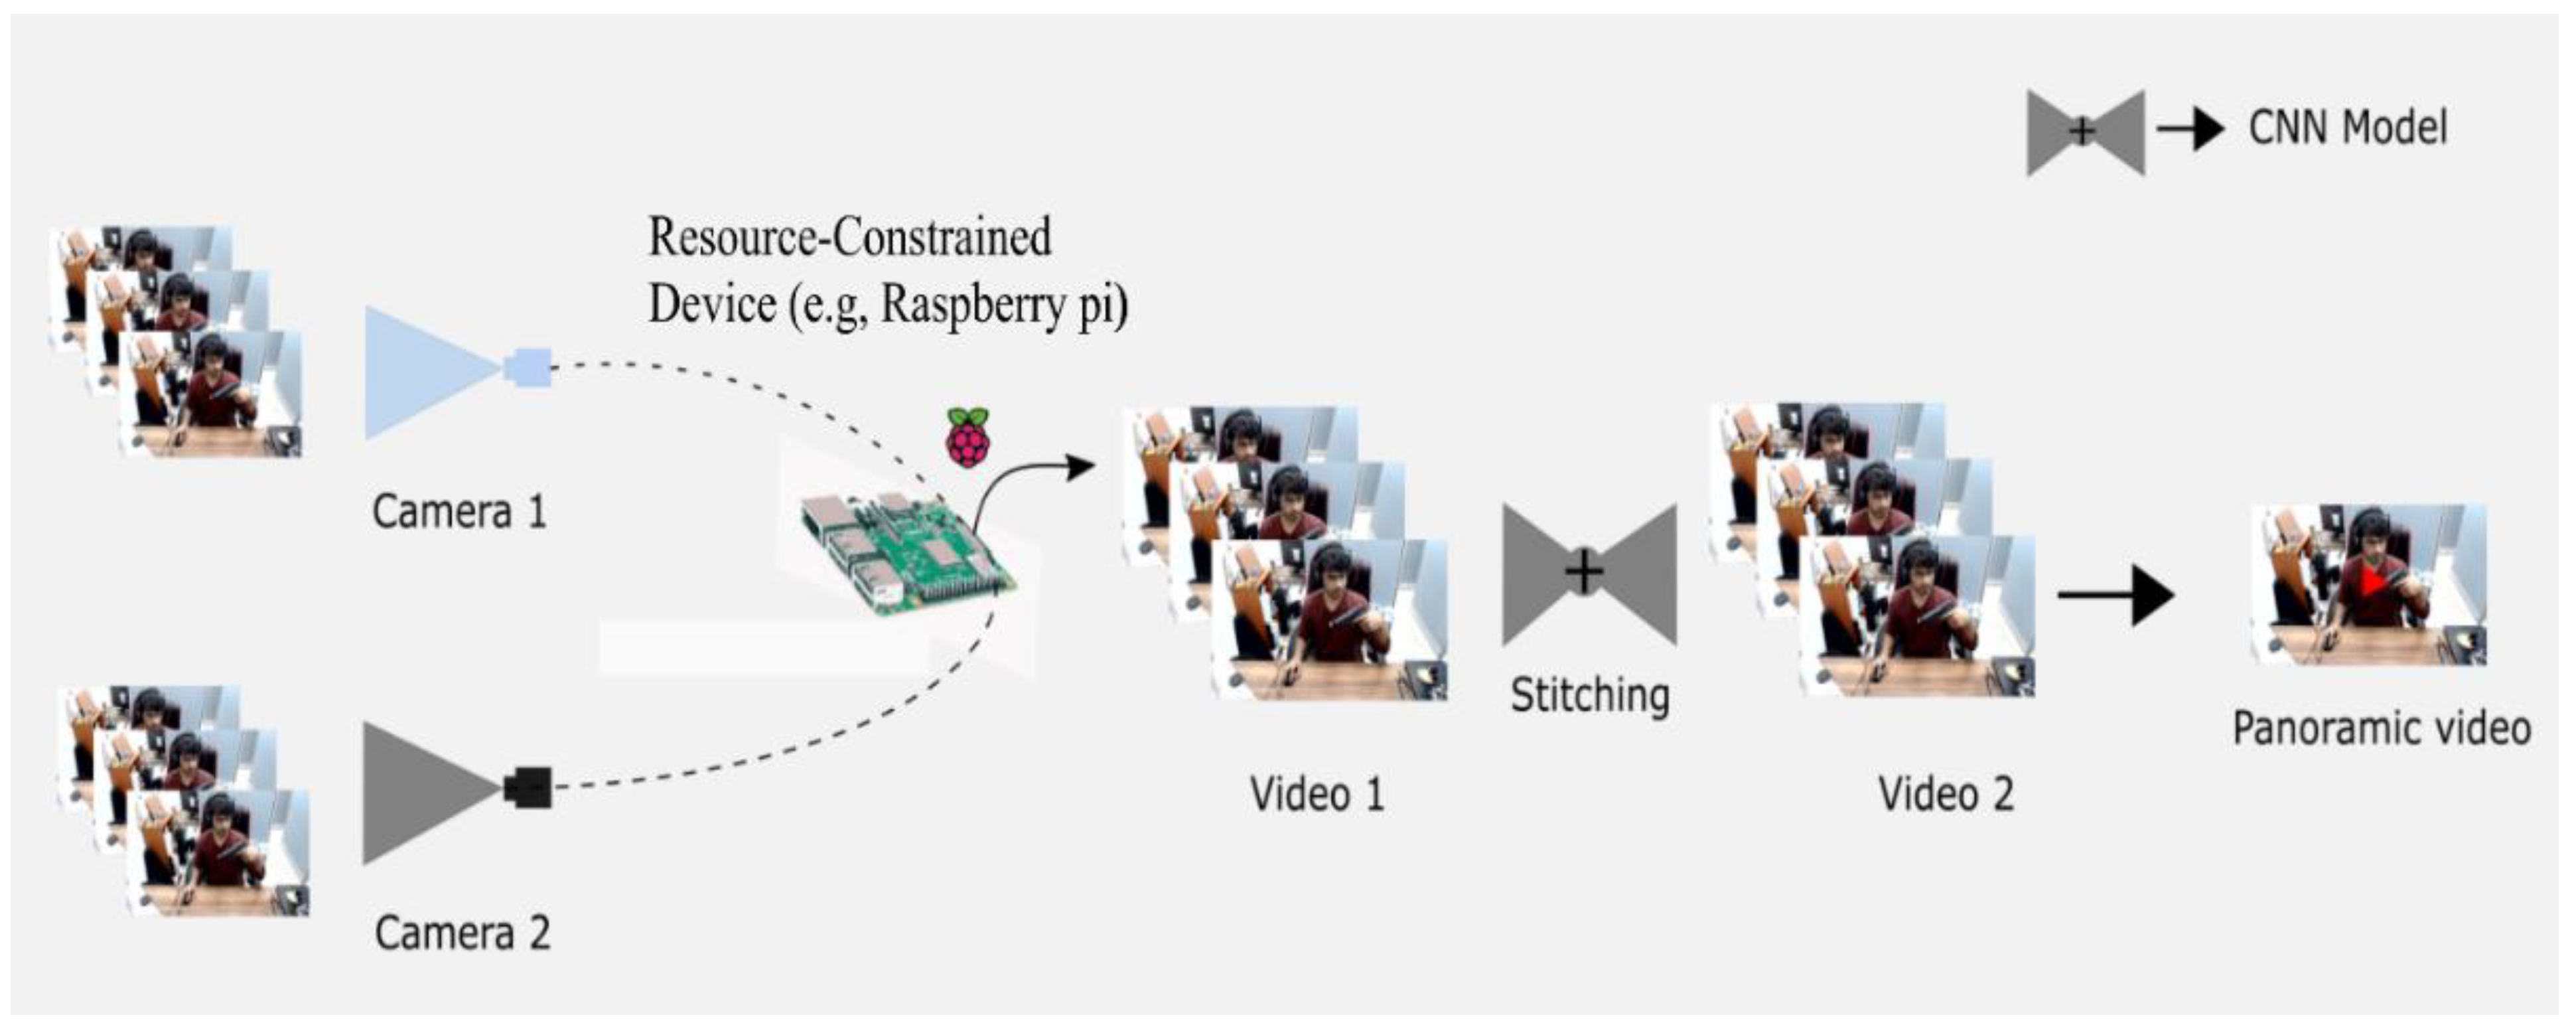
  • Node synopsis: Advancements in technology have made next-generation cameras marginally more computationally efficient. A synopsis can be processed on end-node devices using edge/fog computing. The present synopsis technique cannot create an end-node solution.
Thus, this proposed study addresses the challenges in real time and provides a sequential solution for each synopsis stage.

3. Related Work

This section briefly discusses the traditional synopsis methods, panoramic stitching, and enhancement of the convolutional neural network (CNN) model for better insight.

3.1. Traditional Synopsis Techniques

Video synopsis is a combination technique that shifts the detected mask to generate a smaller area of footage in the space domain. Numerous video synopsis strategies have focused on collision reduction and time complexity acceleration measures. However, just a few have addressed the integrity of authentic object relations. Li et al. [5] considered a group-based methodology to identify links between objects to associate the relationship between object tubes. In another method, an iterative strategy was developed to identify and combine objects with significant spatiotemporal closeness irrespective of their start times [6]. A classification-based scene adaptive tube clustering strategy was incorporated by Yang et al. [7] to reduce the time complexity significantly for an online streaming synopsis. Combining the camera projection creates a spherical view of the image, which was considered for maintaining the tube interaction [8]. The tubes were rearranged along the nonchronological axis, shifting the objects sequentially to create an object-based synopsis platform [9].
Extracting the tubes is computationally expensive; therefore, Huang et al. [10] suggested minimizing the computation using maximum posterior where the object position is determined without knowing the end-to-end path. However, the resultant synopsis constructed using these techniques suffers from collision and ghosting artifacts. In tube-based methodology, He et al. suggested the object relationship plays a vital role in constructing the synopsis, differing from this frame-based approach, focusing on reducing the collision rate of objects [11]. A metropolis sampling algorithm was used to minimize collision by altering the shape and speed of the objects [12]. Instead of dealing with every object, a graph-based tube reshuffling technique was introduced along with optimization to produce a synopsis for a streaming video, addressing the collision and jittering effect [13].
Similarly, Ghatak et al. [14] incorporated a hybrid optimization technique to reduce complexity when addressing object movement. In another study, simulated annealing and scenario-based optimization were employed to reduce the distance between merging objects [15,16]. Zhu et al. proposed a joint video synopsis methodology specifically designed to consider multicamera videos, primarily considering the key timestamp for performing operations on objects [17,18]. The chronology of the object was maintained, but it was computationally expensive to do so. Visualizing and browsing videos to analyze various aspects of the objects depends on the interrelationship of the entities [19]. Most video synopsis techniques work on a static camera view where the image projection is fixed. The visualization of the synopsis is a crucial factor in determining the accuracy of the synopsis.
Thus, Sun et al. [20] incorporated the scene fusion method based on eye-tracking and the geographic location to state the event of action, maintaining the smooth flow of the storyline. This method relies on an eye-tracking method; hence, it applies to shorter input videos. Zhang et al. [21] proposed an object-tracking algorithm by combining the object direction to preserve the object’s interactivity and semantic information while constructing the synopsis; however, their method suffers from high collision while shifting the object in time and the domain space. The traditional video synopsis methods are vulnerable to collision, jittering, and distortion [22]. In a recent study, an early fusion-based approach for constructing a synopsis for drone surveillance was proposed, involving a synopsis for specific objects [23,24].

3.2. Traditional Panoramic Techniques

A panorama is a stitched view of multiple images based on a standard parallax [25,26]. Using the pixel intensity magnitude and orientation in the individual frame, the scale-invariant feature transform (SIFT) derives the local feature descriptor for every crucial point (i.e., colorful image reference points are retrieved). The SIFT technique can be used to retrieve invariant illumination, affinity, and projection transition information. Zhang et al. [27] suggested a speeded-up robust feature (SURF) that accelerates the SIFT identification process by monitoring. Features from the accelerated segment test (FAST) corner-based method are used to address the runtime frames because this method is quicker at detection [28], precise, and computationally less expensive [29,30].
Incorporating the principal component analysis (PCA)-oriented fast and rotated brief (ORB) feature matching addresses several problems with image stitching, including processing numerous data, reducing the stitching time, and lowering the discrepancy rate. The ORB and PCA algorithms were combined to create this approach, capitalizing on their strengths and increasing the stitching efficiency. The program output reveals that it uses the k-nearest neighbors (KNN) technique to coincide with the local feature while lowering the amplitude of the feature descriptor [31]. Image stitching was accomplished by Caparas et al. [32] using an automatic feature-based method that first performs image registration using the SIFT algorithm and then matches the features using the KNN method. The accelerated KAZE (AKAZE) substantially reduced the complex calculations and time complexity problem while stitching images; however, the method works smoothly on a pair of images with more homography [33].
The ORB local features with directional information are extracted using the FAST method and are characterized by binary robust independent elementary features (BRIEFs) to compare and retrieve features. The random sample consensus (i.e., RANSAC) method was also employed to eliminate the erroneous matching spots. Wang et al. [34] applied the weighted average technique that accelerates image blending in OFAST. In addition, the FAST-BRIEF scheme supports an image-based mosaic solution using a feature-based methodology that can stitch biomedical pictures based on a partial overlap area. Win et al. [35] suggested a technique that aims to stitch high-resolution photos together quickly. On the other hand, Delphin et al. [36] proposed a vertical squared gradient value (VSGV) method to evaluate performance in a seamless splicing. Accurate matching was obtained by creating the SIFT-CUCKOO method, improving edge identification. Edge values are created by matching attribute points while using the SIFT technique [37]. The algorithm mentioned above stitches images based on handcrafted feature key points. Some studies have used wrapping methods for stitching the images. For example, an open-source software called Autostitch version 2.2 stitched the entire panoramic image automatically with no additional inputs [38]. Another method called as-projective-as-possible (APAP) incorporated SIFT methods along with the VLFeat library for stitching the images [39]. A CNN model was used for end-to-end stitching, extracting the feature map from the input images and using the correlation map to determine the similarities between photographs [40].
Shen et al. [41] put forward a generative adversarial network (GAN) which was used to construct a panorama where the model learned based on the sequence of images. The PanGAN method heavily suffers on the edge in stitching photographs. Jia et al. [42] proposed a leveraging line-point consistency (LPC) method to preserve the geometry by reducing the distortion in the broader parallax images where invariant subregions match the planar regions. In contrast to LPC, Nie et al. [43] suggested a technique that adaptively learns semantic features to match critical points in parallax images. The parallax-tolerant unsupervised (PTUS) deep image-stitching method is trained on seamless stitching images, considering the minimum overlap. Jing Li et al. [44] introduced a stitching method that handles parallax using elastic wrapping and Bayesian features; despite its advantages, the technique struggles with severe occlusions and heavily relies on the initial feature match. Differing from this, to improve the initial detection, Peng Du et al. [45] incorporated deep learning for edge detection, focusing on the geometric structure, which has significantly improved the effectiveness, but it also neglects the critical non-geometric features in the images, which are crucial for warping two images with minimum homography. Jia et al. [46] suggested an image stitching method that leverages superpixels instead of regular grids to preserve semantic information. The technique is computationally intensive due to the detailed processing of superpixels and also faces challenges with highly dynamic scenes or scenes with significant depth variations. The existing studies are computationally expensive and vulnerable to alignment or distortion.

3.3. Feature Enhancement Techniques

Low-quality images directly affect the constructed synopsis quality because the foreground object extracted from these images loses substantial pixel information. The incorporation of single-image super-resolution (SISR) techniques help enhance features in the images. Super-resolution studies have demonstrated significant variation in methods with different merits and metrics. Traditionally, pre-upsampling is one of the first methods to use deep learning in super-resolution, such as the super-resolution CNN (SRCNN) [47]. These methods rely on patch extraction, non-linear mapping, and reconstruction. Very deep super-resolution (VDSR) is an improved SRCNN [48], which uses a small convolutional filter instead of a small network with large filters. Unlike the SRCNN, VDSR learns through residual output and interpolates the input with gradient clipping and a high learning rate.
Post-upsampling does not use interpolated images as the input, significantly reducing the computational time. A technique that is dependent on post-upsampling is the efficient subpixel CNN (ESPCN) [49,50]. The ESPCN replaces the deconvolutional layer for upsampling with the sub-pixel convolution, which helps overcome the checkerboard problems (see Section 3). Such techniques as EDSR, MDSR, and CARN [51] rely on residuals for multi-stage networks. These techniques use the residual block along with cascading and recursive cascading to learn features efficiently so that the multistage network extracts features in separate low- (LR) and high-resolution (HR) spaces. The BTSRN [52] uses residual blocks separately for LR and HR extraction. This progressive reconstruction network deals with high-upscale images, such as × 8 . Some of these networks increase the resolution of an image in a stepwise manner.
The LAPSRN and MS-LAPSRN [53] methods contain a Laplacian kernel that upscales the images. This multibranch network uses shortcut connections to transfer information at various layers in the network. The information is transferred through multiple receptive fields, resulting in better training. As observed in residual channel attention networks (RCANs) [54], selective attention to separate regions in an image offers much better results. The RCAN uses skip connections and attention networks to target a specific part of the image, obtaining an enhanced image while minimizing processing costs. Most mentioned methods use differing architectures, but the end goal is the same: to obtain a perceptual HR image as the output. A method based on a GAN significantly reduces perceptual loss. The SRGAN incorporated a GAN model to create an amusing portrayal [55]. The EnhanceNet method is an improved SRGAN with an added relativistic discriminator, which uses this approach to deceive the discriminator by making the actual image appear less authentic. The perceptual loss-based approach focuses on the human perception of the output image. This method reconstructs the image better and faster than per-pixel loss methods.

4. Panoramic Video Synopsis

In this section, two structural views (i.e., system structure (Figure 3)—bird’s eye view and process structure (Figure 4)—internal alignments and the model’s exchange and their parameters) explain the essential components that play a significant role in the synopsis process. The proposed PVSF includes essential operations, such as the panoramic stitching of multiple cameras, detection, extraction, and moving the objects based on the timeline to construct a short video.

4.1. System Structure of PVSF

In the initial years, the pioneered researcher in the synopsis field utilized traditional image processing, machine learning, and optimization methods for proposing the complex framework of the synopsis process. The synopsis framework consists of components like detection, tracking, foreground extraction, background generation, optimization, and blending. Usually, the synopsis is constructed only on single-view cameras, as constructing a synopsis for multiple cameras is challenging and complex. The proposed study constructs a synopsis for multiple cameras utilizing the setup of common homography among the visuals of the multiple camera space. The proposed framework consists of methods like panoramic stitching, detection, tracking, background and foreground generation, as well as feature enhancement. Its alignment can be seen in the system structure depicted in Figure 3. In this section, we also try to answer these questions explicitly for better clarification. Why is a panoramic stitching model required? Panoramic stitching (explained in Section 4.3) is the heart of the proposed method, which leverages the common homography between the multiple cameras and constructs a single panorama using the proposed model so that we can construct a synopsis for multiple camera scenarios, which is defined in the blue block in Figure 3. How significant is the detection model and tracking in the synopsis process? The detection model (explained in Section 4.4) helps in identifying and localizing the foreground object, which is an essential parameter that helps later in the synopsis process to have dynamic control of the foreground object operations ( F g 1   t o   F g A l l ) ; tracking helps to map the chronology of the object in due course of the video sequences. What is the role of the enhancement network in the synopsis framework? In the synopsis process, the enhancement network (explained in Section 4.5) helps to remove the noise when the foreground tubes are stitched with the background, increasing the visual quality ( V f 1   t o   V a l l ) of the resulting synopsis.

4.2. Process Structure of PVSF

The process structure of PVSF shows the alignment of internal components and their dependencies on each other for the resultant synopsis. The PVSF is carefully designed to mitigate the challenges (i.e., jittering effects, collision, clutter, and object relationships) faced in synopsis generation. Using a customized GAN, we first created end-to-end image stitching where two captured parallax input images are stitched together so that the output is a single panoramic image. In the second task, the output from the generative network is used to examine whether it contains any person defined as abnormal (e.g., someone carrying a gun or knife). We used the object detection model You Only Look Once version 7 (YOLOv7) trained on a custom dataset to detect an abnormal person. The extracted background and abnormal foreground objects are stitched in the third task. The quality enhancement CNN model (explained in Section 4.5) eliminates noise and increases the frame quality; thus, the generated synopsis is smooth. If an abnormal object is identified during the synopsis process, an alert message is sent to the end users, notifying them of the danger. Figure 4 depicts the entire process of the PVSF for an abnormal object.

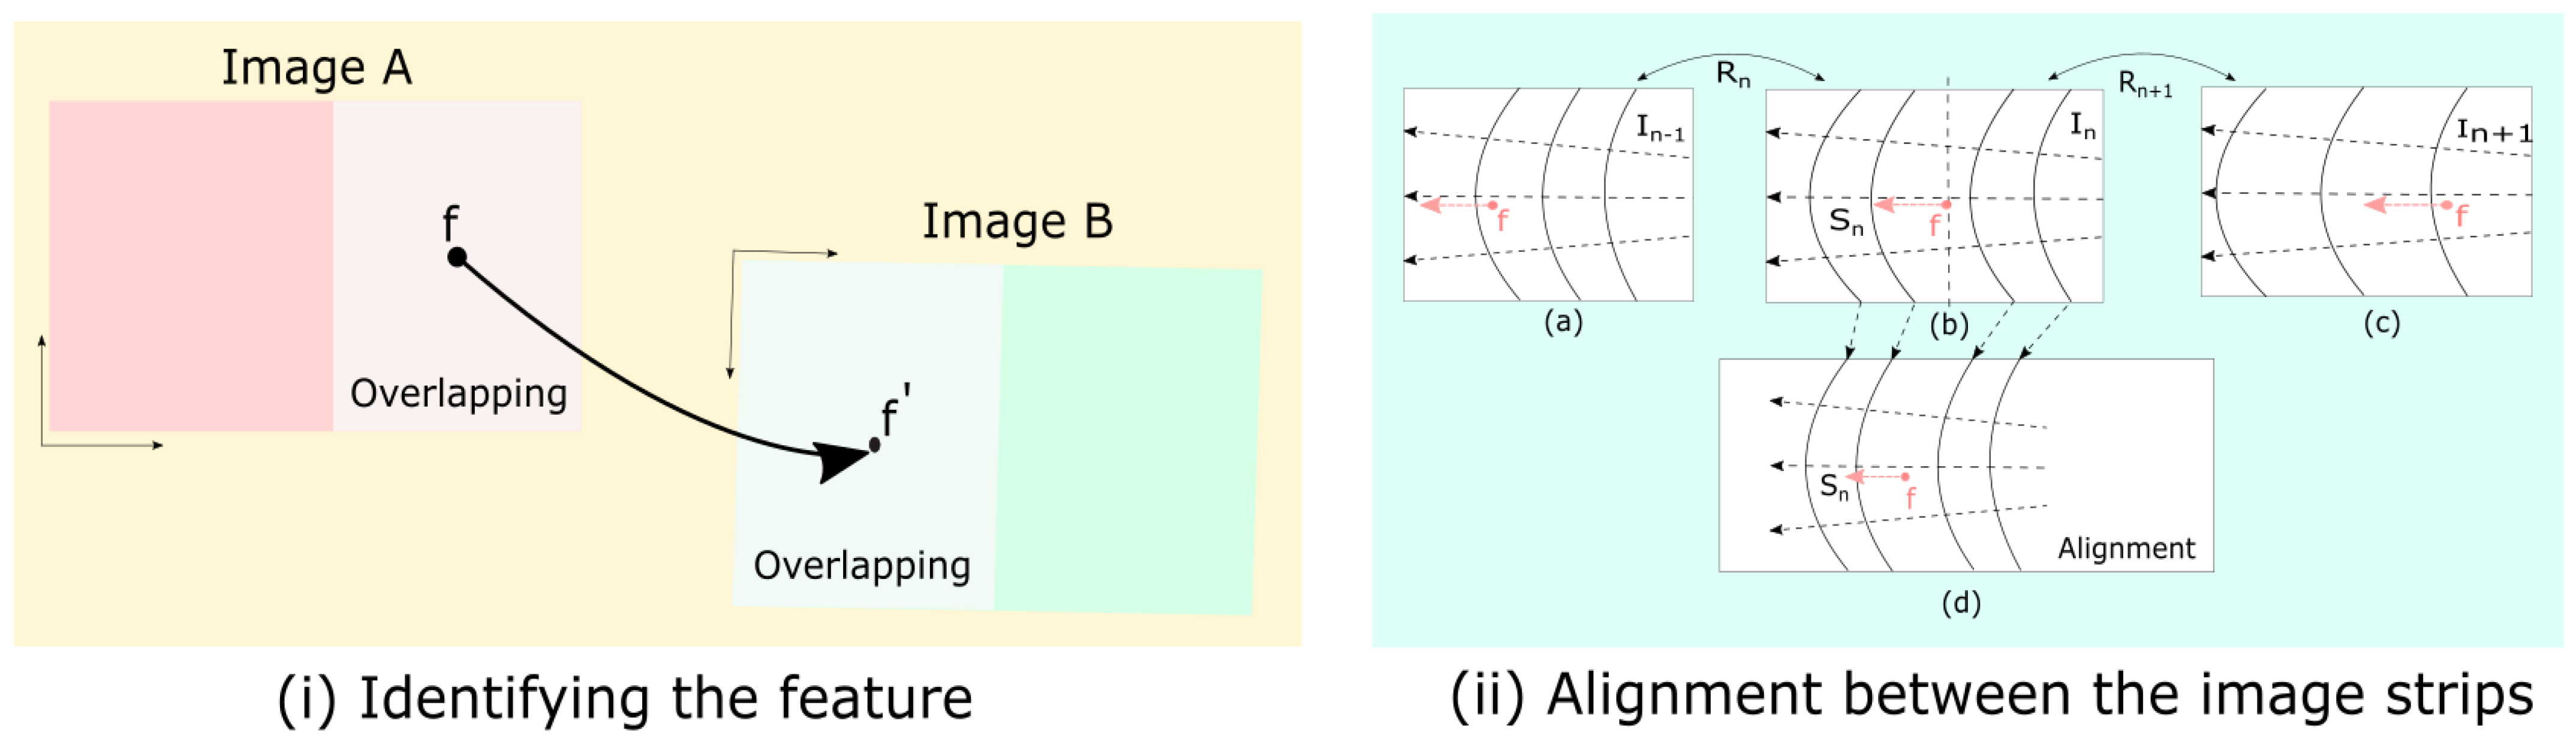
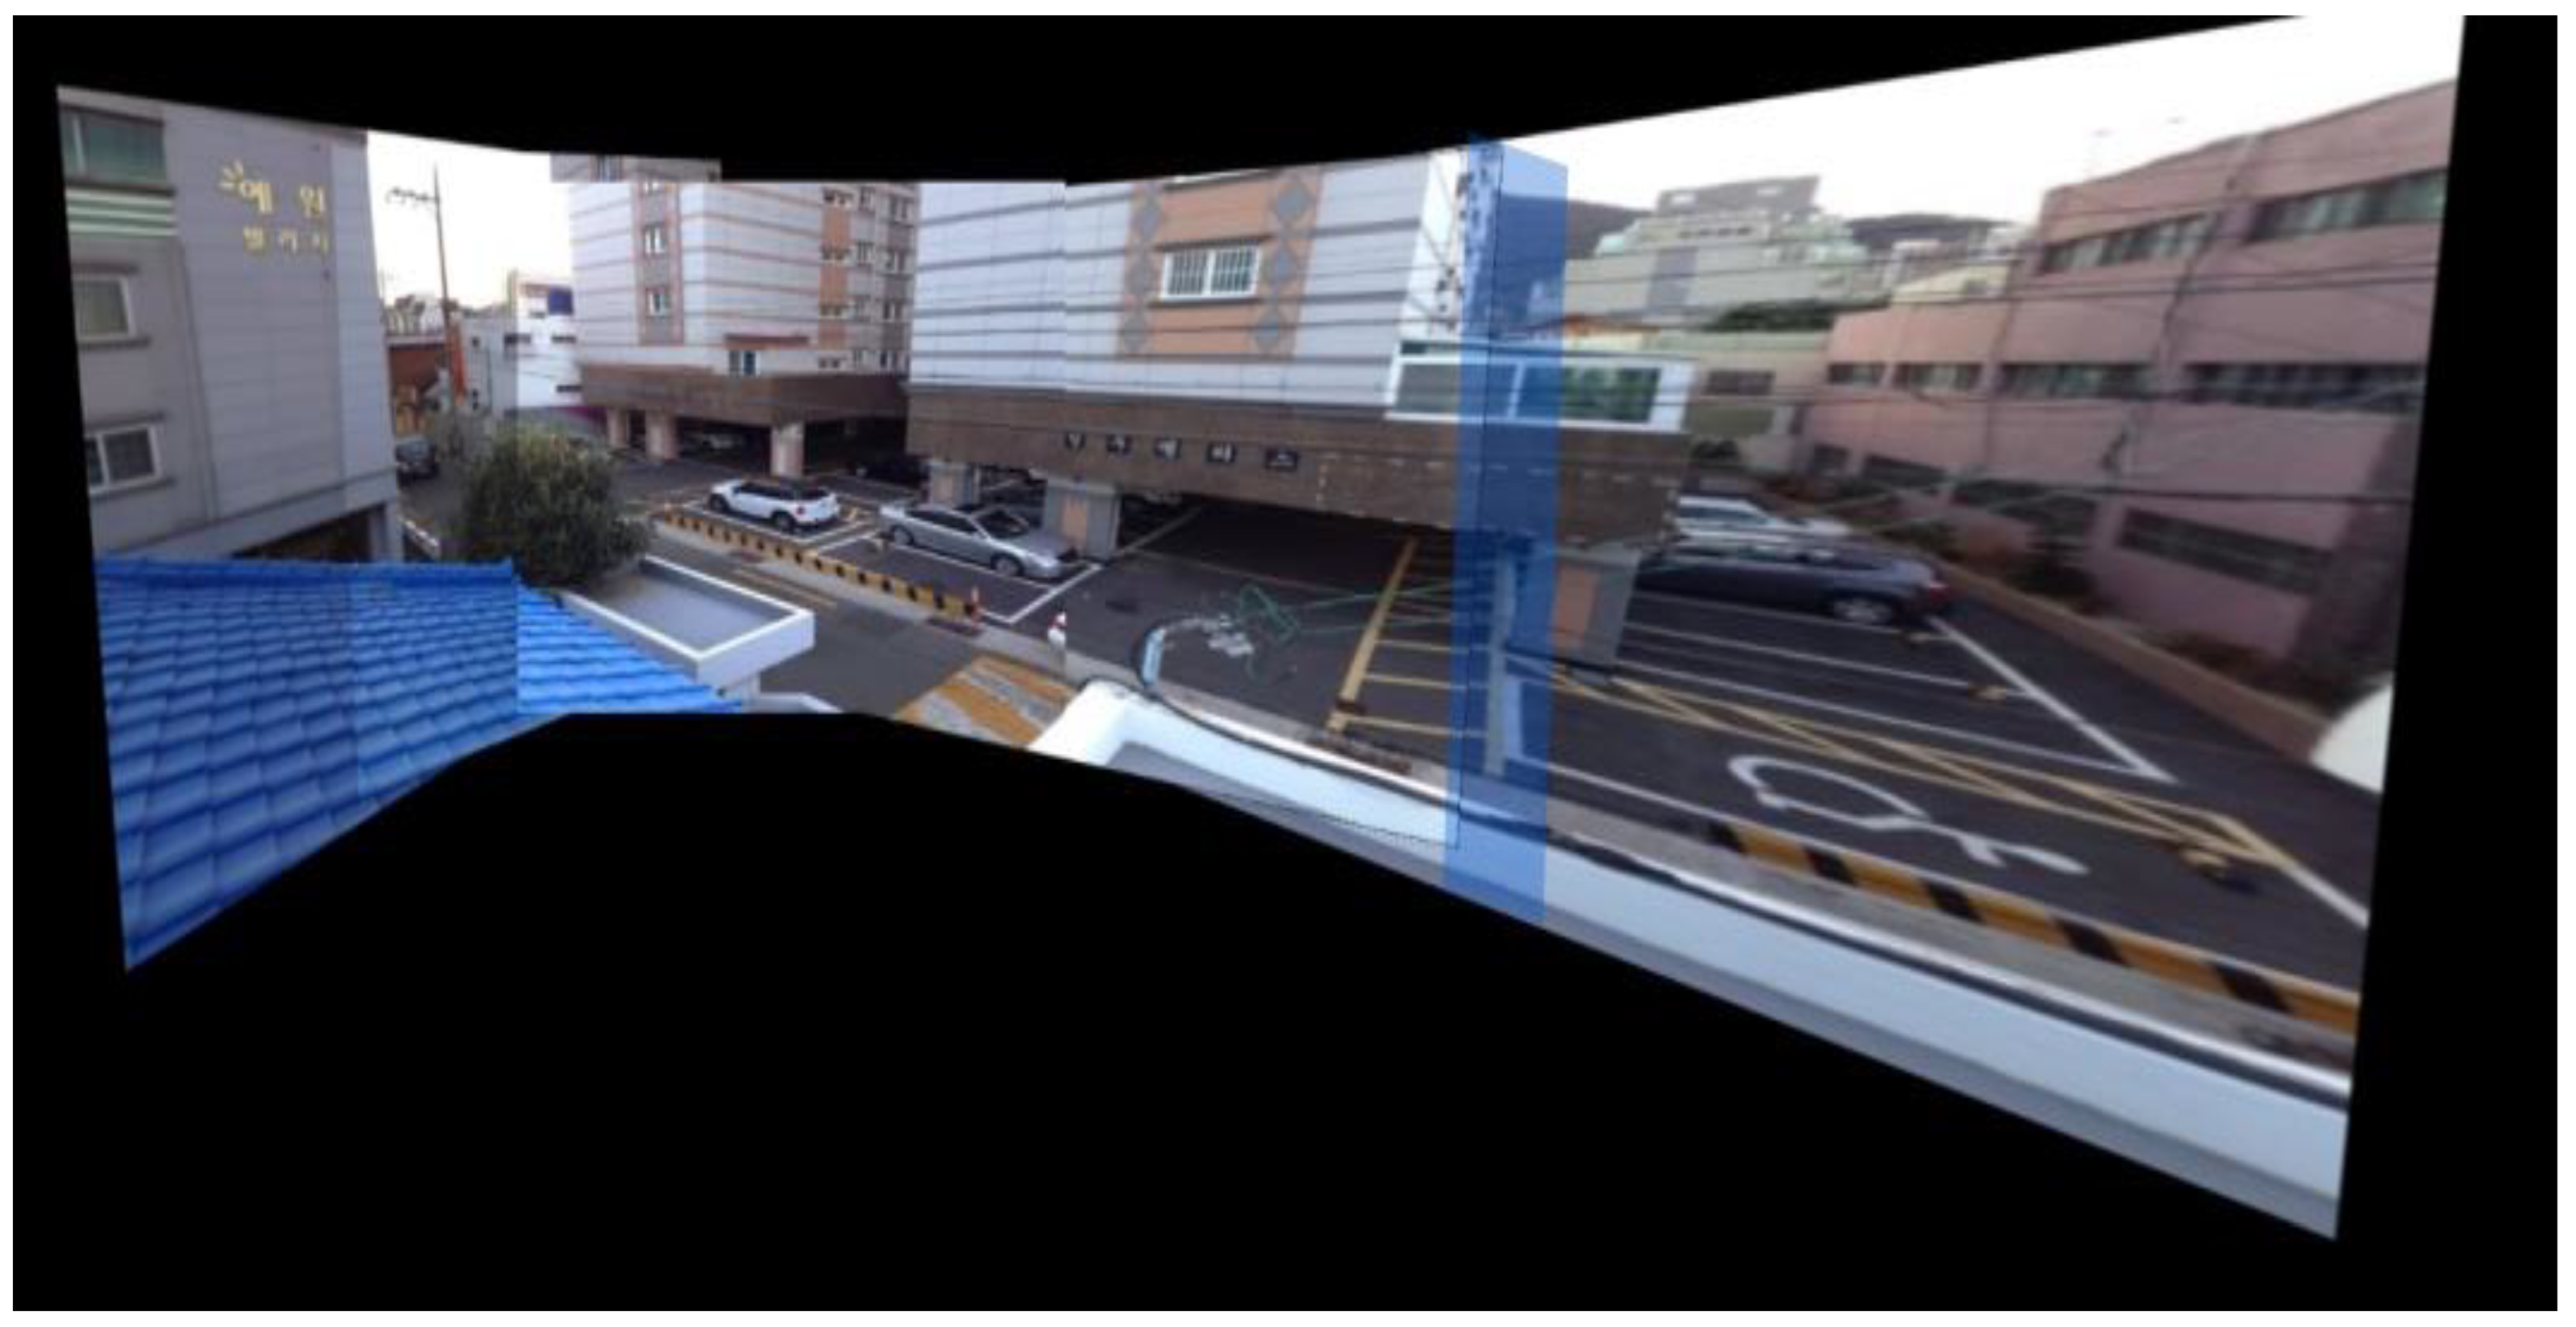
4.3. Panoramic Stitching

This section discusses the detailed model configuration of the proposed GAN for panoramic image stitching. Figure 5 provides a pictorial representation of the model blocks.

4.3.1. Model Training

The generator was built with two input heads followed by two convolutional blocks. The convolutional blocks comprise the convolutional, weight, and parametric rectified linear unit (ReLU) layers, and the concatenated layer combines both image features. The most common features between the images must be identified to address the stitching problems, which was achieved by downscaling and stacking multiple residual blocks. Finally, we upscaled the feature maps to construct the panorama. Furthermore, we used the skip connection to employ the most critical information in the feature map.

4.3.2. Discriminator

The discriminator comprises a stack of convolutional layers, weight normalization, and a leaky ReLU layer. We used a network-in-network method with parallel convolutional blocks. Commonly, convolutional transposes are used for parallelization, but the convolutional transposed layers with a deep network require heavy computation. Therefore, we used a network-in-network method with parallelized 1 × 1 CNN layers instead of convolutional transposes in the proposed network. The network-in-network method is beneficial for the study purpose because it reduces computation.

4.3.3. Generator Loss

The generator loss is the weighted sum of content loss and adversarial loss, where the act as weighting factors to balance the contribution of the different components, and are used to control the trade-off between the perceptual loss and the adversarial loss. By adjusting the , we can fine-tune the balance for constructing perceptually accurate images and generating highly realistic images; the loss is calculated in Equation (1):
l G e n         D m i n = l V G G + l A d v
The content loss (i.e., VGG) depends on the ReLU function of the fourth layer, which is placed after the max-pooling layer of the 19-layer VGG network, as in Equation (2):
l V G G = 1 w h c x = 0 ω 1 y 0 h 1 z = 0 c 1 ( ϕ I G t x ,   y ,   z ϕ ( G I I n x , y , z ) ) 2
where ϕ represents the 19-layer VGG model, the dimensional height and width of the image are given by w and h , respectively, and c denotes the color depth. In addition, I G t represents the image ground truth values, and I I n indicates the input taken by the proposed generator network. The adversarial loss follows the Charbonnier loss given in Equation (3):
L I I n , I G t = I I n I G t 2 + E 2

4.3.4. Discriminator Loss

The Charbonnier loss function helps the discriminator network propagate the difference between the original and vulnerable input. This loss is determined using Equation (4):
L G I I n , G ( I G t ) = D G I I n D G I G t 2 + E 2
where G ( . ) represents the generator, D . denotes the discriminator, and E is a constant.

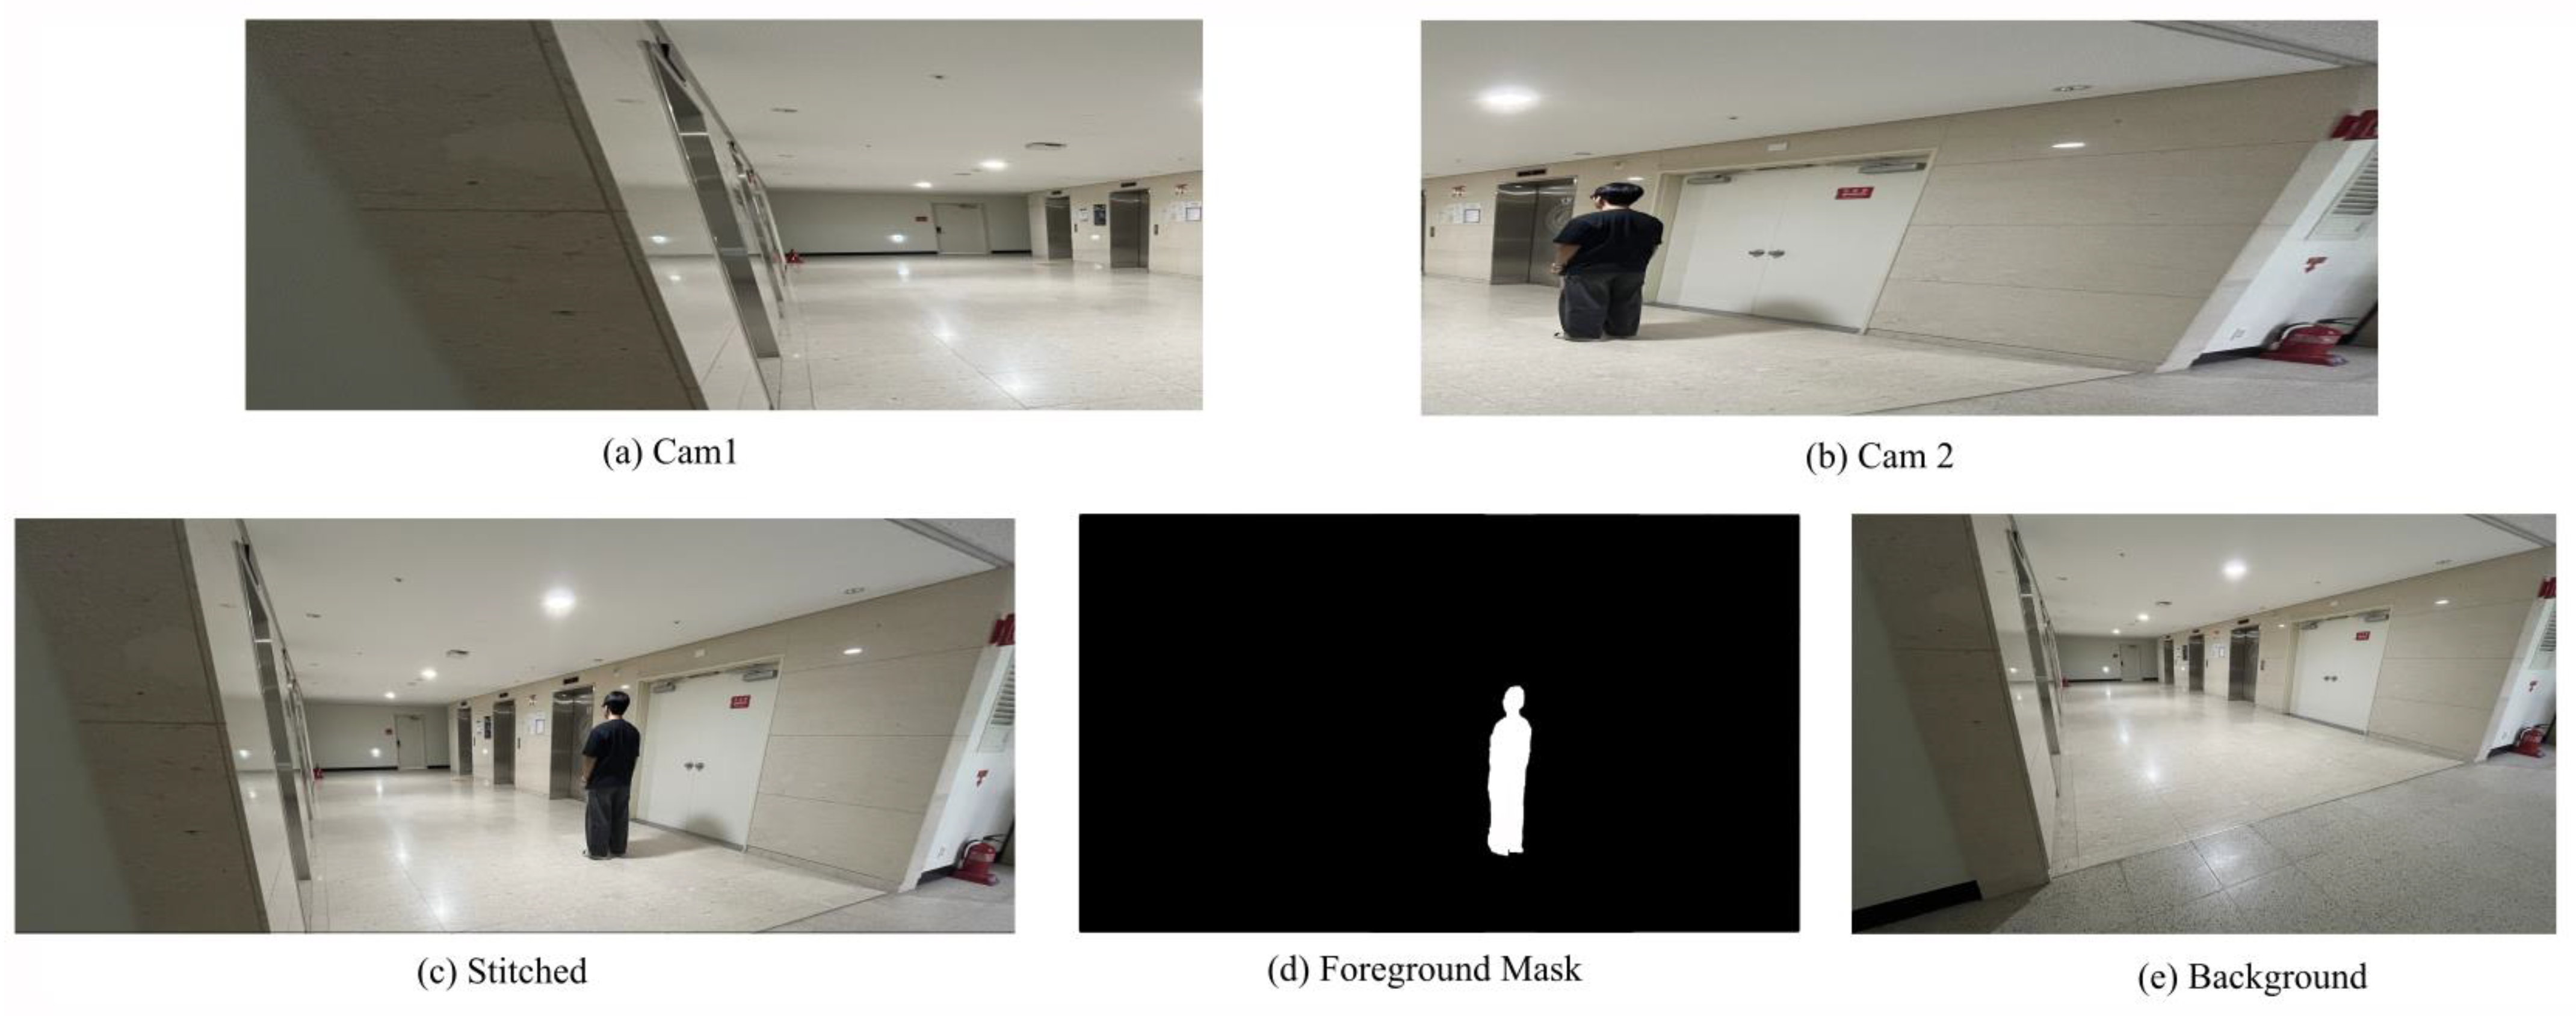
4.4. Object Detector

We used the tiny YOLOv7 lightweight object detection model, which can infer resource constraints for devices [56]. The pretrained weight was reconfigured to accommodate classes for detection. The network infers the object class directly in the video footage by marking the respective detection box. We manually annotated the training image for classes with a person with a gun or knife to achieve efficient detection results. After data augmentation, the training dataset significantly increased to converge the model learning to detect objects.

4.5. Feature Enhancement

The feature enhancement model plays a crucial role because it is designed to increase the quality of the extracted foreground objects. The feature enhancement/quality enhancement model is a densely connected network, as presented in Figure 6.
The model encompasses extraction and reconstruction properties, which help extract global and local features from an image. The skip connections were used to connect the outcome of the corresponding hidden layer to the reconstruction layers. In addition, the reconstruction model was incorporated with parallelized (i.e., network-in-network) CNNs [57] to reconstruct specific aspects of the image. Finally, upsample footage was created by adding the outputs of the upscaled footage. We avoided checkboard artifacts using bilinear interpolation with the convolutional layer and parametric ReLU activation [58,59]. The convolutional layer also helps the network extract crucial features and learn the residuals between LR-interpolated and HR images. To demonstrate the model efficiency, we selected the peak signal-to-noise ratio (PSNR) as the evaluation metric, represented in Equation (5):
P S N R = 20   l o g 10 M A X I ^ M S E
where I ^ denotes the resultant predicted value and I * represents the respective ground truth of the footage. The mean squared error (MSE) is used to determine the PSNR in Equation (6):
M S E = 1 m n 1 m 1 n I ^ n , m I * n , m 2
where the loss is defined by the Charbonnier function [43], and ε is a constant, set to 10 3 , as represented in Equation (7); the ε ensures numerical stability in loss functions, preventing issues like division by zero or zero gradients. It is small enough to avoid affecting significant differences but large enough to stabilize computations:
L I ^ I * = I ^ I * 2 + ε 2
In the proposed model, we cascaded the seven CNN layers with the bias and parametric ReLU for feature extraction. Optimizing the parameters is crucial for better network learning, and we accomplished it using the number of units in decreasing order, from 32 to 8, similar to the c-DCSCN [60]. To overcome the problem of a “dying” ReLU, we incorporated the parametric ReLU for training. This approach eventually helped the weights avoid learning a substantial negative bias. We used the original images as the input to increase the efficiency of the feature extraction layer.
The reconstruction happens at the network end, where the architecture is placed using the network-in-network method. The dimensions of the reconstruction networks are high; thus, we used a 1 × 1 CNN for efficiency and lower computational costs. By the end of the network-in-network block, the output of the layer is c h a n n e l s   ×   s c a l e 2 . In background subtraction, we first estimated the gray image of the present frame and background footage. Then, using the threshold, we can calculate a binary mask. The difference between the present and background images determines the location of the moving object. We used a mathematical morphological filter to determine the difference in the images. For the foreground extraction, the contrast between the background and current images corresponds to the detection parameters of the abnormal object in that space domain.

5. Experimental Results

The PVSF was evaluated based on each integrated model. Panoramic video synopsis is a complex framework; thus, each component is evaluated separately on various benchmark datasets. The panoramic network, detector, and feature enhancement model were trained on an AMD Ryzen 5 3500 six-core computer with an Nvidia RTX 2060 GPU (Advanced Micro Devices, Inc. (AMD), Santa Clara, CA, USA). The model was converted using TensorRT so that it could be optimized on the resource-constrained device. We used a Raspberry Pi 4B model with 32 GB of storage space, with an additional two Logitech cameras to gather video footage.

5.1. Evaluation of the Panoramic Model

The panoramic network was trained on a customized dataset consisting of 30,000 left and right images of 256 × 512 dimensions, on which we achieved an accuracy matching rate of 98.7%. For panoramic stitching, we resized the image such that the height was 256 and the width was 512. In panoramic stitching, the input consists of images with three channel dimensions (i.e., the red, green, and blue (RGB) format) with the corresponding wrapping. The predicted output from the generator was three-dimensional and transformed into the RGB format as an output panoramic image. We compared the proposed panoramic stitching model with feature-based stitching techniques, such as SURF [27], FAST [29], PCA-ORB [31], SIFT-KNN [32], AKAZE [33], OFAST [34], PAST-BRIEF [35], and VSGV [36]. The details of the metric can be found in the image stitching method [61]. Table 1 presents a comparative analysis of the proposed model with the state-of-the-art methods.
We also evaluated the proposed method compared with the Pano-GAN [41], APAP [39], Autostitch [38], FMM-CNN [40], LPC [42], and PTUS [43] models. The Pano-GAN and the APAP suffer from jittering effects at the edge points, whereas the Autostitch and FMM-CNN models were good at alignment but vulnerable to distortion. The LPC and PTUS models are good at resolving distortion observed in the planar region; however, the techniques are computationally expensive and depend on additional preprocessing for better alignment. The proposed method has better results than the existing state-of-the-art studies dealing with distortion, jittering, and computational cost. Furthermore, Table 2 presents the quantitative PSNR and structural similarity index measure (SSIM) obtained on the test dataset, and Figure 7 provides a graphical representation. The representation clearly reveals that the PTUS model performs better than the other methods; however, the proposed model has a slightly superior result compared to PTUS. Figure 8 visualizes the panoramic stitched results.
The proposed method’s performance objective uses two metrics: gradient, which measures the expressiveness and contrast of the stitch image, and entropy, which helps determine the information content. We can evaluate the quality of the image using the horizontal G h ( x , y ) and vertical G v ( x , y ) gradient, where f ( x , y ) defines the grayscale of image (x, y).
G h x , y = f x , y f ( x 1 , y )
G v x , y = f x , y f ( x , y 1 )
Thus the gradient ( G ) is stated as
G = 1 M × N i = 1 M j = 1 N G h x , y 2 + G v x , y 2 2
where M and N are the h e i g h t and w i d t h of the image. The p i determines the grayscale pixel information of the image; the entropy of the image is given by H .
H = i = 0 255 p i log p i
Using the objective performance metric, we evaluated the ELA, GES-GSP, SASP, and the proposed study. Both the gradient and the entropy significantly outline the performance. Table 3 presents the objective evaluation with the gradient and entropy. The gradient lies between 6 and 14; the proposed method slightly shows better results, whereas the entropy is distributed between 6 and 9. It was analyzed that detection in the initial phase of the stitching helps identify the features. Comparatively, GES-GSP has shown more promising results than other studies, as it was developed considering the edges. As can be observed, ELA and SASP suffered, as they relied on traditional methods for the features. However, the proposed method has shown better results across both parameters.
Additionally, we grouped the dataset into three batches for each of the 10,000 images for in-depth model analysis. We performed a confidence interval on each batch, as shown in Figure 9. It is observed that the significant density of the panoramic images showed a confidence range of 94% to 96%. This consistent range suggests the model is reliably confident across diverse scenes. Furthermore, variations between batches were minimal, indicating stability in the model’s predictions across different subsets of the data.
The proposed panoramic model effectively combines multiple images into a continuous, wide-angle view, maintaining smooth visual transitions across frames, as depicted in Figure 10. It aligns overlapping areas to reduce distortion and ensure seamless connections between images. This approach enriches spatial understanding, making it well-suited for capturing broad scenes. The final output is a detailed, high-quality panorama with consistent clarity across all stitched segments. In Figure 10, the model combines five frames into a seamless panoramic view, capturing a broad, immersive scene with remarkable continuity. Each frame is meticulously aligned, eliminating visible seams and preserving image quality. This technique provides a cohesive, expansive perspective, perfect for applications that benefit from an uninterrupted wide-angle view. This model solves major issues in panoramic imaging by eliminating visible seams and reducing distortions between frames. It aligns images naturally to preserve accurate proportions across the entire view.

5.2. Evaluation of the Object Detector

The abnormal object videos were obtained from the DVS video synopsis framework study to evaluate the detection model, totaling eight videos (i.e., v1 to v8). The videos were shot under different lighting conditions with several strange objects (i.e., primarily people carrying a gun or knife). The object detector (i.e., Tiny YOLOv7) was incorporated because it is a lightweight model. The model was trained on images obtained from various datasets, such as ImageNet [62], YouTube Gun Detection Dataset [63], Soha’s Weapons Collection [64], and a handgun detection dataset [65]. We meticulously labeled the dataset to provide precise ground truths for object detection. We only considered the anomalous objects for label identification. The detection model helps obtain the objects’ bounding boxes, which are then used to construct the object tubes. The detectors are used in the initial frames, and then the sequence of the object is found using the tracking method. The tracks of the object tubes are essential in constructing the smooth synopsis without any jitter effects in the synopsis phase. The model obtained a precision of 97% in detecting abnormal objects. Figure 11 illustrates the pictorial representation of object detection.

5.3. Evaluation of the Feature Enhancement Model

Traditional video synopsis techniques suffer from jitter, distortion, noise, and collision; thus, the obtained synopsis must be more precise and more easily visualized than the traditional techniques. We incorporated and trained the quality enhancement model for better visualization on the Diverse 2k (DIV2K) dataset and Berkeley Segmentation Dataset (BSD500). The DIV2K dataset has 801 2k resolution images for training, and BSD500 has 200 images for training. A random crop method was used to perform data augmentation on images before assigning them as the training dataset. As suggested by the ESPCN, we first converted the RGB color-space images to the YCbCr format and passed only the Y channel as an input. Because the human eye is more sensitive to luminance (i.e., the Y channel) than the other channels, each image splits into patches with a patched minibatch. The model was evaluated on the Set14, Set5, and BSD100 datasets.
We applied weight normalizers while training the model because of the overall performance and efficiency of the techniques over other methods (e.g., dropouts, batch normalizers, and spectral normalizers). Additionally, we added l 2 regularization with a scale factor of 10 4 and used the Adam optimizer [66] optimizer to reduce the loss function with a learning rate of 4 × 10 4 . The overall model is compact compared to many SISR models, which helps perform SISR on images without costing much computational power. In the video synopsis, the source video is full of LR frames, for which we must predict the HR output [67]. The video synopsis has frames that contain important information (e.g., ambiguous behaviors of the object). We used the PSNR [68] and SSIM values to measure the quality of the predicted image. The PSNR measures the loss between the ground truth and the predicted image. The SSIM provides information about the perception of the predicted image by comparing the similarities between the two images. Figure 12 depicts the close-up results of the proposed method on various testing datasets.
After assessing the model on the dataset to provide an in-depth analysis, we scaled the proposed model to × 2, × 3, and × 4. Table 4 provides the observed model results and performance, including results with a scale of × 2 for Set5, Set14, and BSD100.
Table 5 gives the parametric comparison between the obtained synopsis and the original video. Constructing the panoramic images on the resource-constrained devices is challenging [69]. In synchronization with the view angle of cameras one and two, we shot eight videos containing several strange activities. In each set of videos, the type of objects present differs in the action and walking positions. Instead of analyzing each video based on the synchronization of the camera viewpoint, these images were stitched together to construct a panoramic view from which only abnormal objects were extracted to create a more petite synopsis video. For generating the end-to-end synopsis, the proposed PVSF created a single panorama from the video sequence obtained from the two video feeds, which then undergoes the process of foreground and background extraction, which is mentioned in Section 4, so that they can be shifted in the time and space domains to obtain the small panoramic synopsis video.
We independently evaluated the components of the panoramic video synopsis framework using state-of-the-art methods and datasets. This evaluation helps us understand the elements of end-to-end synopsis on lightweight devices. Additionally, we evaluated the proposed PVSF with the state-of-the-art synopsis methodology, which is given in Table 5. We used the standard metric frame compact ratio (FCR) to compare synopsis studies. FR determines the ratio of the frames in the obtained synopsis T S and T 1 is the input video, whereas the FCR controls how foreground objects are positioned in the final synopsis. A higher FCR leads to a more compact arrangement, improving the efficiency of the synopsis. The CR is stated in Equation (12):
C R = 1 w . h . T S t = 1 T S x = 1 w y = 1 h { 1 | i f   p ( x , y , t ) f o r e g r o u n d   i n   V S
We compared the proposed synopsis studies with those of Namitha et al. [3] and Pritch et al. [9]. Comparatively, the FR and CR values of the proposed research are significantly better than those of the state-of-the-art studies. Table 6 also showcases the F1 measure for detection and the accuracy matching rate for the panoramic stitching in individual videos. They know the efficiency of the proposed study, and we have stated the time complexity. The time complexity of the proposed PSVF is O T n H W L , where the T n gives the number of key objects in the video sequence, H ,   W , suggests the height and width of the extracted tubes, which are obtained using the detector, and L gives the length of the synopsis. If any of these variables ( T n ,   H ,   W ) become substantial (e.g., many objects, high-resolution videos, long sequence), the computational cost becomes a bottleneck, requiring additional optimization strategies. The proposed studies have far better time complexity compared with the state-of-the-art synopsis studies and the summarization [70,71]; a detailed explanation on the complexity is given in [5].
Figure 13 presents the intermediate results produced by the panoramic synopsis model. Inputs are gathered from two cameras strategically positioned to share a homography essential for accurate panoramic stitching. Leveraging this setup, the model combines the images shown in Figure 13c with a foreground mask, enabling object movement across both the time and spatial dimensions, as depicted in Figure 13d. Meanwhile, the background layer, shown in Figure 13e, serves as the foundation onto which the foreground elements are seamlessly integrated, culminating in the final, cohesive panoramic synopsis.
Figure 14 shows that the following two images, Figure 14a,b, cannot be stitched to create a panorama even though they have common features. The model fails to stitch the images as they lack sufficient overlapping content and have differences in perspective. Effective panorama stitching requires both images to share common visual features captured from consistent angles. Both images have different viewpoints, and they need to be aligned, which makes it difficult for the model to find enough matching points to merge the image and create a panorama.
Using the characteristics of the IoT and edge computing devices enables us to create a smart solution by providing real-time notifications based on specific triggers. In panoramic video synopsis, when the abnormal object is detected, the respective user is notified by sending a message. We used the Twilio API for sending the information on a cellular cell phone using Raspberry Pi when the abnormal object was detected during the synopsis process, as depicted in Figure 15. The user can view the shorter video directly instead of analyzing all videos for the abnormal object. The proposed model notifies the end user of the abnormal object’s presence, and the visualization of the synopsis video helps the user make quick decisions to tackle the situation. On the go, the user can alert the security agency, thus providing end-to-end governance and safety.

6. Discussion

We configured an end-to-end panoramic video synopsis solution that is efficient and reliable enough to solve the mentioned existing challenges in panoramic and synopsis methods. The proposed panoramic stitching model constructs high-quality panoramic images with comparatively low computation. Panoramic stitching of the images helps identify the relationship trajectory of the objects across the multiple views of the videos, significantly reducing the overall synopsis time. We observed false positive results in two cases: (a) those with wider baselines and minimum homography (i.e., wider baselines capture more perspective in panoramic images but suffer alignment issues caused by parallax; minimum homography guarantees the most minor transformation for aligning images while conserving geometric consistency) and (b) those with brightness on the border of the image affecting the identification of the critical points (i.e., because less than 10% of the points were homographic, bright or dark borders can obscure or distort key features, leading to fewer matched points or incorrect alignments, especially in areas near the edges). We presented an in-depth analysis of the overall performance of the panoramic stitching model by independently testing it on diverse datasets. The proposed panoramic stitching and feature enhancement model performs better than the existing state-of-the-art methods. As a feature, the enhancement model helps increase the quality of the generated synopsis.
To understand the acceptability of the proposed study, we conducted user feedback, and a visualization of the user feedback is given in Figure 16. A hundred users participated in the feedback. We conducted the study online and offline using Google Forms and demonstrated the PSVF process on the system, where the users could see the resultant outputs. Users could see the panoramic images, but 97% of them could not find the difference between the original and the panoramic images. This means the proposed study is better at stitching the images. In another question, 92% of the users adopted the proposed PSVF method instead of visualizing the video manually. The proposed method saves crucial time by creating a synopsis of critical events from the hour-long videos.

7. Conclusions

We proposed a PVSF that efficiently stitches images gathered from various cameras with common key points to obtain a panoramic view. This panoramic view image is examined for any abnormal objects. If detected, the object is extracted and shifted in the time and space domains and is stitched with the background to create a shorter video. The video synopsis does not suffer from jitter and distortion because the quality enhancement model removes the noise from the stitching frames by blending the foreground and background. We assessed each component of the PVSF on the benchmark dataset to demonstrate the feasibility and efficacy of the proposed study. The experimental results validate the efficiency of the PVSF on resource-constrained devices. In future work, we plan to create a single-channel model to generate a synopsis instead of using three models to achieve the task.

Author Contributions

The authors contributed to this paper as follows: P.Y.I. wrote this article, designed the system framework, and conducted experimental evaluation; Y.-G.K. supervised and coordinated the investigation. All authors have read and agreed to the published version of the manuscript.

Funding

This work was supported by an Institute of Information & communications Technology Planning & Evaluation (IITP) grant funded by the Korea government (MSIT) (No. RS-2019-II190231, Development of artificial intelligence-based video security technology and systems for public infrastructure safety).

Institutional Review Board Statement

Not applicable.

Informed Consent Statement

Not applicable.

Data Availability Statement

The data presented in this study are available on request from the corresponding author.

Conflicts of Interest

The authors declare no conflicts of interest.

References

  1. Reinsel, D.; Gantz, J.; Rydning, J. Data Age 2025: The Evolution of Data to Life-Critical. Don’t Focus on Big Data; Focus on the Data That’s Big; International Data Corporation (IDC) White Paper; IDC: Needham, MA, USA, 2017. [Google Scholar]
  2. United Nations Office on Drugs and Crime (UNODC). Global Study on Homicide 2019. Data: UNODC Homicide Statistics 2019. Available online: https://www.unodc.org/documents/data-and-analysis/gsh/Booklet_5.pdf (accessed on 1 March 2022).
  3. Namitha, K.; Narayanan, A. Video synopsis: State-of-the-art and research challenges. In Proceedings of the 2018 International Conference on Circuits and Systems in Digital Enterprise Technology (ICCSDET), Kottayam, India, 21–22 December 2018; pp. 1–10. [Google Scholar]
  4. Ingle, P.; Kim, Y. Video Synopsis Algorithms and Framework: A Survey and Comparative Evaluation. Systems 2023, 11, 108. [Google Scholar] [CrossRef]
  5. Li, X.; Wang, Z.; Lu, X. Video synopsis in complex situations. IEEE Trans. Image Process. 2018, 27, 3798–3812. [Google Scholar] [CrossRef] [PubMed]
  6. K, N.; Narayanan, A. Preserving interactions among moving objects in surveillance video synopsis. Multimed. Tools Appl. 2020, 79, 32331–32360. [Google Scholar] [CrossRef]
  7. Yang, Y.; Kim, H.; Choi, H.; Chae, S.; Kim, I. Scene adaptive online surveillance video synopsis via dynamic tube rearrangement using octree. IEEE Trans. Image Process. 2021, 30, 8318–8331. [Google Scholar] [CrossRef] [PubMed]
  8. Priyadharshini, S.; Mahapatra, A. PanoSyn: Immersive video synopsis for spherical surveillance video. Sādhanā 2022, 47, 167. [Google Scholar] [CrossRef]
  9. Pritch, Y.; Rav-Acha, A.; Peleg, S. Nonchronological video synopsis and indexing. IEEE Trans. Pattern Anal. Mach. Intell. 2008, 30, 1971–1984. [Google Scholar] [CrossRef] [PubMed]
  10. Huang, C.; Chung, P.; Yang, D.; Chen, H.; Huang, G. Maximum a posteriori probability estimation for online surveillance video synopsis. IEEE Trans. Circuits Syst. Video Technol. 2014, 24, 1417–1429. [Google Scholar] [CrossRef]
  11. He, Y.; Gao, C.; Sang, N.; Qu, Z.; Han, J. Graph coloring based surveillance video synopsis. Neurocomputing 2017, 225, 64–79. [Google Scholar] [CrossRef]
  12. Nie, Y.; Li, Z.; Zhang, Z.; Zhang, Q.; Ma, T.; Sun, H. Collision-free video synopsis incorporating object speed and size changes. IEEE Trans. Image Process. 2019, 29, 1465–1478. [Google Scholar] [CrossRef]
  13. Ruan, T.; Wei, S.; Li, J.; Zhao, Y. Rearranging online tubes for streaming video synopsis: A dynamic graph coloring approach. IEEE Trans. Image Process. 2019, 28, 3873–3884. [Google Scholar] [CrossRef]
  14. Ghatak, S.; Rup, S.; Majhi, B.; Swamy, M. HSAJAYA: An improved optimization scheme for consumer surveillance video synopsis generation. IEEE Trans. Consum. Electron. 2020, 66, 144–152. [Google Scholar] [CrossRef]
  15. Moussa, M.M.; Shoitan, R. Object-based video synopsis approach using particle swarm optimization. Signal Image Video Process. 2021, 15, 761–768. [Google Scholar] [CrossRef]
  16. Ghatak, S.; Rup, S.; Behera, A.; Majhi, B.; Swamy, M. An improved tube rearrangement strategy for choice-based surveillance video synopsis generation. Digit. Signal Process. 2022, 132, 103817. [Google Scholar] [CrossRef]
  17. Zhu, J.; Liao, S.; Li, S.Z. Multicamera joint video synopsis. IEEE Trans. Circuits Syst. Video Technol. 2015, 26, 1058–1069. [Google Scholar] [CrossRef]
  18. Panagiotakis, C.; Doulamis, A.; Tziritas, G. Equivalent key frames selection based on iso-content principles. IEEE Trans. Circuits Syst. Video Technol. 2009, 19, 447–451. [Google Scholar] [CrossRef]
  19. Yeung, M.M.; Yeo, B.L. Video visualization for compact presentation and fast browsing of pictorial content. IEEE Trans. Circuits Syst. Video Technol. 1997, 7, 771–785. [Google Scholar] [CrossRef]
  20. Sun, W.; Xie, Y. Evaluation of the Geographic Video Synopsis Effect Based on Eye Movement Data. In Proceedings of the 2023 4th International Symposium on Computer Engineering and Intelligent Communications (ISCEIC), Nanjing, China, 18–20 August 2023; pp. 33–37. [Google Scholar]
  21. Zhang, Y.; Zhu, P.; Zheng, T.; Yu, P.; Wang, J. Surveillance video synopsis framework base on tube set. J. Vis. Commun. Image Represent. 2024, 98, 104057. [Google Scholar] [CrossRef]
  22. Ingle, P.Y.; Kim, Y.; Kim, Y.G. Dvs: A drone video synopsis towards storing and analyzing drone surveillance data in smart cities. Systems 2022, 10, 170. [Google Scholar] [CrossRef]
  23. Ingle, P.Y.; Kim, Y.G. Real-time abnormal object detection for video surveillance in smart cities. Sensors 2022, 22, 3862. [Google Scholar] [CrossRef] [PubMed]
  24. Ingle, P.; Kim, Y. Multiview abnormal video synopsis in real-time. Eng. Appl. Artif. Intell. 2023, 123, 106406. [Google Scholar] [CrossRef]
  25. Parab, M.; Ingle, P. Innovative Method for Camouflaged Wildlife Segmentation in Agricultural Practices. In Proceedings of the 2024 2nd International Conference on Advancement in Computation & Computer Technologies (InCACCT), Gharuan, India, 2–3 May 2024; IEEE: Piscataway, NJ, USA; pp. 76–81. [Google Scholar]
  26. Ingle, P.; Kim, Y.G. Integrated Interoperability Based Panoramic Video Synopsis Framework. In Proceedings of the 39th ACM/SIGAPP Symposium on Applied Computing, Avila, Spain, 8–12 April 2024; pp. 584–591. [Google Scholar]
  27. Zhang, T.; Zhao, R.; Chen, Z. Application of migration image registration algorithm based on improved SURF in remote sensing image mosaic. IEEE Access 2020, 8, 163637–163645. [Google Scholar] [CrossRef]
  28. Parab, M.; Bhanushali, A.; Ingle, P.; Pavan Kumar, B.N. Image enhancement and exposure correction using convolutional neural network. SN Comput. Sci. 2023, 4, 20. [Google Scholar] [CrossRef]
  29. Setiawan, A.; Yunmar, R.A.; Tantriawan, H. Comparison of speeded-up robust feature (SURF) and oriented FAST and rotated BRIEF (ORB) methods in identifying museum objects using Low light intensity images. In IOP Conference Series: Earth and Environmental Science; IOP Publishing: Bristol, UK, 2020; Volume 537, p. 012025. [Google Scholar]
  30. Bhanushali, A.; Parab, M.; Kumar, B.P.; Ingle, P. Adversarial Attack on 3D Fused Sensory Data in Drone Surveillance. In Proceedings of the 2024 2nd International Conference on Advancement in Computation & Computer Technologies (InCACCT), Gharuan, India, 2–3 May 2024; IEEE: Piscataway, NJ, USA; pp. 70–75. [Google Scholar]
  31. Zhu, J.; Gong, C.; Zhao, M.; Wang, L.; Luo, Y. Image mosaic algorithm based on PCA-ORB feature matching. Int. Arch. Photogramm. Remote Sens. Spat. Inf. Sci. 2020, 42, 83–89. [Google Scholar] [CrossRef]
  32. Caparas, A.; Fajardo, A.; Medina, D. Feature-based Automatic Image Stitching Using SIFT, KNN and RANSAC. Int. J. Adv. Trends Comput. Sci. Eng. 2020, 9, 96–101. [Google Scholar] [CrossRef]
  33. Hoang, V.; Tran, D.; Nhu, N.; Pham, T.; Pham, V. Deep feature extraction for panoramic image stitching. In Asian Conference on Intelligent Information and Database Systems; Springer: Cham, Switzerland, 2020; pp. 141–151. [Google Scholar]
  34. Wang, M.; Niu, S.; Yang, X. A novel panoramic image stitching algorithm based on ORB. In Proceedings of the 2017 International Conference on Applied System Innovation (ICASI), Sapporo, Japan, 13–17 May 2017; pp. 818–821. [Google Scholar]
  35. Win, K.; Kitjaidure, Y. Biomedical images stitching using orb feature based approach. In Proceedings of the 2018 International Conference on Intelligent Informatics and Biomedical Sciences (ICIIBMS), Bangkok, Thailand, 21–24 October 2018; Volume 3, pp. 221–225. [Google Scholar]
  36. Delphin, D.; Bhatt, M.; Thiripurasundari, D. Holoentropy measures for image stitching of scenes acquired under CAMERA unknown or arbitrary positions. J. King Saud Univ.-Comput. Inf. Sci. 2021, 33, 1096–1107. [Google Scholar] [CrossRef]
  37. Li, J.; Liu, D. March. SIFT Feature Image Stitching Based on Improved Cuckoo Algorithm. In IOP Conference Series: Materials Science and Engineering; IOP Publishing: Bristol, UK, 2020; Volume 782, p. 032100. [Google Scholar]
  38. Brown, M.; Lowe, D.G. Automatic panoramic image stitching using invariant features. Int. J. Comput. Vis. 2007, 74, 59–73. [Google Scholar] [CrossRef]
  39. Zaragoza, J.; Chin, T.; Brown, M.; Suter, D. As-projective-as-possible image stitching with moving DLT. In Proceedings of the IEEE Conference on Computer Vision and Pattern Recognition, Portland, OR, USA, 23–28 June 2013; pp. 2339–2346. [Google Scholar]
  40. He, X.; He, L.; Li, X. Image Stitching via Convolutional Neural Network. In Proceedings of the 2021 7th International Conference on Computer and Communications (ICCC), Chengdu, China, 10–13 December 2021; pp. 709–713. [Google Scholar]
  41. Shen, C.; Ji, X.; Miao, C. Real-time image stitching with convolutional neural networks. In Proceedings of the 2019 IEEE International Conference on Real-time Computing and Robotics (RCAR), Irkutsk, Russia, 4–9 August 2019; pp. 192–197. [Google Scholar]
  42. Jia, Q.; Li, Z.; Fan, X.; Zhao, H.; Teng, S.; Ye, X.; Latecki, L. Leveraging line-point consistence to preserve structures for wide parallax image stitching. In Proceedings of the IEEE/CVF Conference on Computer Vision and Pattern Recognition, Nashville, TN, USA, 20–25 June 2021; pp. 12186–12195. [Google Scholar]
  43. Nie, L.; Lin, C.; Liao, K.; Liu, S.; Zhao, Y. 2023, Parallax-Tolerant Unsupervised Deep Image Stitching. In Proceedings of the IEEE/CVF International Conference on Computer Vision, Paris, France, 2–6 October 2023; pp. 7399–7408. [Google Scholar]
  44. Li, J.; Wang, Z.; Lai, S.; Zhai, Y.; Zhang, M. Parallax-tolerant image stitching based on robust elastic warping. IEEE Trans. Multimed. 2017, 20, 1672–1687. [Google Scholar] [CrossRef]
  45. Du, P.; Ning, J.; Cui, J.; Huang, S.; Wang, X.; Wang, J. Geometric structure preserving warp for natural image stitching. In Proceedings of the IEEE/CVF Conference on Computer Vision and Pattern Recognition, New Orleans, LA, USA, 18–24 June 2022; pp. 3688–3696. [Google Scholar]
  46. Jia, Y.; Li, Z.; Zhang, L.; Song, B.; Song, R. Semantic Aware Stitching for Panorama. Sensors 2024, 24, 3512. [Google Scholar] [CrossRef] [PubMed]
  47. Kim, D.; Kim, J.; Kwon, J.; Kim, T. Depth-controllable very deep super-resolution network. In Proceedings of the 2019 International Joint Conference on Neural Networks (IJCNN), Budapest, Hungary, 14–19 July 2019; pp. 1–8. [Google Scholar]
  48. Dong, C.; Loy, C.C.; He, K.; Tang, X. Learning a Deep Convolutional Network for Image Super Resolution. In Proceedings of the European Conference on Computer Vision, Zurich, Switzerland, 6–12 September 2014; pp. 184–199. [Google Scholar]
  49. Shi, W.; Caballero, J.; Huszár, F.; Totz, J.; Aitken, A.; Bishop, R.; Rueckert, D.; Wang, Z. Real-time single image and video super-resolution using an efficient sub-pixel convolutional neural network. In Proceedings of the IEEE Conference on Computer Vision and Pattern Recognition, Las Vegas, NV, USA, 27–30 June 2016; pp. 1874–1883. [Google Scholar]
  50. Schulter, S.; Leistner, C.; Bischof, H. Fast and accurate image upscaling with super-resolution forests. In Proceedings of the IEEE Conference on Computer Vision and Pattern Recognition, Boston, MA, USA, 7–12 June 2015; pp. 3791–3799. [Google Scholar]
  51. Ahn, N.; Kang, B.; Sohn, K. Fast, accurate, and lightweight super-resolution with cascading residual network. In Proceedings of the European Conference on Computer Vision (ECCV), Munich, Germany, 8–14 September 2018; pp. 252–268. [Google Scholar]
  52. Fan, Y.; Shi, H.; Yu, J.; Liu, D.; Han, W.; Yu, H.; Wang, Z.; Wang, X.; Huang, T. Balanced two-stage residual networks for image super-resolution. In Proceedings of the IEEE Conference on Computer Vision and Pattern Recognition Workshops, Honolulu, HI, USA, 21–26 July 2017; pp. 161–168. [Google Scholar]
  53. Lai, W.; Huang, J.; Ahuja, N.; Yang, M. Deep laplacian pyramid networks for fast and accurate super-resolution. In Proceedings of the IEEE Conference on Computer Vision and Pattern Recognition, Honolulu, HI, USA, 21–26 July 2017; pp. 624–632. [Google Scholar]
  54. Zhang, Y.; Li, K.; Li, K.; Wang, L.; Zhong, B.; Fu, Y. Image super-resolution using very deep residual channel attention networks. In Proceedings of the European Conference on Computer Vision (ECCV), Munich, Germany, 8–14 September 2018; pp. 286–301. [Google Scholar]
  55. Ledig, C.; Theis, L.; Huszár, F.; Caballero, J.; Cunningham, A.; Acosta, A.; Aitken, A.; Tejani, A.; Totz, J.; Wang, Z.; et al. Photo-realistic single image super-resolution using a generative adversarial network. In Proceedings of the IEEE Conference on Computer Vision and Pattern Recognition, Honolulu, HI, USA, 21–26 July 2017; pp. 4681–4690. [Google Scholar]
  56. Cheng, P.; Tang, X.; Liang, W.; Li, Y.; Cong, W.; Zang, C. Tiny-YOLOv7: Tiny Object Detection Model for Drone Imagery. In International Conference on Image and Graphics; Springer: Cham, Switzerland, 2023; pp. 53–65. [Google Scholar]
  57. Kiran, R.; Kumar, P.; Bhasker, B. DNNRec: A novel deep learning based hybrid recommender system. Expert Syst. Appl. 2020, 144, 113054. [Google Scholar]
  58. Tiwari, S.; Jain, A.; Sapra, V.; Koundal, D.; Alenezi, F.; Polat, K.; Alhudhaif, A.; Nour, M. A smart decision support system to diagnose arrhythymia using ensembled ConvNet and ConvNet-LSTM model. Expert Syst. Appl. 2023, 213, 118933. [Google Scholar] [CrossRef]
  59. Ingle, P.; Parab, M.; Lendave, P.; Bhanushali, A.; Bn, P.K. A Comprehensive Study on LLM Agent Challenges. Available online: https://aair-lab.github.io/aia2024/papers/ingle_aia24.pdf (accessed on 1 March 2022).
  60. Charbonnier, P.; Blanc-Feraud, L.; Aubert, G.; Barlaud, M. Two deterministic half-quadratic regularization algorithms for computed imaging. In Proceedings of the 1st International Conference on Image Processing, Austin, TX, USA, 13–16 November 1994; IEEE: Piscataway, NJ, USA; Volume 2, pp. 168–172. [Google Scholar]
  61. Yamanaka, J.; Kuwashima, S.; Kurita, T. Fast and accurate image super resolution by deep CNN with skip connection and network in network. In Neural Information Processing: 24th International Conference, ICONIP 2017, Guangzhou, China, 14–18 November 2017, Proceedings, Part II 24; Springer: Cham, Switzerland, 2017; pp. 217–225. [Google Scholar]
  62. Abbadi, N.K.E.; Al Hassani, S.A.; Abdulkhaleq, A.H. September. A review over panoramic image stitching techniques. In Journal of Physics: Conference Series; IOP Publishing: Bristol, UK, 2021; Volume 1999, p. 012115. [Google Scholar]
  63. Deng, J.; Dong, W.; Socher, R.; Li, L.; Li, K.; Fei-Fei, L. Imagenet: A large-scale hierarchical image database. In Proceedings of the 2009 IEEE Conference on Computer Vision and Pattern Recognition, Miami, FL, USA, 20–25 June 2009; pp. 248–255. [Google Scholar]
  64. Zbontar, J.; LeCun, Y. Stereo matching by training a convolutional neural network to compare image patches. J. Mach. Learn. Res. 2016, 17, 2287–2318. [Google Scholar]
  65. Gu, Y.; Liao, X.; Qin, X. YouTube-GDD: A challenging gun detection dataset with rich contextual information. arXiv 2022, arXiv:2203.04129. [Google Scholar]
  66. Shenoy, R.; Yadav, D.; Lakhotiya, H.; Sisodia, J. An Intelligent Framework for Crime Prediction Using Behavioural Tracking and Motion Analysis. In Proceedings of the 2022 International Conference on Emerging Smart Computing and Informatics (ESCI), Pune, India, 9–11 March 2022; pp. 1–6. [Google Scholar]
  67. Kinga, D.; Adam, J. A method for stochastic optimization. In Proceedings of the International Conference on Learning Representations (ICLR), San Diego, CA, USA, 7–9 May 2015; Volume 5, p. 6. [Google Scholar]
  68. Liu, H.; Ruan, Z.; Zhao, P.; Dong, C.; Shang, F.; Liu, Y.; Yang, L.; Timofte, R. Video super-resolution based on deep learning: A comprehensive survey. Artif. Intell. Rev. 2022, 55, 5981–6035. [Google Scholar] [CrossRef]
  69. Benito-Picazo, J.; Dominguez, E.; Palomo, E.J.; Lopez-Rubio, E. Deep learning-based video surveillance system managed by low cost hardware and panoramic cameras. Integr. Comput.-Aided Eng. 2020, 27, 373–387. [Google Scholar] [CrossRef]
  70. Peronikolis, M.; Panagiotakis, C. Personalized Video Summarization: A Comprehensive Survey of Methods and Datasets. Appl. Sci. 2024, 14, 4400. [Google Scholar] [CrossRef]
  71. Apostolidis, E.; Adamantidou, E.; Metsai, A.I.; Mezaris, V.; Patras, I. Video summarization using deep neural networks: A survey. Proc. IEEE 2021, 109, 1838–1863. [Google Scholar] [CrossRef]
Figure 1. Overview of panoramic stitching of two cameras with different view angles and where some part of the projection is the same.
Systems 13 00110 g001
Figure 2. Feature matching between the overlapping regions of the two different images (A, B) is shown in (i), and the strips matched in three different images (a, b, c) and their alignment (d) are given in (ii).
Systems 13 00110 g002
Figure 3. The system structure is a bird’s eye view of the panoramic video synopsis framework (PVSF), where + indicates the sequential submission.
Systems 13 00110 g003
Figure 4. Process structure of the panoramic video synopsis framework (PVSF). The obtained videos are stitched to obtain a panoramic view using the panoramic stitching model in Block A. The detector in Block B detects objects. The stitching of the obtained object mask and image template and the quality enhancement are depicted in Block C.
Systems 13 00110 g004
Figure 5. Proposed panoramic stitching generator and discriminator network, where k is the kernel size, s is the stride, and n is the number of filters.
Systems 13 00110 g005
Figure 6. Feature enhancement convolutional neural network (CNN) model.
Systems 13 00110 g006
Figure 7. In-depth comparison of the PSNR and SSIM values of the state-of-the-art methods on the test data while performing image stitching.
Systems 13 00110 g007
Figure 8. Left- and right-sided footage feed stitched to construct a panoramic image. The left side footage frame is (i,l,o,r), which is stitched with the subsequent right side footage frame (j,m,p,s) to obtain panoramic stitch images (k,n,q,t).
Systems 13 00110 g008
Figure 9. Confidence interval of the panoramic images.
Systems 13 00110 g009
Figure 10. Multiple frames are stitched together to create a single panorama.
Systems 13 00110 g010
Figure 11. Detection accuracy of each class on a testing dataset, which is classified as abnormal objects. Blue rectangles mark a class (i.e., a person with a gun), and green rectangles state the class (i.e., a person with a knife), and the final column depicts the corresponding foreground mask of the abnormal objects.
Systems 13 00110 g011
Figure 12. PSNR & SSIM (6) results of the proposed model on the Set5, Set14, and BSD100 datasets.
Systems 13 00110 g012
Figure 13. Visualization of intermediate results produced by the panoramic synopsis.
Systems 13 00110 g013
Figure 14. Failure case of panoramic stitching. (a) is disoriented and not aligned, where (b) angle is different.
Systems 13 00110 g014
Figure 15. A notification is sent to the user upon the detection of an abnormal object in the synopsis process.
Systems 13 00110 g015
Figure 16. Visualization of the user feedback.
Systems 13 00110 g016
Table 1. Quantitative analysis with the feature-based stitching techniques.
Sr.NoImage Stitching TechniquesAccuracy Matching Rate (%)
1SURF90.9
2FAST50.7
3PCA-ORB91.9
4SIFT-KNN92.4
5AKAZE89.6
6OFAST82.5
7FAST-BRIEF87.2
8VSGV88.1
9SIFT-CUCKOO90.7
10Proposed98.7
Table 2. Quantitative analysis of the panoramic techniques on test dataset.
PSNR ↑SSIM ↑
EasyModerateHardAverageEasyModerateHardAverage
Pano-GAN10.98.88.19.30.50.30.20.3
APAP10.68.17.48.60.40.20.10.2
Autostitch9.97.56.88.00.30.10.00.1
FMM-CNN11.19.18.49.90.70.60.50.6
LPC13.39.18.49.90.80.70.60.7
PTUS15.011.510.812.20.90.80.70.7
Ours16.212.111.412.90.90.80.70.8
Table 3. Statistical results of ELA, GES-GSP, SASP, and the proposed method.
GradientEntropy
StreetParallaxStreetParallax
ELA6.92227.10427.13807.6456
GES-GSP8.00017.69847.55438.1284
SASP8.51207.23427.32477.8962
Ours9.10248.96548.42978.7659
Table 4. Quantitative results with a metric peak signal-to-noise ratio (PSNR)/structural similarity index measure (SSIM) on the Set5, Set14, and BSD100 testing datasets.
Dataset
(Scale = 2)
BicubicFSRCNNc-DCSCNProposed
Set533.65/0.9337.00/0.9537.15/0.9537.40/0.96
Set1430.24/0.8832.63/0.9032.74/0.9133.09/0.92
BSD10029.57/0.8431.53/0.8931.61/0.8932.21/0.90
Table 5. Parametric comparison between the obtained synopsis video and the original video.
VideoOriginal Video (t)Number of ObjectsNumber of
Abnormal Object
Panoramic Video Synopsis (t)
V13.24 min321.24 min
V2
V35.24 min212.20 min
V4
V56.28 min322.14 min
V6
V72.35 min211.16 min
V8
Table 6. Comparative analysis of synopsis studies.
VideoNamitha et al. [3]Pritch et al. [9]Proposed
Original
Time (t)
FRFCRSynopsis Video (t)FRFCRSynopsis Video (t)Accuracy
Matching Rate (%)
F1 (%)FRFCRSynopsis Video (t)
V13.24 min0.210.142.12 min0.230.092.58 min96950.180.181.24 min
V20.210.112.14 min0.240.082.36 min96960.180.19
V35.24 min0.190.084.36 min0.200.065.01 min97960.170.152.20 min
V40.190.094.22 min0.210.064.45 min97960.170.15
V56.28 min0.240.165.12 min0.270.105.46 min98950.210.202.14 min
V60.240.175.18 min0.290.115.40 min98940.210.21
V72.35 min0.180.111.55 min0.210.082.05 min97950.160.161.16 min
V80.180.121.43 min0.210.082.08 min97950.160.18
Disclaimer/Publisher’s Note: The statements, opinions and data contained in all publications are solely those of the individual author(s) and contributor(s) and not of MDPI and/or the editor(s). MDPI and/or the editor(s) disclaim responsibility for any injury to people or property resulting from any ideas, methods, instructions or products referred to in the content.

