Abstract
In this paper, we develop a multi-objective integrated optimization method for feeder buses of rail transit based on realistic considerations. We propose a bus stop selection method that considers the influence of shared motorcycles, which can score the importance of alternative bus stops and select those with the highest scores as objectives. The objective of the model in this paper is to minimize both the travel costs of passengers and the operating costs of the bus company. This is achieved by optimizing feeder bus routes, the frequency of departures, and interchange discounts to enhance the connectivity between feeder buses and rail transit. In addition, to ensure the feasibility of generated routes in the real road network, a genetic algorithm encoded with priority is used to solve this model. We use the Xingyao Road subway station in Kunming as an example, and the results show that the optimization method is effective.
1. Introduction
In some medium-sized cities in China, shared motorcycles have replaced shared bicycles as the dominant form of shared transportation, having reached a mature stage of development. Furthermore, China’s bus system is also well-developed, thanks to continuous efforts to prioritize public transport. However, due to tremendous operational pressures, bus companies are now focusing more on feeder buses for rail transit systems, which offer lower operating costs and better returns. Medium-sized cities such as Xi’an, Kunming, and Changsha have built and maturely operated rail transit systems, although the operational mileage is relatively limited, and the coverage area is confined. Consequently, there is a reliance on feeder buses or shared motorcycles for last-mile connectivity. Nevertheless, due to the lack of regulation on shared motorcycles, feeder buses face significant challenges in competitiveness, resulting in less-than-optimal passenger flow.
The decline in passenger flow results in a decrease in revenue for bus companies. To maintain a balance between revenues and expenses, bus companies often reduce operating costs by reducing the frequency of departures [1]. However, for certain groups, such as children, the elderly, passengers with large pieces of luggage, and people who cannot ride bicycles, feeder buses are vital. Therefore, it is necessary to optimize feeder buses to better meet their needs.
Bus route optimization is a complex problem that involves multiple objectives, such as transit network design and frequency setting problems (TNDFSPs) [2,3]. However, common TNDFSPs mainly treat bus systems as separate systems and neglect the temporal discrepancies between the arrival times of the two systems. This oversight can lead to extended interchange durations. In fact, feeder buses are not as closely coordinated with rail transport as shared motorcycles. Consequently, it is imperative to strengthen the connection between the two networks.
Analyzing the travel characteristics and the impact mechanism of shared motorcycles on feeder buses will provide valuable insights into the optimization of feeder bus services. Thus, this paper examines the impact of shared motorcycles and reflects this impact on the characteristics of bus stops. By differentiating feeder buses from shared motorcycles, this research helps to identify suitable bus stops for feeder buses. This stop-skipping operation mode is rarely applied to feeder buses [4]. Moreover, the fare is a sensitive factor for commuters [5]. To increase attractiveness, feeder buses can offer interchange discounts, which have been rarely studied in the literature related to transit optimization.
Based on the above considerations, this paper proposes an integrated optimization method for feeder buses under the influence of shared motorcycles. This method simultaneously addresses the optimization of routes, departure frequencies, and interchange discounts to identify the optimal operational combination scheme for feeder buses. The aim is to strengthen the connection between feeder buses and rail transit, thereby attracting more passengers. The model considers both the travel costs of passengers and the operating costs of bus companies in order to find an optimal solution.
The contribution of this paper is multifold. Firstly, we examine the influence of shared motorcycles on feeder buses and present a comprehensive scoring method for bus stops. This scoring method can be used by bus planners to assist them in making informed decisions regarding stop selection. Secondly, we offer an innovative approach to optimizing feeder bus services aimed at improving the connectivity between feeder buses and rail transit systems. Our method incorporates the inclusion of interchange discount, further enhancing the overall efficiency and effectiveness of the feeder bus–rail transit connection. Thirdly, in a real case, it can be realized that the routes generated by the algorithm are feasible in the real road network.
A substantial body of literature has investigated the level of service of buses. Han et al. [6] employed structural equation modeling to explore the relationships between latent variables such as the flexibility and economy of public transport and service level satisfaction. The conclusions show that the flexibility of the service level, including metrics such as waiting times, has the most significant impact on passenger satisfaction. Arasan et al. [7] investigated how enhancing bus service levels with dedicated bus lanes affects the modal shift in passenger travel. It was found that reduced bus travel times significantly encourage electric two-wheeler users to switch to buses. Nikel et al. [8] analyzed the characteristics of different types of public transport and the variances in service level perception among different passenger profiles through 22 indicators, including travel times, service frequencies, and transfer waiting times. The conclusions suggest that passengers place high importance on service frequency and transfer waiting time. Research on bus service levels reveals that factors such as departure frequency, travel time, and transfer convenience substantially impact passenger perceptions, providing a clear direction for service optimization. Current scholarly efforts used to enhance public transportation services primarily focus on route design, schedule adjustments, fleet size, and station optimization. Current research in bus service optimization primarily focuses on route design, frequency adjustment, fleet size, and stop optimization. The key to studying these problems lies in constructing an objective function and defining constraints that align with the specific research objectives. Javier et al. [9] constructed a topological network for route optimization based on the bus and street networks of Utrecht and were able to better design bus routes for realistic situations. A heuristic memory algorithm is used to solve for variables such as fleet size and discrete frequencies to solve a bi-objective model that minimizes the average travel time of passengers and the fleet size of the operator. Liu et al. [10] implemented integrated optimization techniques involving schedules, bus groupings, and vehicle scheduling in a flexible public transport system using autonomous modular vehicles, considering the penalty cost each time vehicles were detached from and joined to a route, and the authors developed a comprehensive optimization model to minimize system costs. Cao et al. [4] considered the demand and characteristics of rail transit and feeder bus interchanges, optimized the routes and stops of the feeder bus network by developing a model to minimize the travel costs of passengers and operation costs of the company, and investigated the effect of the number of bus lines on the overall efficiency of the bus network using an enumeration method. Mishra et al. [11] optimized the headway and bus stop spacing for low-demand bus routes using a multi-objective evolutionary algorithm, NSGA-II, to minimize both operator and user costs. The solution shows that the optimal values of headway and bus stop spacing are underestimated if the optimization is done based on the assumptions that are typical for high-demand routes. Zhang et al. [12] established a multi-model electric bus scheduling model to collaboratively optimize vehicle travel plans and charging schemes by considering time-sharing tariffs and orderly charging strategies. The results can effectively reduce operating costs and charging costs and improve bus service levels. Several studies have shown that multiple short-distance bus lines have lower system costs than a single long-distance bus line. At the same time, pure electric vehicles, which have been widely commissioned in recent years, are also more suitable for operating on short-distance bus routes due to range limitations [13]. Therefore, a common research trend among scholars and bus operators involves gradually abandoning long-distance bus lines and developing short-distance bus lines [14,15,16]. However, there is a lack of research on feeder buses, which are typically short-distance bus lines. These feeder buses typically have a high turnover rate and rarely face issues related to insufficient capacity. Furthermore, the literature has given limited attention to the interchange discount between feeder buses and rail transit, which is a crucial factor for passengers and deserves further investigation.
Once the bus optimization model is built, it needs to be solved using various algorithms. The bus optimization problem is a complex vehicle routing problem (VRP), and machine learning algorithms and heuristic algorithms are generally used in the related literature. Suh and Jeong [17] restructured urban bus routes and planned their schedules using the Naïve Bayes classification method; the data can be cleaned according to the characteristics of each bus route. The developed route improvement prediction classifier can provide accurate route optimization advice. Noor et al. [18] used artificial neural network (ANN) and support vector machine (SVM) algorithms to predict the travel time, fuel consumption, and harmful emissions of different scenarios of university shuttle buses, and it was found that the ANN model predicted better than SVM. The robust performance of machine learning algorithms significantly enhances the accuracy of optimal solutions in optimization problems. However, these algorithms necessitate deep data mining and demand high-quality, voluminous datasets. Conversely, heuristic algorithms exhibit lower data requirements and can identify feasible solutions within acceptable margins, demonstrating considerable robustness. Numerous heuristic algorithms exist for optimization, each with distinct advantages and limitations. The current research trend involves integrating various algorithms to mitigate their individual shortcomings, thereby developing more efficient combinatorial algorithms. Ahern et al. [19] used a multi-objective simulated annealing algorithm to solve two variables (the bus route and departure frequency). The algorithm is divided into three phases—the first two phases are designed to solve the objectives of passengers and operators, and the last phase is a multi-objective search for a better compromise that satisfies both objectives in some regions, addressing the issue of the algorithm potentially falling into a local optimum. Zhong et al. [20] proposed an improved particle swarm algorithm to optimize the bus rapid transit route, which addresses the issue of the traditional particle swarm algorithm being prone to local optimums. The improvements include generating two populations in the initialization stage to enhance the optimization capability and avoid a single particle from falling into the local optimum. And combining the crossover operation in the genetic algorithm to exchange the positions of two selected particles to generate a new population. Aktaş et al. [21] proposed a variable neighborhood search (VNS) algorithm that finds high-quality scheduling solutions to optimize the performance of a single bus route during peak hours in a reasonable amount of time. The algorithm also allows for re-optimization of service types and departure times during operation based on real-time demand. Among the heuristic algorithms, the genetic algorithm is the most widely used [3,4,15,22]. Compared with the above algorithms, such as the particle swarm algorithm and simulated annealing algorithm, the genetic algorithm has distinct advantages in diversity preservation and global search ability, and it is not easy to be trapped in the local optimum. Moreover, by selecting appropriate encoding methods based on variable types, utilizing different operators can significantly improve both the speed and effectiveness of genetic algorithm optimization.
A few other papers have analyzed the competitive relationship between different transportation modes and feeder buses. Yang [23] studied the influence of 16 variables on the choice of using a microcirculation bus by using a multinomial logistic model. And he constructed a bilayer optimization model, where the lower layer was a model for calculating the probability of choosing a microcirculation bus to travel, thus reflecting the influence of shared bicycles. Liu et al. [24] dynamically calculated the actual travel demands of feeder buses based on the users’ choice behavior between shared bicycles and feeder buses, to understand the impact of shared bicycles on feeder bus operations, build a model to optimize the feeder bus route design and vehicle allocation, and solve it with a Lagrangian relaxation algorithm. Wei et al. [25] qualitatively and quantitatively analyzed the competition and cooperation between rail transit and surrounding bus lines based on geospatial considerations. A bus route optimization model was constructed based on the co-cooperation coefficient, which provides a new optimization method for bus route adjustments under the influence of the metro. In the literature, most studies on the competitive relationship between different modes of transportation begin by analyzing choice probabilities. However, fewer studies propose specific and effective methods to optimize feeder bus services to further enhance their advantages and competitiveness.
The remaining sections of this paper are organized as follows: Section 2 proposes a method of scoring the importance of bus stops, considering the influence of shared motorcycles to provide a reference for the stop selection of feeder buses. It also presents a multi-objective integrated optimization model with the objective of achieving the highest total score, the lowest travel cost, and operation costs. The model is also solved using a genetic algorithm with priority coding. In Section 3, the route, frequency of departures, and interchange discount of the feeder bus are optimized by using the Xingyao Road station in Kunming as an example. Section 4 presents a summary of the method proposed in this paper.
2. Model and Methodology
2.1. Problem Statement
Feeder buses are types of regular buses. They have at least one stop near rail transit stations, linking rail transit with residential areas, office buildings, hospitals, and other facilities to meet passengers’ transfer needs. Additionally, they possess all the characteristics of regular buses, such as operating on fixed routes and stops, having a flat fare, and adhering to a specified timetable.
There are several points of interest (POIs) in the study area, including residential communities, schools, commercial areas, and office buildings. Each POI has one gate or more gates for resident access, collectively denoted as set R. During a trip, a commuter starts at a particular gate and walks to the nearest parking point or bus stop, thus creating some correspondence. The set of parking points is denoted as P, forming a one-to-one relationship with the gate set R. Likewise, the set of bus stops is represented by S, and it forms a one-to-many relationship with the gate set R. This is attributed to the fact that several gates may share the same nearest bus stop. Knowing the correspondence between these three sets allows for the convenient calculation of ridership at each bus stop. Figure 1a illustrates the relationship between the three sets in the abstract, while Figure 1b provides a more intuitive demonstration of this correspondence based on actual neighborhoods.
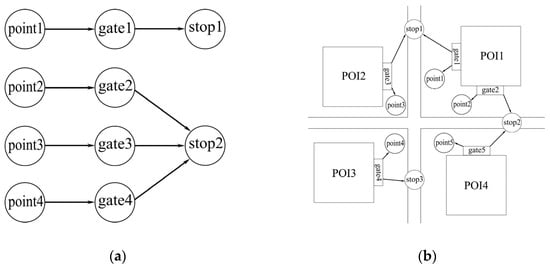
Figure 1.
Relationship between the three sets. (a) Abstract relationship. (b) Intuitive relationship.
This paper defines an undirected graph, where S denotes the set of vertices, i.e., alternative stops for feeder buses, and X denotes the set of edges, i.e., alternative routes for feeder buses. Based on the selected stops that are more suitable for feeder buses, the final optimization solution aims to minimize the travel costs and operating costs. In addition, the bus stops mentioned above are treated as standard bus stops providing basic services to passengers, excluding large bus stops with complex functions and situations where there are multiple platforms at a single stop.
To facilitate the study, we made certain assumptions about this problem. First, we consider that feeder buses operate over a short mileage, experience fewer delays at intersections, and are predictable to passengers. Thus, all buses are assumed to travel at an average speed [4,26], without considering any possible delays caused by intersection signals or traffic congestion [27]. Second, it is assumed that passengers will only travel to bus stops with the shortest walking distance to wait for buses [26]. Third, the arrival time of passengers at the bus stop is assumed to follow a random distribution in this model. Fourth, we only consider the interchange stop as the destination of passengers [26,27,28]. Thus, the OD (origin–destination) pairs between the remaining stops are not considered. Fifth, we assume that passengers arrive at the rail transit station and take the nearest train without waiting for an extra trip. Finally, this study was conducted during peak commuting hours, as the passenger flow is high and concentrated during these times. By default, no adjustments were made to the departure frequencies and transfer discounts during off-peak periods.
2.2. Notation Explanation
Table 1 introduces the notations involved in the problem.

Table 1.
General subscripts, sets, input parameters, and decision variables.
2.3. Model Development
The model developed in this paper is a multi-objective planning model. Firstly, the model considers the probability of choosing shared motorcycles in the study area, as well as the distinctive characteristics of bus stops. Subsequently, the model identifies feeder bus stops that can generate greater benefits for the overall system. The stops are selected by comprehensive scoring with multiple indicators, which will assist in optimizing the routes in a more purposeful way. Section 2.4 will provide a detailed description of the scoring process. The importance score of the feeder bus stops can be expressed in Equation (1), where = = 1 if = 1, and = = 0 if = 0.
Prior to determining the probability of selecting shared motorcycles, it is essential to first compute the travel costs associated with commuters who opt for shared motorcycles and those who choose feeder buses separately. The travel costs for feeder buses are expressed in Equation (2), and the travel costs for shared motorcycles are expressed in Equation (3).
where denotes the average walking time from gate r to the nearest bus stop; denotes the travel time of feeder bus line l on the shortest path between stops i and j; is the total stopping time when feeder bus line l travels to stop i; is the average waiting time of passengers for feeder bus l (passenger arrivals satisfy a random distribution); is the waiting time for the feeder bus and rail transit interchange; denotes the average walking time from gate r to the corresponding parking point; denotes the average riding time from parking point x to the interchange parking point; the waiting time for the rail transit of cycling passengers can be expressed as half of the interval between two adjacent trains, i.e., ; this paper defines a return time for shared motorcycles due to insufficient capacity of the parking point, i.e., . During the morning rush hour, the task of returning shared motorcycles to designated parking points becomes increasingly challenging. This difficulty arises primarily due to the substantial number of riders who transfer to rail transit during this period. Consequently, the time taken to return the motorcycles is longer than during off-peak hours [29]. For this paper, the scenarios of returning motorcycles can be classified into three categories:
where indicates the proportion of the above three scenarios in the total duration of the morning rush hours, respectively, and the remaining spaces ≤ 5 represent scene 2. Correspondingly, the return time is different for each type of scenario. When there are enough spaces left, the time for commuters to return to the shared motorcycles is ; when there are few spaces left, the time is ; when there are no spaces left, assume the riders choose the nearest parking point to return the motorcycles, and the time is , where denotes the distance to the nearest parking point. Thus, the average return time for shared motorcycles is calculated by Equation (4).
In addition, the model should consider the interests of both travelers and operators by balancing the travel costs for passengers and the operating costs for the bus company. This approach aims to determine an optimal, compromised solution. The net operating costs of the bus company can be expressed as follows:
The first half of this formula describes the direct operating costs of bus companies, while the second half describes the ticket revenue of bus companies. Since public transportation in China is typically considered a public good, the operating cost exceeds the profit. Thus, the above formula can also be used to describe the amount of loss incurred by bus companies.
To facilitate the optimization, this paper transforms the multi-objective planning problem into a single-objective optimization model using a weighted summation approach [30]. The model can be fully represented as follows:
subject to the following:
Coefficients , in objective (6) denote the weights of passenger travel costs and operation costs, respectively. Constraint (7) is a capacity constraint, where is the capacity of feeder bus line l; constraint (8) is the frequency constraint, and indicate the minimum allowed frequency of departure and the maximum frequency, both obtained from an actual experience; constraint (9) ensures that the interchange discount rate cannot equal 1, and the lowest can be 0, which implies that the interchange is free; constraint (10) ensures that the feeder bus must depart from the interchange stop for rail transit; constraint (11) ensures that path (i, j) is served by, at most, one bus route [4]; constraint (12) ensures that each stop has the same number of incoming and outgoing bus routes; constraint (13) is a typical Miller–Tucker–Zemlin (MTZ) constraint, which aims to eliminate possible subloops in the TSP problem; constraint (14) is the path length constraint, and denote the minimum and maximum lengths of the feeder bus route, respectively, and both are obtained from actual experiences and related to the service area; constraint (15) is a constraint on the number of feeder bus stops, and denote the minimum and maximum stop numbers for feeder buses, respectively, and both are obtained from actual experiences and related to the service area; constraint (16) is a decision variable constraint when path (i, j) is selected, = 1, otherwise, 0.
The above constructs an optimization model utilizing three decision variables: route, departure frequency, and interchange discount, to address the objective of minimizing the total system cost. Consequently, this paper hypothesizes that adjusting the departure frequency and providing transfer discounts can have a positive optimization effect on the objective function, and effectively reduce the total system cost.
2.4. Solution Method
2.4.1. Comprehensive Scoring of Stops
In this paper, our objective is to provide better guidance for determining the stops at which feeder buses should stop. To achieve this, we consider the trip characteristics of each stop and propose a comprehensive rating method for the alternative stops. The model evaluates bus stops using three indicators: ridership (), distance to the interchange stop (), and the probability of choosing buses (). Stops with higher scores on these indicators are more likely to be recommended for feeder buses. Ridership refers to the total number of passengers who transfer to rail transit using feeder buses and shared motorcycles, which can best reflect the importance of stops. The probability of choosing buses is determined by the travel costs of both modes of transport. This indicator can best reflect the influence of shared motorcycles on passenger preferences for buses. For instance, if the cost of a bus trip is significantly higher than that of a motorcycle trip at a certain stop, the probability of choosing feeder buses would be low, resulting in a low score. Consequently, such a stop may not be chosen for feeder buses. Additionally, since the average travel distance of buses is longer than that of motorcycles, stops that are located farther away from the interchange stop are more advantageous for feeder buses. Concerning this indicator, a higher score is assigned to stops that are situated at greater distances.
This paper examines the travel costs of feeder buses and shared motorcycles at each stop within the study area individually. Furthermore, it explores the preferences of passengers for these two travel modes. The probability of selecting each travel mode is determined by Equations (17) and (18) following the prediction generated by binomial logistic regression.
Both ridership and distance to the interchange stop can be obtained through field surveys. These three indicators have different degrees of importance in selecting stops for feeder buses and, thus, need to be assigned weights. In this paper, the study of indicators needs to consider both the preferences of practitioners and objectivity. Thus, we choose a combination of the analytic hierarchy process (AHP) and the entropy method to calculate the weights. After calculating the subjective and objective weights separately, we combine the weights of the indicators as .
—The weights obtained from the AHP.
—The weights obtained from the entropy method.
Once the indicators are assigned, they can be calculated by multiplying the weights with the data for each indicator and then normalizing the values to obtain the comprehensive scores of stops.
2.4.2. Genetic Algorithm
The decision variables in the above model include both discrete 0–1 variables, which are used to generate routes, and continuous variables, which are used to determine the optimal frequency of departures and interchange discounts. As a result, the present model can be classified as a mixed-integer nonlinear model, which is more complex than the standard VRP and is also recognized as NP-hard. Solving NP-hard problems is challenging, and the heuristic algorithm is appropriate for addressing large-scale VRP. It can obtain good feasible solutions and has a faster convergence speed. Therefore, this paper chooses the genetic algorithm as a heuristic approach to solve the proposed model.
In some literature addressing VRP using genetic algorithms, the paths (i.e., feasible solutions) are encoded as real numbers based on the node numbers [4]. However, in real road networks, some nodes may not have connections or the route between two nodes may need to pass through additional nodes. As a result, the decoding of the new chromosomes may not yield feasible routes. To address this issue, this paper proposes an indirect coding method known as the priority order [28].
In this encoding scheme, the chromosome represents a priority order rather than a specific path. The priority decreases from left to right in the chromosome. If the starting point of the path is specified, it is the first node in the path. The next node in the path is selected as the element with the highest priority among the set of points that can be directly connected to the previous node (i.e., no other nodes exist between them). This process continues until the length of the path reaches the maximum, or there are no more nodes that can be directly connected. If the starting point is not specified, the first node in the path is the first element according to the priority order. Thus, the final route must be available in the real road network. Before applying the priority order for encoding, it is important to obtain the connectivity graph of the road network. This graph represents the network’s structure, where each arc indicates the existence of a path between two nodes without the need to go through another node. Figure 2 depicts the chromosome-to-path decoding process using the genetic algorithm described in this paper.
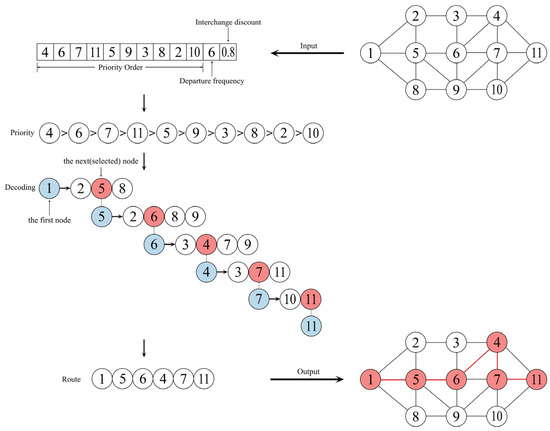
Figure 2.
The process of decoding a chromosome into a route.
In this paper, the size of the study area will determine whether one or more feeder bus routes should be planned. Once a chromosome satisfies the termination condition for decoding, the remaining unselected stops are treated as a new set, and another route is decoded starting from the first stop. This process can be repeated to obtain multiple routes.
In addition to generating routes, this paper also utilizes the genetic algorithm to determine the optimal frequency of departures and interchange discounts. These two parameters are continuous variables, and they are represented by the last two digits of the chromosome using real number coding. By optimizing these parameters along with the routes, a more convincing solution can be obtained.
The flow chart of solving the model is shown in Figure 3:
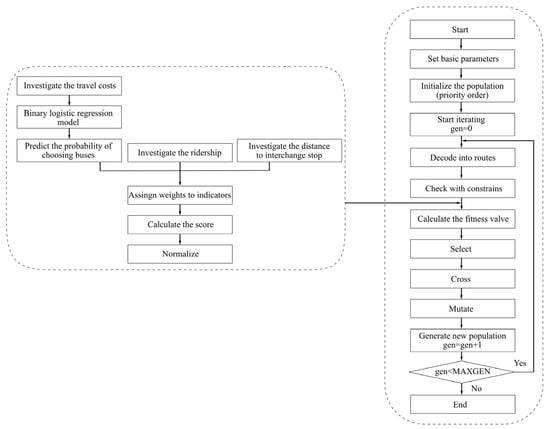
Figure 3.
Flowchart for solving the model in this paper.
3. Case Study
3.1. Basic Description
The preliminary investigation revealed that the Xingyao Road Metro Station has a high commuter flow, and there are both stable operating feeder buses and a substantial number of shared motorcycles near the entrances, highlighting a clear demand for feeder services. However, the feeder bus suffers from poor passenger flow, significantly impacted by the shared motorcycles. Thus, this paper selects the area around the Xingyao Road Station as the study area.
The specific location and scope of the study area are illustrated in Figure 4. The area is situated on the B exit side of the Xingyao Road station and encompasses 28 bus stops, 126 parking points for shared motorcycles, and one feeder bus line in regular operation. Figure 5 displays the route of the feeder bus K58 and the distribution of the 28 bus stops within the area.
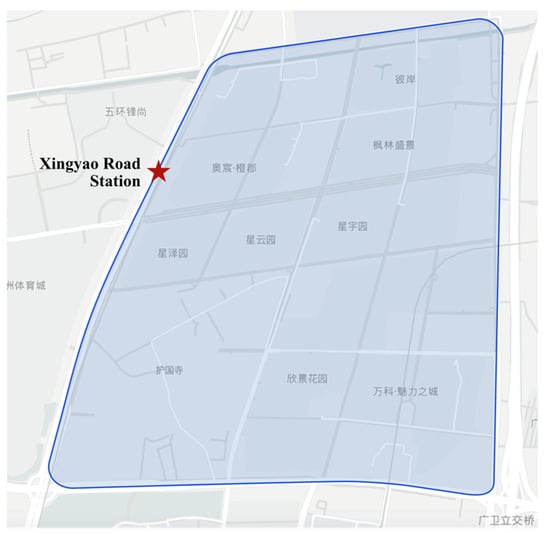
Figure 4.
The specific location of the study area.
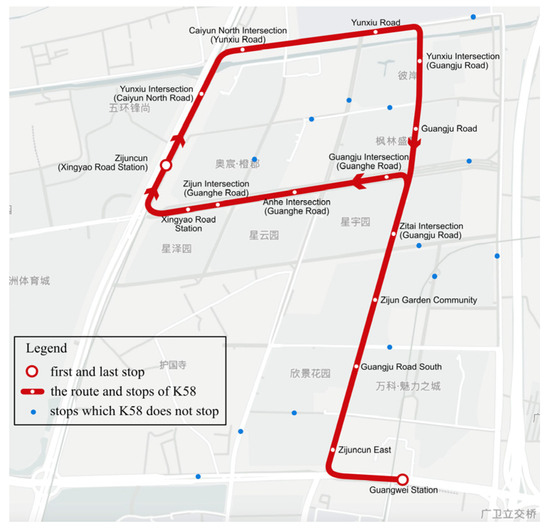
Figure 5.
Current operating bus route and stop layouts.
Based on the methodology presented in Section 2.4.2, we need to convert the real road network in the study area into a connectivity graph, with bus stops serving as network nodes. The resulting connectivity diagram is illustrated in Figure 6. The numbers in the network nodes represent the codes of the different bus stops.
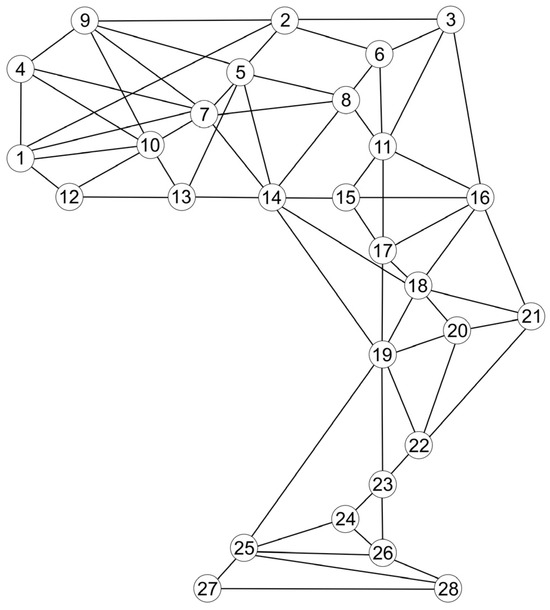
Figure 6.
Bus stop connectivity diagram in the study area.
There are over 30 points of interest in the study area, with a total of 106 gates. A preliminary survey found that some gates had low pedestrian activity. To reduce unnecessary workload, some of these gates were excluded from the study, resulting in a simplified research object of 57 gates. Further analysis revealed that bus stops 2, 3, 12, and 21 did not have corresponding gates with the shortest walking distances. Under the assumption that the public only walks to the nearest bus stop, these stops are deemed insignificant for the study and will be excluded in subsequent analyses.
3.2. Indicator Values
Since the morning peak on weekdays represents the week with the highest concentration of travel demand, this study focuses on investigating the study area during the morning peak hours (7:00 a.m.–9:00 a.m.) [29] from 13 March to 17 March 2023.
Xingyao Road Station is one station along Kunming Metro Line 1. During the morning peak, trains depart from this station in 5-min intervals. Zijuncun (Caiyun North Road) is a bus stop that is situated near Exit B of Xingyao Road Station. This stop serves as both the starting and ending point for bus line K58. The departure interval for K58 during the morning peak is usually between 8 and 18 min, and the total travel time is approximately 15 min.
Under the assumptions in Section 2, the values of some indicators and variables in this paper are presented in Table 2. Since public transportation in China is characterized by a strong public welfare nature, the objective function of this paper prioritizes reducing passengers’ travel costs, so = 0.8 and = 0.2. Regarding the decision variables, since the departure interval of the subway is 5 min, this paper matches the departure time of the feeder bus with the arrival time of the subway in order to enhance the connection between the feeder bus and the subway. Thus, the departure interval of the feeder bus is a multiple of 5, and denotes the values of 3, 4, 6, and 12 per hour. denotes the values of 0, 0.2, 0.4, 0.6, and 0.8.

Table 2.
The values of some indicators and variables in the models.
The distance traveled from each bus stop to the Zijuncun (Caiyun North Road) stop is readily available on the map as an indicator in the stop scoring. This paper investigates passenger flow in two parts. Firstly, the passenger flow of the current stops of the feeder bus is examined, which represents the direct ridership of the stop and is obtained through a follow-up survey. Secondly, the passenger flow of motorcycles is considered, which represents the potential passenger flow of the stop, and some residents may shift their travel mode when the cost of the feeder bus decreases. We initially utilized real-time data from the applications of three shared motorcycle operators: Hello Bike, Meituan, and Qingju, to quantify the total number of individuals who ride shared motorcycles to Xingyao Road Station. By comparing the vehicle counts at each stop before and after the peak period, we are able to ascertain the number of trips made at each stop during peak hours. Finally, the total number of people is then allocated based on the proportion of trips to determine the number of people who transfer to rail transit via motorcycles at each bus stop.
According to the models for the travel costs of feeder buses and shared motorcycles, established in Section 2, as well as the index values mentioned earlier, the travel costs for each travel mode at each bus stop can be calculated. This paper then uses the costs of the two travel modes as independent variables and the probability of passengers choosing feeder buses as the dependent variable in a binary logistic regression analysis. In this regression, the dependent variable y can only take two values, 0 and 1. A value of y = 1 indicates that passengers choose feeder buses, while a value of y = 0 indicates that passengers choose shared motorcycles. The regression model obtained is shown below, with representing the travel cost of feeder buses and representing the travel cost of shared motorcycles. By substituting the corresponding values of and for each bus stop in the regression model, the corresponding probabilities of choosing buses are obtained.
After completing the survey of bus stops, including three indicators of ridership, namely, (), distance to interchange stop (), and the probability of choosing buses (), the information on alternative stops is obtained as shown in Table 3.

Table 3.
Information on the three indicators for alternative stops.
In this paper, we utilize a hybrid methodology consisting of AHP and the entropy method to assign weights to the indicators discussed above. To ensure the scientific and rational nature of the weights derived from the AHP, a group of ten experts specializing in transportation planning have rated the indicators presented in this paper. Table 4 displays the output of the calculations, which were performed using the AHP, the x the combined subjective and objective assignment approach. After determining the weights for each indicator, we compute the overall score for each stop. By normalizing the computed results, we obtain the final scores for each stop, as shown in Table 5.

Table 4.
Weights of the three indicators.

Table 5.
Final scores for each bus stop.
3.3. Results
According to the flowchart presented in Section 2, the parameters for the genetic algorithm used to solve the model are set as follows: The population size is set to 100 individuals, the maximum number of iterations is set to 200, the generation gap is set to 0.9, the crossover probability is set to 0.9, and the mutation probability is 0.1.
The genetic algorithm is iterated in the order shown in Figure 3. Figure 7 shows the change of the objective function value. The results show that stability is achieved after approximately 60 iterations.
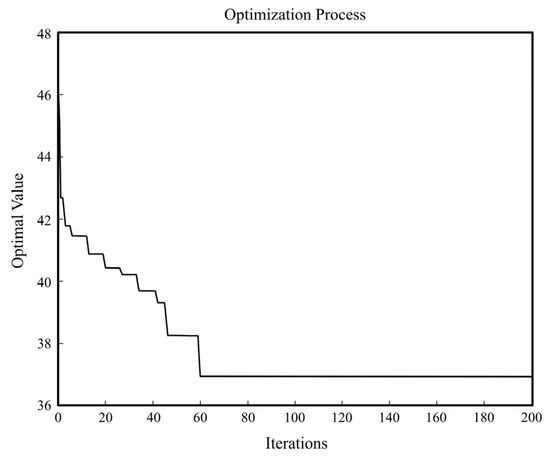
Figure 7.
Iterative process for optimal values.
After optimization, there is only one linear feeder bus line in the study area, with 12 stops. The route follows the sequence of 1-10-13-14-15-17-19-22-23-26-25-24, starting from the rail transit interchange stop. Figure 8 provides a visual comparison of the route before and after the optimization. From the comparison, it is evident that the optimized route covers a larger area that is further away from the interchange stop and has a higher total travel volume, albeit with a slight detour. In some of the areas originally covered, it was more convenient for commuters to choose shared motorcycles, and the advantage of feeder buses was not as great, so they were optimized and no longer covered.
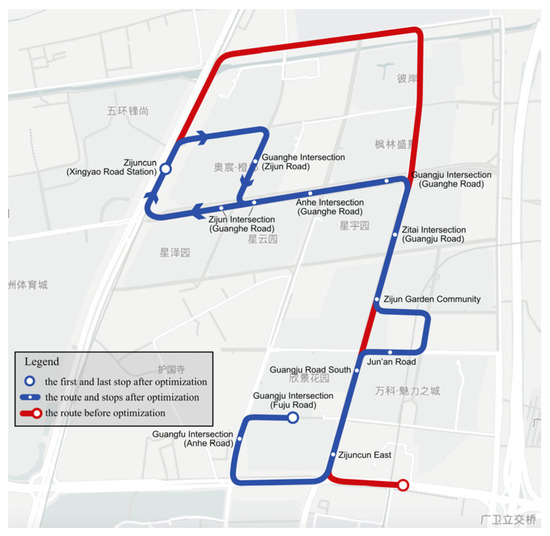
Figure 8.
Optimization results for routes and stops.
Depending on the values of the two decision variables, and , there are 20 different combination options for each route. The morning peak time studied in this paper is 2 h, so the value of is doubled. Table 6 shows the objective values of the 20 combinations under the optimal route, where the optimal results can be obtained when = 12 and = 0.6. In addition, Figure 9a illustrates the trend of changes in objective values resulting from different discount rates, while keeping the frequency of departures constant. It can be found that when = 24, the higher the interchange discount, the higher the overall cost. However, there reaches a point where the reduction in passenger costs can no longer compensate for the operational cost of the enterprise, and the enterprise faces difficulties in operation.; when = 6, the lower the interchange discount, the higher the overall cost, at which time the passenger cost is high; when = 6 or 8, the overall cost shows a trend of first falling and then rising, and the interchange discount does not consistently favor any specific direction. Figure 9b shows the impact of different frequencies on the change in objective value while keeping the interchange discount constant. It can be found that when the frequency is reduced, the total cost always shows a trend of decreasing first and then increasing, and the lowest cost point occurs at = 12 or 8, which further indicates that too high or too low of a frequency is not a better choice for the whole. The whole running time of the optimized feeder bus is about 18 min, so the matching departure and arrival moments of the feeder bus are calculated based on the arrival moments of the rail transit as shown in Table 7 [27].

Table 6.
Objective values for different frequency and interchange discount combination schemes under the optimal route.
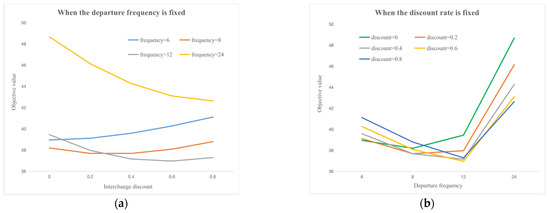
Figure 9.
Trends in objective values due to a certain variable when the other variable is fixed. (a) When the frequency of departures is fixed. (b) When the interchange discount is fixed.

Table 7.
Optimized arrival timetable for feeder buses.
The optimized feeder bus solution has led to an increase in travel costs at certain stops, due to the elimination of some stops and the increase in detour times. However, overall, the solution has proven to be beneficial. The introduction of more accurate departure times and departure intervals has helped to minimize commute times for most residents in the study area. Additionally, the incorporation of interchange discounts and the adjustment of stops have further reduced travel costs. As a result, the probability of commuters choosing feeder buses has increased significantly. In terms of financial impact, the total cost of travel for all gates has decreased from CNY 687.94 to CNY 591.50, representing a notable decrease of 14.02%. Furthermore, the number of predicted bus trips has increased from 132 to 243, marking a substantial increase of 84.09%.
In order to further verify the positive effect of the interchange discount on integrated optimization, this study conducted an analysis where the decision variable of the interchange discount was removed. Figure 10 depicts the results of this analysis, presenting the iterative values of the objective function. The optimized route for the feeder bus without the interchange discount is as follows: 1-10-13-14-15-17-19-23-24-25-27-28, with a total of 11 stops, and the specific route is illustrated in Figure 11. Upon examining the objective value, it can be observed that the optimal result after removing the interchange discount is 40.3724. This value represents a 9.26% increase compared to the result obtained through integrated optimization. Moreover, the total travel cost amounts to CNY 608.80, indicating a 2.92% increase. Additionally, the number of predicted bus trips reduces to 216, marking a decrease of 11.11%. Although including the interchange discount may elevate the operating costs for the bus company, incorporating this variable proves to be beneficial for the feeder bus system when considering the overall perspective.
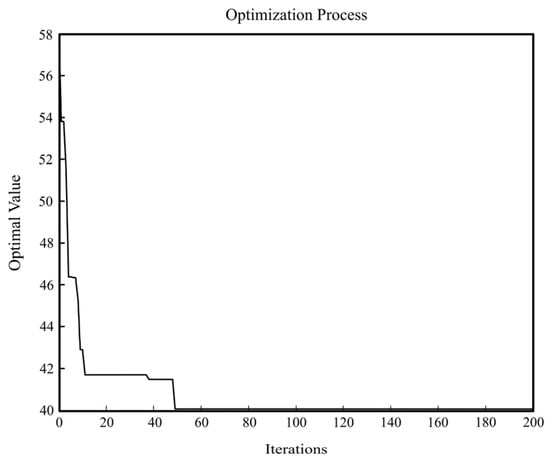
Figure 10.
Iterative process for optimal values without the interchange discount.
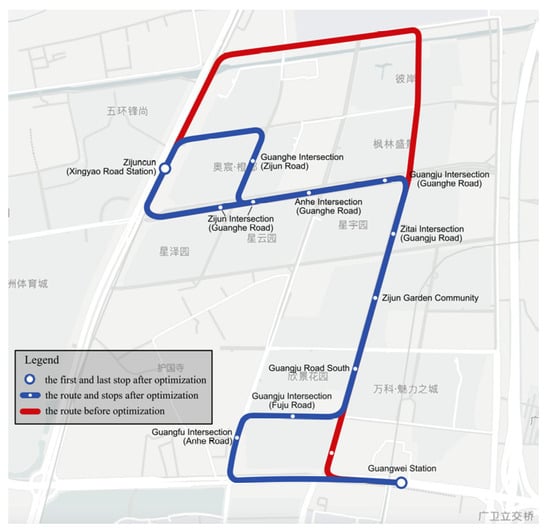
Figure 11.
Optimization results for routes and stops without interchange discounts.
4. Conclusions
This paper proposes an integrated optimization model for determining the optimal routes and frequencies of feeder buses under the influence of shared motorcycles. The model assigns a score to each bus stop and aims to select stops with the highest total score. The objective is to minimize travel costs and operating costs of feeder buses, which reflects the game theory relationship between social and enterprise interests. The model incorporates three decision variables, allowing for simultaneous optimization of the bus route, the frequency of departures, and interchange discounts.
The consideration of the impact of shared motorcycles in this paper is mainly reflected in the scoring of bus stops. Shared motorcycles face drawbacks such as extended return times, slow speeds, and limited travel distances during high-demand periods. Considering these characteristics, this study constructs a model to calculate the travel cost of shared motorcycles and predict the selection probability of both shared motorcycles and feeder buses. This is done using a binomial logistic regression model. By scoring alternative bus stops based on three indicators—ridership, distance to the interchange stop, and the probability of choosing buses—the most suitable stops for feeder buses can be determined.
Finally, this paper addresses the above model by employing a genetic algorithm that utilizes priority order coding. This approach guarantees that the routes generated by the algorithm are feasible in the actual road network. Furthermore, it can generate different numbers of feeder bus routes according to the scale of the study area. The findings of this research are summarized as follows:
- A well-coordinated connection between feeder buses and rail transit, along with a suitable interchange discount, has been proven to considerably reduce the expenses of bus travel and encourage residents to opt for buses as their preferred mode of transportation. In the context of this study, the cost of bus travel is projected to reduce by 14.02%, and it is anticipated that the number of individuals opting for bus travel will increase by 84.09%. This advantage is currently difficult to achieve for shared motorcycles, making the smooth transfer between feeder buses and rail transit a critical factor in providing feeder buses with a competitive advantage over shared motorcycles.
- Increasing the frequency of departures and offering an interchange discount may lead to higher operating costs for the bus company. The benefits of these optimization measures include attracting more residents to choose feeder buses and increasing the operating revenue, thereby enabling bus companies to break free from the vicious cycle of declining ridership.
- The method proposed in this paper for comprehensively scoring stops based on three indicators can lead to better driving routes and stops for feeder buses under the influence of shared motorcycles. On the one hand, it reduces the coverage of feeder buses in areas closer to rail transit stations and reduces competition at stops where shared motorcycles have obvious advantages; on the other hand, it strengthens the coverage of areas with higher travel volume and further from rail transit stations, which can attract hidden passenger traffic.
In future work, we will consider refining the interchange between buses and other modes of transport, exploring the key factors that may affect the level of bus service or passengers’ travel choices in the interchange. Additionally, we will evaluate the current state of bus transfer services. Beyond the traffic flow and location characteristics of bus stations, numerous other aspects warrant a thorough investigation, such as the type of bus station and its facilities, major hubs with transfer and distribution functions, and the comfort level of bus stop facilities, all of which may influence passenger preferences for buses. This paper optimizes and adjusts the routes and stops of feeder buses in the case study, but this may inadvertently reduce the overall accessibility of the study area. Therefore, in subsequent research, we will incorporate accessibility as an objective in our models to ensure regional bus accessibility while enhancing bus efficiency. Finally, by segmenting the speeds of different stages in the bus operation process and accounting for varying degrees of delays, we aim to improve the study’s relevance and validate the fault tolerance of the optimization results.
Author Contributions
Conceptualization, J.C. and Z.L.; methodology, J.C.; software, Z.L.; validation, J.C. and S.L.; formal analysis, Z.L.; investigation, Z.L.; resources, J.C. and S.L.; data curation, Z.L.; writing—original draft preparation, J.C. and Z.L.; writing—review and editing, J.C., Z.L. and S.L.; visualization, Z.L.; supervision, J.C. and S.L; project administration, J.C. and S.L; funding acquisition, J.C. and S.L. All authors have read and agreed to the published version of the manuscript.
Funding
This research was funded by the Technical Service Project of Kunming University of Science and Technology, grant number KKF0202202392, Yunnan Fundamental Research Project, grant number 202401AT070347, Yunnan Fundamental Research Project, grant number 202301AU070186, and Yunnan Xing Dian Talents Plan young, China, grant number KKRD202202112.
Data Availability Statement
Data are contained within the article.
Conflicts of Interest
The authors declare that there are no potential conflicts of interest in this paper.
References
- Bar-Yosef, A.; Martens, K.; Benenson, I. A model of the vicious cycle of a bus line. Transp. Res. Part B Methodol. 2013, 54, 37–50. [Google Scholar] [CrossRef]
- Capali, B.; Ceylan, H. A multi-objective meta-heuristic approach for the transit network design and frequency setting problem. Transp. Plan. Techn. 2020, 43, 851–867. [Google Scholar] [CrossRef]
- Arbex, R.O.; Cunha, C.B. Efficient transit network design and frequencies setting multi-objective optimization by alternating objective genetic algorithm. Transp. Res. Part B Methodol. 2015, 81, 355–376. [Google Scholar] [CrossRef]
- Cao, Y.; Jiang, D.; Wang, S. Optimization for Feeder Bus Route Model Design with Station Transfer. Sustainability 2022, 14, 2780. [Google Scholar] [CrossRef]
- Yaroslav, K.; Erik, J.; Oded, C.; Niels, O.; Niek, M.; Matej, C.; Alex, V. Public transport fare elasticities from smartcard data: Evidence from a natural experiment. Transp. Policy 2021, 105, 35–43. [Google Scholar]
- Han, Y.; Li, W.; Wei, S.; Zhang, T. Research on Passenger’s Travel Mode Choice Behavior Waiting at Bus Station Based on SEM-Logit Integration Model. Sustainability 2018, 10, 1996. [Google Scholar] [CrossRef]
- Arasan, V.T.; Vedagiri, P. Modelling Modal Shift from Personal Vehicles to Bus on Introduction of Bus Priority Measure. Asian Transport. Stud. 2011, 1, 288–302. [Google Scholar]
- Nikel, C.; Eldeeb, G.; Mohamed, M. Perceived Quality of Bus Transit Services: A Route-Level Analysis. Transp. Res. Rec. 2020, 2674, 79–91. [Google Scholar] [CrossRef]
- Javier, D.; Marcel, N.K.V.; Pieter, V. Designing bus line plans for realistic cases—The Utrecht case study. Expert Syst. Appl. 2022, 187, 115918. [Google Scholar]
- Liu, Z.; de Almeida Correia Gonçalo, H.; Ma, Z.; Li, S.; Ma, X. Integrated optimization of timetable, bus formation, and vehicle scheduling in autonomous modular public transport systems. Transp. Res. Part C Emerg. Technol. 2023, 155, 104306. [Google Scholar] [CrossRef]
- Mishra, S.; Mehran, B.; Sahu, P.K. Optimization of headway and bus stop spacing for low demand bus routes. Transport. Plan. Technol. 2023, 46, 1024–1049. [Google Scholar] [CrossRef]
- Zhang, M.; Yang, M.; Li, Y.; Chen, J.; Lei, D. Optimal Electric Bus Scheduling with Multiple Vehicle Types Considering Bus Crowding Degree. J. Transp. Eng. A Syst. 2023, 149, 04022138. [Google Scholar] [CrossRef]
- Wang, Y.; Lu, C.; Bi, J.; Sai, Q.; Zhang, Y. Ensemble machine learning based driving range estimation for real-world electric city buses by considering battery degradation levels. IET Intell. Transp. Syst. 2021, 15, 824–836. [Google Scholar] [CrossRef]
- Moon, S.; Cho, S.-H.; Kim, D.-K. Designing Multiple Short-Turn Routes to Mitigate the Crowding on a Bus Network. Transp. Res. Rec. 2021, 2675, 23–33. [Google Scholar] [CrossRef]
- Zhang, S.; Jia, S.; Bai, Y.; Mao, B.; Ma, C.; Zhang, T. Optimal Adjustment Schemes on the Long Through-Type Bus Lines considering the Urban Rail Transit Network. Discrete Dyn. Nat. Soc. 2018, 2018, 8029137. [Google Scholar] [CrossRef]
- Hugo, B.; Erik, J. Design and operation of feeder systems in the era of automated and electric buses. Transp. Res. Part A Policy Pract. 2021, 152, 146–172. [Google Scholar]
- Suh, M.-h.; Jeong, M. Development of Bus Routes Reorganization Support Software Using the Naïve Bayes Classification Method. Sustainability 2022, 14, 4400. [Google Scholar] [CrossRef]
- Noor, R.M.; Rasyidi, N.B.G.; Nandy, T.; Kolandaisamy, R. Campus Shuttle Bus Route Optimization Using Machine Learning Predictive Analysis: A Case Study. Sustainability 2020, 13, 225. [Google Scholar] [CrossRef]
- Ahern, Z.; Paz, A.; Corry, P. Approximate multi-objective optimization for integrated bus route design and service frequency setting. Transp. Res. Part B Methodol. 2022, 155, 1–25. [Google Scholar] [CrossRef]
- Zhong, S.; Zhou, L.; Ma, S.; Yao, B. The optimization of bus rapid transit route based on an improved particle swarm optimization. Transp. Lett. 2018, 10, 257–268. [Google Scholar] [CrossRef]
- Aktaş, D.; Sörensen, K.; Vansteenwegen, P. A variable neighborhood search algorithm for a public bus line with a demand-responsive operation during peak hours. Transp. Plan. Techn. 2023, 46, 615–652. [Google Scholar] [CrossRef]
- Zhao, L.; Chien, S.I.; Spasovic, L.N.; Liu, X. Modeling and optimizing urban bus transit considering headway variation for cost and service reliability analysis. Transp. Plan. Techn. 2018, 41, 706–723. [Google Scholar] [CrossRef]
- Yang, X. Research on Optimization of Microcirculation Bus Route Considering the Influence of Shared Bicycles. Master’s Thesis, Beijing Jiaotong University, Beijing, China, 2021. [Google Scholar]
- Liu, L.; Liu, Z.; Ma, C.; Tan, E.; Ma, X. Feeder Bus Route Design and Vehicle Allocation Under Influence of Shared Bikes. J. Transp. Syst. Eng. Inf. Technol. 2023, 23, 165–175. [Google Scholar]
- Wei, J.; Long, K.; Gu, J.; Zhu, P. Optimizing Bus Line Based on Metro-Bus Integration. Sustainability 2020, 12, 1493. [Google Scholar] [CrossRef]
- Quadrifoglio, L.; Li, X. A methodology to derive the critical demand density for designing and operating feeder transit services. Transp. Res. Part B Methodol. 2009, 43, 922–935. [Google Scholar] [CrossRef]
- Hou, Y.; Yang, M.; Wang, L.; Zhang, M.; Lei, D. Static and Dynamic Scheduling Method of Demand-Responsive Feeder Transit for High-Speed Railway Hub Area. J. Transp. Eng. A Syst. 2023, 149, 04023113. [Google Scholar] [CrossRef]
- Xiong, J.; Huang, T.; Xu, Y.; Li, T.; Peng, F. Optimal Network Design of Battery-Powered Electric Feeder Bus with Determination of Fleet Size and Number of Chargers. J. Transp. Eng. A Syst. 2022, 148, 04021097. [Google Scholar] [CrossRef]
- Zhan, Z.; Guo, Y.; Noland, R.B.; He, S.Y.; Wang, Y. Analysis of links between dockless bikeshare and metro trips in Beijing. Transp. Res. Part A Policy Pract. 2023, 175, 103784. [Google Scholar] [CrossRef]
- Leiva, C.; Muñoz, J.C.; Giesen, R.; Larrain, H. Design of limited-stop services for an urban bus corridor with capacity constraints. Transp. Res. Part B Methodol. 2010, 44, 1186–1201. [Google Scholar] [CrossRef]
- Yang, J. The Research on the Public Transport Fare Based on the Value of Time Survey. Master’s Thesis, Huazhong University of Science and Technology, Wuhan, China, 2009. [Google Scholar]
Disclaimer/Publisher’s Note: The statements, opinions and data contained in all publications are solely those of the individual author(s) and contributor(s) and not of MDPI and/or the editor(s). MDPI and/or the editor(s) disclaim responsibility for any injury to people or property resulting from any ideas, methods, instructions or products referred to in the content. |
© 2024 by the authors. Licensee MDPI, Basel, Switzerland. This article is an open access article distributed under the terms and conditions of the Creative Commons Attribution (CC BY) license (https://creativecommons.org/licenses/by/4.0/).