Article

Spatial–Temporal Differentiation and Influencing Factors of Rural Education Development in China: A Systems Perspective

School of Public Policy and Management, Guangxi University, Nanning 530004, China
*
Author to whom correspondence should be addressed.
Systems 2024, 12(12), 517; https://doi.org/10.3390/systems12120517
Submission received: 16 October 2024 / Revised: 15 November 2024 / Accepted: 20 November 2024 / Published: 25 November 2024
(This article belongs to the Section Systems Practice in Social Science)

Abstract

:
Education is the cornerstone of rural revitalization. This study aims to comprehensively evaluate the development of rural education in China from 2006 to 2020. From a systemic perspective, this study established a multidimensional evaluation index system for rural education and used the weight-TOPSIS method for measurement. Additionally, geographic information system and spatial econometric methods were employed to explore spatial–temporal differentiation and influencing factors. The results show that (1) rural education levels in China have generally improved in recent years, with higher development in northern, northeastern, and eastern regions and lower levels in central and southwestern regions. (2) In terms of spatial differentiation, rural education development among provinces has significant spatial agglomeration. The provinces around Beijing are hot spots, while remote southwestern provinces are cold spots. (3) Regarding dynamic evolution, the disparity in rural education development among provinces has widened, with a few provinces significantly ahead. There are club convergence features, and the hierarchy of rural education development between provinces is relatively stable, with less likelihood of lagging provinces catching up. (4) Economy, finance, industry, population, and urbanization are key factors influencing rural education, with spatial spillover effects on neighboring provinces. The study provides empirical support and policy insights for advancing balanced and high-quality rural education development.

1. Introduction

Education in developing countries is a classic and widely discussed topic, reflecting a nation’s civil rights and social equality. Rural education, in particular, has received significant attention, as it is closely linked to the health [1], poverty [2], and livelihoods of people at the bottom of society [3]. However, as a developing country with a large population, China is often criticized for its lagging and imbalanced development of rural education [4,5]. This issue is especially prevalent in rural areas of underdeveloped provinces, where challenges such as outdated teaching facilities, inadequate teacher resources, and high rates of student dropout persist [6]. As of 2022, China’s rural population still amounts to 491 million people who aspire to attain better quality and fair education. Therefore, it is important to pay attention to the spatial differentiation and dynamic evolution of rural education. This is essential for understanding rural development and promoting social equity in China.
In fact, at the beginning of this century, the Chinese government gradually emphasized the development of rural education and took a series of actions. From 2000 to 2020, government spending on education increased from CNY 384.90 billion to CNY 5303.39 billion, accounting for 4.2% of the total GDP. In particular, investment in rural education is growing rapidly, the financial investment per pupil in rural primary schools increasing from CNY 647.01 to CNY 13,152.80. Furthermore, the government has enacted several policies to bolster rural education, including school consolidation initiatives, free compulsory education, student nutrition subsidies, and education poverty alleviation programs. These efforts have been widely acknowledged for their success in optimizing rural education resources, alleviating the financial burden on farmers for education, and enhancing educational opportunities for children [7]. However, some scholars remain concerned about the development of education in rural China. Yang and Yuan [8] argue that despite improvements in rural education conditions, there are still shortcomings in key areas such as teacher quality, digital facilities, and teaching standards. Similarly, Ju et al. [9] found that while rural education has progressed in developed regions, the issue of lagging rural education in less developed regions is escalating. It is evident that the research on the development of rural education in China is still subject to some controversy and that a more in-depth analysis is required.
In recent years, the Chinese government has proposed the strategy of rural revitalization and common prosperity, which has led to a growing focus on rural education. On the one hand, grassroots farmers are increasingly concerned with their right to education but are trapped by the reality of rural education [10]. They expect the government to increase its efforts in rural education to ensure more equitable and high-quality educational opportunities. On the other hand, policymakers regard education as an important part of rural revitalization, but the effectiveness of traditional rural education governance strategies is becoming increasingly limited [11]. Consequently, they are exploring more efficient rural education development measures to meet the growing educational needs of farmers. In this context, it is even more important to conduct a comprehensive and objective evaluation of the current development of rural education in China. This is conducive to the formation of a consensus on the development of rural education and can also provide strong support for government policy formulation.
Therefore, the main purpose of this study is to provide a systematic understanding of the level of development of rural education in China. Specifically, the problems can be summarized in the following three aspects: (1) What is the overall level of rural education development in China? (2) What spatial differentiation and evolutionary characteristics are presented? (3) What factors have influenced the development of rural education in China? Based on this, we established a multi-dimensional evaluation index system according to the viewpoint of system theory and used the entropy weight-TOPSIS method to scientifically measure the development level of rural education. Moreover, the geographic information system (GIS) is used to intuitively display the spatial differentiation laws and dynamic evolution trends of rural education development. Finally, spatial econometric methods were used to further investigate the factors influencing rural educational development.
The remainder of the paper is structured as follows. Section 2 presents a literature review. Section 3 describes the study area, the data sources, the index system, and the research methodology. Section 4 analyzes and discusses the measurement results. Section 5 further explores the influencing factors. Section 6 provides conclusions and policy implications.

2. Literature Review

Rural education has long been a classic and important topic [12], and scholars from different fields have conducted extensive research. Among them, the level of rural education development is a crucial research area, with the existing literature quantitatively analyzed and discussed from various perspectives. They mainly focus on the following aspects.
First, measuring and evaluating the level of rural education development. Around the world, especially in developing countries, rural education is regarded as the weak link in the national education system [13,14]. Therefore, scholars have paid much attention to monitoring the level of development of rural education in order to provide an empirical basis for its optimization and support policies. These studies can be summarized in two aspects: On the one hand, direct evaluation is carried out through certain specific indicators. For example, Fan et al. [15] and Zhang et al. [16] conducted analyses from the dimensions of funding and teachers, respectively, confirming the lagging development of rural education in China. On the other hand, they rely on professional assessment methods for analysis. For example, Li et al. [17] and Wen and Xue [18] used the DEA method to evaluate the efficiency of resource allocation in basic education in China and identified the deficiencies and imbalances in rural education development.
Second, exploring the temporal and spatial characteristics of rural education development. The spatial imbalance in rural education development is frequently criticized [19], with many scholars engaging in targeted discussions on the issue. Among them, most studies are based on traditional measurement methods. For instance, Meng and Xie [20] calculated the Gini coefficient of rural education funding in China and found significant disparities in rural education development across provinces. Based on the results of Theil index calculations, Chen and Zhao [21] contend that rural education resources in underdeveloped areas suffer from inadequate investment. In recent years, several studies have used advanced methods to explore this issue, but they have mostly focused on specific areas or single aspects. For example, Liu and Liu [22] used a multi-factor spatiotemporal equilibrium model to analyze the layout of rural educational facilities in China. Delprato et al. [23] used mapping, spatial correlation statistics, and spatial regression models to expose the spatial inequality and spillover effects of education in Africa.
Third, analyzing the factors that influence rural education development. Currently, there are few systematic studies on the factors influencing rural education, with most research focusing on the analysis of individual factors. For example, Zhang [24] empirically tested the impact of urbanization process on rural education development and found that it has a significant negative impact. Sun et al. [25] explored the impact of financial investment on the quality of rural education and confirmed that it can significantly improve the level of rural primary schools. In addition, some individual studies have analyzed the impact of factors such as economic, social, and cultural influences, but these were primarily based on traditional econometric models or qualitative analysis [26,27].
In summary, although previous research has provided a relatively objective description and analysis of rural education development in China, there are still some limitations. Firstly, there is a lack of comprehensive evaluation of the development of rural education in China. Rural education is a complex system, but most studies use a single indicator to measure it, which does not reflect its overall level of development [28]. More importantly, key indicators such as education quality and outcomes are often overlooked, hindering an accurate assessment of rural education development. Secondly, the research methods are traditional and limited. Most existing studies on the spatial balance of rural education development use the Gini coefficient or the Theil index [29,30]. However, these methods can only reflect whether there is spatial balance or not and cannot reveal the underlying laws and characteristics of spatial differentiation of rural education. Furthermore, there is insufficient discussion on the factors affecting rural education development. In examining the driving factors behind the spatial–temporal patterns of rural education development, few studies have considered the spatial correlations among these factors [31,32].
This study can extend the literature on the development of rural education in China in several ways. Firstly, a comprehensive evaluation framework for rural education development was established, integrating previously fragmented and overlooked indicators into a unified system. Compared to previous studies based on single indicators, this paper provides a more holistic and scientific perspective for exploring China’s rural education. Secondly, we present the spatial–temporal differentiation and evolutionary trends of rural education development in China. Using interdisciplinary research methods, we observed characteristics such as the hot–cold distribution pattern and club convergence, which have not been addressed in previous studies. In addition, we applied the spatial Durbin model to analyze the direct and indirect effects of various influencing factors and explained the potential reasons behind these effects. Unlike most studies that focus on a single indicator or direct impact, this study examines the influence of multiple factors and their spatial spillover effects, offering more empirical evidence for optimizing rural education development.

3. Materials and Methods

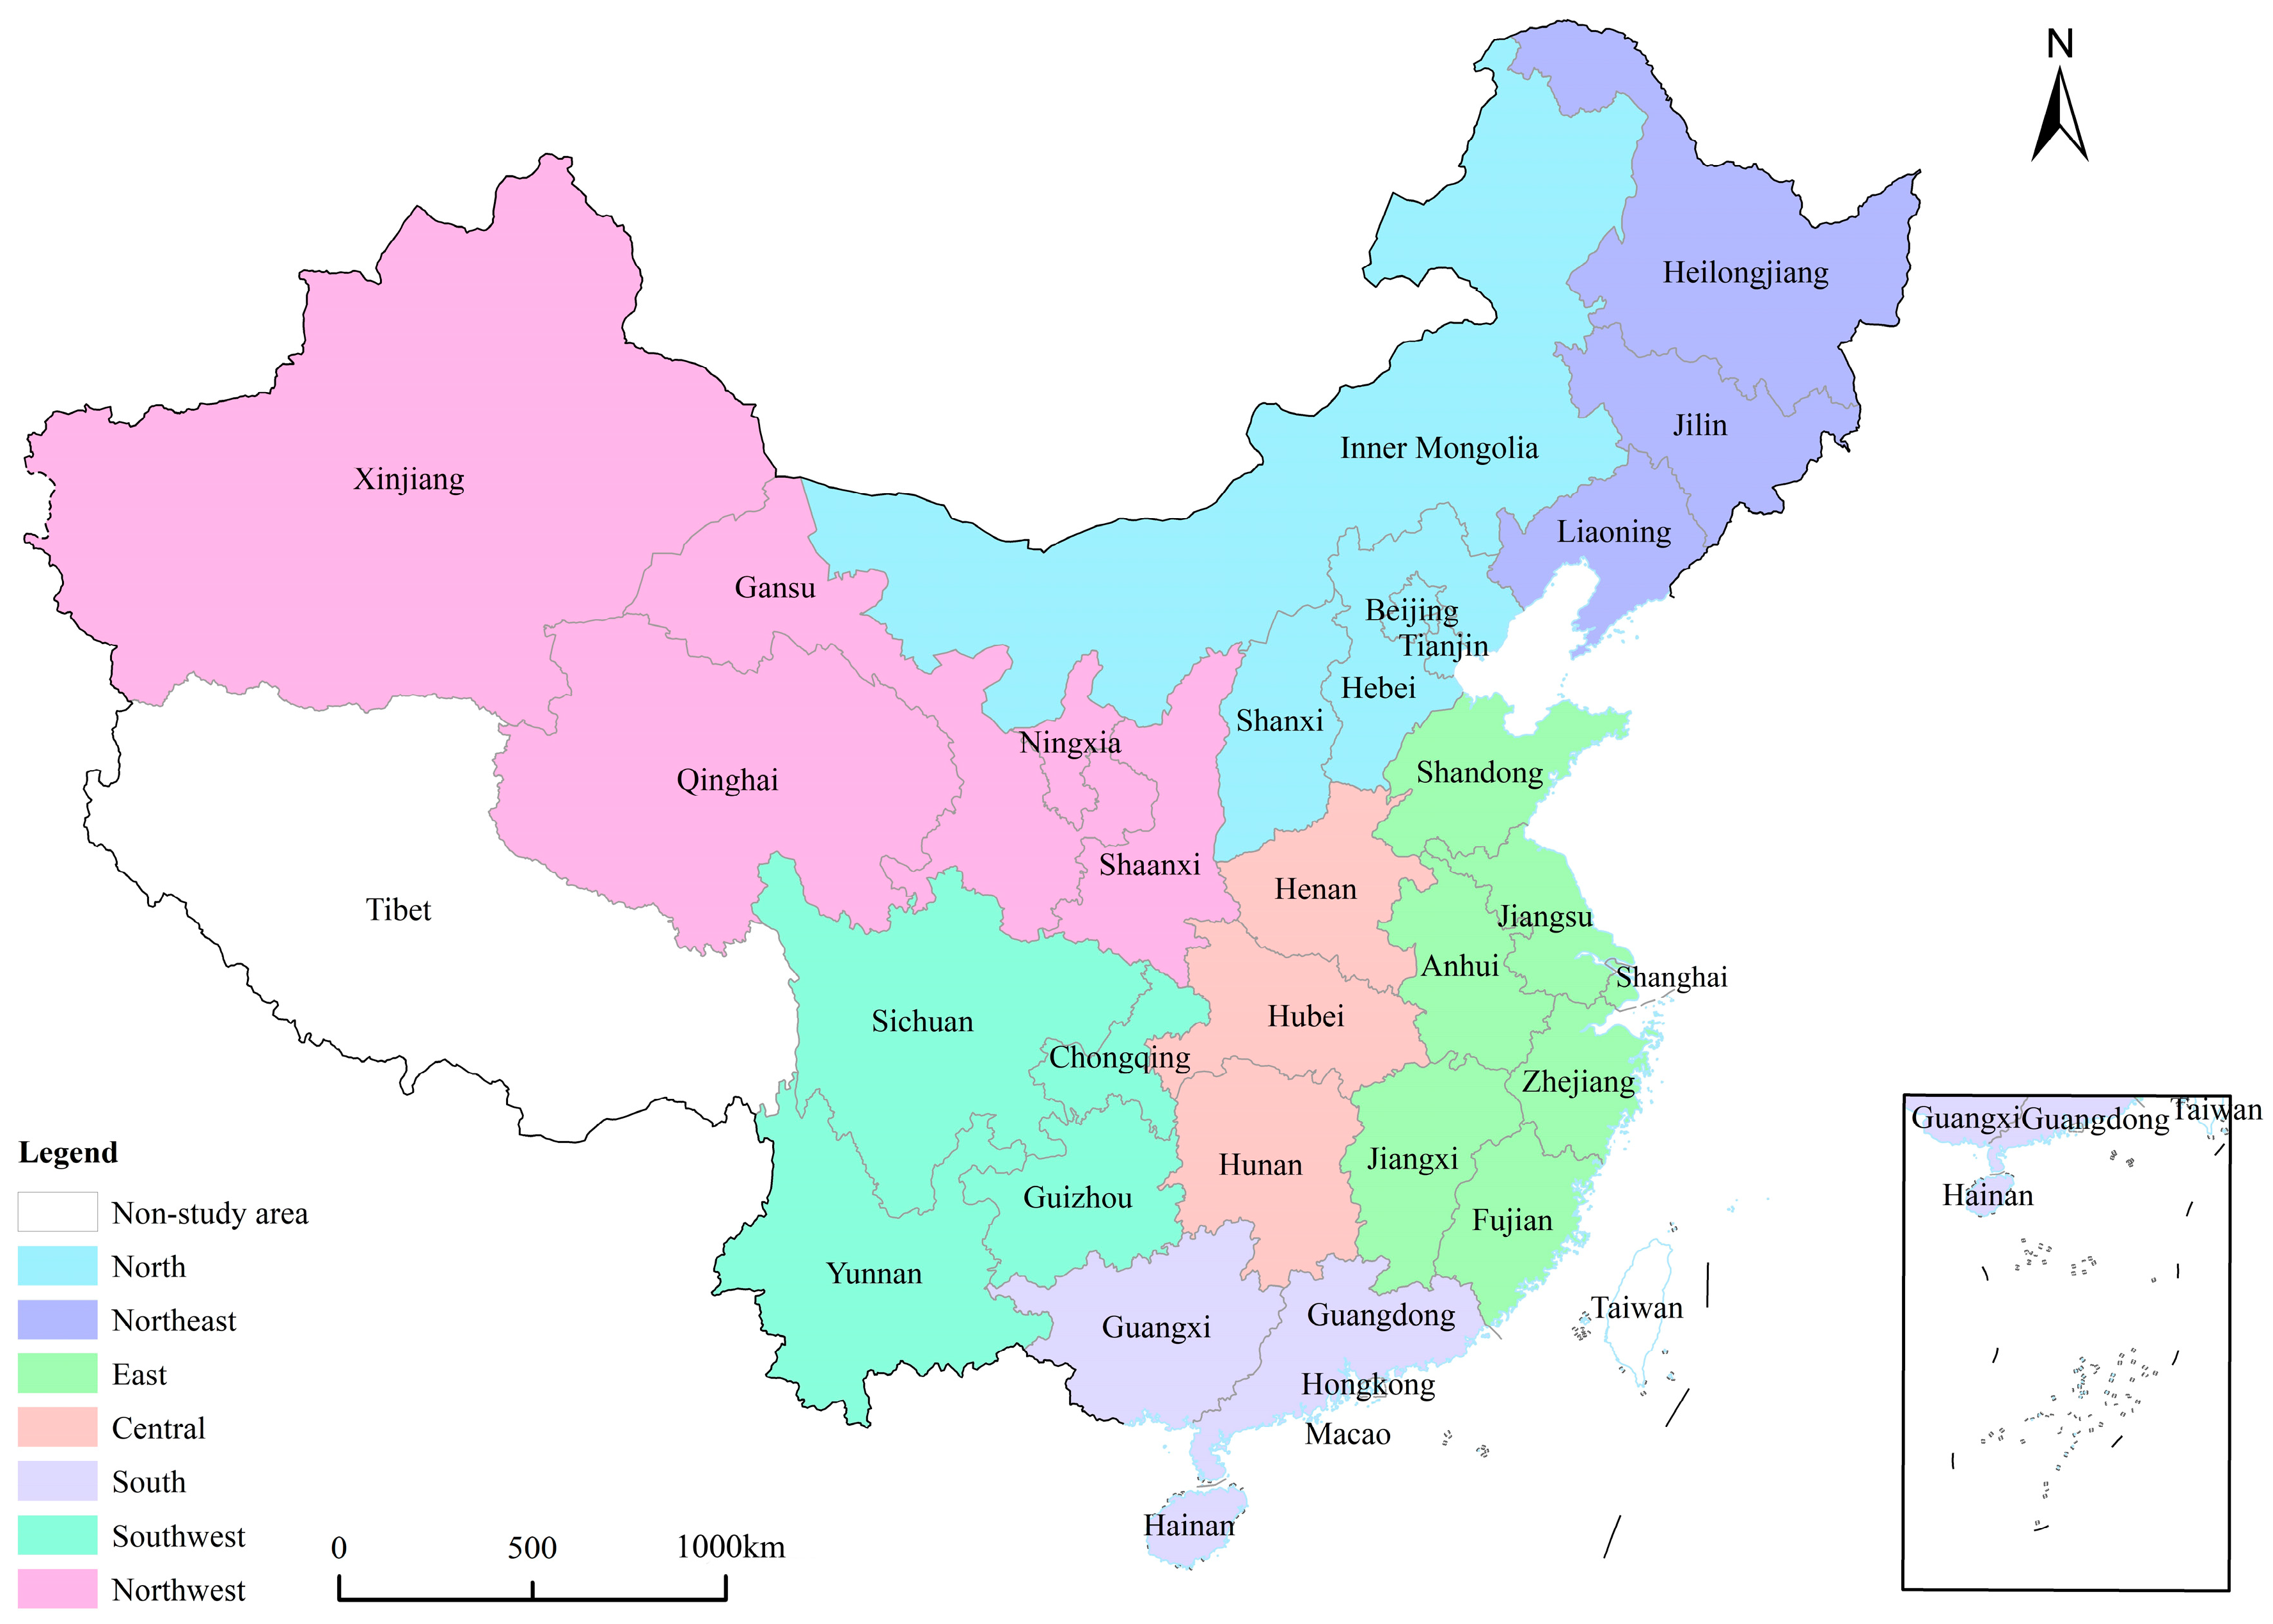
3.1. Study Area and Data Sources

The study area of this paper is 30 provinces in mainland China. This is primarily due to the fact that provincial governments represent the key force of investment and development in rural education in China. By conducting inter-provincial comparisons, it is possible to gain a comprehensive understanding of the spatial variations in rural education. Due to missing data and differences in statistical caliber, Hong Kong, Macao, Taiwan, and Tibet were excluded from this study. The specific locations and regions of each province are shown in Figure 1.
The study data in this paper involve rural education development, economic and social statistics, and geographic information. Data related to students, teachers, facilities and achievements of rural education mainly come from the China Education Statistical Yearbook, which provides separate data for middle schools and primary schools in rural areas. Data on rural education funding primarily comes from the China Educational Finance Statistical Yearbook, which details the government’s specific investments in rural education. Other economic and social data are sourced from the China Statistical Yearbook, China Rural Statistical Yearbook, and provincial statistical yearbooks. The administrative division geographic base map is obtained from the standard map website of the Ministry of Natural Resources of the People’s Republic of China (http://bzdt.ch.mnr.gov.cn/index.html (accessed on 11 March 2024)).

3.2. Rural Education Development Evaluation Index System

From a systems theory perspective, similar to natural ecosystems, human social activities also constitute a complex system where multiple factors interact and are influenced by the external environment [33,34]. Therefore, when analyzing social issues, we must grasp two key points: First, the hierarchy and diversity of elements within the system should be recognized [35]. This requires shifting away from traditional, isolated analytical thinking and fully accounting for the various factors throughout the social system’s lifecycle. Second, there exists a relationship of interdependence and mutual influence between the system and its external environment [36]. To understand the development and evolution of social systems, it is essential to consider the potential impacts of external environmental factors.
As a typical social system, rural education development is a complex and systematic process (Figure 2). It is centered on student needs, with factors such as funding, facilities, and teachers working together to produce high-quality educational outcomes [37,38]. Moreover, its development is profoundly influenced by external environmental factors, such as natural, economic, and social conditions [39]. Based on this understanding, this paper constructs a comprehensive evaluation index system encompassing the entire rural education development process, including four dimensions: capital input, school facilities, teacher resources, and educational quality. Capital investment is the cornerstone of rural education development, and it is measured by its average level and proportion. School facilities are essential for establishing optimal educational conditions and are assessed based on objective indicators such as school building area, level of informatization, and library resources. Teachers play a central role in promoting education development, and this paper evaluates the quantity, academic qualifications, and professional skills of rural teaching staff. These indicators can effectively reflect the adequacy, capacity, and quality of rural teacher resources. The dimension of educational quality is also explored, encompassing three key facets: educational foundations, teaching organization models, and educational outcomes.
With reference to existing research [32,40], the specific settings and measurements of each indicator are shown in Table 1. It should be noted that China’s rural education mainly comprises primary and junior high school education, while high school and vocational education are predominantly located in urban areas. As a result, this study’s indicator system includes primary and junior high schools, respectively. Data availability limitations prevent us from obtaining more precise and scientific indicator for certain dimensions, so we have chosen indicators that are as representative as possible for measurement.

3.3. Study Methods

3.3.1. Entropy Weight-TOPSIS Method

Since the evaluation of rural education development is a composite index system, this article chooses the commonly used entropy weight-TOPSIS method for calculation. The entropy weight method determines the weight of each evaluation index based on the information it provides, thereby eliminating the influence of human factors and objectively reflecting the importance of each index [41]. Meanwhile, the TOPSIS method identifies the optimal and worst solutions for each index, facilitating improved calculation and ranking of evaluation results [42]. The entropy weight-TOPSIS method effectively combines the above advantages and has been widely used in existing studies [40,43]. The specific calculation steps are as follows:
(1)
Assuming there are m objects to be evaluated and each object has n evaluation indicators, construct the original matrix:
A = ( a i j ) m × n ( i = 1 , 2 , m ; j = 1 , 2 , n )
In Equation (1), a i j denotes the value of the j indicator for the i evaluation object.
(2)
Standardize the judgment matrix A to generate the matrix B = ( b i j ) m × n . Positive indicators are processed using Equation (2), and negative indicators are processed using Equation (3):
b i j = a i j m i n ( a j ) m a x ( a j ) m i n ( a j )
b i j = m a x ( a j ) a i j m a x ( a j ) m i n i ( a j )
(3)
Determine the information entropy ( H j ) of evaluation indicators:
H j = 1 ln m ( i = 1 m f i j × ln f i j ) , f i j = b i j i = 1 m b i j
In Equation (4), f i j is the proportion of the i sample index value under the j indicator, and m represents the sample size. If the indicator H j is smaller, it indicates a greater degree of variability in the value of its indicator and a greater role for it in the comprehensive evaluation.
(4)
Determine the weights of evaluation indicators ( w j ):
w j = ( 1 H j ) j = 1 n ( 1 H j )
In Equation (5), 1 H j represents the difference coefficient of the j indicator, w j [ 0 , 1 ] and j = 1 n w j = 1 .
(5)
Construct the weight matrix R :
R = ( r i j ) m × n , r i j = w j × x i j
In Equation (6), r i j is the entropy value score of the i sample in the j indicator.
(6)
Determine the positive and negative ideal solutions:
Q j + = m a x ( r 1 j , r 2 j , , r n j ) , Q j = m i n ( r 1 j , r 2 j , , r n j )
In Equation (7), Q j + is the positive ideal solution for indicator j and Q j is the negative ideal solution for indicator j .
(7)
Calculate the distance between the positive and negative ideal solutions for each sample:
D i + = j = 1 n ( r i j Q j + ) 2 , D i = j = 1 n ( r i j Q j ) 2
In Equation (8), D i + represents the distance between object i and the optimal solution, and D i represents the distance between object i and the worst solution.
(8)
Obtain the score of comprehensive evaluation by calculating the relative closeness of each scheme to the ideal solution:
C i = D i D i + + D i
In Equation (9), C i [ 0 , 1 ] . The larger the value of C i , the higher the overall score, and vice versa.

3.3.2. Exploratory Spatial Data Analysis

Exploratory spatial data analysis is a statistical approach used to examine the non-randomness and autocorrelation of sample variables in their spatial distribution [44]. In this paper, Moran’s I index was employed for global spatial autocorrelation analysis, while Getis-Ord Gi* (hotspot analysis) was utilized for local spatial autocorrelation analysis.
Global Moran’s I can measure the overall distribution of a certain variable in space and determine whether there are aggregation characteristics. The calculation formula is as follows:
I = k i = 1 k j = 1 k w i j ( x i x ¯ ) ( x j x ¯ ) i = 1 k j = 1 k w i j i = 1 k ( x i x ¯ ) 2
In Equation (10), w i j represents the spatial weight matrix, and this study uses the adjacency weight matrix. k is the number of provinces in the sample. x i and x j represent the observations in the i and j cells. x ¯ represents the average of the rural education development index of all provinces. I [ 1 , 1 ] , with closer to 1 indicating a positive spatial correlation and closer to −1 indicating a negative spatial correlation.
The Getis-Ord Gi* method distinguishes between high-value aggregation areas and low-value aggregation areas by measuring local spatial dependence and heterogeneity [45]. It is calculated as follows:
G i * = j = 1 n w i j x j j = 1 n x j
In order to facilitate comparison, G i * is further standardized:
Z ( G i * ) = G i * E ( G i * ) V a r ( G i * )
In Equation (11), x j is the attribute value of spatial element j , and w i j is the spatial adjacency weight matrix. In Equation (12), E ( G i * ) and V a r ( G i * ) are the expected value and variance. If Z ( G i * ) is positively significant, it indicates that it is a hot spot area (high value aggregation). On the contrary, if Z ( G i * ) is negatively significant, it is a cold spot area (low value aggregation).

3.3.3. Kernel Density Estimation

Kernel density estimation is a method for analyzing dynamic information, such as the distribution and shape of random variables, through probability density. This method can effectively reveal the evolutionary differences in rural education in various regions. It is expressed as:
f ( x ) = 1 N h i = 1 N K ( X i x ¯ h )
In Equation (13), N is the number of observations, X i denotes independently and identically distributed values, x ¯ denotes the mean of the observations, h is the bandwidth, and K ( ) is weighting function. This paper uses a Gaussian kernel function to estimate the evolution process of rural education development.

3.3.4. Markov Chain

The classical Markov chain calculates the probability distribution and evolutionary trend of each type by discretizing continuous data into K types under time and state discrete conditions [46]. In this paper, the classical Markov transfer matrix was used to investigate the evolutionary pattern between different levels of rural education development. We divided the rural education development level into 5 types based on quintiles (0.20, 0.40, 0.60, 0.80), represented by k = 1 , 2 , 3 , 4 , 5 , respectively. Then, the probability that a province with type i in year t becomes type j after year d (transfer probability) can be estimated by the following equation:
P i j t , t + d = t = 2006 2020 d n i j t , t + d t = 2006 2020 d n i t
In Equation (14), d is the sample year span, d = 1 , 2 , 14 . n i t is the total number of units in type i of rural education development in year t . n i j t , t + d denotes the total number of samples that were type i in year t that changed to type j in year t + d .

3.3.5. Spatial Econometric Model

Econometric methods enable the identification of factors that influence the development of rural education. However, traditional panel regression models do not account for spatial correlation issues, potentially resulting in biased empirical findings. Based on existing research [47,48], this paper employs the spatial Durbin model for estimation. It contains variables that interact at spatial scales, which is more in line with the first law of geography that everything is geospatially correlated. The model settings are as follows:
Y i t = α + ρ W i j Y i t + β X i t + γ W i j X i t + μ i + η t + ε i t
In Equation (15), Y i t represents the rural education development index of province i in year t , and X i t is a series of economic and social factors that may affect rural education. W i j is the spatial adjacency weight matrix. μ i and η t are region and time fixed effects. ε i t is the spatial error term. ρ is the spatial autoregressive coefficient of the explained variable, β is the regression coefficient of the explanatory variable, and γ represents the spatial spillover effect of the explanatory variable.

4. Results and Discussion

4.1. Evaluation Results of Rural Education Development Index

The entropy weight-TOPSIS method was employed to calculate the rural education development index in China, with the results presented in Figure 3. The rural education development index at the national level rose from 0.113 in 2006 to 0.345 in 2020, showing an average annual increase of 13.69%. It can be seen that the development level of rural education in China shows a continuous upward trend, which is consistent with the findings of Zhao, Wu, Wang, Qu and Yu [32]. During this period, due to China’s rapid economic growth, government investment in rural education has been increasing. Moreover, a number of policies have been implemented to enhance rural education, such as free compulsory education and subsidies for rural teachers. These have significantly improved the conditions of rural education.
However, at the regional level, there are significant spatial imbalances in the development of rural education. The rural education development index is relatively high in the north, northeast, and east. The primary reason is the relative advancement of the economies in these regions, which allows for the allocation of sufficient resources towards the advancement of rural education. It is worth noting that, unlike the decline observed in previous studies on economic spatial patterns [49,50], rural education in the Northeast region remains in a relatively leading position. Its first-mover advantage provides favorable conditions for the development of rural education, including a solid industrial foundation, comprehensive infrastructure, and a favorable living environment [51,52]. In stark contrast, rural education in the Southwest and Central regions is significantly less developed than the national average. In addition to economic considerations, the challenging natural and complex social environments are significant factors contributing to this disparity. Especially in the southwest region, most rural areas are located in mountainous areas and have multi-ethnic characteristics, which are not conducive to the development of rural education. In summary, the level of rural education development in China is gradually improving, but there is a notable spatial differentiation.

4.2. Spatial Patterns of Rural Education Development

To clearly demonstrate the spatial differentiation pattern of rural education development, this study employs ArcGIS 10.7 software for visual analysis. Figure 4 depicts the rural education development index for each province in 2006, 2011, 2016, and 2020.
During the study period, there was a significant increase in the rural education index across all provinces. Notably, the provinces that experienced rapid development were Beijing, Jilin, Gansu, Anhui, and Ningxia, with an average annual growth rate exceeding 20%. Conversely, the provinces with slower development were Henan, Fujian, Xinjiang, Hebei, and Hunan, with an average annual growth rate below 10%. The spatial pattern of rural education development has changed over time: (1) In 2006, most provinces had low levels of rural education development, with the exception of Beijing and Shanghai. These two cities, being China’s political and economic centers, were able to concentrate the country’s best educational resources. (2) By 2011, rural education levels had markedly improved in the northern and coastal provinces, mainly due to the rapid economic growth in these regions. However, rural education development remained low in the economically disadvantaged southwest and central regions. (3) Progressing to 2016, rural education in 22 provinces had achieved at least a medium level. Nonetheless, eight provinces still lagged behind, including economically underdeveloped southwestern provinces like Yunnan and Guizhou, as well as provinces with larger agricultural populations such as Henan and Hebei. (4) By 2020, rural education in all provinces reached at least a medium level, with some northern and coastal provinces attaining higher levels. Beijing and Shanghai continued to lead as the most developed regions for rural education in China. In conclusion, the spatial pattern of rural education development is characterized by higher levels in the north and lower levels in the south, as well as higher levels in the east and lower levels in the west. This phenomenon aligns with spatial differences observed in other basic education studies, underscoring the significant imbalance in China’s educational development [30,32].

4.3. Spatial Correlation of Rural Education Development

4.3.1. Global Spatial Autocorrelation Analysis

As previously mentioned, spatial disparities exist among provinces in rural education development. To delve into the specific characteristics of this spatial differentiation, this study utilized Moran’s I index for global spatial autocorrelation analysis. Table 2 illustrates that the global Moran’s I statistics for 2006, 2011, 2016, and 2020 are all greater than 0, and they all passed the confidence test at the 1% statistical level. This indicates a positive spatial correlation in rural education development and exhibits clear spatial agglomeration characteristics. This finding, consistent with the research results of Liu et al. [53], shows that the spatial pattern of rural education development is not random but rather exhibits clustering, with provinces of similar levels tending to group together. However, there is a noticeable downward trend in the Moran’s I index from 2006 to 2020, suggesting a gradual weakening of the spatial agglomeration in rural education development across China. The above trend may primarily result from the Chinese government’s implementation of a series of rural support and educational equity policies aimed at impoverished areas [54].

4.3.2. Local Spatial Autocorrelation Analysis

Based on the Getis-Ord Gi* index result, the development of rural education has been divided into a cold-spot zone and hot-spot zone, with a total of seven categories (Figure 5). Generally, there is a clear differentiation in the spatial pattern of hot and cold spots in rural education development, with hot spots concentrated in Beijing and its surrounding provinces and cold spots mainly distributed in the southwestern region and surrounding provinces. The hot-spot provinces mainly include Beijing, Tianjin, Hebei, Shanxi, Inner Mongolia in North China, Liaoning and Jilin in Northeast China, and Shandong Jiangsu and Shanghai in East China. Cold-spot provinces are mainly distributed in the mountainous regions of southwest China, including Chongqing, Sichuan, Guizhou, Yunnan, and Guangxi. In addition, Hunan and Hainan have also transformed into sub-cold-spot areas in recent years.
The hot and cold patterns of rural education development in different periods are relatively stable, consistently concentrated within specific geographical space. Further examination of these regions reveals that, in addition to their geographic concentration, they share similarities in natural, economic, and social conditions. The hot-spot provinces are mostly those in China with relatively good educational foundations and fierce educational competition. For example, Shandong and Hebei have large educated populations and profound educational traditions, with both the government and families placing great importance on investment in education [55]. Even Liaoning and Jilin in the Northeast region have a strong foundation in the quality and efficiency of education resource allocation [29]. Cold spots are mainly located in economically disadvantaged and ethnically diverse provinces, where limitations in government financial resources, the natural environment, and social factors constrain the development of rural education. For instance, Guizhou and Guangxi are situated in mountainous and ethnically diverse regions, where the infrastructure is weak, educational concepts are backward, and rural children experience a high rate of school dropout [56]. In general, the distribution of hot and cold spots overlaps with the pattern of economic development and agricultural production [57,58] but is not completely consistent. In fact, this pattern is also shaped by underlying factors such as the natural environment, national culture, and historical heritage [59,60]. This finding can provide valuable insights for the government in formulating differentiated strategies for rural education development.

4.4. Dynamic Evolution of Rural Educational Development

4.4.1. Dynamic Evolution Trend Analysis

Figure 6 displays the dynamic evolution curve of China’s rural education development level from 2006 to 2020, constructed using the kernel density estimation method. It is evident that the center of the kernel density curve progressively shifts to the right, exhibiting multiple peaks and right-tailing phenomena, with the main peak transitioning from “steep” to “smooth”. The specific characteristics are outlined as follows: (1) The kernel density curve for 2006–2020 demonstrates a rightward shift, indicating an overall upward trend in China’s rural education development level. This progress is attributed to sustained government investment in rural education and the implementation of balanced education policies. (2) The curve displays a right-trailing tail and a consistent presence of a secondary peak shifting towards the right. It indicates that rural education development in some provinces is significantly above average, and their leading position is still gradually expanding. (3) The width of the main peak has gradually increased and has occasionally shown a weak trend of double peaks, indicating a further increase in dispersion and imbalance of rural education development among provinces. These phenomena highlight the increasing spatial imbalance in China’s educational development. As some studies have noted [29,61], despite overall improvements in basic educational conditions, addressing and reducing regional disparities has become a significant challenge for the government.

4.4.2. Grade Evolution Characteristics

Based on the traditional Markov chain method, we calculated the transition probability of rural education development grades from 2006 to 2020. Table 3 presents the Markov transition probability matrix between the five grades of rural education development. First, the values of the diagonal probabilities are higher than those of the off-diagonal lines, showing “club convergence” characteristics. The lowest probability value on this diagonal is over 60%, indicating that the rural education development grade of each province has a high probability of remaining in its original state. In particular, the probability of rank remaining unchanged is particularly high in provinces with low and high grades of rural education development, at 74.44% and 98.65%, respectively. Second, the values to the right of the diagonal are all larger than those to the left, indicating a higher probability of increasing than decreasing the rural education development rating. The probability of moving from medium–low to medium was the highest at 32.22%, while the probability of moving from medium–high to high was the lowest at 20.51%. Finally, except for the middle grade, all other grades move between neighboring intervals. This indicates that the development of rural education in China tends to stabilize, making it difficult for provinces with lower levels to make leapfrog progress. These fully confirm the phenomenon of hierarchical solidification in inter-provincial educational development [62,63], with a basic pattern that is relatively stable and difficult to break.

5. Further Analysis: Factors Influencing the Development of Rural Education

5.1. Influencing Factor Selection

As previously stated, rural education development is a systematic process involving both internal and external factors. It is essential to investigate the impact of external environmental factors on the spatial differentiation patterns of rural education development. Consequently, this paper employs spatial econometrics methods for further analysis. It should be noted that the development of rural education is influenced by various dimensions, including nature, economy, and society. However, given the constant nature of each province’s natural resources, our analysis primarily focuses on the economic and social factors that may influence rural education development in the short term.
Referring to existing research [9], five potential influencing factors were selected for analysis: economic strength, fiscal revenue, industrial structure, population density, and urbanization level. First, economic strength (ES) serves as the foundation for educational development, measured by GDP per capita. Second, fiscal revenue (FR) impacts the government’s capacity to invest in rural education, measured by per capita fiscal revenue. Third, industrial structure (IS) influences the development of the agricultural economy, assessed using the share of secondary and tertiary industries in GDP. Fourth, population density (PD) is closely related to the cost of allocating resources to rural education, measured by the number of permanent residents per square kilometer. Last, the level of urbanization (UL) mirrors the urban and rural development pattern, gauged by the urbanization ratio.

5.2. Selection of Spatial Econometric Models

Before conducting spatial econometric analysis, a series of tests are performed to select an appropriate spatial econometric model [64]. The test results are shown in Table 4. Firstly, the Lagrange multiplier test (LM) results indicate that LM-spatial lag, Robust LM-spatial, lag LM-spatial error, and Robust LM-spatial error all passed the significance test at the 1% statistical level. Both spatial lag and spatial error effects are evident, indicating that the spatial Durbin model (SDM) should be selected for estimation. Secondly, the results of the likelihood ratio test (LR) are also statistically significant, supporting the decision to use the SDM model. Additionally, the Wald test was utilized to demonstrate that the SDM model cannot simply degrade into the SAR and SEM models. Finally, the Hausman test demonstrated that a fixed-effects model is necessary for the analysis. Consequently, this paper employed the SDM model with double fixed effects to examine the influencing factors of rural education development.

5.3. Analysis of Results

The empirical results are shown in Table 5. The estimated coefficient ρ is statistically significant at the 1% level, indicating a spatial spillover effect in rural education development. Meanwhile, the Log-Likelihood value of 888.439 supports the choice of using the spatial Durbin model. The variance of the random error term (Sigma2_e) is small, which further proves the rationality of the model selection. Most variables exhibit varying degrees of significance, highlighting the scientific basis for selecting influencing factors.
However, the coefficients of the SDM model cannot accurately reflect the marginal effects of various influencing factors on rural education development. Therefore, it is necessary to use the partial differential method to decompose and obtain the direct effects and indirect effects of various influencing factors. Table 6 presents the results, enabling a more comprehensive analysis of the drivers of rural education development.
The direct effect of the ES variable is positively significant at the 5% level, indicating that economic growth has a promoting effect on the development of local rural education. This result is consistent with previous research findings that the economic foundation determines a region’s ability to invest and allocate educational resources [65]. However, the indirect effect is significantly negative at the 1% level. This suggests that provinces with higher GDP per capital have a detrimental impact on the development of rural education in neighboring areas. This phenomenon occurs because economically developed provinces have a siphon effect on the population and resources of surrounding areas. Farmers from economically less developed provinces often migrate to more developed regions in search of employment and better living conditions, resulting in a decline in rural education [66].
Both the direct and indirect effects of the FR variable are positive and statistically significant, highlighting the importance of fiscal revenue in promoting rural education development. As many studies have consistently emphasized [67], increased fiscal revenue enables the government to allocate more resources to rural education, thereby reducing the development gap. Furthermore, the fiscal practices of neighboring provinces may serve as a model for surrounding areas [68]. It stimulates other provinces to increase their income and allocate resources effectively, thus promoting education in rural areas.
The IS variable exhibited a negative correlation, and its direct effect is statistically significant at the 1% level. This finding suggests that the high development of secondary and tertiary industries is not conducive to rural education. One possible explanation is the transition towards the manufacturing and service industries, which has diminished the importance of agriculture in the economy and resulted in inadequate focus on rural area development [69]. And many workers in these industries hail from local and surrounding rural areas. In order to find work, they are compelled to leave rural areas and migrate to urban areas, which undermines the foundation and prospects of rural education development.
The direct and indirect effects of the PD variable are also positive and significant, fully demonstrating the crucial role of population size in rural education development. In regions with higher population density, such as the Eastern region, rural education can invest fewer costs and achieve greater benefits. However, in the geographically expansive and sparsely populated western region, the rural population is particularly dispersed. Some small-scale rural schools incur high per-pupil costs, but their educational effectiveness does not correspond proportionately [70]. From this perspective, appropriately centralizing the educational population contributes to the efficient development of rural education.
The UL variable has a negative direct effect but a positive indirect effect, which is an interesting phenomenon. Some studies on the relationship between urbanization and agriculture offer possible explanations. The extensive urbanization of the local area has led to a decrease in rural land and population [71,72], which has seriously impacted the space and demand for rural education development. Moreover, urbanization has led to a decrease in local agricultural production, and the demand for agricultural products is gradually expanding to surrounding provinces [73]. To some extent, this has driven the revival of the agricultural economy in neighboring provinces, contributing to an increase in farmers’ income and the development of rural education.

6. Conclusions and Implications

6.1. Conclusions

Promoting social equity and revitalizing rural areas requires a focus on educational development. While previous research has identified the lag and imbalance of rural education in China, this paper aims to provide a comprehensive and dynamic understanding of the issue. From a system perspective, this paper innovatively constructs a comprehensive evaluation index system that encompasses the entire process of resource input, utilization, and output in rural education development. Additionally, a geographic information system and spatial econometric methods are introduced to provide more intuitive and diverse analyses. Finally, using panel data from 30 provinces from 2006 to 2020, we revealed the spatial differentiation characteristics of China’s rural education development and its influencing factors. The main findings are as follows.
In general, rural education in China has shown a positive growth trend, with the development index rising from an average of 0.113 in 2006 to 0.345 in 2020. However, at the regional level, the development of rural education shows significant spatial imbalances. There is an overall differentiation that is characterized by higher levels in the north and east, and lower levels in the central and southwestern regions.
The Moran’s I index of global autocorrelation reveals spatial agglomeration in the development of rural education, with provinces at similar levels of development tending to be geographically concentrated. Getis-Ord Gi* analysis further identifies hot spots of rural education development in North and Northeast China, centered around Beijing. In contrast, cold spots are primarily found in the impoverished and minority regions of the southwestern mountains.
In terms of dynamic evolution, the kernel density curve shows a gradual widening of the gap in the development of rural education in the provinces, with a few provinces even far exceeding the national average. Meanwhile, traditional Markov chain analysis shows that the development of rural education in China exhibits club convergence characteristics. Provinces with high levels of development consistently maintain a leading position, while those with low levels of development remain in a backward position, with a low probability of leapfrog development.
The results of the spatial econometric analysis suggest that economic strength, fiscal revenue, industrial structure, population density, and urbanization significantly influence the spatial balance of rural education development. It is important to note that these factors may also have an impact on the development of education in surrounding areas, either limiting or promoting it.

6.2. Policy Implications

The findings of this study have rich policy implications for the balanced development of education and the comprehensive revitalization of rural areas in China. It mainly includes the following aspects: (1) Despite improvements in rural education in China, most provinces are still at a medium level of development. In the future, it is important to continue to address the deficiencies in rural education, including increasing financial investment, updating infrastructure, and strengthening teacher resources. Furthermore, policymakers should develop rural education with higher standards and pay more attention to the quality and results of education, such as teaching content, academic performance, and children’s growth. (2) The government needs to focus on the spatial imbalance in the development of rural education and actively implement education support policies for underdeveloped areas in the central and western regions. It is essential to innovate education development strategies, leverage modern information technology, and promote distance education to ensure that students in remote areas have access to high-quality educational resources. (3) Rural education relies on the presence of rural communities and is affected by external economic and social factors. Thus, it is necessary to continuously optimize the external environment for the development of rural education, including consolidating the economic foundation, reducing population loss, enhancing social vitality, and strengthening urban–rural interaction.
Additionally, this study can provide valuable insights for other developing countries. Firstly, it emphasizes the importance of rural education, which is often a weak link in the education systems of many developing countries. The processes and strategies for rural education development in China, as discussed in this paper, can serve as a useful reference for emerging nations. Secondly, the multi-dimensional evaluation framework we proposed provides a scientific method for assessing educational development in other countries. Scholars and decision-makers should avoid using a single standard to measure educational development and instead conduct comprehensive assessments from a systematic perspective. Finally, the imbalance in rural education in China revealed in this paper offers lessons for educational development in other countries. When crafting education policies, developing nations should try to avoid spatial inequalities and work to reduce the deprivation of educational rights.

6.3. Limitations and Future Research

The paper’s findings have value and significance, but there are limitations. Firstly, rural education is a complex system that is not fully covered by existing indicators and inevitably has gaps. This has somewhat impacted the evaluation results of rural education development. Secondly, the research sample is restricted to the provincial level due to missing data, thus hindering a more detailed analysis. Thirdly, the scope of the study is confined to rural areas, without further exploration of the disparities in urban and rural educational development. In follow-up studies, we suggest developing more complex indicator systems, collecting county-level statistics, and conducting urban–rural comparisons to gain a deeper understanding of rural education development.

Author Contributions

Conceptualization, Y.C. and J.Z.; methodology, Y.C.; software, Y.C.; validation, Y.C. and J.Z.; formal analysis, Y.C.; investigation, Y.C. and J.Z.; resources, J.Z.; data curation, Y.C. and M.J.; writing—original draft preparation, Y.C.; writing—review and editing, J.Z. and M.J.; supervision, J.Z.; visualization, Y.C. and M.J.; funding acquisition, Y.C. and J.Z. All authors have read and agreed to the published version of the manuscript.

Funding

This study was supported by the Innovation Project of Guangxi Graduate Education (YCSW2024071) and Guangxi University Applied Economics Interdisciplinary Research Project (2023JJJXA10).

Data Availability Statement

The data presented in this study are available on request from the corresponding author.

Conflicts of Interest

The authors declare no conflicts of interest.

References

  1. Masuda, K.; Yamauchi, C. How Does Female Education Reduce Adolescent Pregnancy and Improve Child Health?: Evidence from Uganda’s Universal Primary Education for Fully Treated Cohorts. J. Dev. Stud. 2020, 56, 63–86. [Google Scholar] [CrossRef]
  2. Brown, P.H.; Park, A. Education and poverty in rural China. Econ. Educ. Rev. 2002, 21, 523–541. [Google Scholar] [CrossRef]
  3. Oljira, T.; Hailu, M. Integrated functional adult education program and its contributions for livelihoods in Ethiopia. Heliyon 2021, 7, e07718. [Google Scholar] [CrossRef] [PubMed]
  4. Gruijters, R.J. Unequal Transformation: Trends in Educational Stratification during China’s Market Era. Oxf. Rev. Educ. 2022, 48, 320–340. [Google Scholar] [CrossRef]
  5. Wu, X.G. The Household Registration System and Rural-Urban Educational Inequality in Contemporary China. Chin. Sociol. Rev. 2011, 44, 31–51. [Google Scholar] [CrossRef]
  6. Hao, W.W. Further intensifying effort to narrow the education modernization gap between the east and the west and between urban and rural areas. J. Northwest Norm. Univ. (Soc. Sci.) 2021, 58, 26–29. [Google Scholar] [CrossRef]
  7. Yue, A.; Bin, T.; Shi, Y.J.; Tang, J.J.; Shang, G.M.J.; Medina, A.; Rozelle, S. Rural education across China’s 40 years of reform: Past successes and future challenges. China Agric. Econ. Rev. 2018, 10, 93–118. [Google Scholar] [CrossRef]
  8. Yang, W.A.; Yuan, Y. Challenges and Responses to the Development Ecology of Rural Education. China Educ. Technol. 2023, 442, 1–10. [Google Scholar]
  9. Ju, F.Y.; Wang, S.Q.; Lin, W. Nonlinear Effect of Urbanization on the Gap between Urban and Rural Elementary Education in China. Math. Probl. Eng. 2022, 2022, 7025433. [Google Scholar] [CrossRef]
  10. Zhou, X.S.; Li, G.C. The Realistic Challenges and Optimization Pathways of Rural Education Construction. World Agric. 2024, 4, 103–112. [Google Scholar] [CrossRef]
  11. Zhou, J.X.; Chang, Y.J. Triple dimension and realistic approach of rural education transformation and connection base on the rural revitalization strategy. Mod. Educ. Manag. 2024, 5, 39–49. [Google Scholar] [CrossRef]
  12. Biddle, C.; Azano, A.P. Constructing and Reconstructing the “Rural School Problem”: A Century of Rural Education Research. Rev. Res. Educ. 2016, 40, 298–325. [Google Scholar] [CrossRef]
  13. Hlalele, D. Social justice and rural education in South Africa. Perspect. Educ. 2012, 30, 111–118. [Google Scholar]
  14. Roberts, P.; Green, B. Researching Rural Places: On Social Justice and Rural Education. Qual. Inq. 2013, 19, 765–774. [Google Scholar] [CrossRef]
  15. Fan, J.Y.; Huang, J.; Sessions, J.G.; Ye, J.J. Local education expenditures and educational inequality in China. Manch. Sch. 2023, 91, 283–305. [Google Scholar] [CrossRef]
  16. Zhang, J.; Jin, S.Q.; Torero, M.; Li, T. Teachers and urban-rural gaps in educational outcomes. Am. J. Agric. Econ. 2018, 100, 1207–1223. [Google Scholar] [CrossRef]
  17. Li, Y.; Yang, Y.L.; Wu, S.R. Problems and countermeasures of the allocation efficiency of high quality resources in urban and rural compulsory education: Based on DEA-malmguist model. J. Chin. Soc. Educ. 2021, 1, 60–65. [Google Scholar]
  18. Wen, Y.; Xue, J. Financial investment efficiency of urban and rural compulsory education in the context of rural revitalization strategy. Educ. Econ. 2019, 3, 56–64. [Google Scholar]
  19. Gao, Y.; He, Q.; Liu, Y.; Zhang, L.; Wang, H.; Cai, E. Imbalance in Spatial Accessibility to Primary and Secondary Schools in China: Guidance for Education Sustainability. Sustainability 2016, 8, 1236. [Google Scholar] [CrossRef]
  20. Meng, X.; Xie, T.W. Evaluation of the effect of the reform of the rural compulsory education input system: An analysis based on provincial panel data. J. Chin. Soc. Educ. 2015, 2, 54–58. [Google Scholar]
  21. Chen, B.; Zhao, Z.J. Research on the spatial difference and equilibrium of compulsory education resources in western ethnic areas: An empirical analysis based on the data evaluating the balanceof national compulsory education. Res. Educ. Dev. 2021, 41, 61–70. [Google Scholar] [CrossRef]
  22. Liu, Z.; Liu, Z.T. Location method of rural basic education facilities based on the multi-feature spatiotemporal equilibrium model: A case study of the planning of childcare facilities. J. Beijing Univ. Technol. 2023, 10, 1050–1064. [Google Scholar]
  23. Delprato, M.; Chudgar, A.; Frola, A. Spatial education inequality for attainment indicators in sub-saharan Africa and spillovers effects. World Dev. 2024, 176, 106522. [Google Scholar] [CrossRef]
  24. Zhang, X.M. An empirical study on the impact of urbanization on rural education development: An analysis based on panel data from Henan Province. Stat. Decis. 2011, 5, 105–107. [Google Scholar] [CrossRef]
  25. Sun, D.; Ji, Y.; Xuan, Y.Q. Can school spending improve the quality and equity of education? empirical evidence from CEPS. China Econ. Educ. Rev. 2023, 3, 25–44. [Google Scholar] [CrossRef]
  26. Jiang, L.; Chen, J.; Tian, Y.; Luo, J. Spatial Pattern and Influencing Factors of Basic Education Resources in Rural Areas around Metropolises—A Case Study of Wuhan City’s New Urban Districts. ISPRS Int. J. Geo-Inf. 2022, 11, 576. [Google Scholar] [CrossRef]
  27. Dong, Q.S.; Shao, Z.B. Spatio-temporal evolution and influencing factors of student distribution in rural school—Xiafutou School expression based on the Man-Earth relationship areal system. J. Henan Univ. (Soc. Sci.) 2024, 2, 118–124. [Google Scholar] [CrossRef]
  28. Xiang, L.; Stillwell, J. Rural-Urban Educational Inequalities and Their Spatial Variations in China. Appl. Spat. Anal. Policy 2023, 16, 873–896. [Google Scholar] [CrossRef]
  29. Cai, H.; Niu, Y.N.; Luo, L. Assessment and balanced progression of compulsory education resource allocation in China’s new era. J. Nanjing Norm. Univ. (Soc. Sci. Ed.) 2024, 1, 36–52. [Google Scholar]
  30. Cai, Y.Q.; Hu, M.L. Evaluation Index System and Its Calculation of Sustainable Development of Preschool Education in China. J. South China Norm. Univ. (Soc. Sci. Ed.) 2024, 2, 32–48. [Google Scholar]
  31. Wu, L.; Jiao, H.F.; Ye, L.; Tang, P. Temporal and Spatial Characteristics of Provincial Education Urbanization in China and Its Influencing Factors. Sci. Geogr. Sin. 2018, 1, 58–66. [Google Scholar] [CrossRef]
  32. Zhao, L.; Wu, D.T.; Wang, Z.H.; Qu, L.P.; Yu, W. Spatio-temporal pattern and influencing factors of the allocation of rural basic education resources in China. Econ. Geogr. 2018, 38, 39–49. [Google Scholar] [CrossRef]
  33. Laszlo, A.; Krippner, S. Chapter 3—Systems Theories: Their Origins, Foundations, and development. In Advances in Psychology; Jordan, J.S., Ed.; North-Holland: Amsterdam, The Netherlands, 1998; Volume 126, pp. 47–74. [Google Scholar]
  34. Luhmann, N. Social Systems; Stanford University Press: Redwood City, CA, USA, 1995; pp. 176–210. [Google Scholar]
  35. Shi, Y.J.; Zhai, G.F.; Xu, L.H.; Zhou, S.T.; Lu, Y.W.; Liu, H.B.; Huang, W. Assessment methods of urban system resilience: From the perspective of complex adaptive system theory. Cities 2021, 112, 103141. [Google Scholar] [CrossRef]
  36. Valentinov, V.; Chatalova, L. Institutional Economics and Social Dilemmas: A Systems Theory Perspective. Syst. Res. Behav. Sci. 2016, 33, 138–149. [Google Scholar] [CrossRef]
  37. Tsang, M.C. Financial reform of basic education in China. Econ. Educ. Rev. 1996, 15, 423–444. [Google Scholar] [CrossRef]
  38. Wanke, P.; Lauro, A.; Figueiredo, O.H.d.S.; Faria, J.R.; Mixon, J.F.G. The Impact of School Infrastructure and Teachers’ Human Capital on Academic Performance in Brazil. Eval. Rev. 2024, 48, 636–662. [Google Scholar] [CrossRef]
  39. Rodriguez, R.S.; Gracia, E.P.; Puno-Quispe, L.; Mazeyra, A.H. Quality and equity in the Peruvian education system: Do they progress similarly? Int. J. Educ. Res. 2023, 119, 102183. [Google Scholar] [CrossRef]
  40. Sun, J.; Wu, H.; Shi, S. A research of the evaluation of preschool education resource allocation level and spatio-temporal differences: Based on repeated indicators method and Theil index. Heliyon 2023, 9, e16362. [Google Scholar] [CrossRef]
  41. Huang, J.; Duan, X.Y.; Li, Y.L.; Guo, H.T. Spatial-temporal evolution and driving factors of green high-quality agriculture development in China. Front. Environ. Sci. 2023, 11, 1320700. [Google Scholar] [CrossRef]
  42. Luo, J.; Chen, S.Y.; Sun, X.; Zhu, Y.Y.; Zeng, J.X.; Chen, G.P. Analysis of city centrality based on entropy weight TOPSIS and population mobility: A case study of cities in the Yangtze River Economic Belt. J. Geogr. Sci. 2020, 30, 515–534. [Google Scholar] [CrossRef]
  43. Zhang, Z.Y.; Hu, Z.N.; Zhong, F.L.; Cheng, Q.P.; Wu, M.Z. Spatio-Temporal Evolution and Influencing Factors of High Quality Development in the Yunnan-Guizhou, Region Based on the Perspective of a Beautiful China and SDGs. Land 2022, 11, 821. [Google Scholar] [CrossRef]
  44. Legendre, P. Spatial Autocorrelation: Trouble or New Paradigm? Ecology 1993, 74, 1659–1673. [Google Scholar] [CrossRef]
  45. Ord, J.K.; Getis, A. Local spatial autocorrelation statistics: Distributional issues and an application. Geogr. Anal. 1995, 27, 286–306. [Google Scholar] [CrossRef]
  46. Shi, Z.H.; Ma, L.B.; Wang, X.; Wu, S.S.; Bai, J.; Li, Z.Y.; Zhang, Y.Q. Efficiency of agricultural modernization in China: Systematic analysis in the new framework of multidimensional security. J. Clean. Prod. 2023, 432, 139611. [Google Scholar] [CrossRef]
  47. Mur, J.; Angulo, A. The spatial durbin model and the common factor tests. Spat. Econ. Anal. 2006, 1, 207–226. [Google Scholar] [CrossRef]
  48. Wang, H.; Cui, H.; Zhao, Q. Effect of green technology innovation on green total factor productivity in China: Evidence from spatial durbin model analysis. J. Clean. Prod. 2021, 288, 125624. [Google Scholar] [CrossRef]
  49. Mai, Q.S.; Bai, M.T.; Li, L. Study on the Dynamic Evolution and Regional Differences of the Level of High-Quality Economic and Social Development in China. Sustainability 2023, 15, 382. [Google Scholar] [CrossRef]
  50. Yang, W.P.; Huang, R.Y.; Li, D. China’s high-quality economic development: A study of regional variations and spatial evolution. Econ. Chang. Restruct. 2024, 57, 86. [Google Scholar] [CrossRef]
  51. Sun, X.G.; Chu, D.J.; Li, Q.B.; Shi, Y.; Lu, L.; Bi, A.R. Dynamic successive assessment of Rural Human Settlements Environment in China. Ecol. Indic. 2023, 157, 111177. [Google Scholar] [CrossRef]
  52. Yao, Y.C.; Yang, Y.Q. Advantages, Difficulties, and Exploration of Northeast China Taking the Lead in Realizing Agricultural. Study Explor. 2024, 2, 90–97. [Google Scholar]
  53. Liu, W.L.; Li, J.D.; Zhao, R. The effects of rural education on poverty in China: A spatial econometric perspective. J. Asia Pac. Econ. 2023, 28, 176–198. [Google Scholar] [CrossRef]
  54. Xue, E.Y.; Zhou, X.P. Education and anti-poverty: Policy theory and strategy of poverty alleviation through education in China. Educ. Philos. Theory 2018, 50, 1101–1112. [Google Scholar] [CrossRef]
  55. Yang, J.; Huang, X.; Liu, X. An analysis of education inequality in China. Int. J. Educ. Dev. 2014, 37, 2–10. [Google Scholar] [CrossRef]
  56. Lu, M.C.; Cui, M.L.; Shi, Y.J.; Chang, F.; Mo, D.; Rozelle, S.; Johnson, N. Who drops out from primary schools in China? Evidence from minority-concentrated rural areas. Asia Pac. Educ. Rev. 2016, 17, 235–252. [Google Scholar] [CrossRef]
  57. Fu, Z.; Ding, F.; Zheng, A.Y. Evaluation and spatial differentiation of high-quality development in China. Financ. Econ. 2021, 5, 68–76. [Google Scholar] [CrossRef]
  58. Zhang, K.J.; Yu, F.W.; Li, F.D. Coupling coordinated development of rural informatization, agricultural industrialization, and rural ecologicalization in China. China Popul. Resour. Environ. 2023, 6, 182–195. [Google Scholar]
  59. Hao, J.J.; Zhang, P.; Yu, W.; Mou, X.Q. Causes of Spatial Patterns of Livability in Chinese Cities: MGWRL Analysis Based on Didi's Big Data. J. Urban Plan. Dev. 2021, 147, 04021025. [Google Scholar] [CrossRef]
  60. Yin, X.S.; Hussain, J.; Kui, Z. The Spatial Distribution Pattern and Formation Mechanism of the Spatial Agglomeration of Chinese Higher Education Population: A Cross-Province Comparison. Appl. Spat. Anal. Policy 2022, 15, 315–338. [Google Scholar] [CrossRef]
  61. Wan, J.L.; Liu, Y.F.; Chen, Y.Y.; Hu, J.M.; Wang, Z.Y. A Tale of North and South: Balanced and Sustainable Development of Primary Education in Ningxia, China. Sustainability 2018, 10, 559. [Google Scholar] [CrossRef]
  62. Lai, X.Q.; Chen, R.H. On the Dynamic Evolution and Trend Prediction of Resource Investment in Rural Preschool Education: On the Basis of Kernel Density Estimation and Markov Chain Method. Educ. Res. Mon. 2022, 5, 19–28. [Google Scholar] [CrossRef]
  63. Yu, X. Regional Difference, Dynamic Evolution and Trend Forecast of the Allocation of Regular Senior Secondary School Education Resources in China. Educ. Econ. 2021, 3, 59–69. [Google Scholar]
  64. Huang, H.Y.; Wang, F.R.; Song, M.L.; Balezentis, T.; Streimikiene, D. Green innovations for sustainable development of China: Analysis based on the nested spatial panel models. Technol. Soc. 2021, 65, 101593. [Google Scholar] [CrossRef]
  65. Song, X.Q.; Deng, W.; Liu, Y. Spatial spillover and the factors influencing public service supply in Sichuan province, China. J. Mt. Sci. 2014, 11, 1356–1371. [Google Scholar] [CrossRef]
  66. Ye, J.Z. Stayers in China’s “hollowed-out” villages: A counter narrative on massive rural-urban migration. Popul. Space Place 2018, 24, e2128. [Google Scholar] [CrossRef]
  67. Zhang, P.; Bu, Z.Z.; Wang, Y.Q.; Hou, Y.L. Education outlay, fiscal transfer, and inter-region funding equity: A county-level analysis of education finance in China. J. Chin. Gov. 2016, 1, 591–610. [Google Scholar] [CrossRef]
  68. Vincent, R.C.; Kwadwo, V.O. Spatial interdependence and spillovers of fiscal grants in Benin: Static and dynamic diffusions. World Dev. 2022, 158, 106006. [Google Scholar] [CrossRef]
  69. Collantes, F. Rural Europe reshaped: The economic transformation of upland regions, 1850–2000. Econ. Hist. Rev. 2009, 62, 306–323. [Google Scholar] [CrossRef]
  70. Zhao, D.; Parolin, B.J.T.A.-P.E.R. Merged or unmerged school? School preferences in the context of school mapping restructure in rural China. Asia-Pac. Educ. Res. 2014, 23, 547–563. [Google Scholar] [CrossRef]
  71. Chen, F.Y.; Chen, C. The evolutionary trajectory of the rural settlements in Southern Jiangsu in the past 20 years: From the perspective of urbanization and land use. J. Geogr. Sci. 2024, 34, 1615–1635. [Google Scholar] [CrossRef]
  72. Wang, X.B.; Huang, J.; Zhang, Z.F. Does County Urbanization Exacerbate Landscape Fragmentation of Cultivated Land: Based on an Empirical Analysis of 1 934 Counties in China. China Land Sci. 2024, 6, 88–98. [Google Scholar]
  73. Miao, X.R.; Han, J.Q.; Wang, S.P.; Li, X.Y. Spatial effects of market integration on the industrial agglomeration of agricultural products: Evidence from China. Environ. Sci. Pollut. Res. 2023, 30, 84949–84971. [Google Scholar] [CrossRef]
Figure 1. Spatial scope of the study area.
Systems 12 00517 g001
Figure 2. The systematic process of rural education development.
Systems 12 00517 g002
Figure 3. Evaluation results of China’s rural education development index (2006–2020).
Systems 12 00517 g003
Figure 4. Spatial–temporal pattern of rural education development levels (2006–2020).
Systems 12 00517 g004
Figure 5. Spatial pattern of cold and hot spots in rural education development (2006–2020).
Systems 12 00517 g005
Figure 6. Dynamic evolution trend of rural education (2006–2020).
Systems 12 00517 g006
Table 1. Rural education development evaluation index system.
DimensionElementIndicatorAttribute
Capital
investment
Average education investmentPublic funds for rural primary school education per student+
Public funds for rural junior high school education per student+
Relative education investmentRural primary school funding as a share of agricultural GDP+
Rural junior high school funding as a share of agricultural GDP+
School
facilities
School
buildings
School building area per student in rural primary schools+
School building area per student in rural junior high schools+
Informatization facilitiesNumber of computers per student in rural primary schools+
Number of computers per student in rural junior high schools+
Library
resources
Number of books per student in rural primary schools+
Number of books per student in rural junior high schools+
Teacher
resources
QuantityProportion of teachers and students in rural primary schools+
Proportion of teachers and students in rural junior high schools+
Academic qualificationsProportion of rural primary school teachers with college degree or above+
Proportion of rural junior high school teachers with college degree or above+
Professional
skills
Proportion of rural primary school teachers with intermediate or above professional titles+
Proportion of rural junior high school teachers with intermediate or above professional titles+
Education
quality
Educational foundationsProportion of rural students who have received preschool education+
Teaching organization modelsProportion of classes in rural schools that adopt the combined teaching model of multiple grades-
Educational outcomesProportion of students who completed compulsory education and entered general high schools+
Table 2. Global Moran’s I of rural education development from 2006 to 2020.
Year2006201120162020
Moran’s I0.1525530.0904530.0860210.008420
Z(I)3.9107932.8495632.7140522.851295
p0.0000920.0043780.0066470.004354
Table 3. Markov transition probability matrix of rural education development.
T/T + 1NLowMedium-LowMediumMedium-HighHigh
Low900.74440.25560.00000.00000.0000
Medium–Low900.00000.67780.32220.00000.0000
Medium880.00000.01140.68180.29550.0114
Medium–High780.00000.00000.01280.78210.2051
High740.00000.00000.00000.01350.9865
Table 4. Test of spatial econometric model.
Test MethodTest IndicatorStatistic Value
LM testLM-spatial lag337.682 ***
Robust LM-spatial lag298.993 ***
LM-spatial error138.858 ***
Robust LM-spatial error18.276 ***
LR testLR-spatial lag130.38 ***
LR-spatial error144.90 ***
Wald testWald-spatial lag136.44 ***
Wald-spatial error127.19 ***
Hausman testHausman-random effect184.88 ***
*** is significant at the level of 1%.
Table 5. Regression results of dual-fixed-effect space Durbin model.
VariablesRural Education Development
CoefficientZ-Value
ES0.0676 ***2.60
FR0.0272 *1.77
IS−0.633 ***−5.85
PD0.720 ***2.86
UL−0.440 ***−4.72
W × ES−0.176 ***−4.42
W × FR0.0685 ***3.21
W × IS−0.166−0.73
W × PD1.0771.60
W × UL1.561 ***9.79
ρ0.149 **2.47
Sigma2_e0.000776 ***14.13
Observations450
R20.39
Time/Region fixedYes
Log-Likelihood 888.4389
***, **, and * are significant at the level of 1%, 5%, and 10%, respectively.
Table 6. Decomposition of spatial effects of influencing factors.
VariablesDirect EffectIndirect Effect
CoefficientZ-ValueCoefficientZ-Value
ES0.0621 **2.40−0.192 ***−4.26
FR0.0292 **1.970.0846 ***3.61
IS−0.631 ***−5.98−0.291−1.22
PD0.766 ***3.191.283 *1.83
UL−0.385 ***−4.241.711 ***10.27
***, **, and * are significant at the level of 1%, 5%, and 10%, respectively.
Disclaimer/Publisher’s Note: The statements, opinions and data contained in all publications are solely those of the individual author(s) and contributor(s) and not of MDPI and/or the editor(s). MDPI and/or the editor(s) disclaim responsibility for any injury to people or property resulting from any ideas, methods, instructions or products referred to in the content.

