Article

Postal Digital Transformation Dynamics—A System Dynamics Approach

by
Kgabo Mokgohloa
1,*,
Mukondeleli Grace Kanakana-Katumba
2,
Rendani Wilson Maladzhi
3 and
Sbusiso Xaba
4
1
Department of Industrial Engineering, University of South Africa, Florida 1958, South Africa
2
Faculty of Engineering and the Built Environment, Tshwane University of Technology, Pretoria 0001, South Africa
3
Department of Mechanical Engineering, Durban University of Technology, Durban 4000, South Africa
4
Centre of Excellence, South African Post Office, Pretoria 0001, South Africa
*
Author to whom correspondence should be addressed.
Systems 2023, 11(10), 508; https://doi.org/10.3390/systems11100508
Submission received: 6 August 2023 / Revised: 28 September 2023 / Accepted: 7 October 2023 / Published: 10 October 2023

Abstract

:
The key motivation of the study was to explore and enlarge our understanding of the factors that inhibit and drive the performance of the postal sector in a dynamic setting in the context of Southern Africa. This study was prompted by the unsatisfactory performance of the postal sector in Southern Africa as measured by the Integrated Index on Postal Development (2IPD), an index used by the Universal Postal Union to measure the performance of posts across the globe on dimensions of reliability, resilience, reach, and relevance. Postal operators across the world are faced with inescapable business model disruptions steered by the digital era, and Southern Africa is not an exception. System dynamics was adopted as a modelling approach to simulate the interaction of the stocks (digital culture, operations capability, adoption, and financial performance). The system dynamics approach revealed that the postal sector can be described as a complex phenomenon due to intricate interdependent variables that interact in a dynamic setting. The complex nature of the postal sector is further amplified by multiple feedback systems of non-linear relations. The results of the study point to the complex interaction of these variables that inhibit and drive the digital transformation and competitiveness of the postal sector. It is by grasping these complexities that decision-makers and policymakers can exploit the insights revealed by this research to direct the postal sector toward a sustainable future.

1. Introduction

The digital age has triggered the postal sector across the globe to enlarge its services well beyond the original service of the Designated Postal Operators (DPOs), which is the distribution of physical mail items. The Universal Postal Union (UPU) (2017) contends that although some DPOs in several countries across the world struggle with financial turmoil, there are DPOs that are effectually competing at an international level and are financially sustainable. There have been ubiquitous moves toward digital technologies throughout the world, which in turn has led to digitalization across industries, including the postal industry [1]. The UPU (2018) suggests that societal configuration is rapidly shifting, and the digital age has driven changes in the way that society consumes products and services. This shift has led to the progression of the client of the future with exceptional requirements and expectations that the postal sector ought to meet [2].
However, according to the UPU (2018), the majority of DPOs are poorly performing on the Integrated Index for Postal Development (2IPD). The UPU (2018) proposes that the measurement of multiple dynamics of postal development is a complex task and theorizes that, to overcome this challenge, the Universal Postal Union (UPU) has been leveraging a wealth of vast data to appraise the performance of DPOs worldwide. One of the major outcomes of these efforts, it argues, was the creation of the Integrated Index for Postal Development or 2IPD [2]. According to the UPU (2018), the 2IPD measures the performance of Pos in the four vital dimensions of postal development, which are reliability, reach, relevance, and resilience [3].
The UPU (2019) explains the four dimensions as follows. (a) Reliability is a composite of excellence of service performance, including certainty of service across all classes of the postal delivery service, with a focus on national and incoming streams of the postal delivery process; it ultimately measures the level of postal operational efficacy. (b) Reach is a composite of global postal connectedness at a transnational level across all types of international postal delivery services; it ultimately measures the level of internationalization of postal services. (c) Relevance comprises the strength of demand for the full range of postal services in each postal segment, including mail, logistics, and financial services; it ultimately measures the level of attractiveness in all main markets. (d) Resilience comprises the capacity to innovate, deliver inclusive postal services, and integrate sustainable development targets in postal business models; it ultimately measures the level of flexibility of postal business models [4].
The UPU’s 2021 Integrated Index for Postal Development (2IPD) presents a complete view on current global postal development. Relying on a unique combination of postal big data and statistics made available by 172 countries, it paints a picture of an asymmetric state of postal development across the world. A clustering analysis reveals that a relatively large number of countries are classified in the low or lower-middle postal development groups, highlighting significant postal service development gaps between nations. The report highlights six top-performing countries on the 2IPD index and their respective scores: Switzerland (100), Germany (97), Austria (96.8), France (92.2), Japan (91.7), and China (91.1) [5]
The globe is changing at a fast pace and industries must keep abreast with changing technological landscapes, ever-changing customer requirements, and changing regulatory regimes. The postal sector is not immune to these dynamics and these changing landscapes have obligated posts around the globe to move beyond their traditional service of merely delivering mail and diversify into other avenues as the technologies of the 21st century continue to disrupt business models. Mutingi and Matope (2013) contend that the management of technology innovation and adoption is a complex undertaking as inhibitors and promoters dynamically interact, and, therefore, comprehending the interaction and effects of these dynamics is imperative [6].
These complexities could result in poor or no adoption of technology and innovation diffusion in the organization and could further pose a risk to the sustainability of the postal sector. The entire posts in Southern Africa stand to gain if these dynamics are well managed and technology that is appropriate to Southern African conditions is adopted to guarantee the sustainability of the posts. The calamities that have befallen DPOs in Southern Africa have triggered the near collapse of the sector owing to poor performance on the 2IPD. This is supported by the score of each post in Southern Africa obtained on the 2IPD.
The objectives of this research study are the following:
  • Develop a system dynamics conceptual model of intermingling digital dynamics (variables);
  • Analyze and design policy interventions to ensure the financial sustainability of the postal sector in Southern Africa.
The research questions that translate from the above objectives for this study are as follows:
  • How do these variables interact with each other in a dynamic setting?
  • What policy designs can be derived from the resulting model to aid policymakers and DPOs in Southern Africa to better manage the digital transformation, to deliver value to society and contribute to the financial sustainability of the postal sector?

2. Literature Review

The Universal Postal Union (UPU) (2018) argues that as society adopts the use of digital technologies at an exponential rate, clients are progressively expected to interrelate directly with the post through digital channels. Subsequently, 73% of posts have augmented their investment in digital postal services. Consequently, it is expected that the postal landscape will develop in several directions [3]. The UPU further proposes that posts are consequently at a crossroads; posts are required to adjust to remain relevant and gear up to compete with digitally native organizations in various markets [4]. To contest the market efficiently, posts need to accelerate the digitalization of their processes, products, and services. This means that DPOs that have not fully transformed their organizations from the perspective of digitalization are required to act with a sense of urgency or face the prospect of exclusion as providers of e-government, e-commerce, and e-financial services.
The United States Postal Service (USPS) (2016) argues that the upsurge in digital technology over the past three decades has offered DPOs a mixed bag of both threats and opportunities. Digital innovation by posts in industrialized nations was prompted by the mail decline instigated by substitution, a requirement for cost efficiency, and a requirement to improve the quality of service. It has also offered prospects to streamline the postal business operating model to ensure sustainability and diversification to create new revenue sources [7].
Figure 1 depicts the waves of digital innovation that the postal sector has undergone. The different waves can be described as follows. (a) Postal automation, in which, in the 1990s, during the booming mail volumes, the digital efforts of posts were largely fixated on streamlining and automating mail centers. Track and trace, then an innovative technology, was initially introduced for high-end express items and then extended through large initiatives such as the intelligent mail barcode. Additionally, machines that sort standard letters and non-standard letters together into “postman walk” sequences have been fitted in mail centers. (b) Revenue-generating services in which most DPOs expected to substitute lost mail revenue with an income stream from digital services. DPOs were expected to manage electronic communications and transactions between governments, organizations, and citizens. DPOs were expected to accomplish this role due to their physical proximity to citizens and the government, as well as their reputation for confidence, dependability, and safety. A few posts have attained this vision. (c) Core digital enhancement, whereby broadband penetration and Internet use amplified in the early 2000s, and the efforts to digitalize the postal value chain intensified. The goal was to enable customer access to DPOs and develop novel services at the juncture of physical and cyber mediums. (d) Digital transformation, which denotes updates in technology, progression, culture, and operating models. For example, connectivity, the cloud, and data analytics can permit rapid innovation, more informed data-driven decisions, and quicker execution.
The UPU (2018) further suggests that drivers of digital innovation and digital inclusivity are (a) the network, (b) employees, (c) laws and regulations, (d) financial capacity, (e) political commitment and public trust in the post, and (f) national policy alignment [3].
The UPU (2018) proposes that integrated networks are crucial to providing digital services and addresses three foremost challenges: (a) accessibility, (b) affordability, and (c) eligibility [3]. Only 55% of global households have Internet access, while Africa as a continent stands at 22%, which is the lowest [8]. The UPU (2019) contends that in many of these nations, many users access the Internet from the workplace, public schools, colleges and universities, or other communal public networks outside the home; it proposes that this is an area in which DPOs could play a significant role, due to their geographic reach in all regions of countries, including rural areas, which are often neglected. This role played by DPOs will enable the integration of citizens with the services of e-government, e-commerce, and e-finance. The UPU (2019) highlights the top five obstacles to movement into digital posts in the top six industrialized countries and Africa, which are depicted in Table 1, which points to severe constraints in Africa. These constraints can be characterized as a lack of resources in the form of specialized skills to develop e-services, poor IT infrastructure, budgetary constraints, and the slow adoption and diffusion of digital technologies, triggered by a poor digital culture, which is the factor that drives digital transformation [4].
The UPU (2019) proposes that there are four fundamental, critical success factors for posts to advance digitalization, which are (a) complementing the DPOs with innovative digital services to expand their competitive advantage in terms of network size and density; (b) access to finances for digital initiatives; (c) partnerships, and (d) alignment with the national government’s digital strategies. The literature points out that the adoption of technology by organizations and DPOs is an intricate non-linear phenomenon with a variety of enablers and inhibitors. Adoption and diffusion enablers and inhibitors reveal that the dynamics interact in a complex and dynamic setting, which demands a holistic approach to managing the complex nature of the adoption and diffusion enablers and inhibitors that encompasses an examination of the interactions between adoption and diffusion barriers and drivers, as well as the management of the causal relationships between the drivers and barriers of the adoption and diffusion of technology/digitalization [4].

3. Research Methodology

Melnikovas (2018) proposes that one of the approaches to research methodology development is premised on the theoretical idea of the “research onion” advanced by Saunders et al. (2016). Melnikovas further refers to Raithatha (2017), who contends that the research onion offers a comprehensive illustration of the main steps that are to be followed to articulate a robust methodology [9].
The research onion defines explicitly the layers from an all-inclusive philosophical outlook to data collection procedures and data analysis tools. This research adopted an interpretivist philosophical worldview due to its many perspectives and complex interactions of variables; it further adopted an inductive research approach. The system dynamics research paradigm was adopted as a research strategy and a mixed method was adopted as a research choice. A longitudinal time horizon was adopted to enable the simulation of the model over a period; data analysis was carried out through mathematical expressions that defined the four stocks (digital culture, operations maturity, adoption, and financial performance) and their respective flows. The relations of the four dimensions to the 2IPD are articulated below.
Mokgohloa et al. [10], in their earlier research paper, developed ten dimensions that emerged after the saturation of data was reached through a thorough grounded theory (GT) technique. The ten dimensions that emerged during the GT process were (i) digital culture, (ii) digital investments, (iii) operational excellence, (iv) ecosystem capability, (v) adoption, (vi) competitiveness, (vii) digital capabilities, (viii) shared vision, (ix) customer insights, and (x) diverging interests. The ten dimensions are essential for the postal sector to improve its performance on the Integrated Index for Postal Development under the auspices of the Universal Postal Union, a United Nations agency for postal services. The Integrated Index on Postal Development (2IPD) is a composite stock that accumulates or depletes over time and integrates three of the seven dimensions, which are digital investments, operational excellence, and digital capabilities, and can be aggregated under the operations capability maturity stock. The next aggregation comprises digital culture, which incorporates the shared vision dimension, and the competitiveness dimension resulted in the emergence of the financial performance stock. The dimension of adoption translates to the adoption stock. Two of the dimensions are exogenous to the system and therefore are outside the boundaries of the model: these are the digital ecosystem and customer insights. Diverging interests are represented by inhibiting factors that will be articulated in the stocks and flow.

3.1. System Dynamics as Research Strategy

System Dynamics Principles

Sterman (2002) contends that, more often, well-intentioned energies to resolve persistent difficulties create unforeseen side effects. Actions taken from decisions made provoke unforeseen reactions. The result is policy resistance, which can be defined as the propensity for interventions to be conquered by the response of the system to the intervention itself. System dynamics is better positioned to counter this blind spot that characterizes human mental models that prove inadequate due to the inability to see the whole [11].
System dynamics modelling arose from ground-breaking work at MIT in the 1950s by Jay Forrester [10]. Richardson (2011) notes that Forrester, in his ground-breaking article in the Harvard Business Review (Forrester, 1958), put forward an initial statement of the approach that would, in time, become known as system dynamics. Richardson (2011) argues that Forrester (1958) fashioned the method on what were then four interesting advances: (a) progress in computing technology, (b) growth and skill with computer simulation, (c) enhanced comprehension of strategic decision making, and (d) advances in the comprehension of the role of feedback in complex systems [12]. Richardson (2011) lastly notes that Forrester (1958) devised the four fundamentals of industrial dynamics:
  • The concept of feedback systems;
  • A familiarity with decision-making processes;
  • The investigational model approach to complex systems;
  • The digital computer simulates a plausible mathematical model.
Maldonado et al. (2017) concur with Richardson (2011) and suggest that system dynamics modelling has been advanced as an approach and technique to (a) provoke such feedback loops to determine the main growth, balancing, and decay (stagnation) dynamics that drive the behavior of socio-economic systems; (b) to inspire the system’s dynamic behavior through the application of differential equations; and (c) to examine and design improved policies that will result in enhanced system performance [13]. Maldonado et al. (2017) further propose that the modelling process in system dynamics is grounded on iteration between all five stages: (a) problem articulation, (b) dynamic hypothesis, (c) model formulation, (d) model testing and validation, and (e) policy analysis and design.
Sterman (2002) contends that modelling is a feedback process and not a series of linear steps, and that models undergo constant iterative, persistent questioning, testing, and enhancement. Sterman contends that the modelling process is a reiterative cycle. In this reiterative cycle, the initial purpose defines the limits and scope of the modelling application and frames what could be learned from the process of modelling through feedback to streamline a basic comprehension of the problem and the aim of the modelling effort. Iteration can occur from any step to any other step. In any modelling project, one will iterate through these steps many times [14].

3.2. System Dynamics Approach in Technology Adoption

Maldonado et al. (2017) note that the dynamics of innovation and technology adoption have been modelled employing system dynamics and propose that, according to these SD models, diffusion processes are characterized by non-linearity as innovations are communicated through certain channels over time. The initial category to adopt a novel innovation is innovators in the context of the research undertaken by Rogers (1962), and they are followed by imitators at different levels of the product life cycle, ranging from the early majority to laggards [13].
Sterman (2002) notes that the rate of probability of adopting an innovation follows a contagion process, analogous to epidemics, and that the demand by innovators intensifies sales and diminishes the potential market (or potential adopters) as they have become “infected”; as the proportion of “adopters” surges, the demand by imitators increases as well, boosting the total demand and sales and reducing the potential market. The adoption process depends on numerous aspects, beyond “social imitation”, including the supply side, the demand side, and the institutional side [14].
Sterman (2002) further contends that the behavior of a system ascends from its structure. This structure consists of the feedback loops, stocks, and flows, as well as the non-linearities formed by the interplay of the physical and institutional structure of the system with the decision-making processes of the players acting within the system [14].
Mokgohloa et al. (2020) argues that in contrast to a dynamic environment characterized by “causality”, which is the core idea of a systems thinking approach, traditional technology adoption models are characterized by “linearity”, which is the antithesis. A linear approach to digital transformation and technology adoption is ineffective in the postal industry due to the several players and their frequently conflicting interests [15]. A systemic approach is therefore necessary. Chen (2011) proposes that the adoption of new technologies is the consequence of intricate interactions and feedback taking place in a dynamic context. Adoption is a widespread practice that spans many organizations. It involves intricate exchanges and feedbacks between businesses, IT companies, decision-makers, and policymakers [16].
The postal industry in Southern Africa is a good candidate for a system dynamics approach to technology adoption due to mandates and policies at international, continental, regional, and national levels, and interests from various stakeholders, such as governments, regulators, unions, management, and society at large, with opposing interests in a dynamic setting. Therefore, system dynamics modelling is relevant in modelling the technology adoption and digital transformation drivers and barriers in the postal sector in Southern Africa, and the postal sector in developing countries at large. System dynamics was preferred as the modelling approach in this research mainly due to insights gained from the literature review. The adoption and diffusion processes can be compared to the contagion process, which is complex [9] in nature because the adoption and diffusion process, especially in the highly regulated postal sector in Southern Africa, can be viewed as a complex phenomenon buttressed by multiple stakeholders with competing interests, operating in an environment with respective inhibitors and enablers that interplay in a dynamic setting; a dynamic hypothesis for the postal industry in Southern Africa is presented in the following section.
Before the discussion of the simulation results, this paper first delves into the dynamic hypothesis, the stocks and flows of the model, and model verification and validation, which lay the foundation for the simulation process and its subsequent results. The simulation results immediately follow the results and discussion of the model verification and validation. The delta T that was used in the simulation traces was 0.001, which is the fraction of the model time unit and was used to set how often differential and complex equations were recalculated during the model run.

3.3. Dynamic Hypothesis

Figure 2 hypothesizes that the postal sector’s financial performance will improve with the adoption of the UPU digital ecosystem by its key clients. The theory goes on to suggest that leadership actions have an impact on potential adopters, which will increase adoption rates and turn potential adopters into adoptees. As more people adapt, the momentum will be sustained through formal and informal communication channels, enhancing the digital culture, operations capacity maturity, and the financial performance of the postal industry. Adopters leaving the system due to dissension or conflicting interests will lower adoption rates and result in a positive feedback loop that must be prevented from developing.

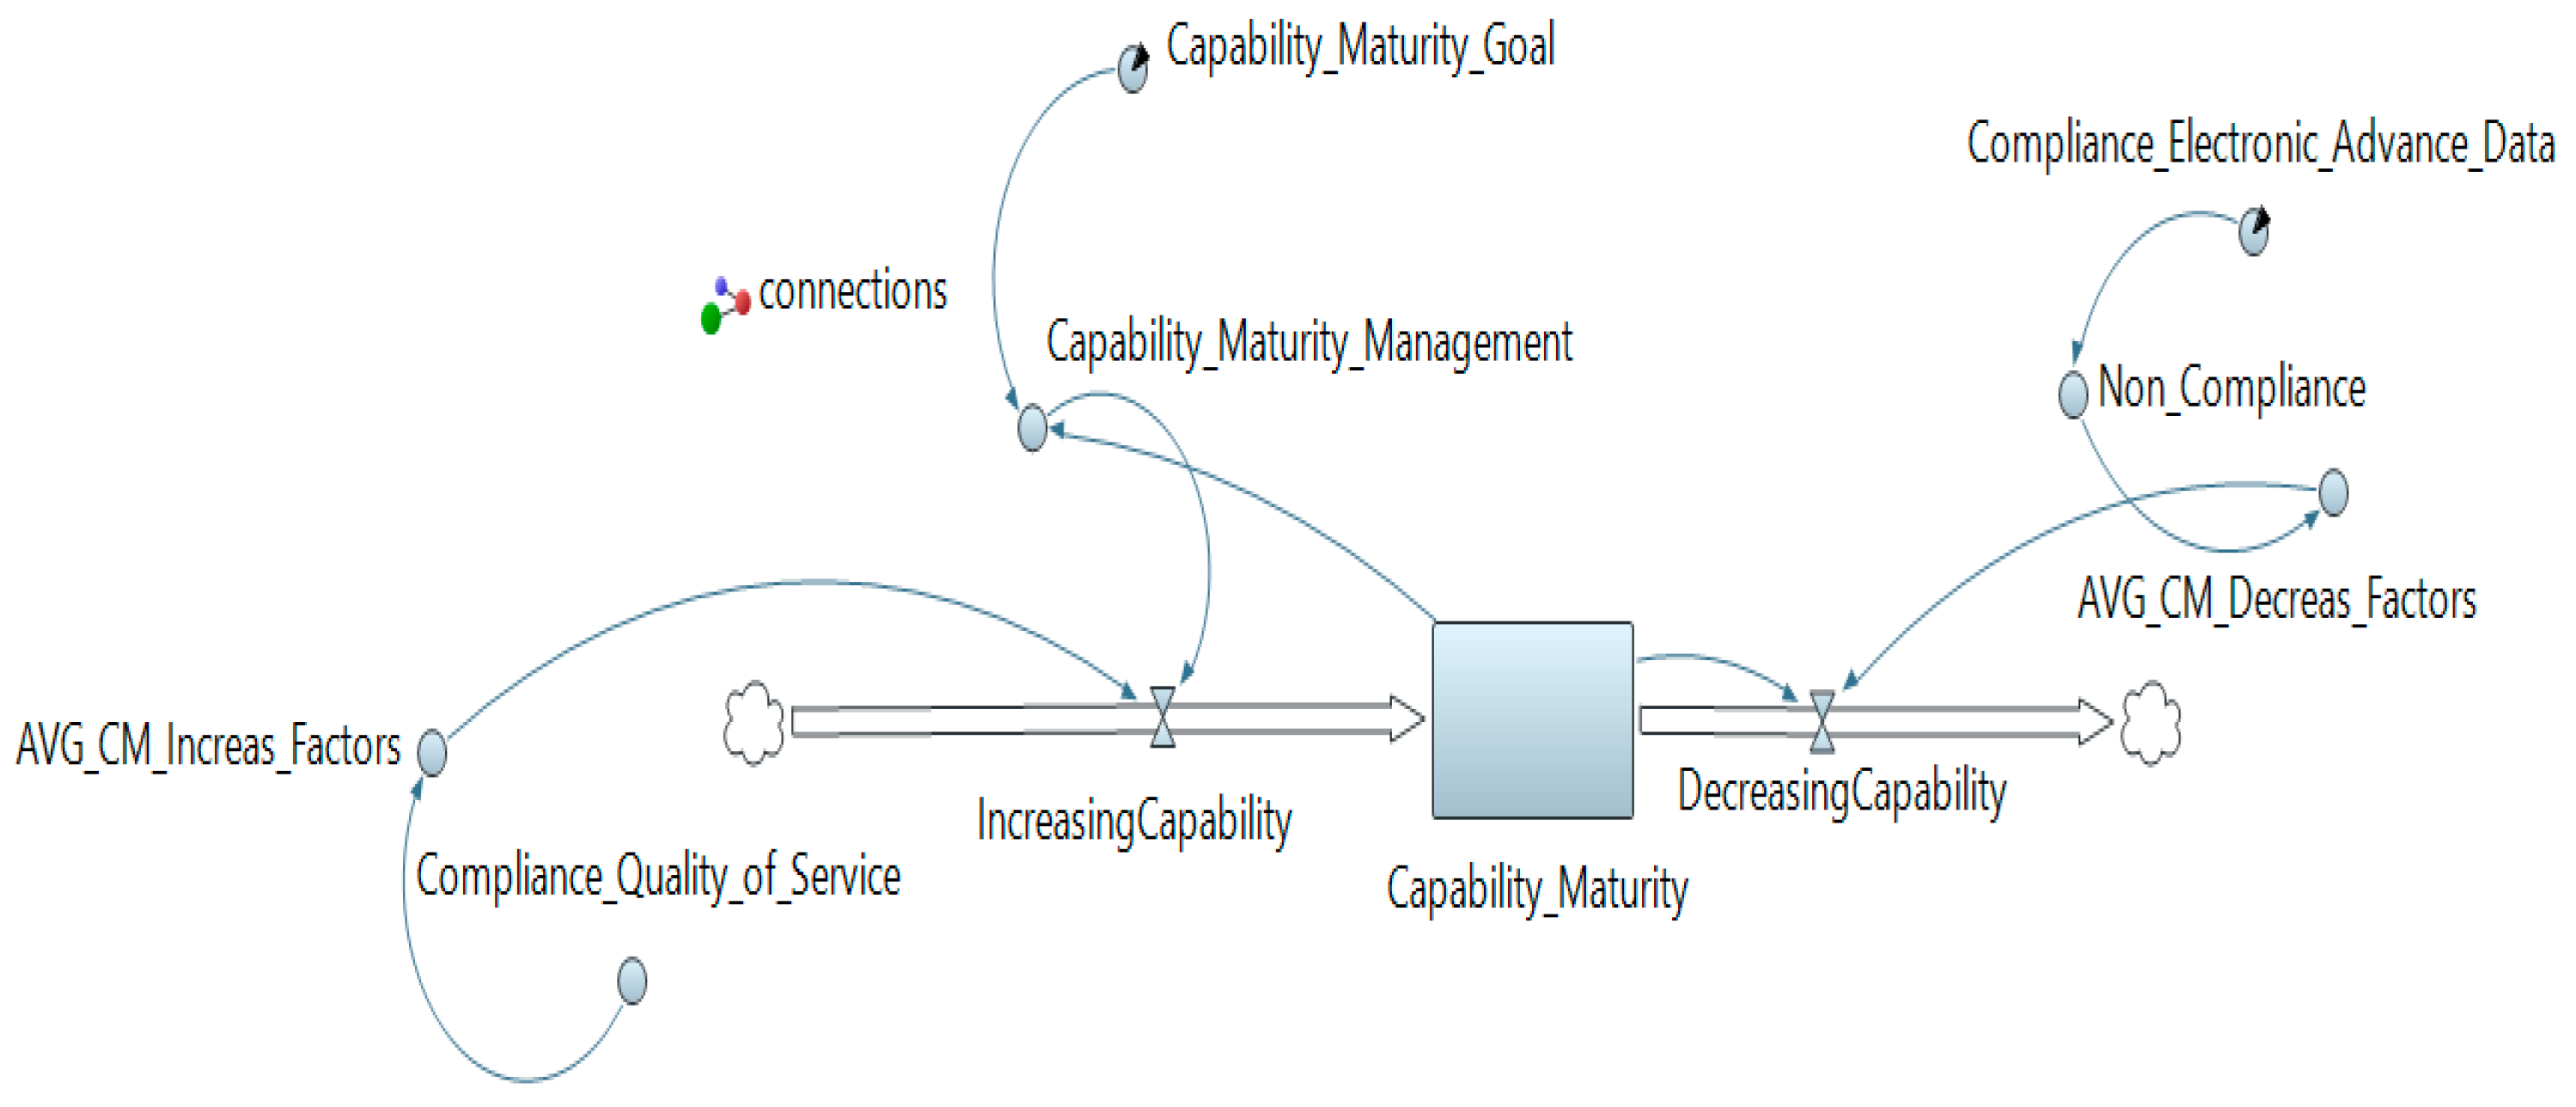
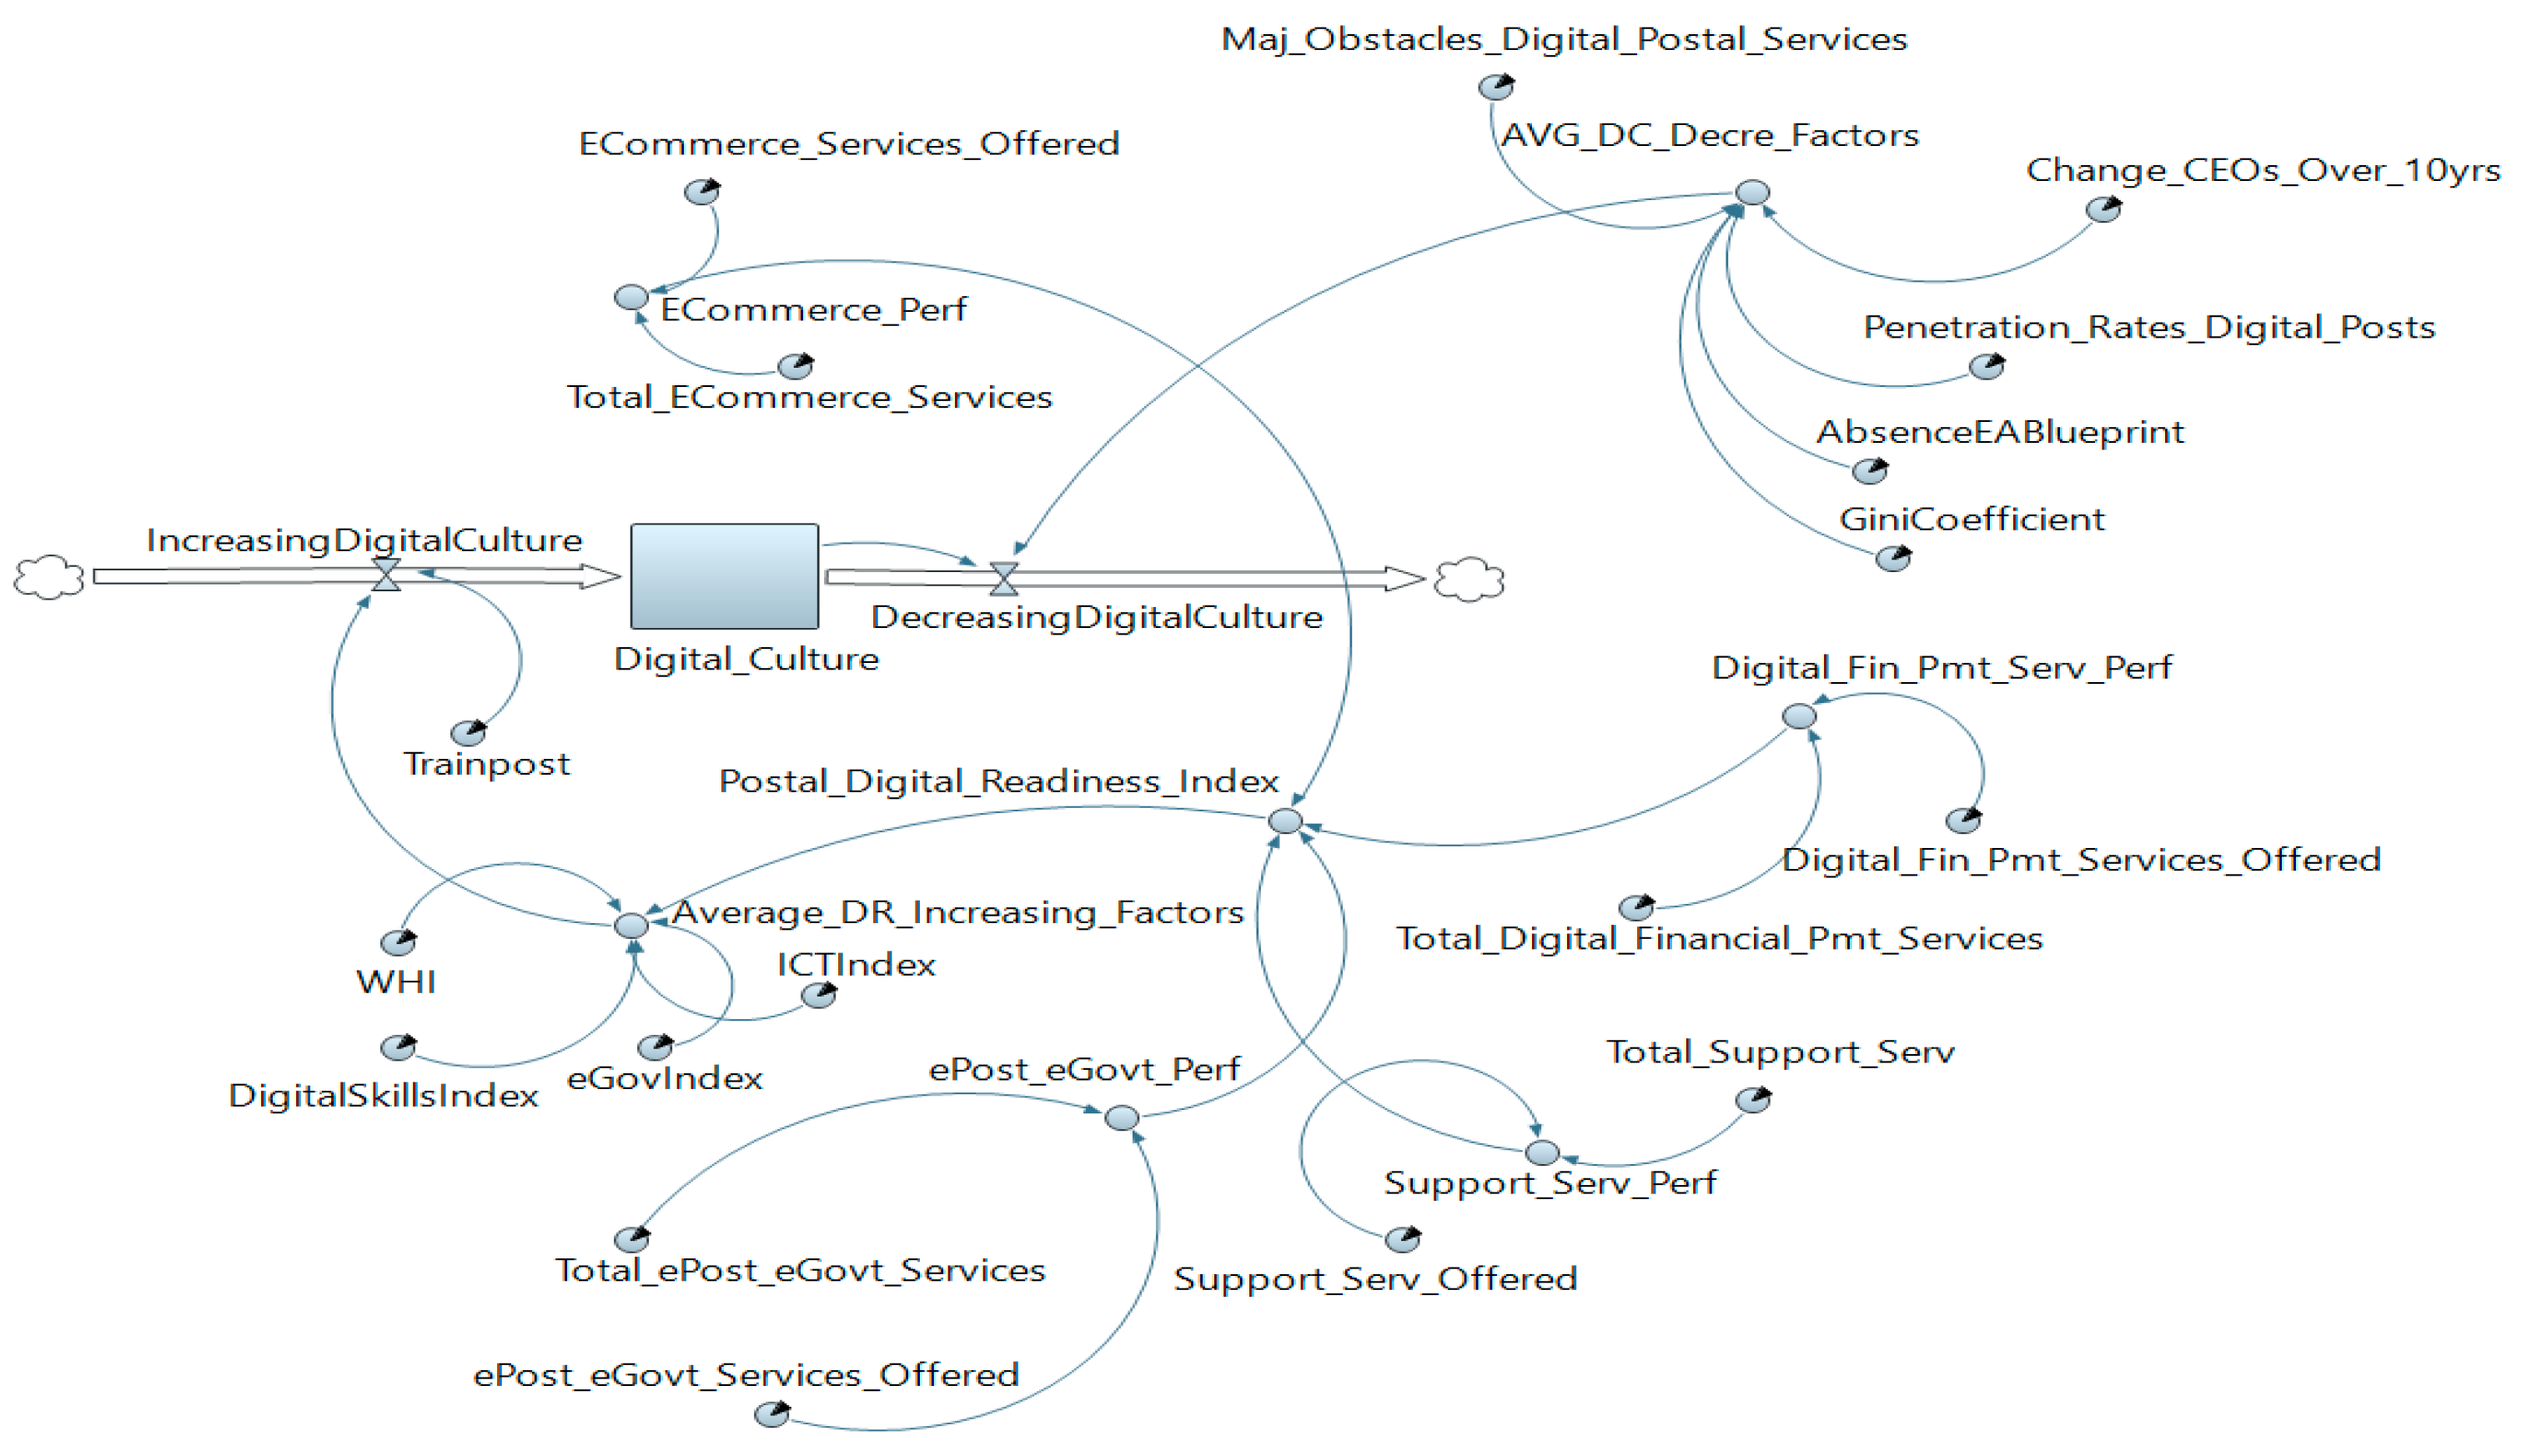
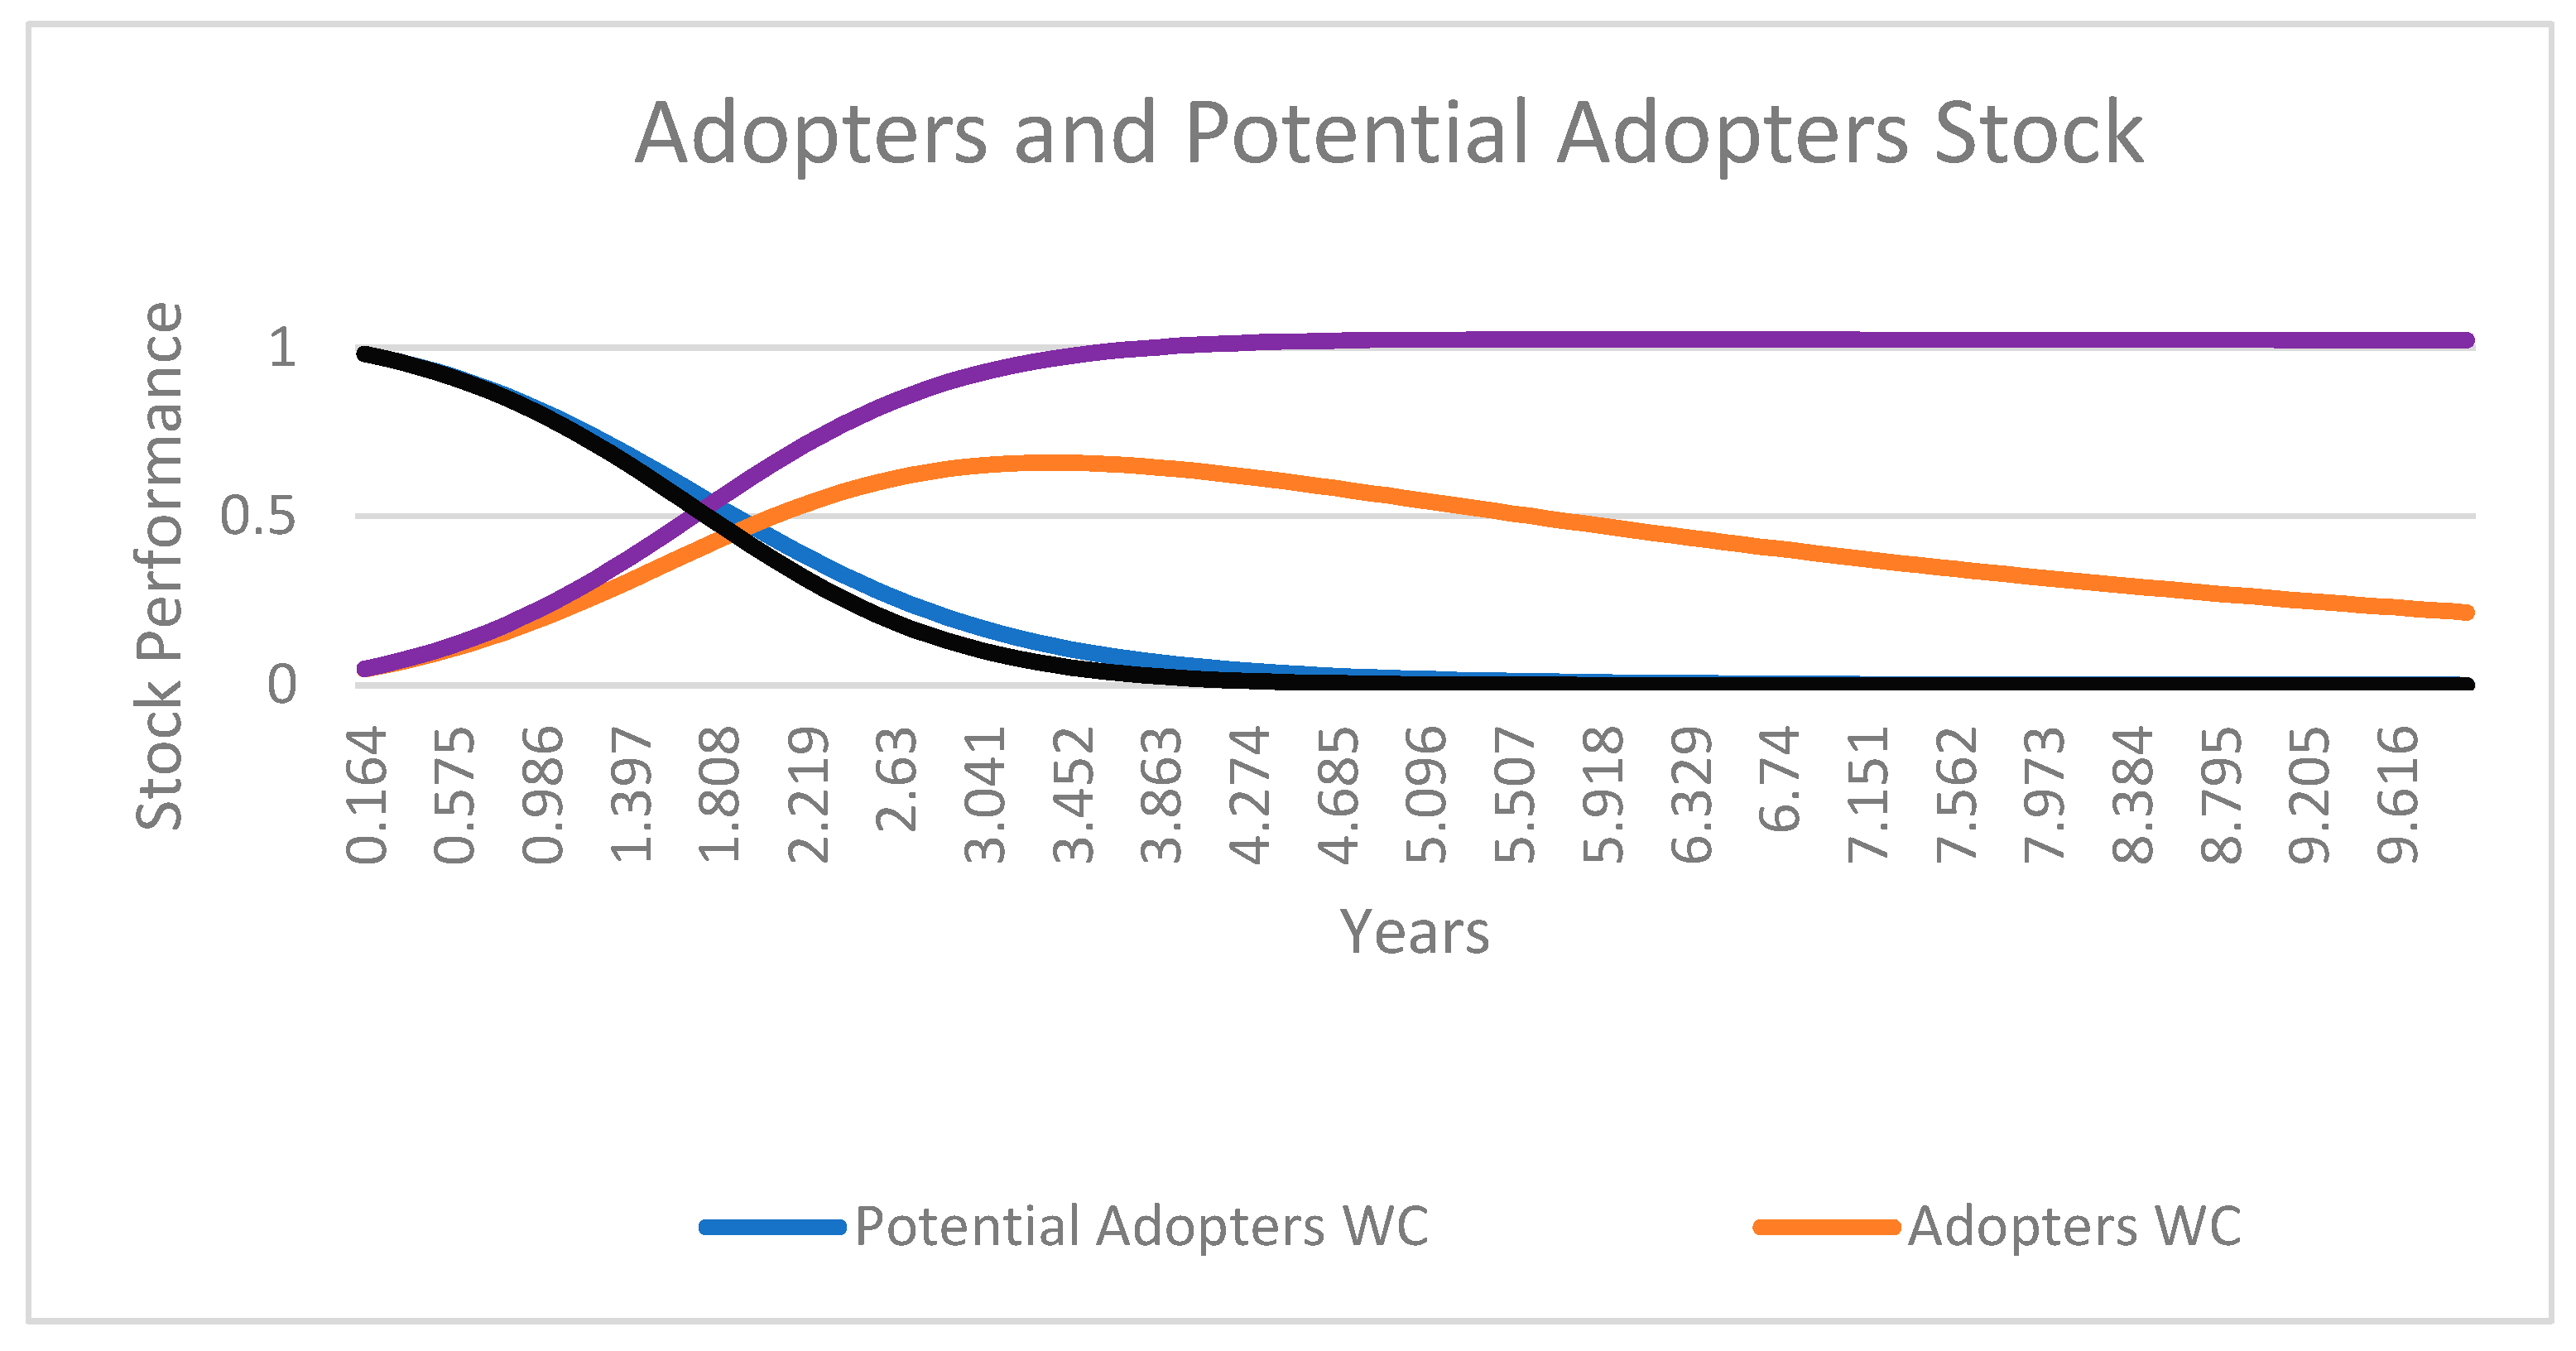
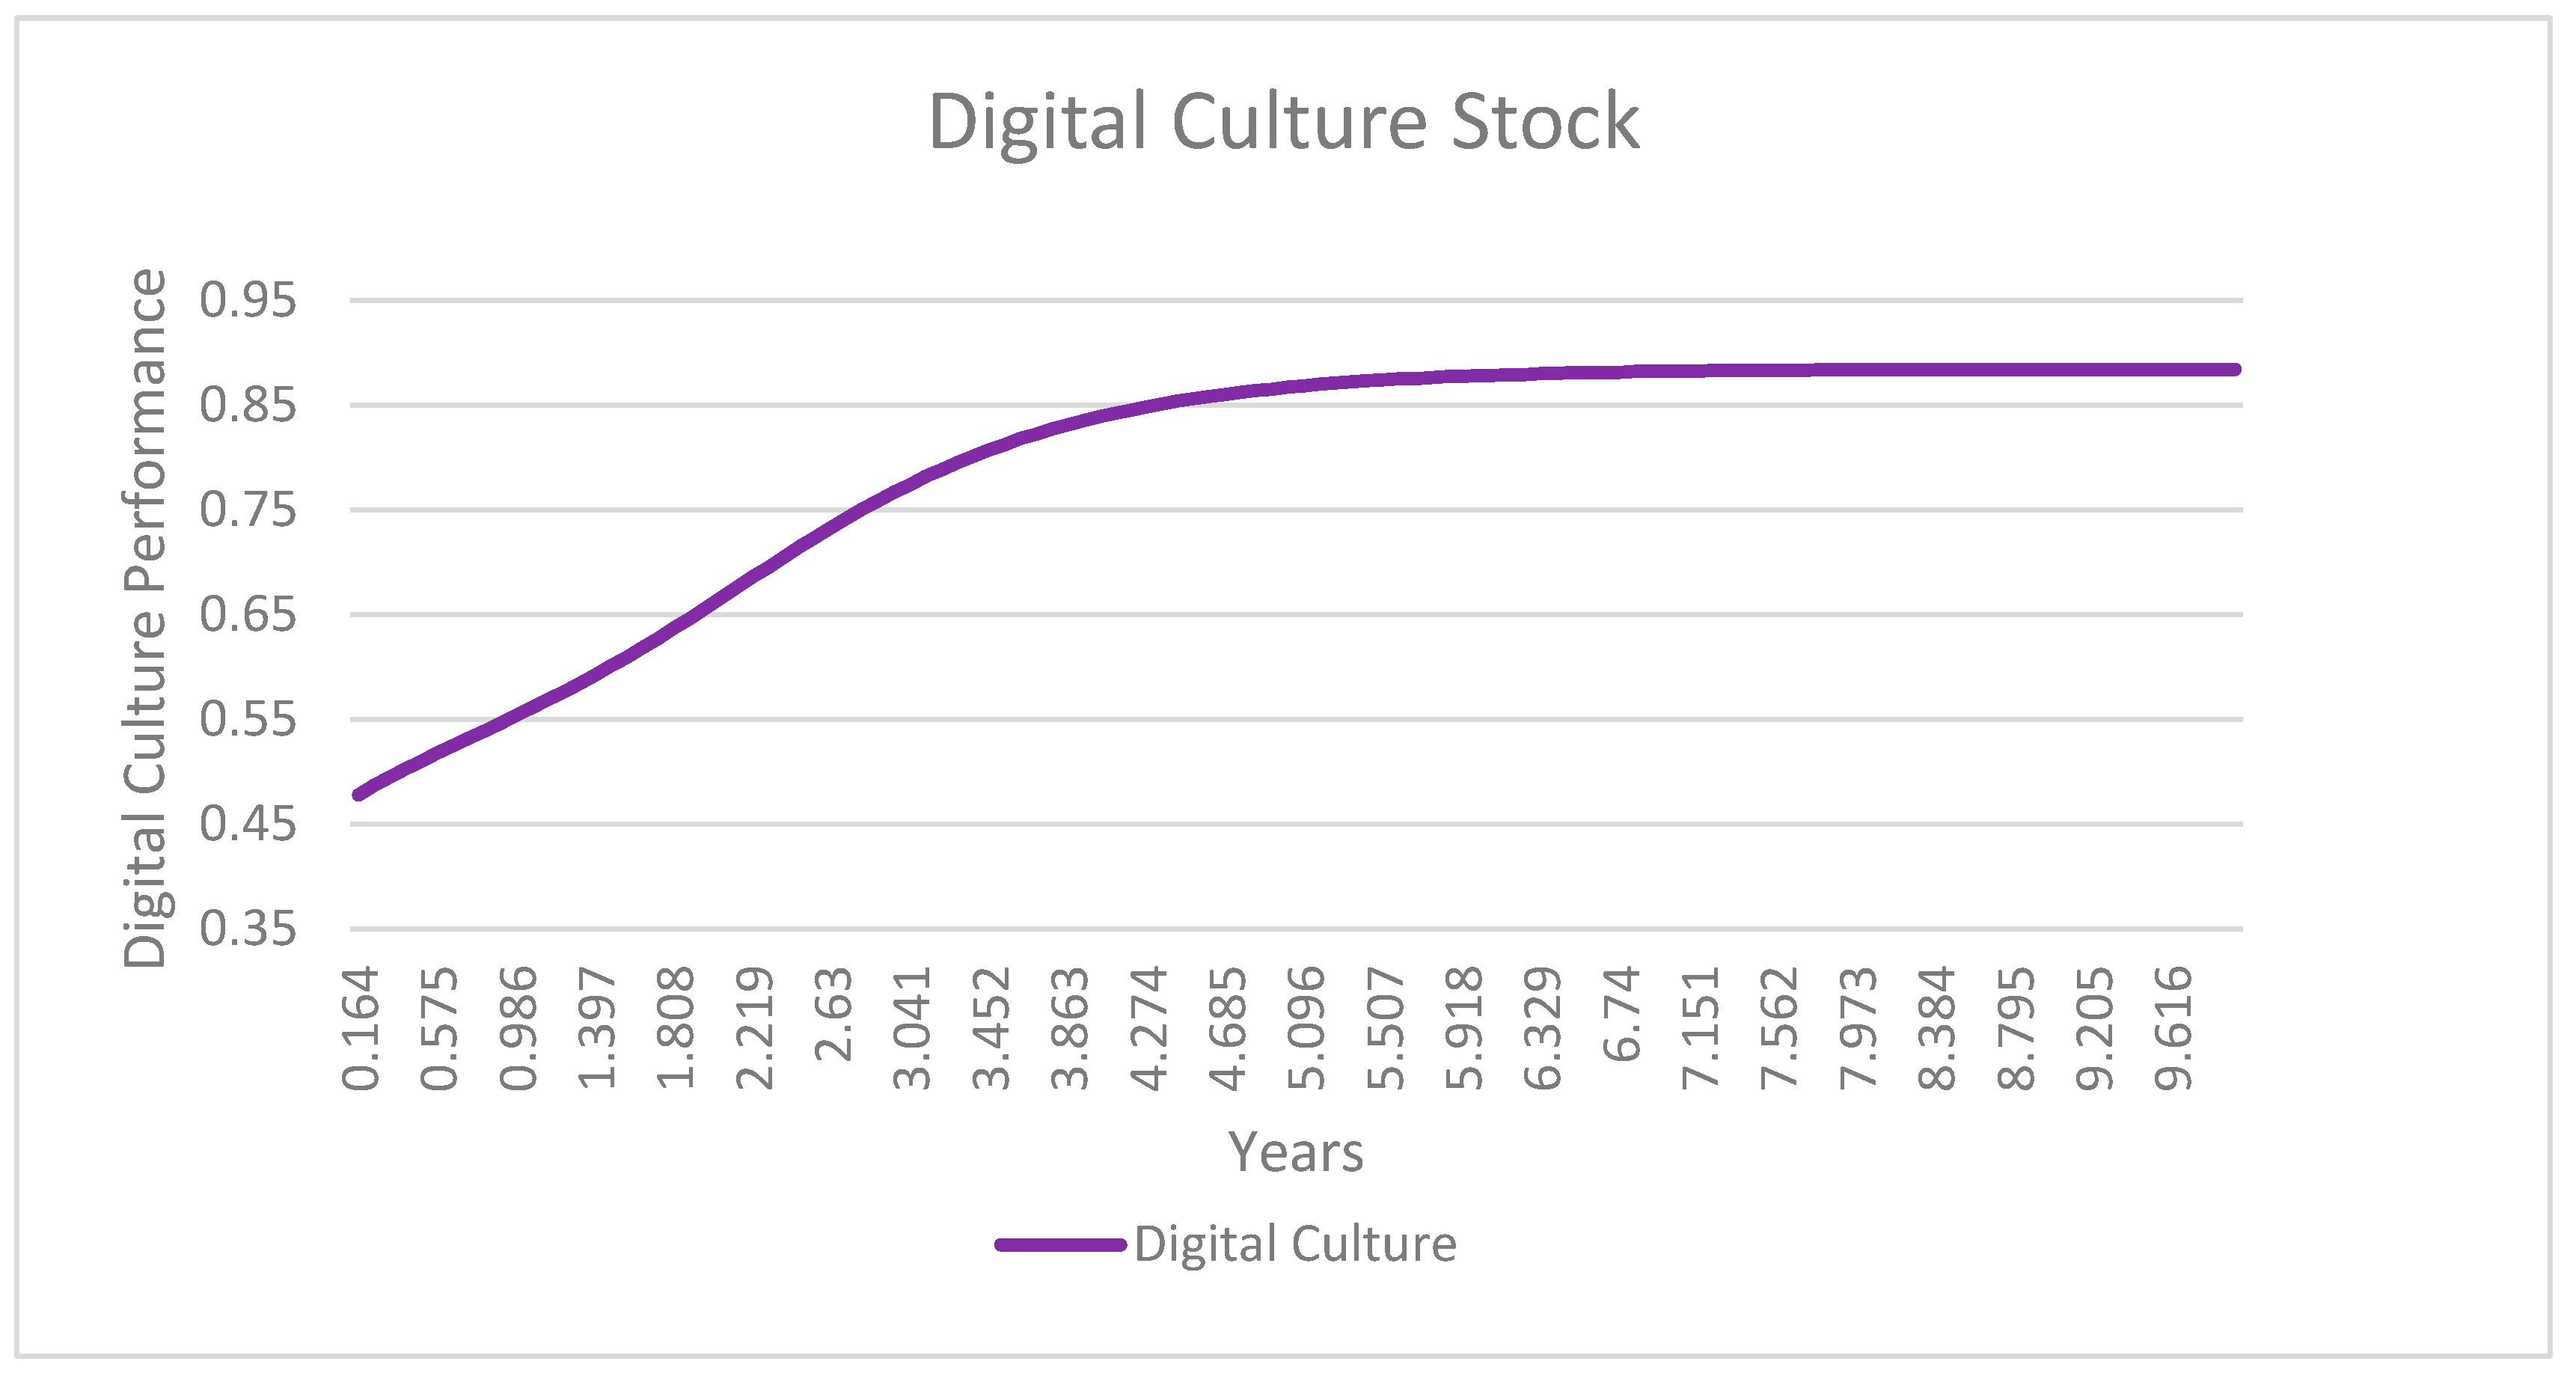
3.4. Stocks and Flows of the Model

The stocks and flows that are grounded in the dynamic hypothesis depicted in Figure 2 are depicted in Figure 3, Figure 4 and Figure 5. The Anylogic PLE software version 8.8.3 was used to develop the structure of the model and formulate the mathematical expressions that governed the model behavior to mimic real-life situations. The stocks are (i) capability maturity, which is related to the four dimensions of the Integrated Index on Postal Development (2IPD), which are resilience, reach, reliability, and relevance; (ii) digital culture; (iii) adoption, which is related to the digital transformation dynamics articulated in the literature review; and (iv) financial performance (competitiveness), which is related to the 2IPD. The South African Post Office was selected to test and validate the model and, as a result, the data that were used to quantify the variables were sourced from the South African Post Office. The operations capability stock, as depicted in Figure 3, articulates the construction of the goal-seeking structure in the Anylogic simulation software, as well as the balancing influence loop from diverging interests (non-compliance to electronic advance data). It comprises a single stock, which is the operations capability maturity, which accumulates capability components over time, based on its flows, increasing capability, and decreasing capability. It is conceptually correct to assure that the model is rationally accurate, which means that each flow should increase or deplete the capability maturity “stock” with “units” or components over time.
Figure 4 depicts the construction of the s-shaped growth structure for digital culture in Anylogic, as well as the unsought balancing influence from diverging interests. The structure comprises one stock, which is digital culture. The digital culture stock has two flows connected to it, which are an influx (increasing digital culture) and a discharge (decreasing digital culture). The digital culture stock accrues units of digital culture, and the two flows move units of digital culture/units of time into and out of the stock.
Lastly, Figure 5 depicts the construction of the s-shaped growth structure for adoption in Anylogic, as well as the unsought balancing influence from dis-adoption due to adopters dropping out and ceasing to use the ecosystem. The structure comprises two stocks, which are (i) potential adopters and (ii) adopters. The digital culture stock has two flows connected to it, which are an influx (increasing digital culture) and a discharge (decreasing digital culture). The digital culture stock accrues units of digital culture, and the two flows move units of digital culture/units of time into and out of the stock.

4. Findings and Discussion

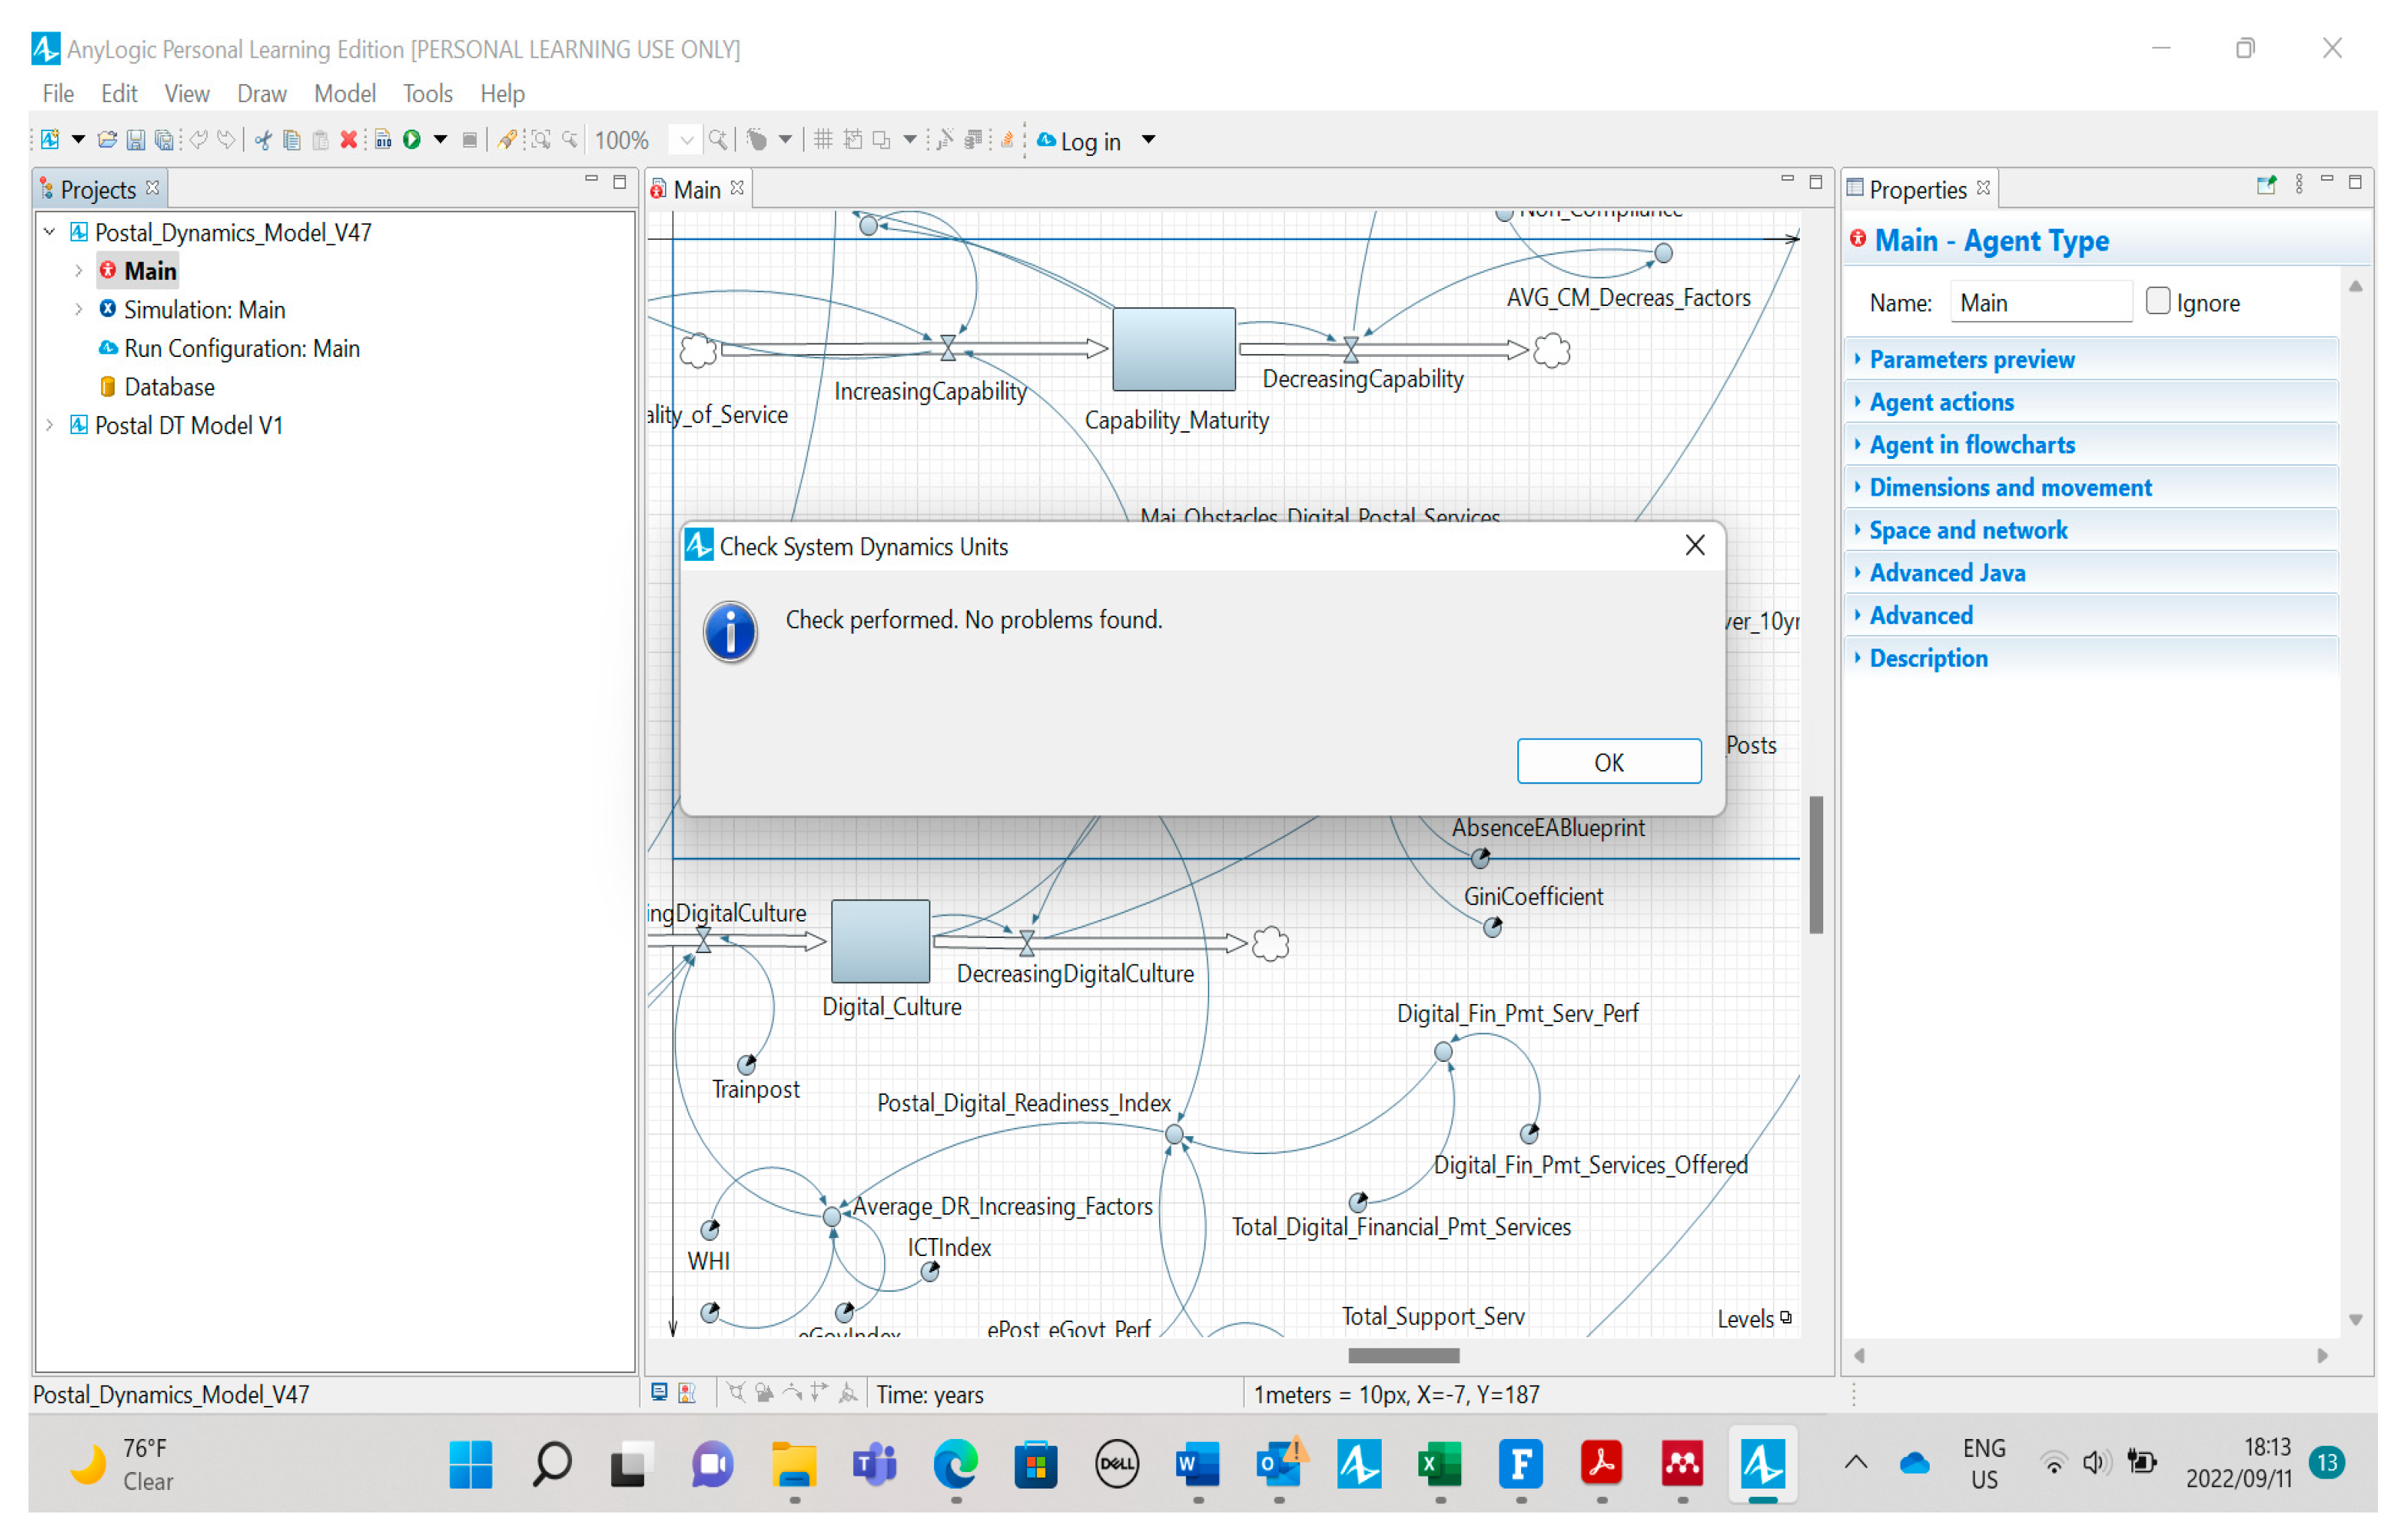
4.1. Model Verification and Validation

Numerous authors have researched model validation in system dynamics and this study cites Sterman (2002), who published 12 tests for the assessment of dynamic models. Model validation is a vital yet contentious facet of model-oriented methods, and system dynamics specifically [14]. The validity of the outcomes in model-based research is significantly reliant on the soundness of the model. Barlas (1996) proposes that the general rational direction of validation is to primarily assess the validity of the structure and thereafter test the behavior accuracy; after these two vital tests of the structure of the model, it can be perceived as sound [17].
Pruyt (2013) argues that model verification involves assessing the correctness of the numeric values, scrutinizing the mathematical expressions, assessing the subsystems and model structures, and assessing the dimensional consistency. The validation process confirms whether a model replicates historical actual data. In system dynamics, the replication of past patterns is merely one of several assessments relative to the modelling purpose. Comparison of the model behavior with historical data is seldom a goal, particularly not for SD modelling that is futuristic due to the complexity of systems and challenges studied in a world driven by volatility, uncertainty, complexity, and ambiguity; SD validation transcends this orthodox concept of validation [17]. Pruyt (2013) further argues that direct structure tests could comprise a combination of the following tests: (i) a direct boundary adequacy test, which evaluates whether the boundaries are suitable; (ii) a direct structure assessment test, which evaluates whether the structure obeys the physical system and associated laws of nature; (iii) a parameter confirmation test, which evaluates whether the structures and parameters have real-life complements and correlate with knowledge; (iv) a direct extreme conditions test, which evaluates without replication (a) whether the structures and equations are plausible even under extreme conditions or (b) what the perimeter is for the model to be conceivable/beneficial; and (v) face validation— this evaluates whether experts in the field consider the model structure and equations apt for the envisioned purpose [18]. These tests are discussed below.

4.1.1. Structure Confirmation Tests

Barlas (1999) proposes that when structural confirmation tests are applied as empirical tests, they entail associating the nature of the equations of the model with the relations that occur in the physical system. It may also be executed as a theoretical structure test, by associating the model equations with comprehensive knowledge in the literature. Consequently, for the model to be considered as having “passed the test”, the model structure may not contradict the erudition about the structure in the literature. The verification process could be tackled through an appraisal of the model assumptions by an extremely capable and skilled expert with an understanding of the interconnectedness of the physical system [17]. In this study, the model was shared with digital transformation experts and policymakers in the postal industry; this iterative verification process resulted in several versions (version 1 to version 47), from which a purposeful model emerged (version 47). The model structure that is shown in Figure 3 (version 47) was agreed upon and considered as representing the reality of digital transformation in the postal sector.

4.1.2. Structure Confirmation Tests

Sterman (2002) suggests that before determining how a parameter is to be appraised or if its numerical value is rational, it is vital to ensure that every constant (and variable) has a vivid, concrete meaning [11]. Barlas (1999) proposes that the second direct structure test, parameter confirmation, entails evaluating the constant parameters and variables compared to the knowledge of the physical system, both conceptually and mathematically. Conceptual confirmation entails the aptitude to detect essentials (elements) in the physical system that resemble the parameters of the model. Mathematical or numeric confirmation entails the approximation of the numerical value of the parameter with suitable correctness [17]. In this research, confirmation tests were dealt with simultaneously with structure confirmation tests as they are related, and they were dealt with by the same experts as articulated in Section 4.1.3 and Section 4.1.4.

4.1.3. Dimension Consistency Test

Sterman (2002) proposes that each mathematical expression must be dimensionally consistent without the insertion of random factors that do not correlate with real life [11]. Figure 6 depicts the output result of the unit scrutiny test produced by the Anylogic PLE software. The vertical axes in the system dynamics results are dimensionless, except for financial performance, which relates to a monetary value in Rand.

4.1.4. Structure-Oriented Behavior Test

Barlas (1999) proposes that structure-oriented behavior tests evaluate the soundness of the structure indirectly, through the application of certain behavior tests to model behavior patterns [17]. The research considered two vital structure-oriented tests, namely (i) the boundary adequacy test and (ii) the extreme conditions test, to further assess the validity of the structure of the model, as presented in Section Boundary Adequacy Test and Section Extreme Conditions Test.

Boundary Adequacy Test

Sterman (2002) advances that the boundary adequacy test evaluates the aptness of the model boundary for its designed goal and proposes that the initial step is to check what the boundary is with the assistance of tools such as boundary charts and sub-system diagrams. Sterman (2002) further proposes that model equations must be assessed for exogenous inputs to substantiate that the list of exogenous variables is comprehensive, and he cautions that all constants are exogenous but may be inconstant over the time horizon under consideration. Lastly, Sterman (2002) argues that the model boundary should be shared with the “client” and outside experts, in addition to a review of relevant literature and direct experience with the system, to solicit feedback and new insights that could suggest some of the processes that perhaps could be made endogenous; such insights should be incorporated into the model and scrutinized for their effects on the model behavior, as the primary objective is to build the client’s confidence in the model [11,14].
This research aimed to determine prevalent inhibitors and drivers of digital transformation in organizations and construct an SD model of intermingling digital transformation variables based on insights from both academic and industry literature to design appropriate policies that would benefit the postal sector. During this assessment, the model was adapted to comprise a conceivable added structure in which the following constants were made endogenous: (i) impact increase in adopters, (ii) impact decrease in adopters, (iii) impact increase in capability maturity, (iv) impact decrease in capability maturity, (v) impact increase in digital culture, (vi) impact decrease in digital culture, (vii) postal readiness index; (viii) compliance with electronic advance data (EAD); and (ix) major obstacles to digital postal services.
These insights were gained from sharing the model with stakeholders and comprehending and incorporating these insights into the model to build the client’s confidence in the model.

Extreme Conditions Test

Sterman (2000) argues that models ought to be solid even in extreme conditions and proposes that solidness under extreme conditions equates to the model behaving realistically regardless of the extremities of the inputs or policies subjected to it [14]. The extreme condition test comprises the allocation of extreme values to parameters and contrasting the model-generated behavior with the observed or expected behavior of the physical system under similar extreme conditions. The model is accepted as having “passed the test” if it engenders similar transformed behavior when replicated with structural adjustments that reflect the structure of the “altered” physical system [14].
During this assessment, inputs to respective mathematical expressions were allocated extreme values such as 0%, 1%, 25%, 50%, and 100%, and the SD model was simulated to evaluate whether the mathematical expressions still hold. The model was further put through extreme disturbances that related to policies and parameters, and the outputs were assessed to ascertain whether they were reasonable and useful. The extreme conditions tests are very important as they can potentially assist the modeler in uncovering structural flaws and taking appropriate action to correct such underlying structural flaws. When extreme values were assigned to the mathematical expressions of the adopters’ stock, digital culture stock, and capability maturity stock, the model was run to produce the results, as divided as follows.

Extreme Condition Test of Zero Value (0%)

The extreme conditions tests of a zero value allocation for the adoption stock, digital capability stock, and digital culture stock resulted an expected decline in the financial performance, as depicted in Figure 7 and Figure 8. When the capability maturity, digital culture, and adoption stocks remain at zero, the simulation of the financial performance (competitiveness) stock stands at −0.58, which translates to −R1.6 billion in year 0.164, and declines to just below −1, which translates to −R2.9 billion in year 9.945. Therefore, Figure 7 and Figure 8 are plausible and the behavior is expected even under extreme conditions. The results of the extreme conditions test with zero allocation are consistent with the propositions of Barlas [17] and Sterman [14].

4.1.5. Behavior Pattern Test

The behavior pattern tests are articulated in Section 4.1, and they are the same as the baseline conditions (Scenario 1).

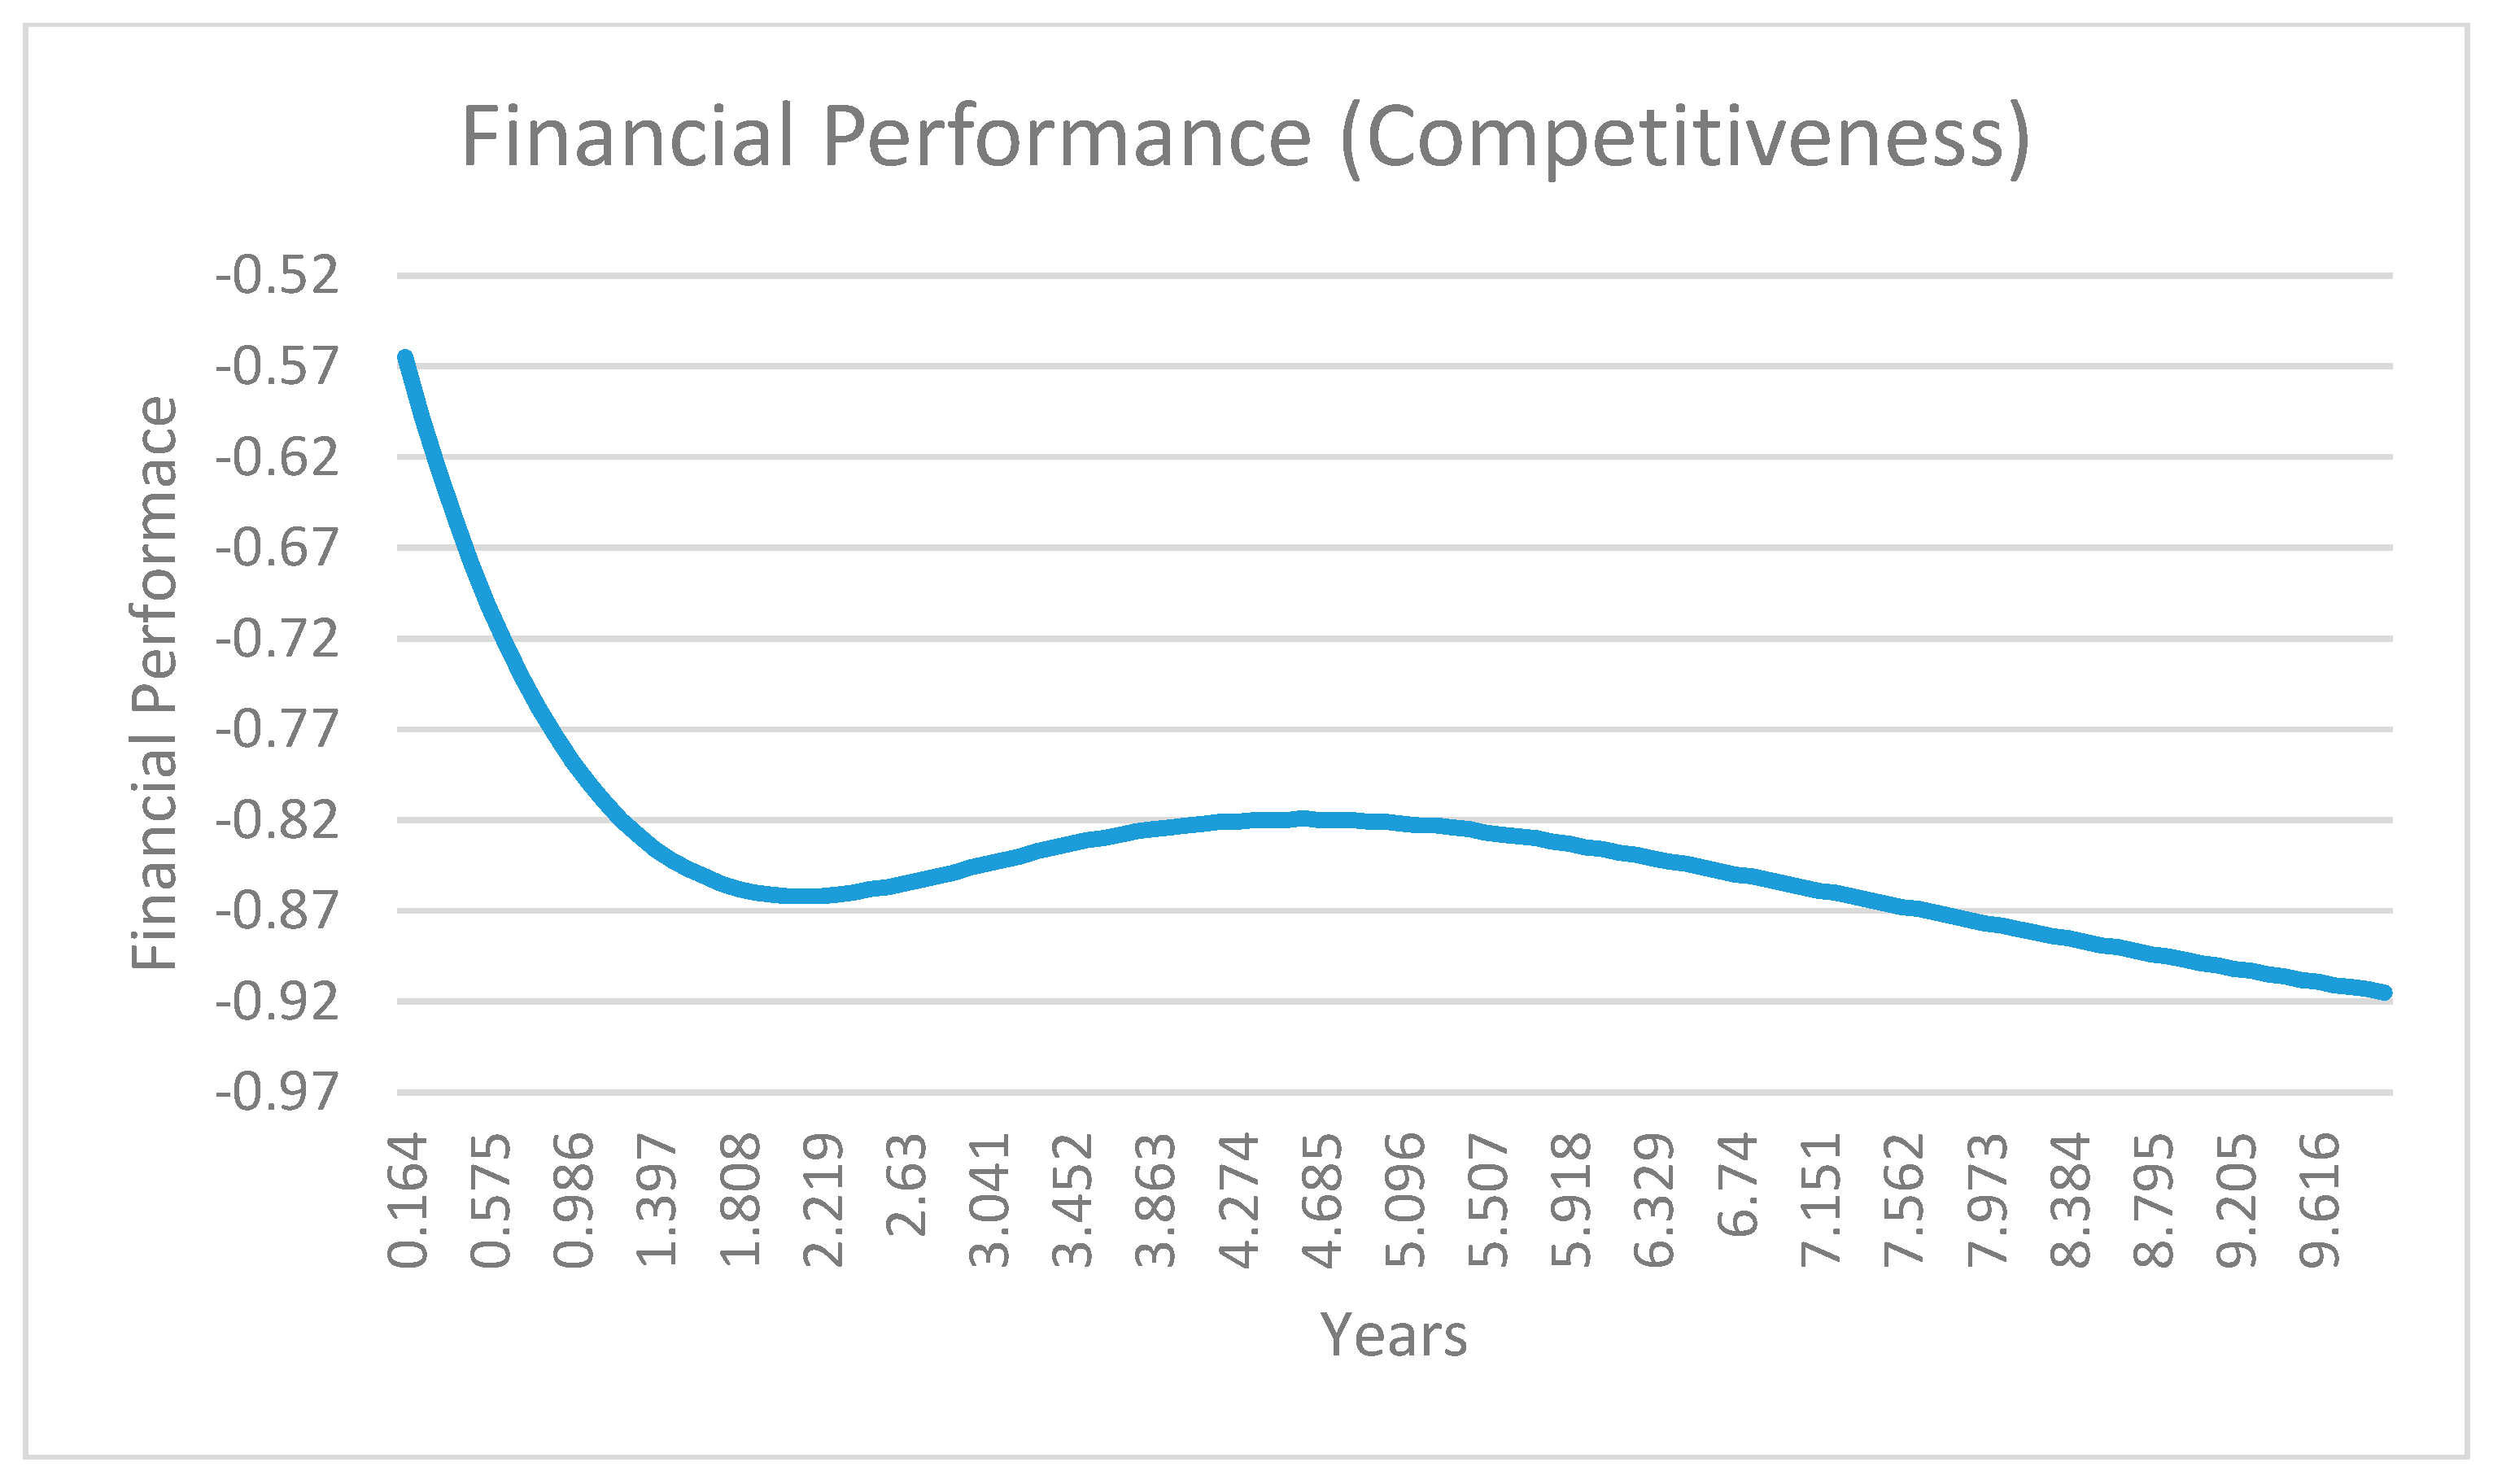
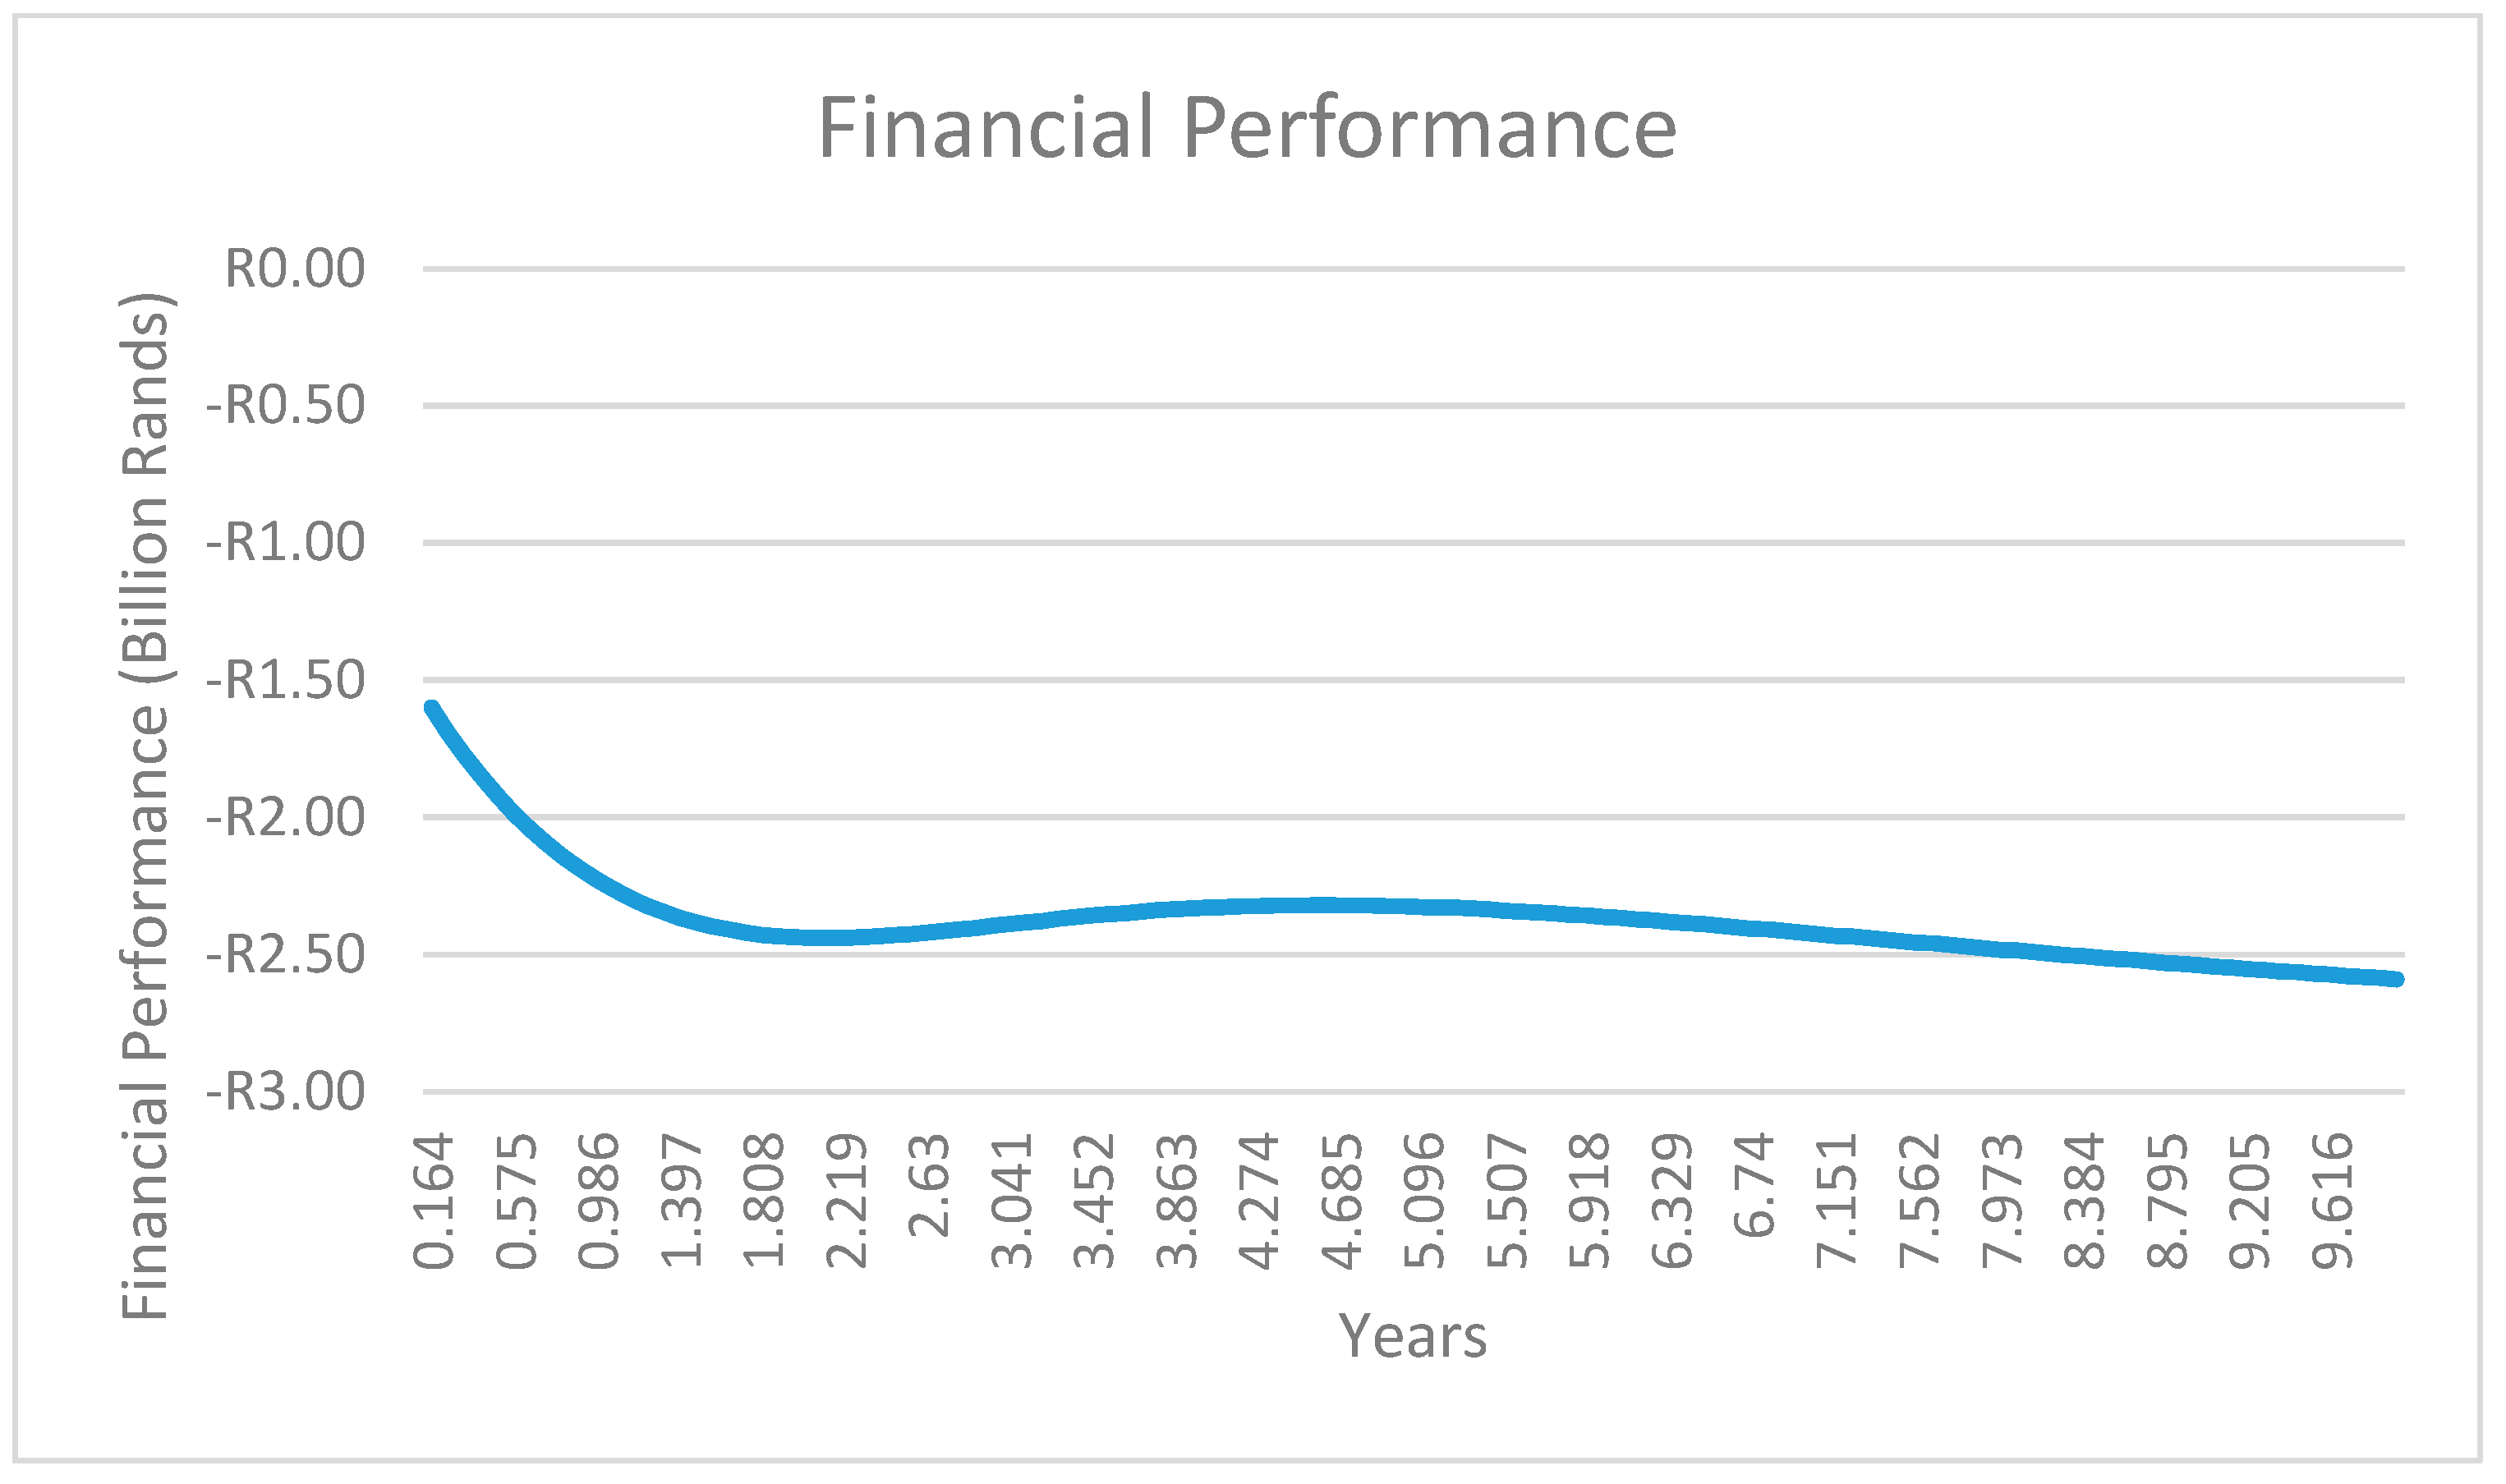
4.2. Policy Analysis and Policy Design

Morecroft (2015) asserts that once the model is considered beneficial from the viewpoint of the client and is validated and verified, policy design could commence through an in-depth what-if scenario analysis [18]. The deeper aim of scenario analysis is to challenge mindsets by stimulating strategic dialogue and reflection, and it is argued that scenario planning is an orderly process for the generation of alternative viewpoints about an organization’s future, by assessing vital uncertainties that can significantly change the landscape [19].
In this paper, an assortment of demonstrative scenarios is presented, including (a) a baseline (Scenario 1); (b) adoption improvement through the improvement of market effectiveness, contact rate, and adoption fraction (Scenario 2); (c) operations capability maturity improvement through the improvement of compliance with quality of service and reducing non-compliance with electronic advance data (Scenario 3); (d) digital culture improvement through the improvement of the postal digital readiness index, improvements in the number of staff who underwent training courses, reducing the turnover of CEOs in ten years, eliminating the absence of an enterprise architecture blueprint, reducing major obstacles to digital postal services, and the improving penetration rates of digital posts (Scenario 4); (e) financial performance improvement through closing the USO shortfall and a reduction in staff costs, operational costs, and transportation costs (Scenario 5); and (f) all the improvements allowed to interact with one another in a dynamic setting (Scenario 6).

4.2.1. Baseline—Business as Usual (Scenario 1)

In the baseline structure depicted in Figure 9, the different curves illustrate the anticipated performance of each stock (operations capability maturity, digital culture, adoption, and financial performance), as articulated in their respective reference mode behavior patterns, along with the resultant delayed response for digital culture, adopters, and financial performance. The operations capability maturity stock exhibits a goal-seeking behavior pattern as it approaches its goal value of 0.6, which is the target set by designated postal operators in Southern Africa. The goal is to reach capability maturity of 1. The capability maturity begins at 0.334 and progressively settles at 0.48; this means that at the current baseline conditions, it will be impossible to reach the initial goal of 0.6; it is even far away from the ideal goal of 1, which is measured through the Integrated Index on Postal Development (2IPD).
The digital culture stock exhibits an s-shaped behavior and is consistent with the literature and real-life conditions, because culture is an integrator and diffuses over time. The digital culture stock is impacted by the adoption stock, which results in the digital culture stock exhibiting its s-shaped behavior. The digital culture stock starts at an initial value of 0.451 in the year 0.164 and eventually reaches a value of 0.673 in 10 years. The potential adopters’ stock commences at an opening value of 0.981 and displays an inverse s-shaped behavior, ultimately reaching the lowest value of zero after 5.507 years. The adopter’s stock commences at an initial value of 0.048 and displays an s-shaped behavior, eventually reaching a high value of 1 after 3.863 years.
It should be noted that the stocks for potential adopters and adopters are associated, which means that when a unit of the potential adopters’ stocks flows out, it becomes an inflow to the adopter stock (this relationship is demonstrated by their inverse behavior patterns). The financial performance stock exhibits an interesting s-shaped behavior, and this behavior is expected because of the impact of the adoption stock and digital culture stock, which exhibit an s-shaped impact on the financial performance stock.
The financial performance (competitiveness) stock stands at −0.565, which translates to −R1.6 billion in year 0.164, and falls to just below −0.72, which translates to −R2.04 billion, in year 9.94.
The overall structure behavior pattern depicted in Figure 9 illustrates the time lags between capability maturity, adopters, digital culture, and financial performance and is consistent with the literature on behavior structural tests developed by (Sterman, 2002) and supported by [16,17].

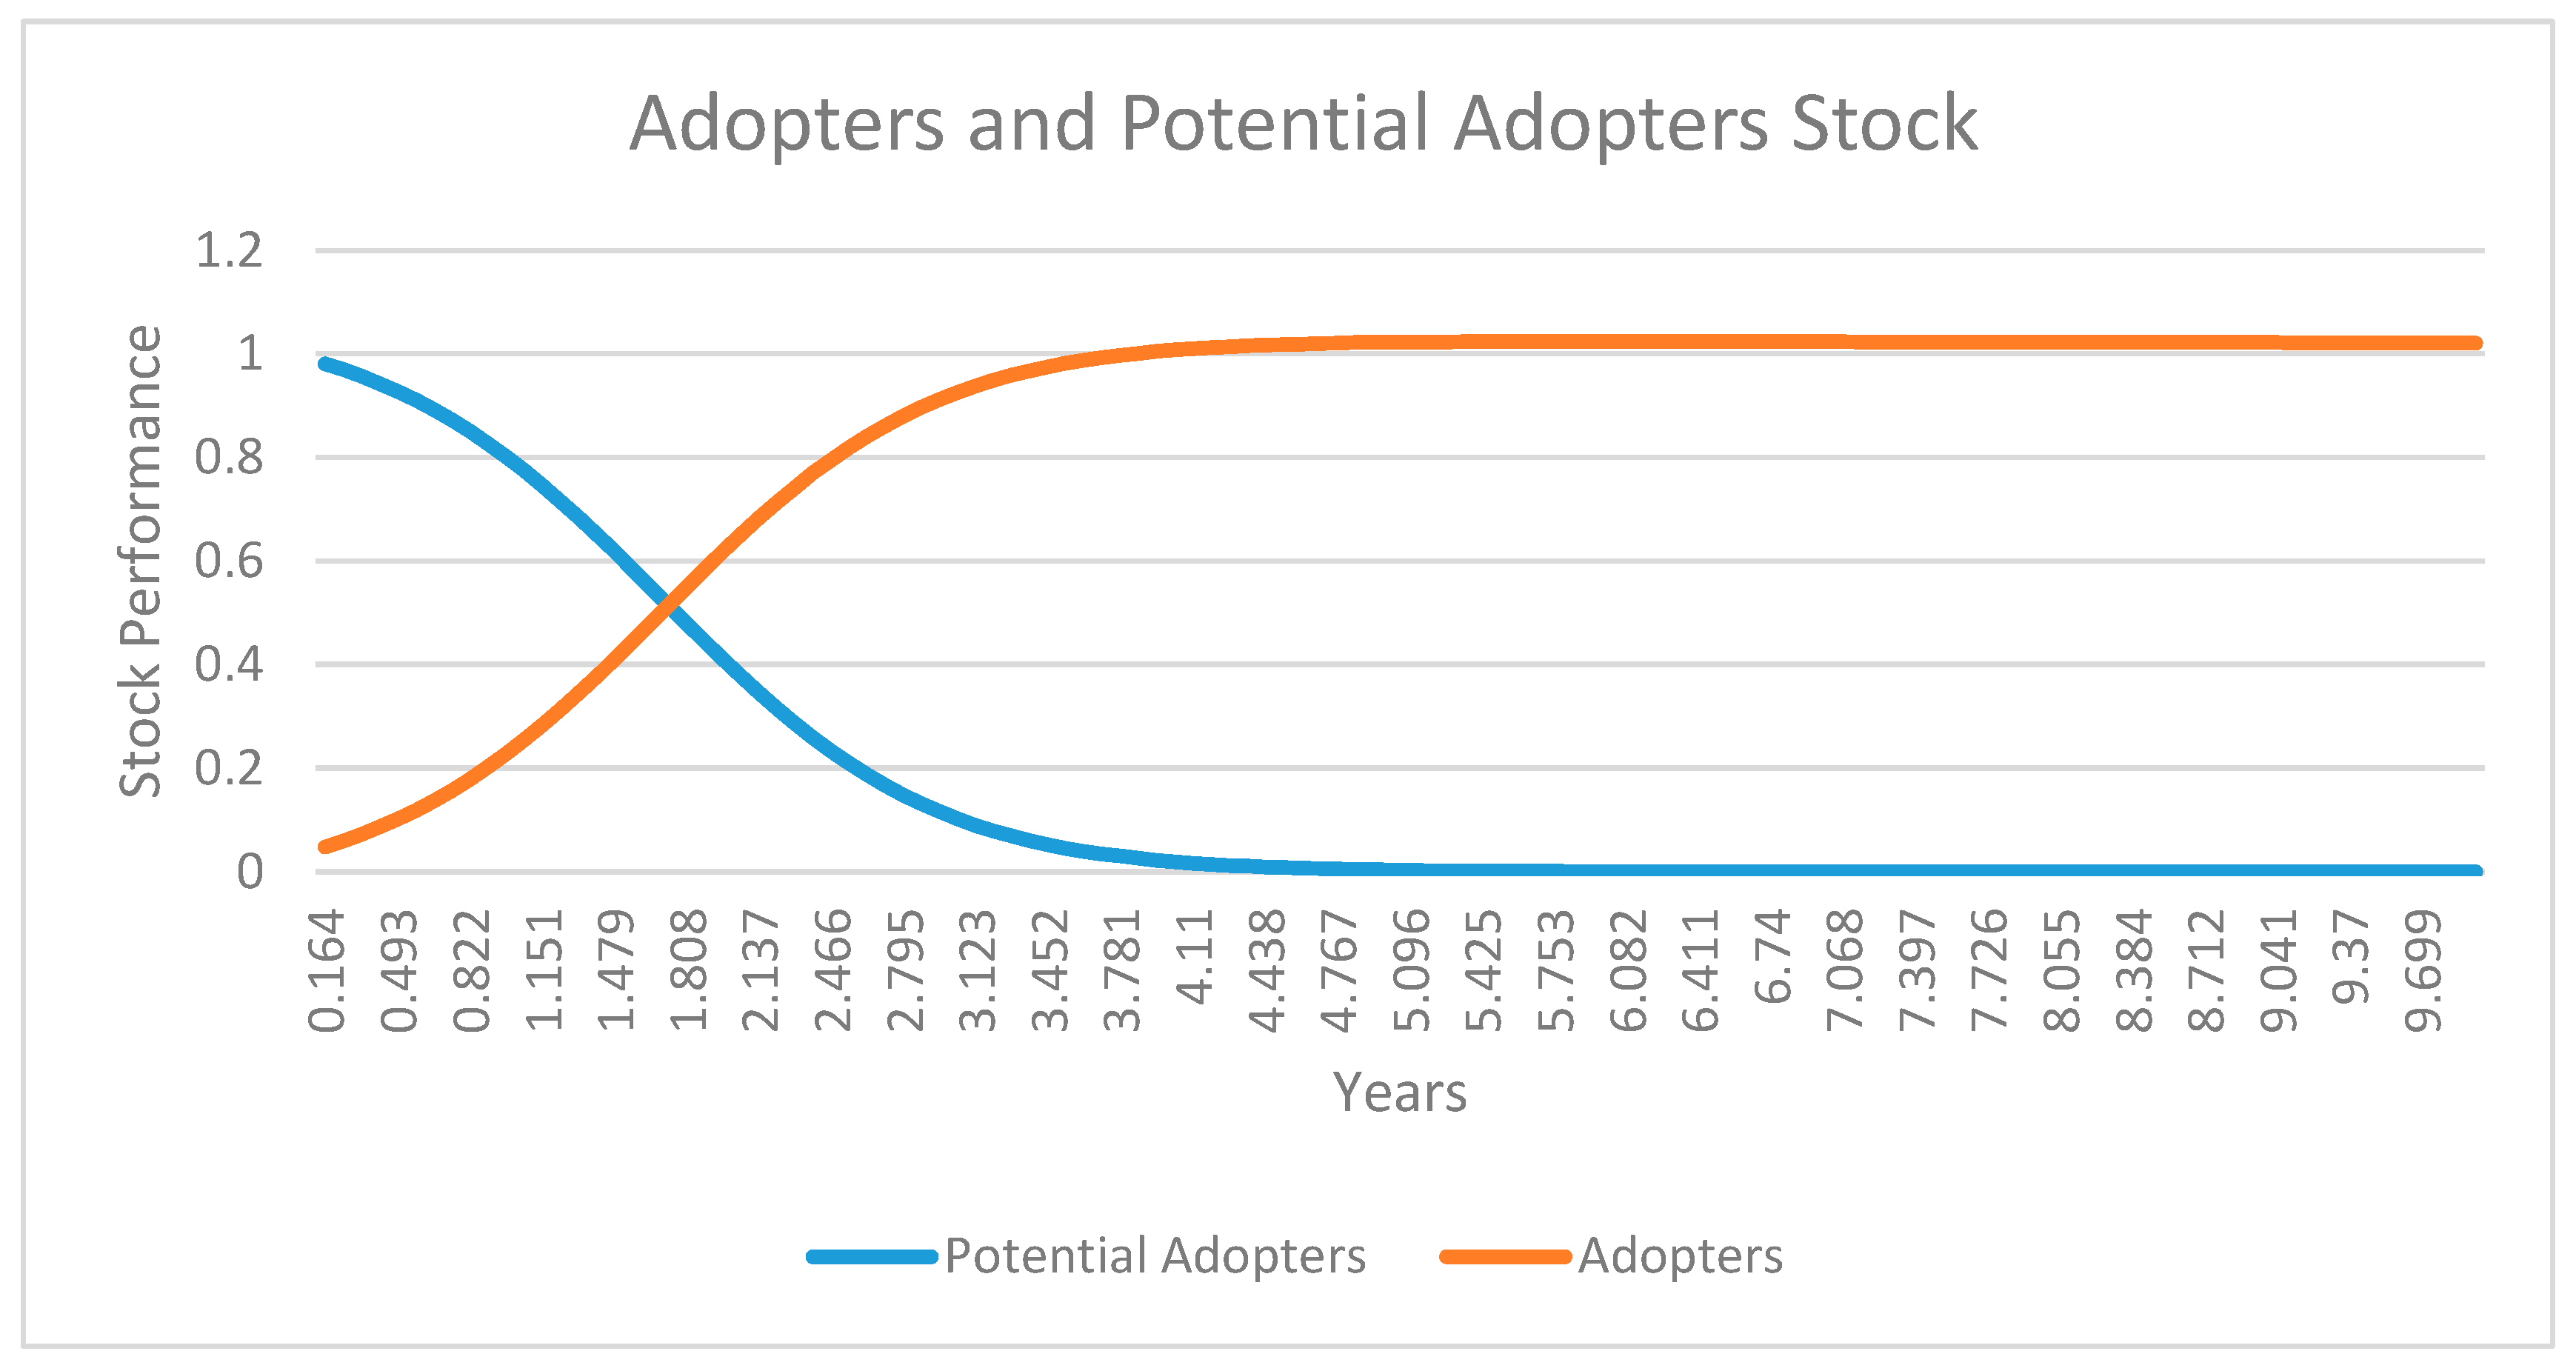
4.2.2. Adoption Improvement (Scenario 2)

The adoption stock is modelled as a function of the marketing effectiveness, adoption fraction, and contact rate. The adoption stock shows that, at baseline conditions, the adopters and potential adopters will be the same at around 2 years and all the potential adopters would have fully adopted in around 4 years. The baseline is modelled against the parameters of (i) marketing effectiveness of 20%, (ii) an adoption fraction of 15%, (iii) a contact rate of 25 clients per annum, and (iv) a dis-adoption rate of 0%, as there are no adopters that have exited the digital ecosystem.
The 50% case scenario, as depicted in Figure 10, is similar to the baseline scenario as depicted in Figure 9 from a balancing loop variable perspective, with a dis-adoption rate of 0%, while the reinforcing loop variables are ramped up as follows: (i) marketing effectiveness increases by 50% (from 20% to 30%), (ii) the adoption fraction increases by 50% (from 15% to 22.5%), and (iii) the contact rate increases by 50% (from 25 to 38 customers per annum). The 50% case scenario is depicted in Figure 10 below, and it demonstrates that adopters and potential adopters will be equal in 8 months, with full adoption within 18 months. This scenario is not probable as it goes against industry norms. Therefore, the best case in the context of the adoption stock is depicted in Figure 11, where the adoption parameters are as follows: (i) marketing effectiveness is 20%, (ii) the adoption fraction is 15%, (iii) the contact rate is 25 clients per annum, and (iv) the dis-adoption rate is 0%, as there are no adopters that have exited the digital ecosystem. It should be noted that the best-case scenario as depicted in Figure 10 is identical to the behavior reproduction test at baseline conditions depicted in Figure 8. The results are consistent with the literature on the application of the Bass diffusion model as proposed by (Sterman, 2000) and supported by [20] in their work on contagion effects in account risk management.

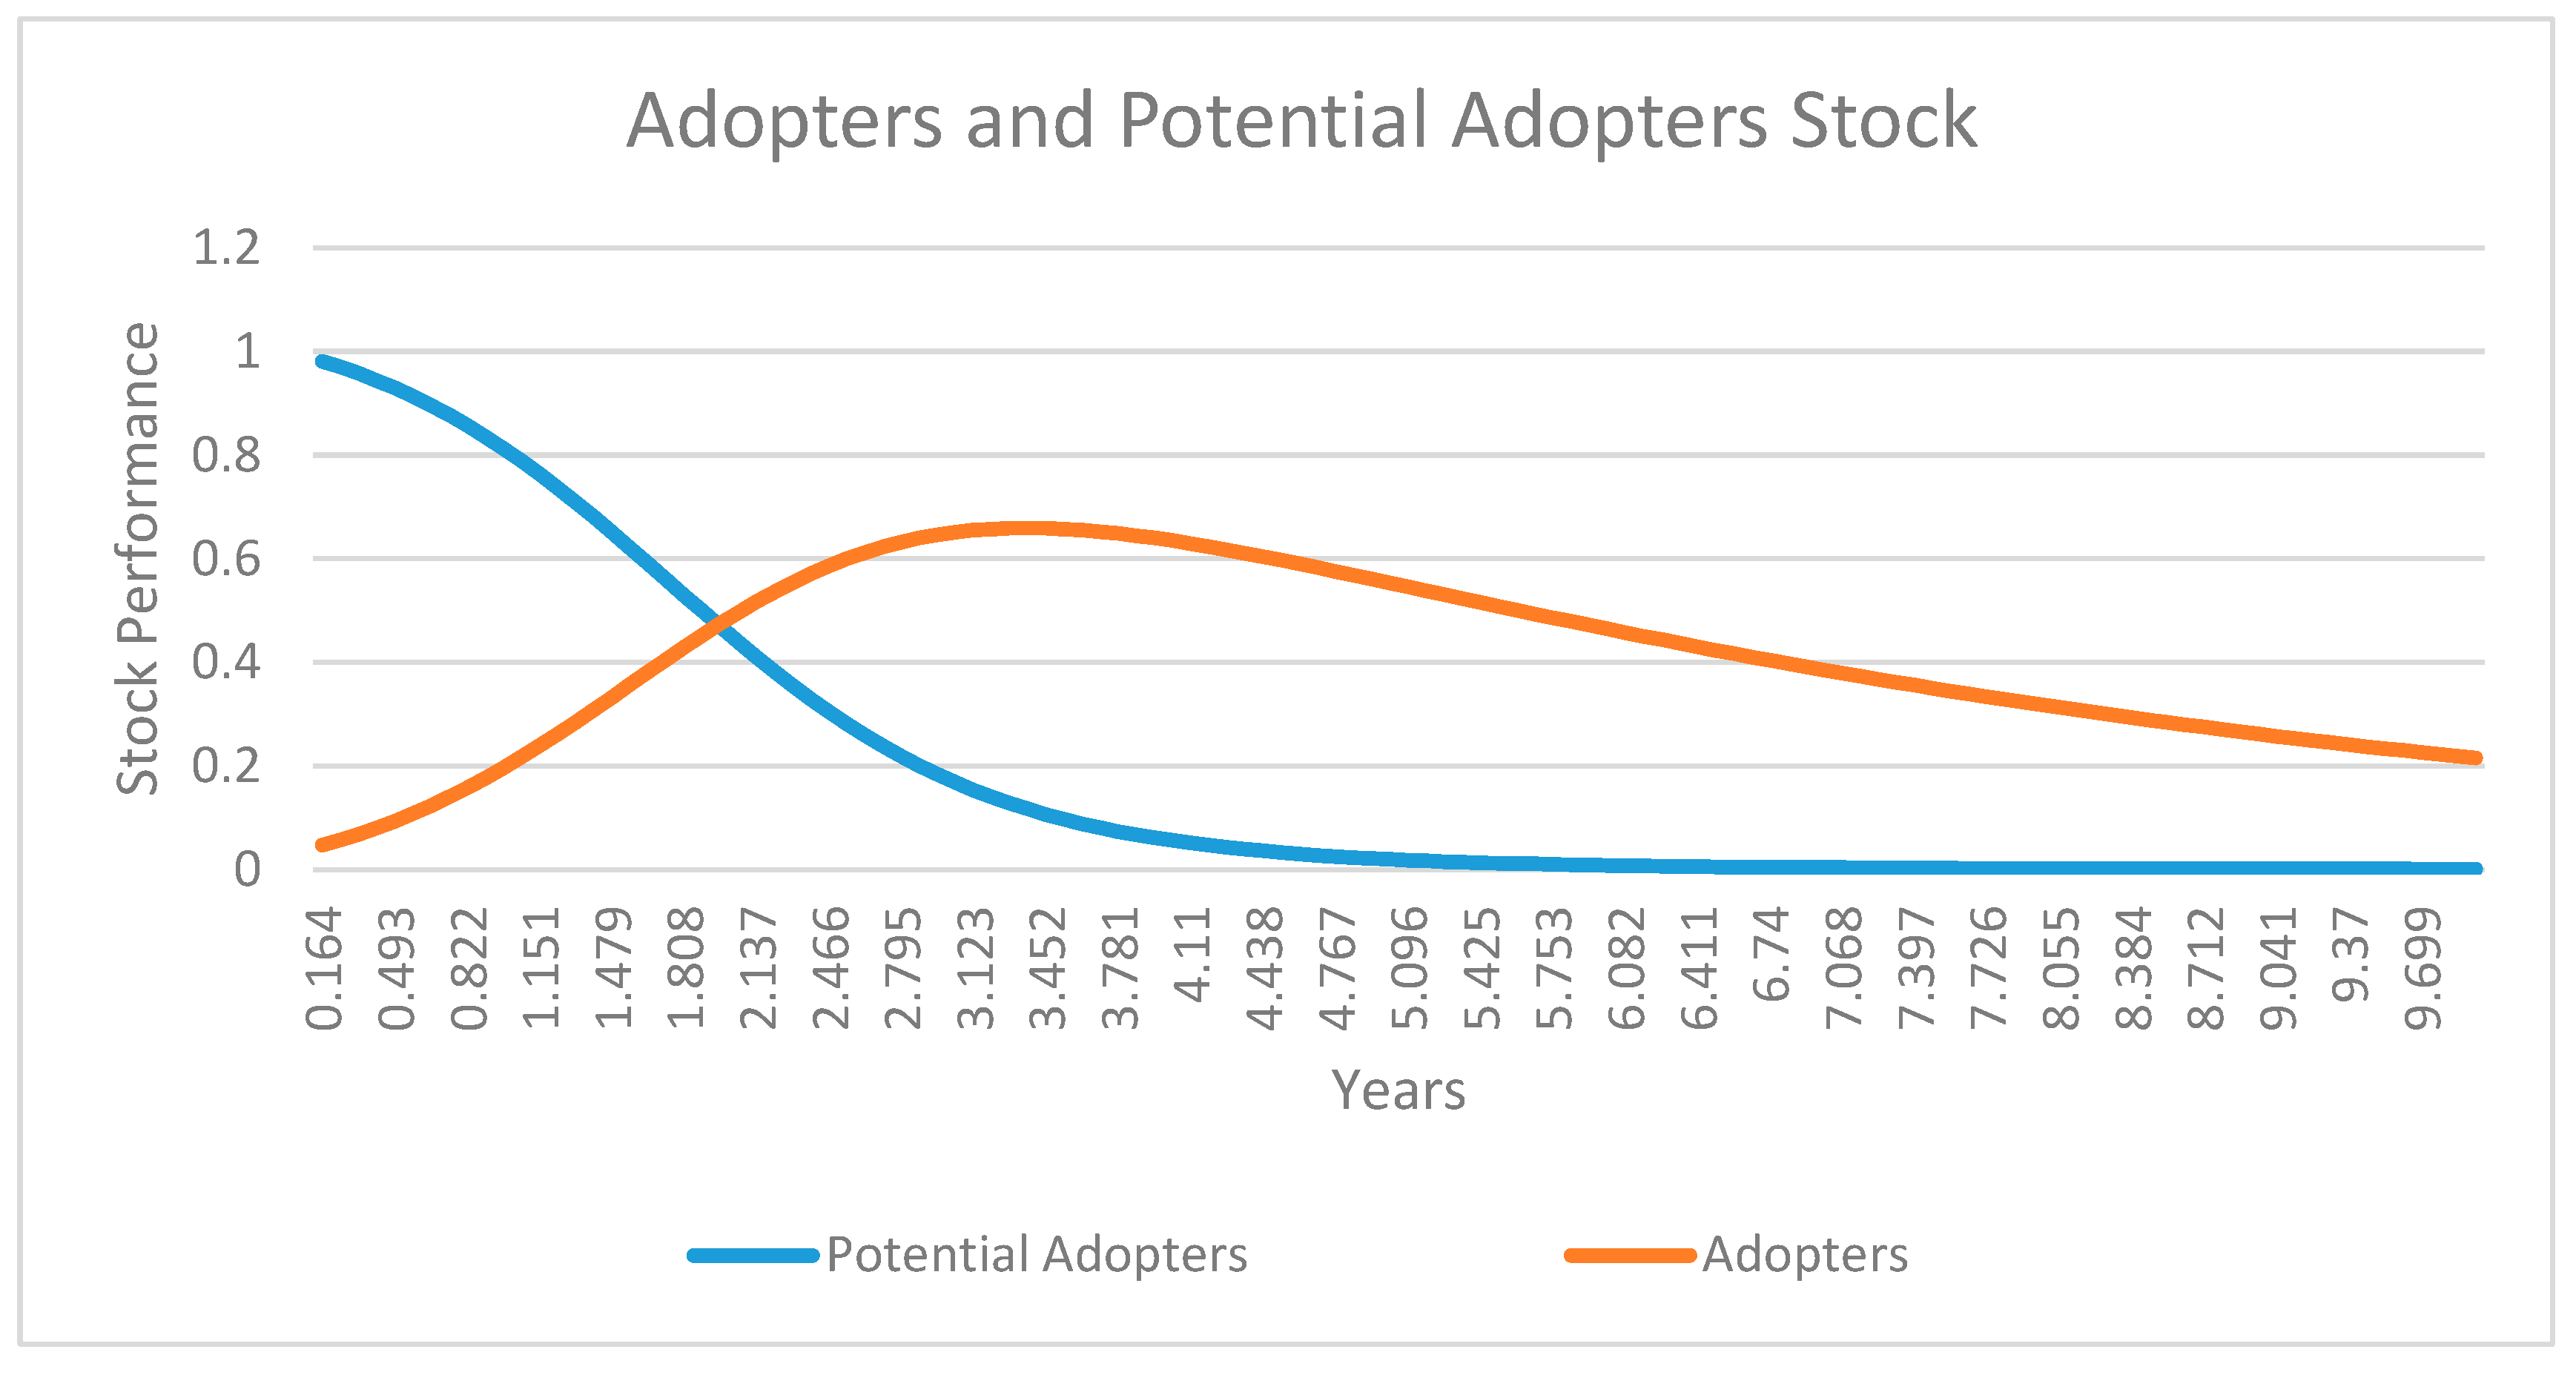
4.2.3. Adoption Decline (Worst-Case Scenario 3)

The reinforcing loop parameters of the best-case scenario are left unchanged (contact rate of 25 customers per year, adoption fraction of 15%, and marketing effectiveness of 20%) while the balancing loop parameter, which consists of the dis-adoption rate (adopters dropping out of the ecosystem for one reason or another), is set at 20%. The worst-case scenario is depicted in Figure 12, which reveals the impact of dis-adoption on the adoption stock. The results reveal that adoption will peak in year three, with about a 60% adoption rate. However, the undesired effects of dis-adoption (representing diverging interests) will creep in and drive adoption downwards, which will result in 20% adoption at the end of the ten-year simulation period. The drop in adoption results in a nose-dive trajectory for all the other stocks (digital culture, capability maturity, and financial performance), as depicted in Figure 13, Figure 14, Figure 15 and Figure 16.
Figure 14 depicts the operations capability declining from its baseline condition of 0.48 in ten years to 0.4 after a 20% drop in adopters. The decline from the baseline to the period after the impact of dis-adopters represents a drop of 17% in capability maturity.
Figure 15 depicts digital culture declining from its baseline condition of 0.673 in ten years to 0.464 after a 20% drop in adopters. The decline from the baseline to the period after the impact of dis-adopters represents a drop of 31% in digital culture.
Figure 15 and Figure 16 depict financial performance declining from its baseline condition of −0.72 (−R2.04 billion) in ten years to −0.915 (−R2.59 billion) after a 20% drop in adopters. The decline from the baseline to the period after the impact of dis-adopters represents a drop of 21% in financial performance in terms of Rand. The results of the impact of dis-adoption or un-adoption by stakeholders are consistent with the work undertaken by [21], whose work focused on the adoption of improved agricultural inputs by farmers in Uganda.
Figure 13, Figure 14, Figure 15 and Figure 16 illustrate the vital role that adoption plays in the overall competitiveness of the postal sector. The results demonstrate that a drop in the number of adopters has a devastating effect on all the stocks; all stocks then assume a sharp decline.

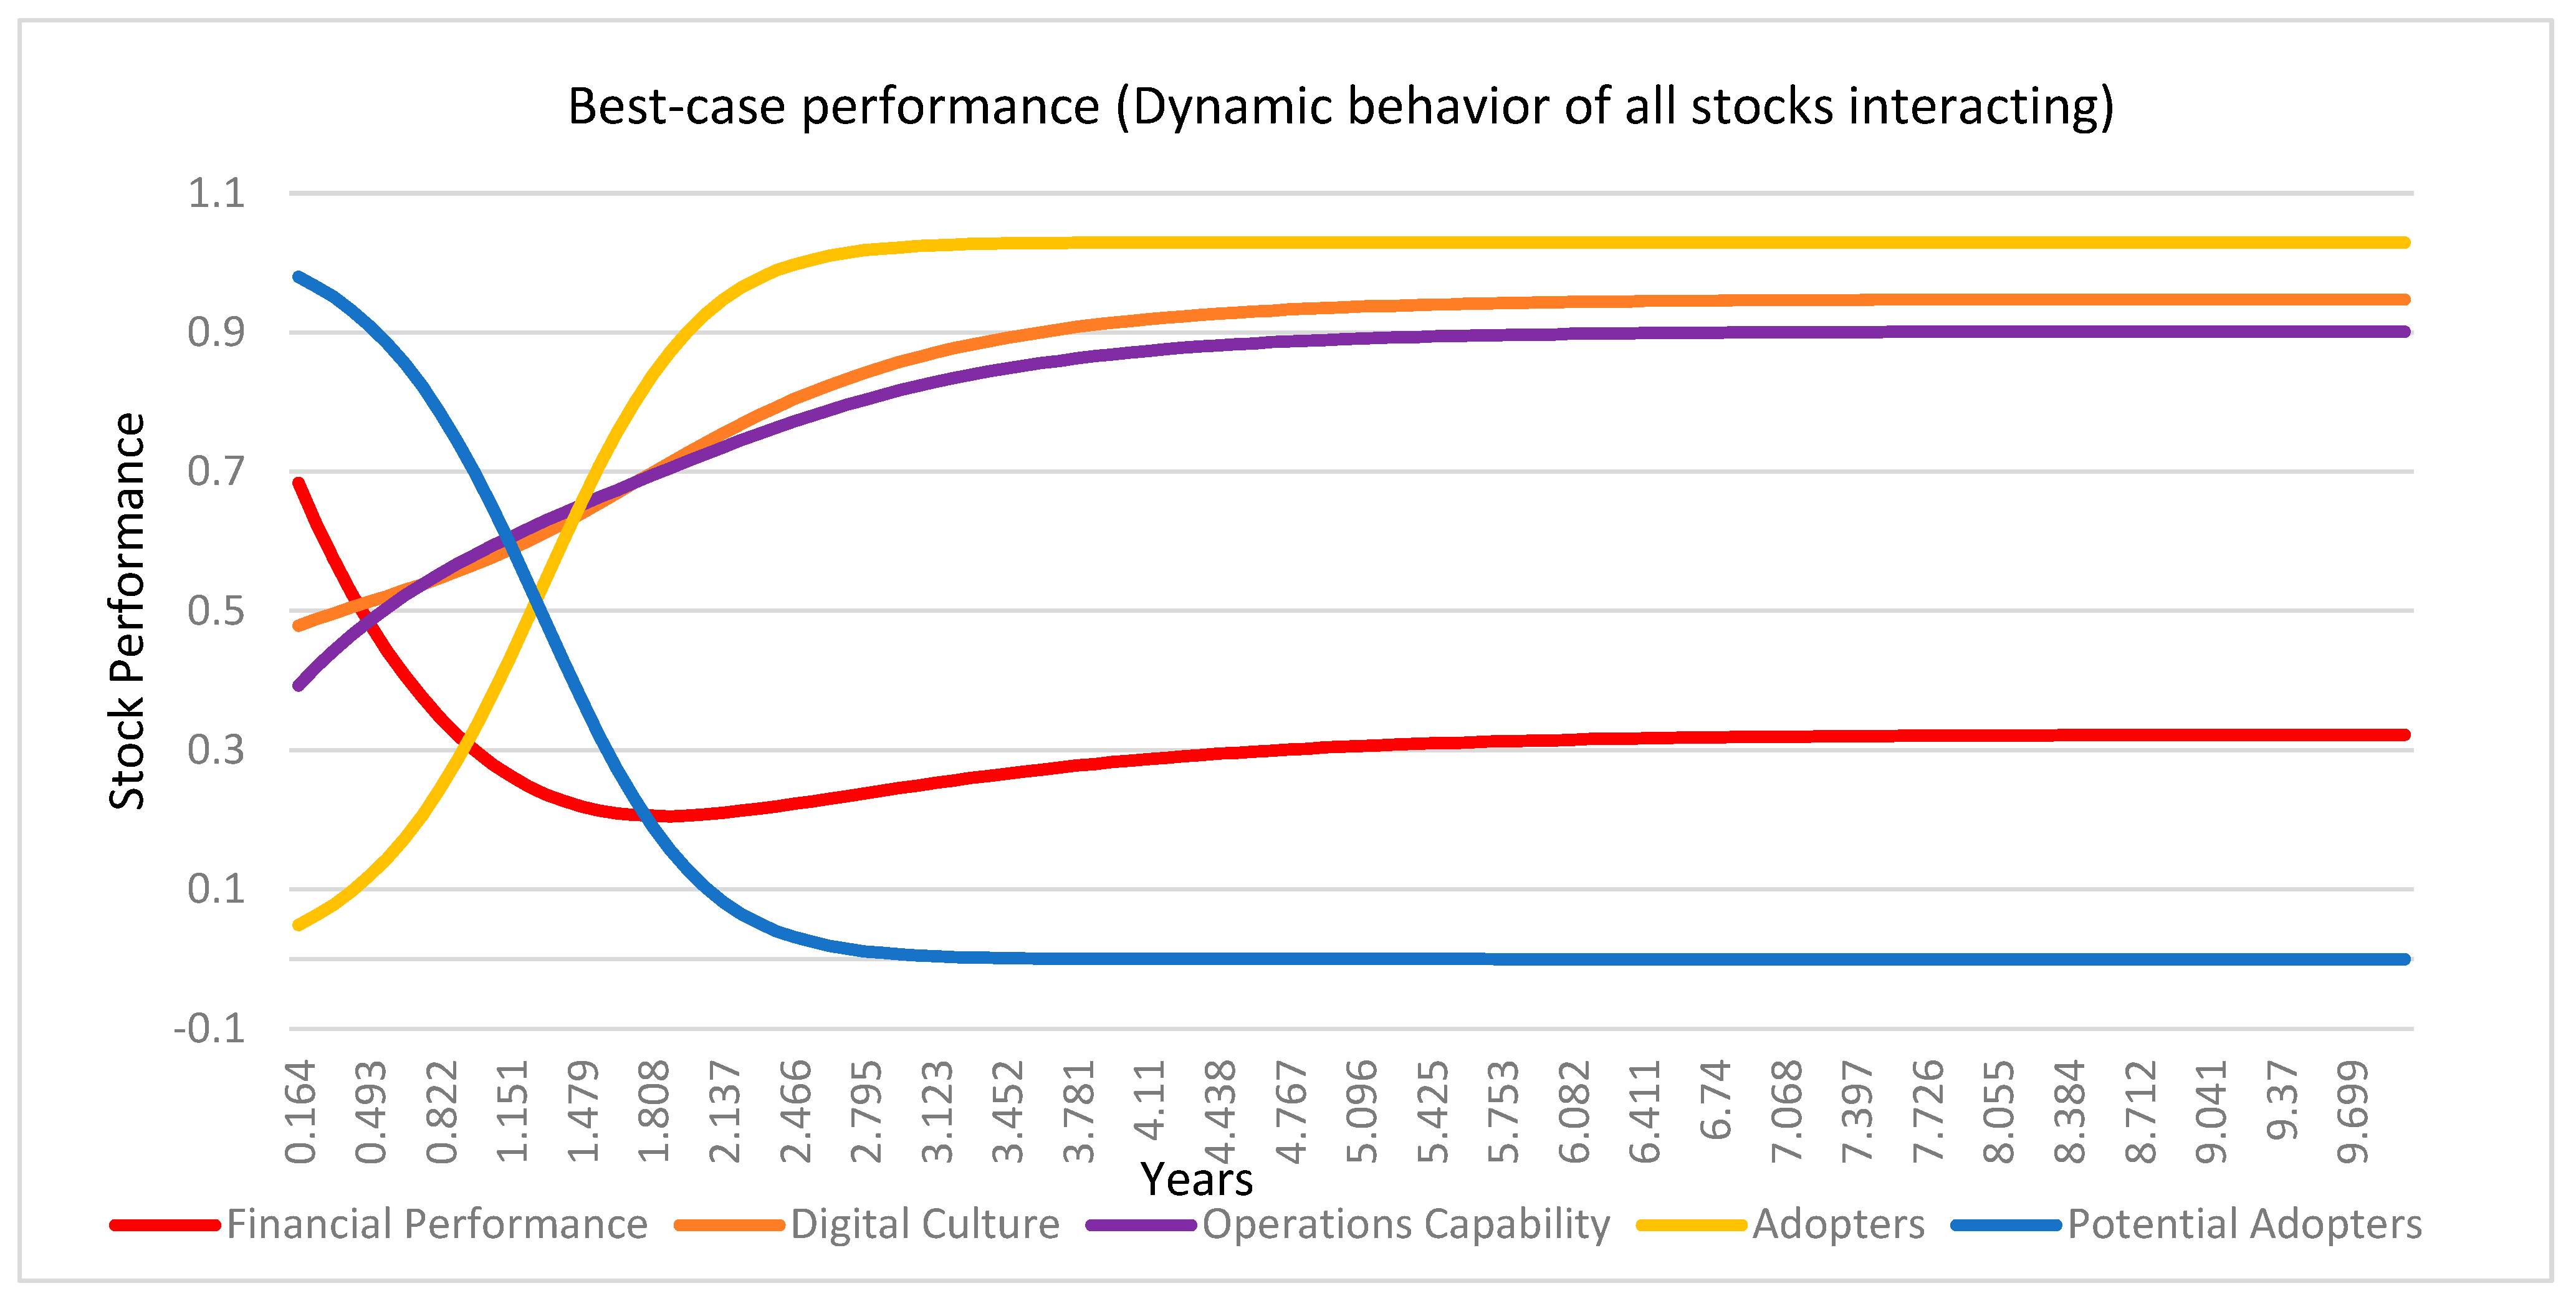
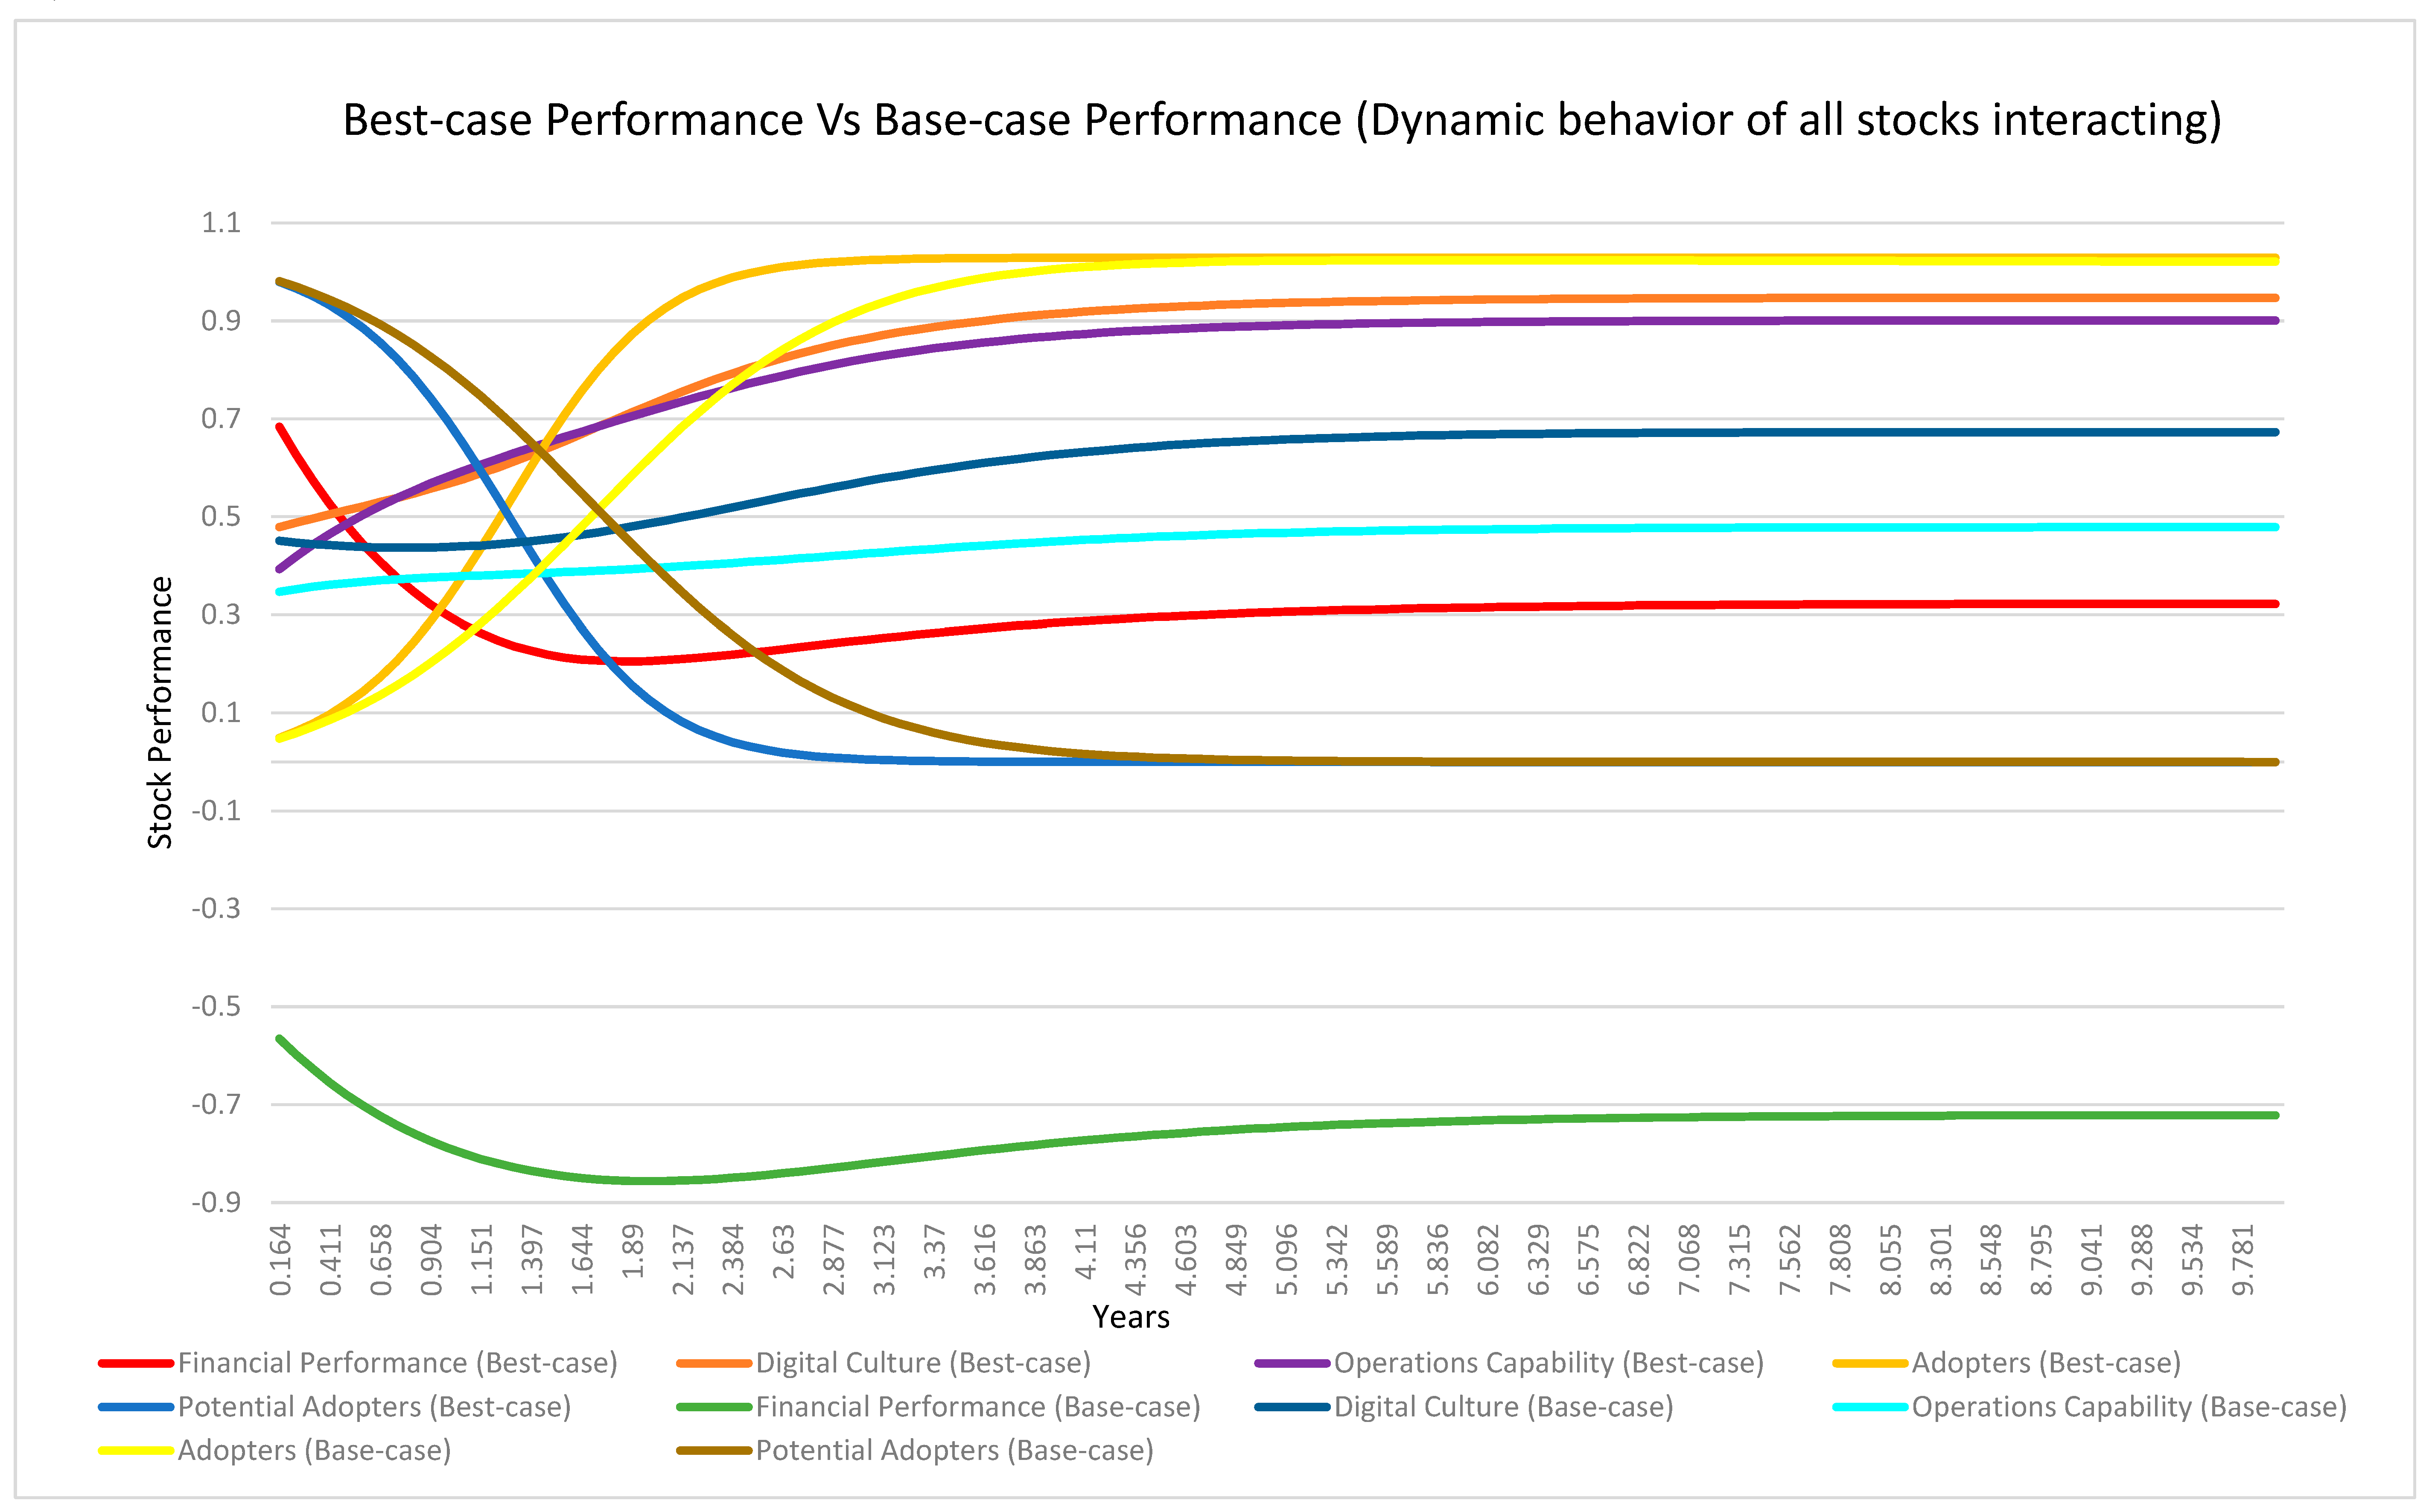
4.2.4. Adoption (Best-Case vs. Worst-Case Scenario 4)

Figure 17 attempts to compare the best-case (BC) performance of the adoption stock against the worst-case (WC) performance of the adoption stock. The worst-case (WC) scenario as depicted in Figure 13 reveals the impact of dis-adoption on the adoption stock. The results demonstrate that adoption will peak in year three, with about a 60% adoption rate. However, the undesired effects of dis-adoption (representing diverging interests) will creep in and drive adoption downwards, which will result in 20% adoption at the end of the ten-year simulation period, which is detrimental to the sustainability of the postal sector. The best-case (BC) scenario, also depicted in Figure 17, reveals that at baseline conditions, the adopters and potential adopters will be the same at around 2 years, and all the potential adopters would have fully adopted in around 4 years.

4.2.5. Digital Culture Improvement (Scenario 5)

In the baseline conditions as depicted in Figure 9, digital culture is modelled as a function of the postal digital readiness index, and train post is a reinforcing loop parameter that is within the control of the postal sector. The balancing loop parameters within the control of the postal sector are the absence of an enterprise architecture blueprint and the change in CEO over ten years. At baseline conditions, digital culture takes an s-curve trajectory, consistent with culture as an integrator, and it peaks at about 4.8 years and flattens at 0.647 until the end of the simulation period of ten years. The baseline is modelled against the parameters of (i) CEO turnover of 0.7; (ii) the absence of an enterprise architecture (EA) blueprint of 0.9, which means that there is a poor EA presence; (iii) a postal readiness index of 0.516; and (iv) train post of 0.001.
The best-case scenario depicted in Figure 18 is modelled against the parameters of (i) CEO turnover of 0.2 (meaning two CEOs in ten years); (ii) the absence of an enterprise architecture (EA) blueprint of 0.1, which means that there is an excellent EA presence; (iii) a postal readiness index of 0.699, which represents a 26% improvement from baseline levels; and (iv) train post of 0.1, which means that 10% of employees trained in train post modules. The results are consistent with research on a system dynamics approach to organizational culture by [20,21].

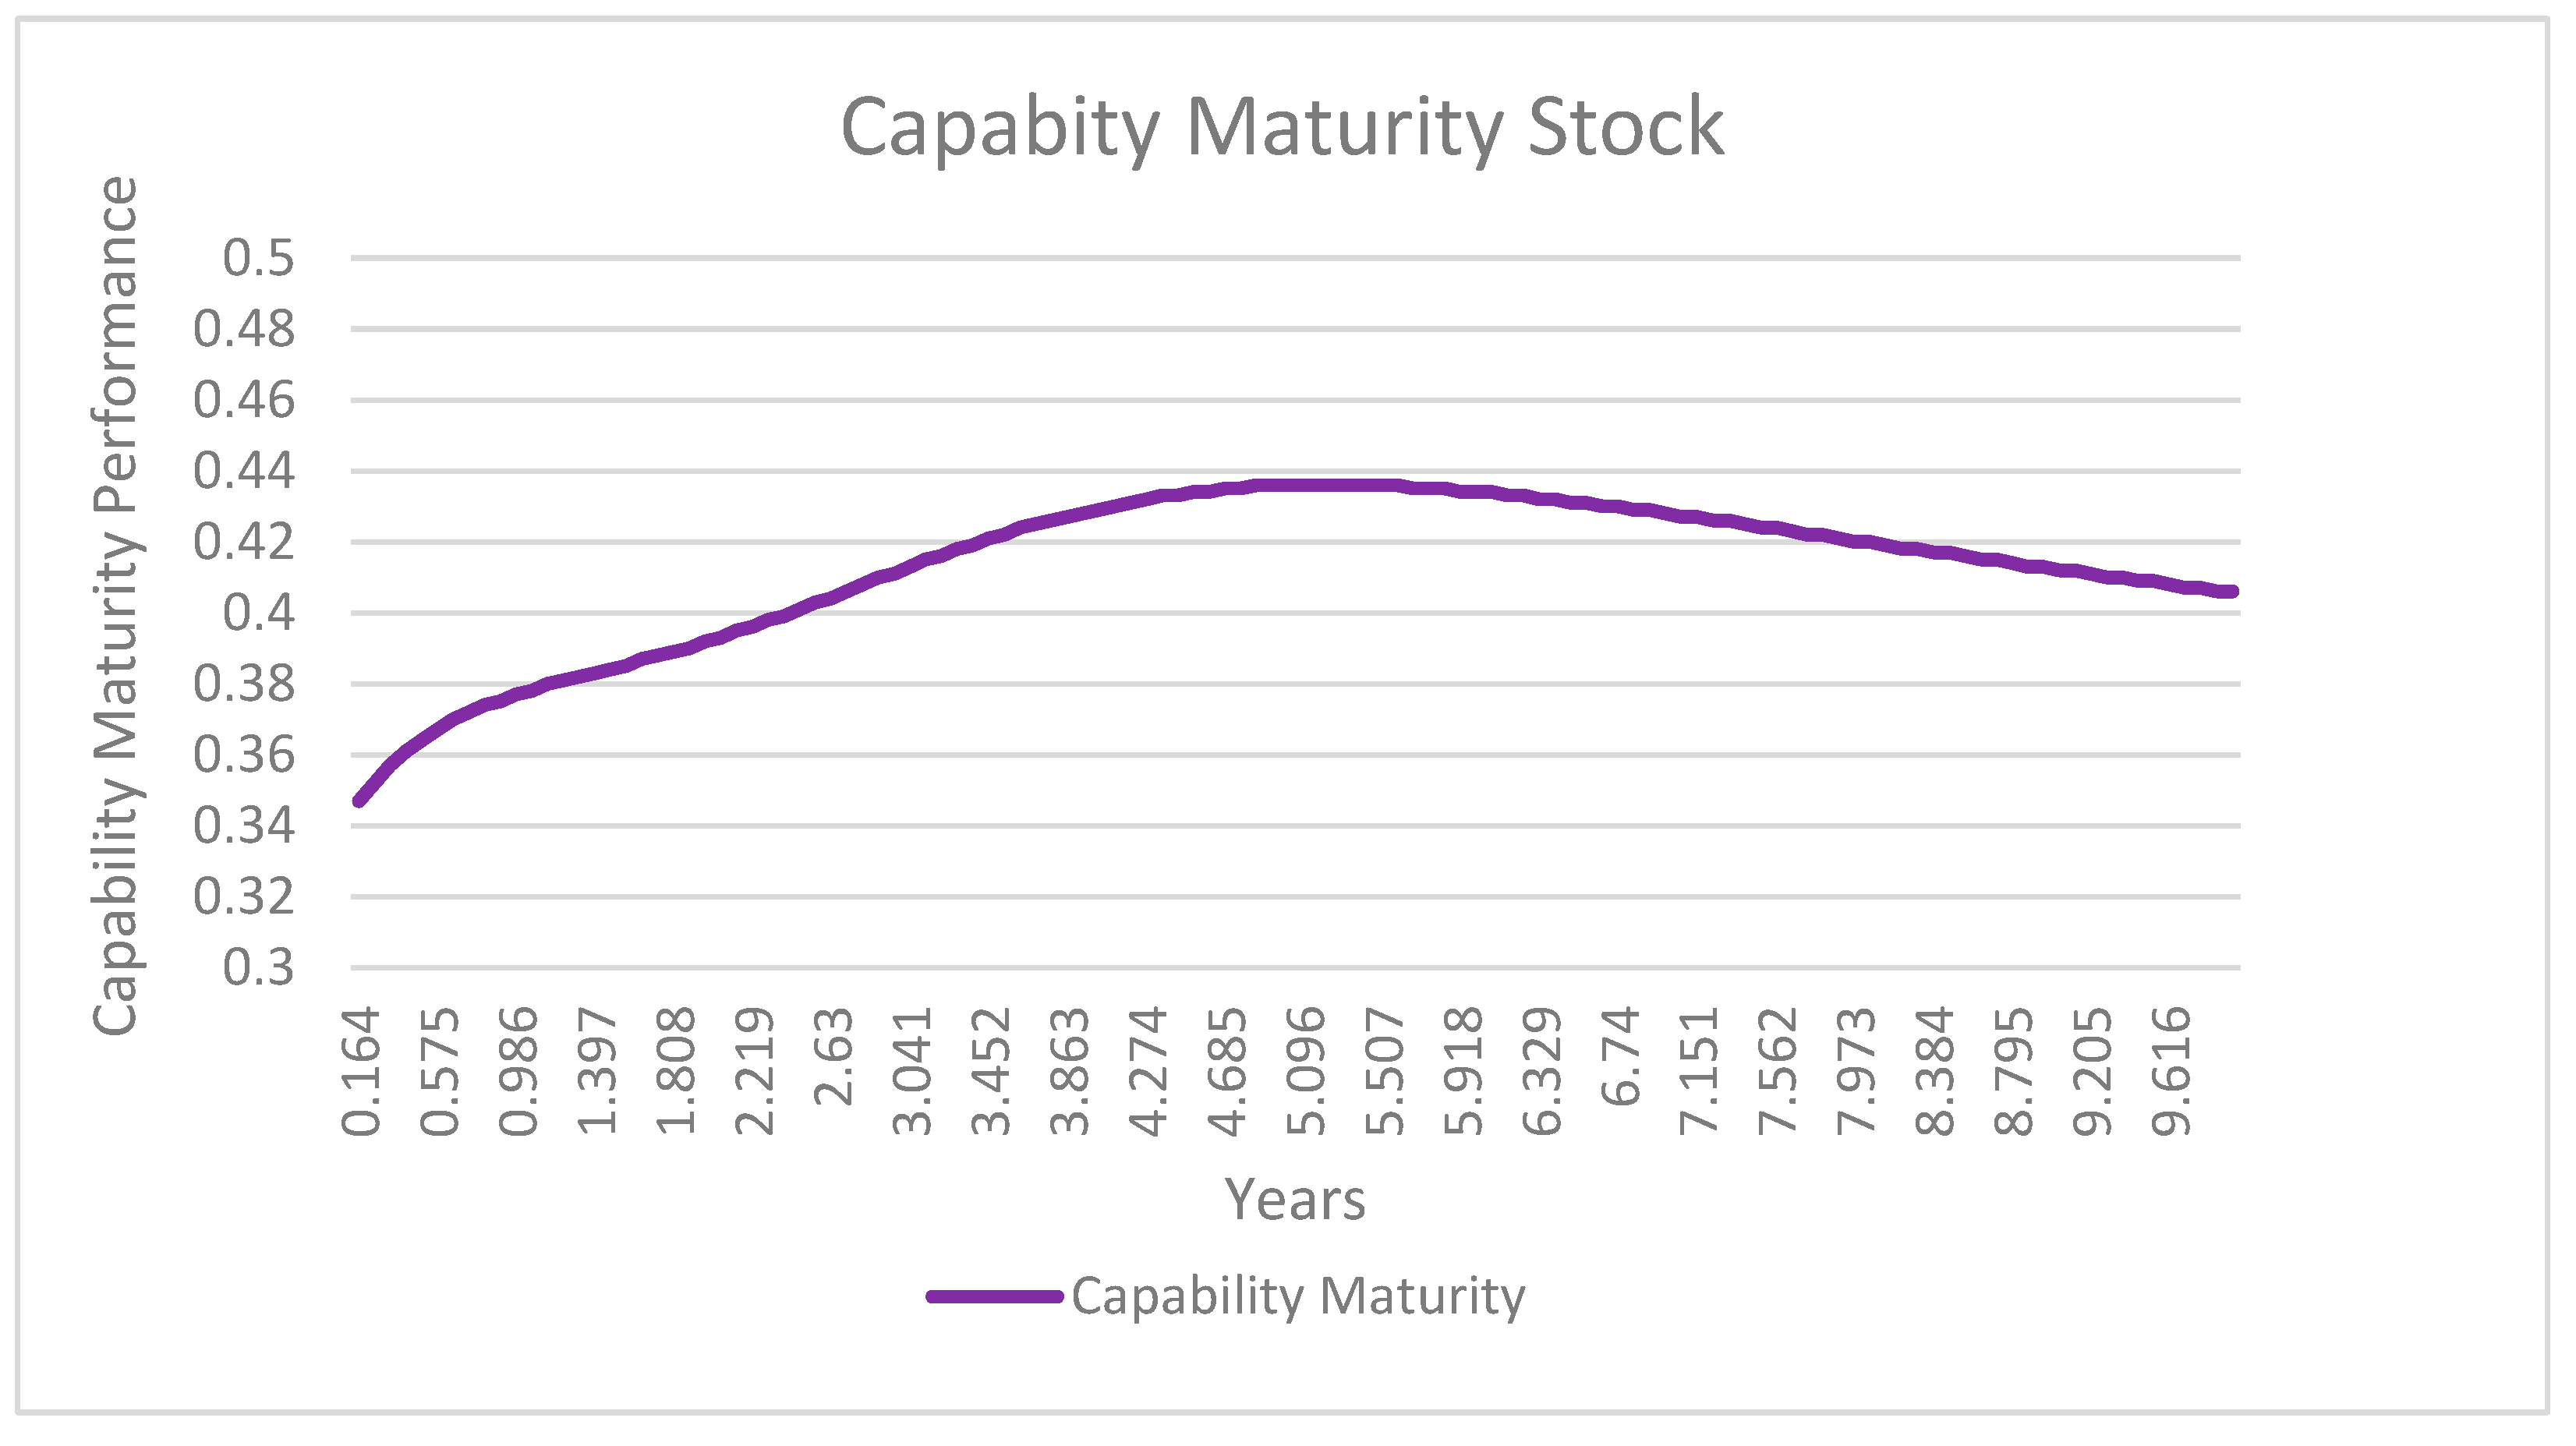
4.2.6. Operations Capability Maturity Improvement (Scenario 6)

In the baseline conditions as depicted in Figure 9, digital capability maturity is modelled as a function of the capability maturity goal and compliance with quality of service on the reinforcement side of the loop. The balancing loop parameter that is modelled is non-compliance with electronic advance data (EAD). For the capability maturity stock, it was found that, at baseline conditions, capability maturity assumes a goal-seeking role and peaks at about 5 years and flattens at 0.48 until the end of the simulation period of ten years. The baseline is modelled against the parameters of (i) compliance with quality of service of 0.42, and (ii) non-compliance with electronic advance data of 1-0.8895.
The best-case scenario depicted in Figure 19 is modelled against the parameters of (i) compliance with quality of service of 0.8, which means a 47.5% improvement, and (ii) non-compliance to electronic advance data of 1–0.95, which translates to a 6.4% improvement in compliance, thereby reducing non-compliance by 77.9% ([(1 − 0.95) − (1 − 0.8895)/(1 − 0.95)] ∗ 100). For the capability maturity stock, it was found that in the best-case conditions, capability maturity assumes a goal-seeking role and peaks at about 5.5 years and flattens at 0.76 until the end of the simulation period of ten years. The improvement from baseline conditions represents a 37% improvement in the capability maturity stock. The results are consistent with the literature on the system dynamics approach to modelling capabilities and resources by [22].

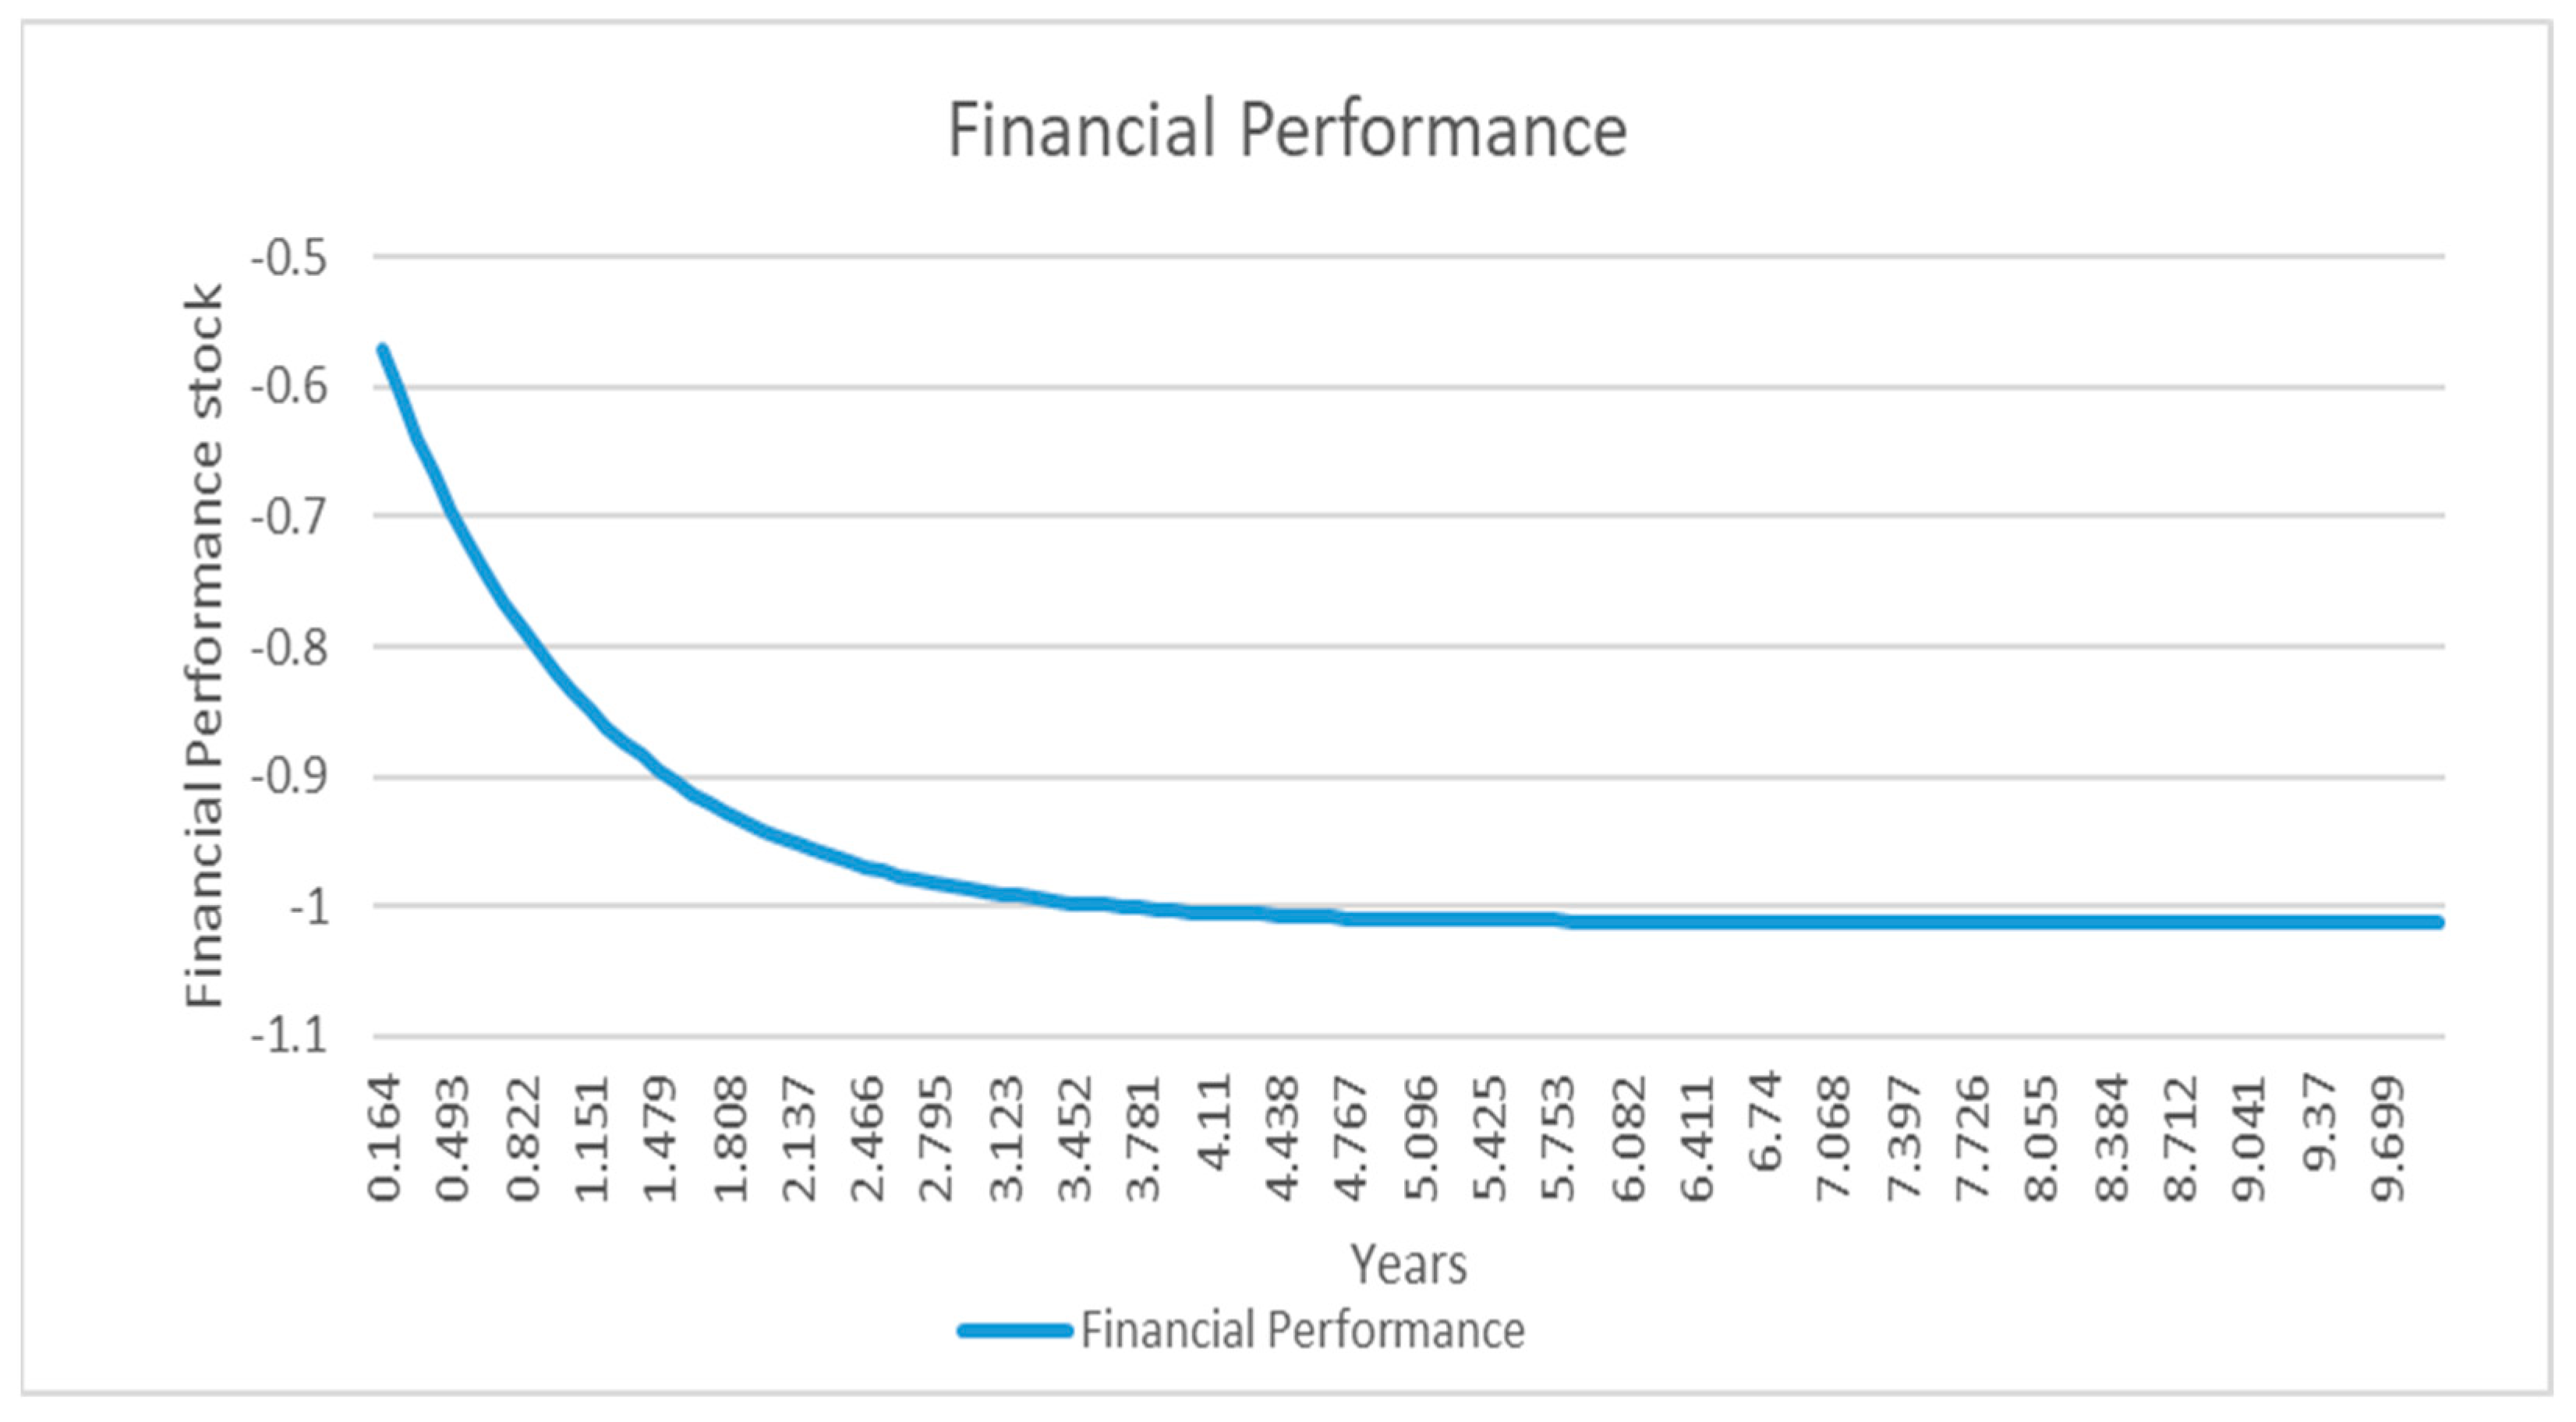
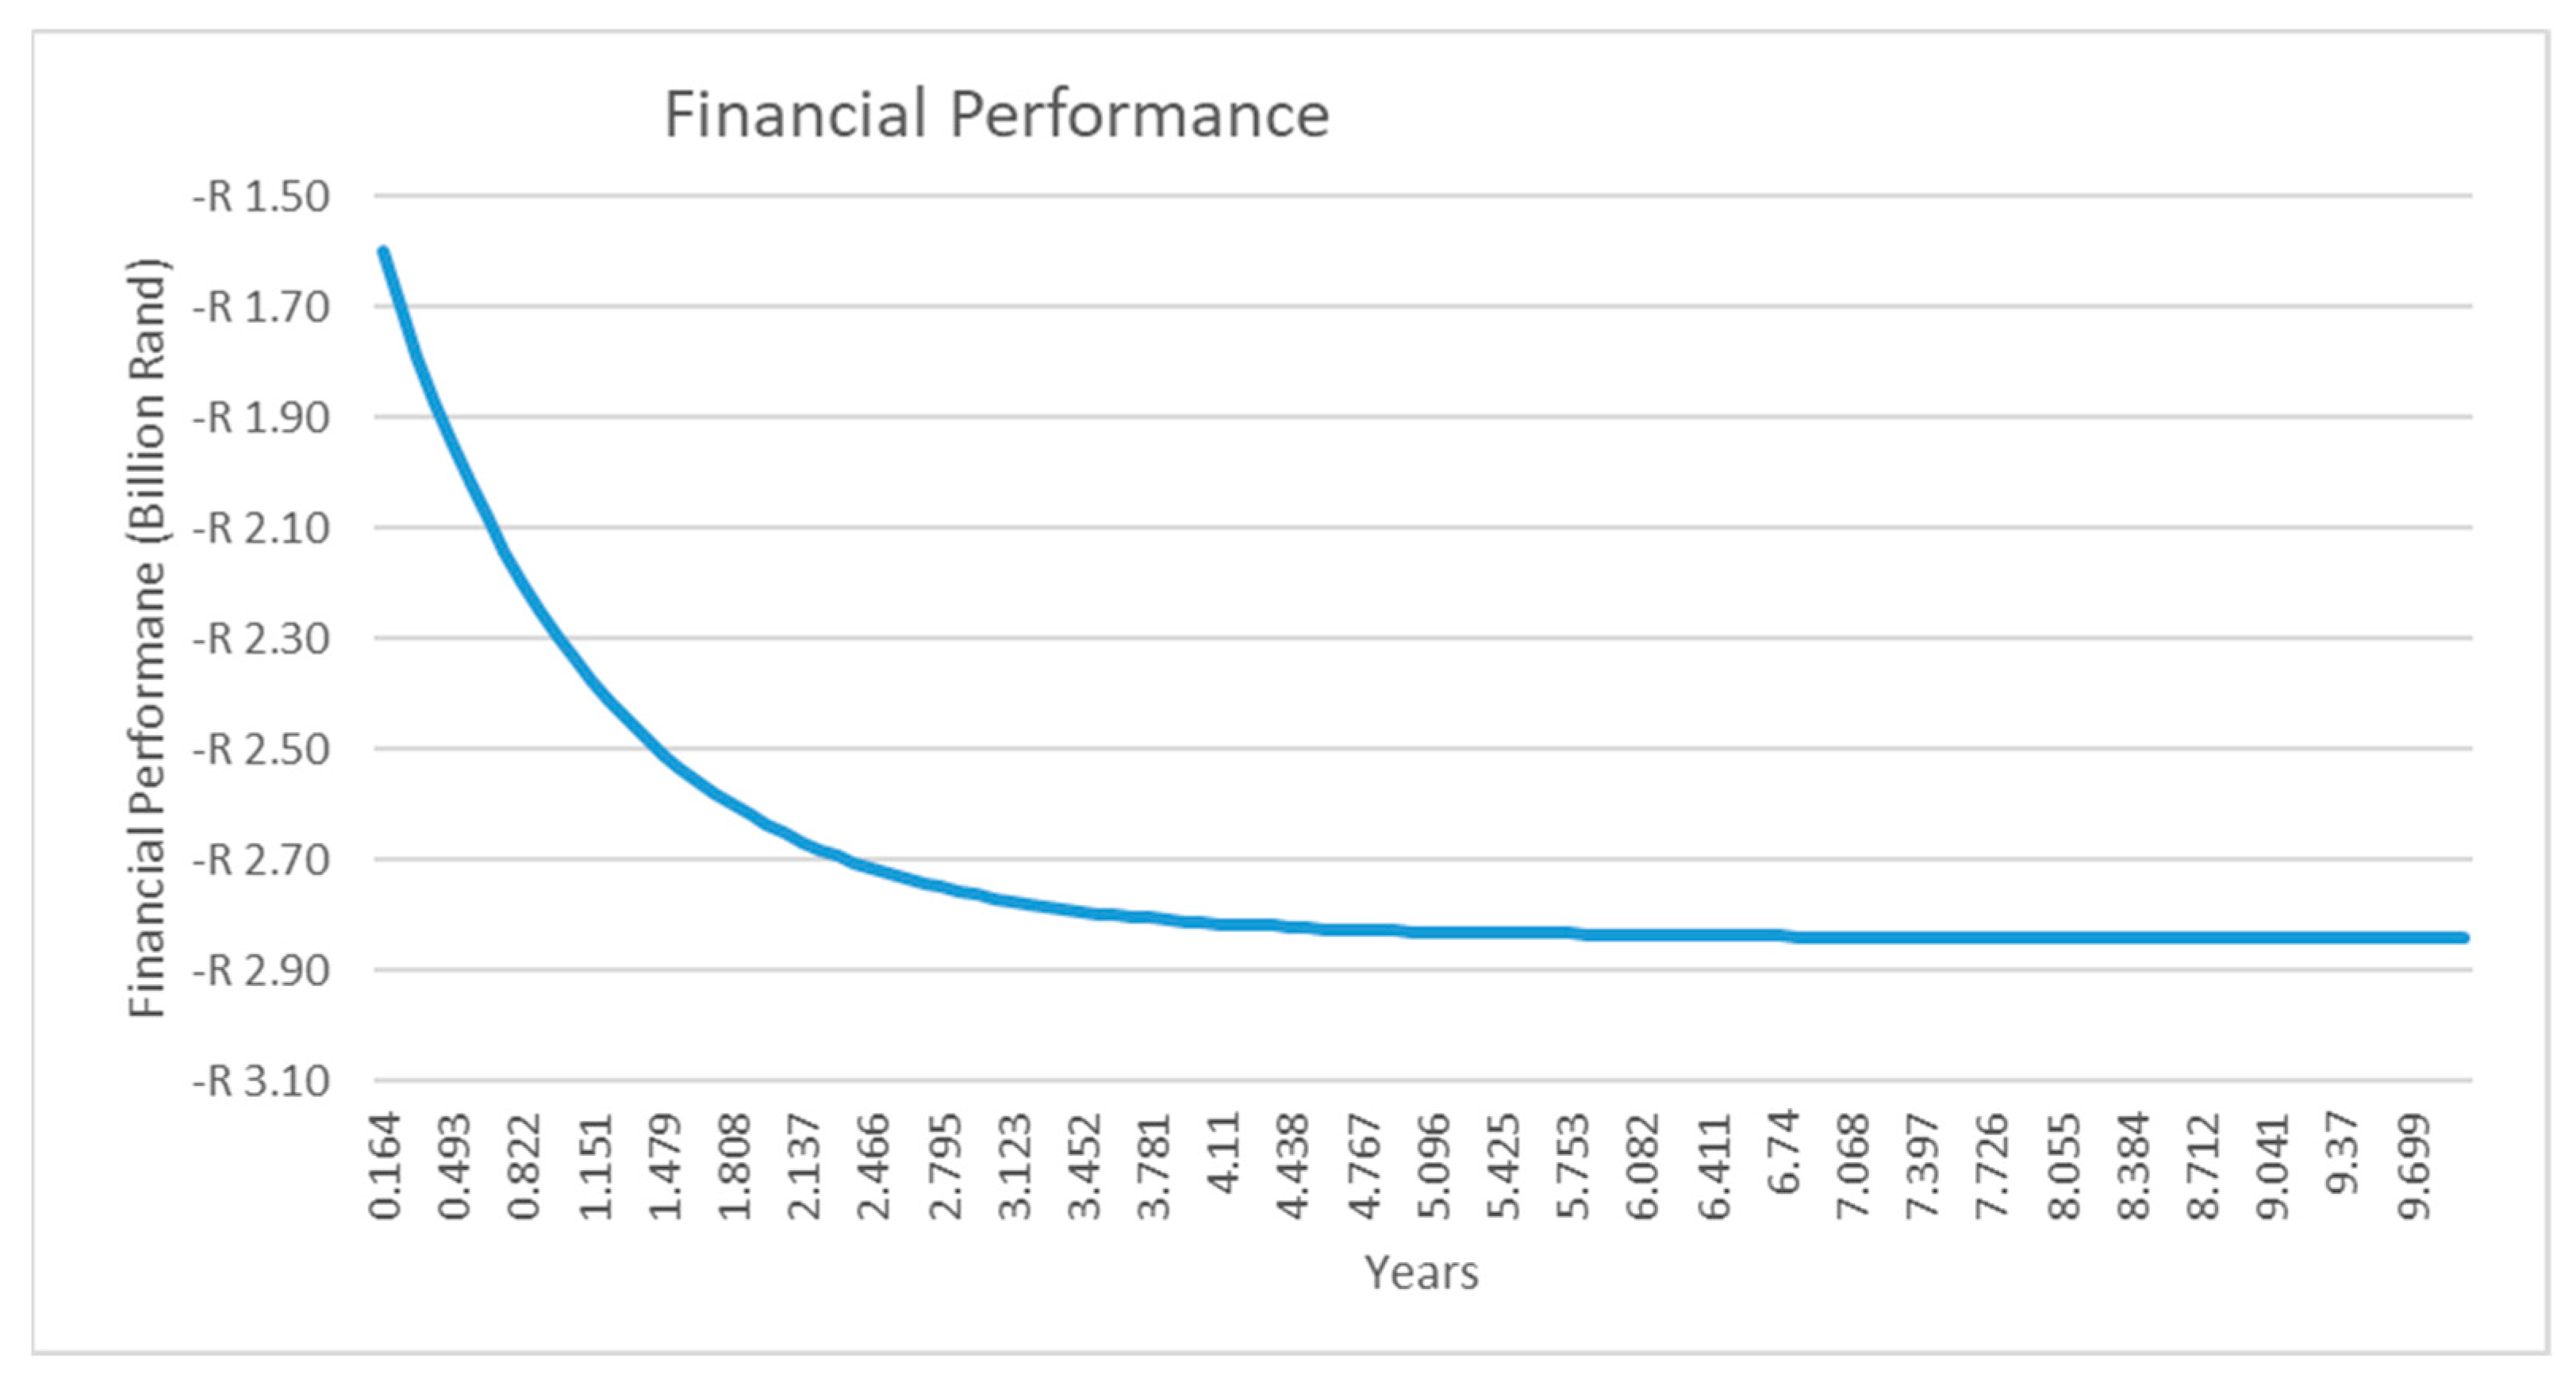
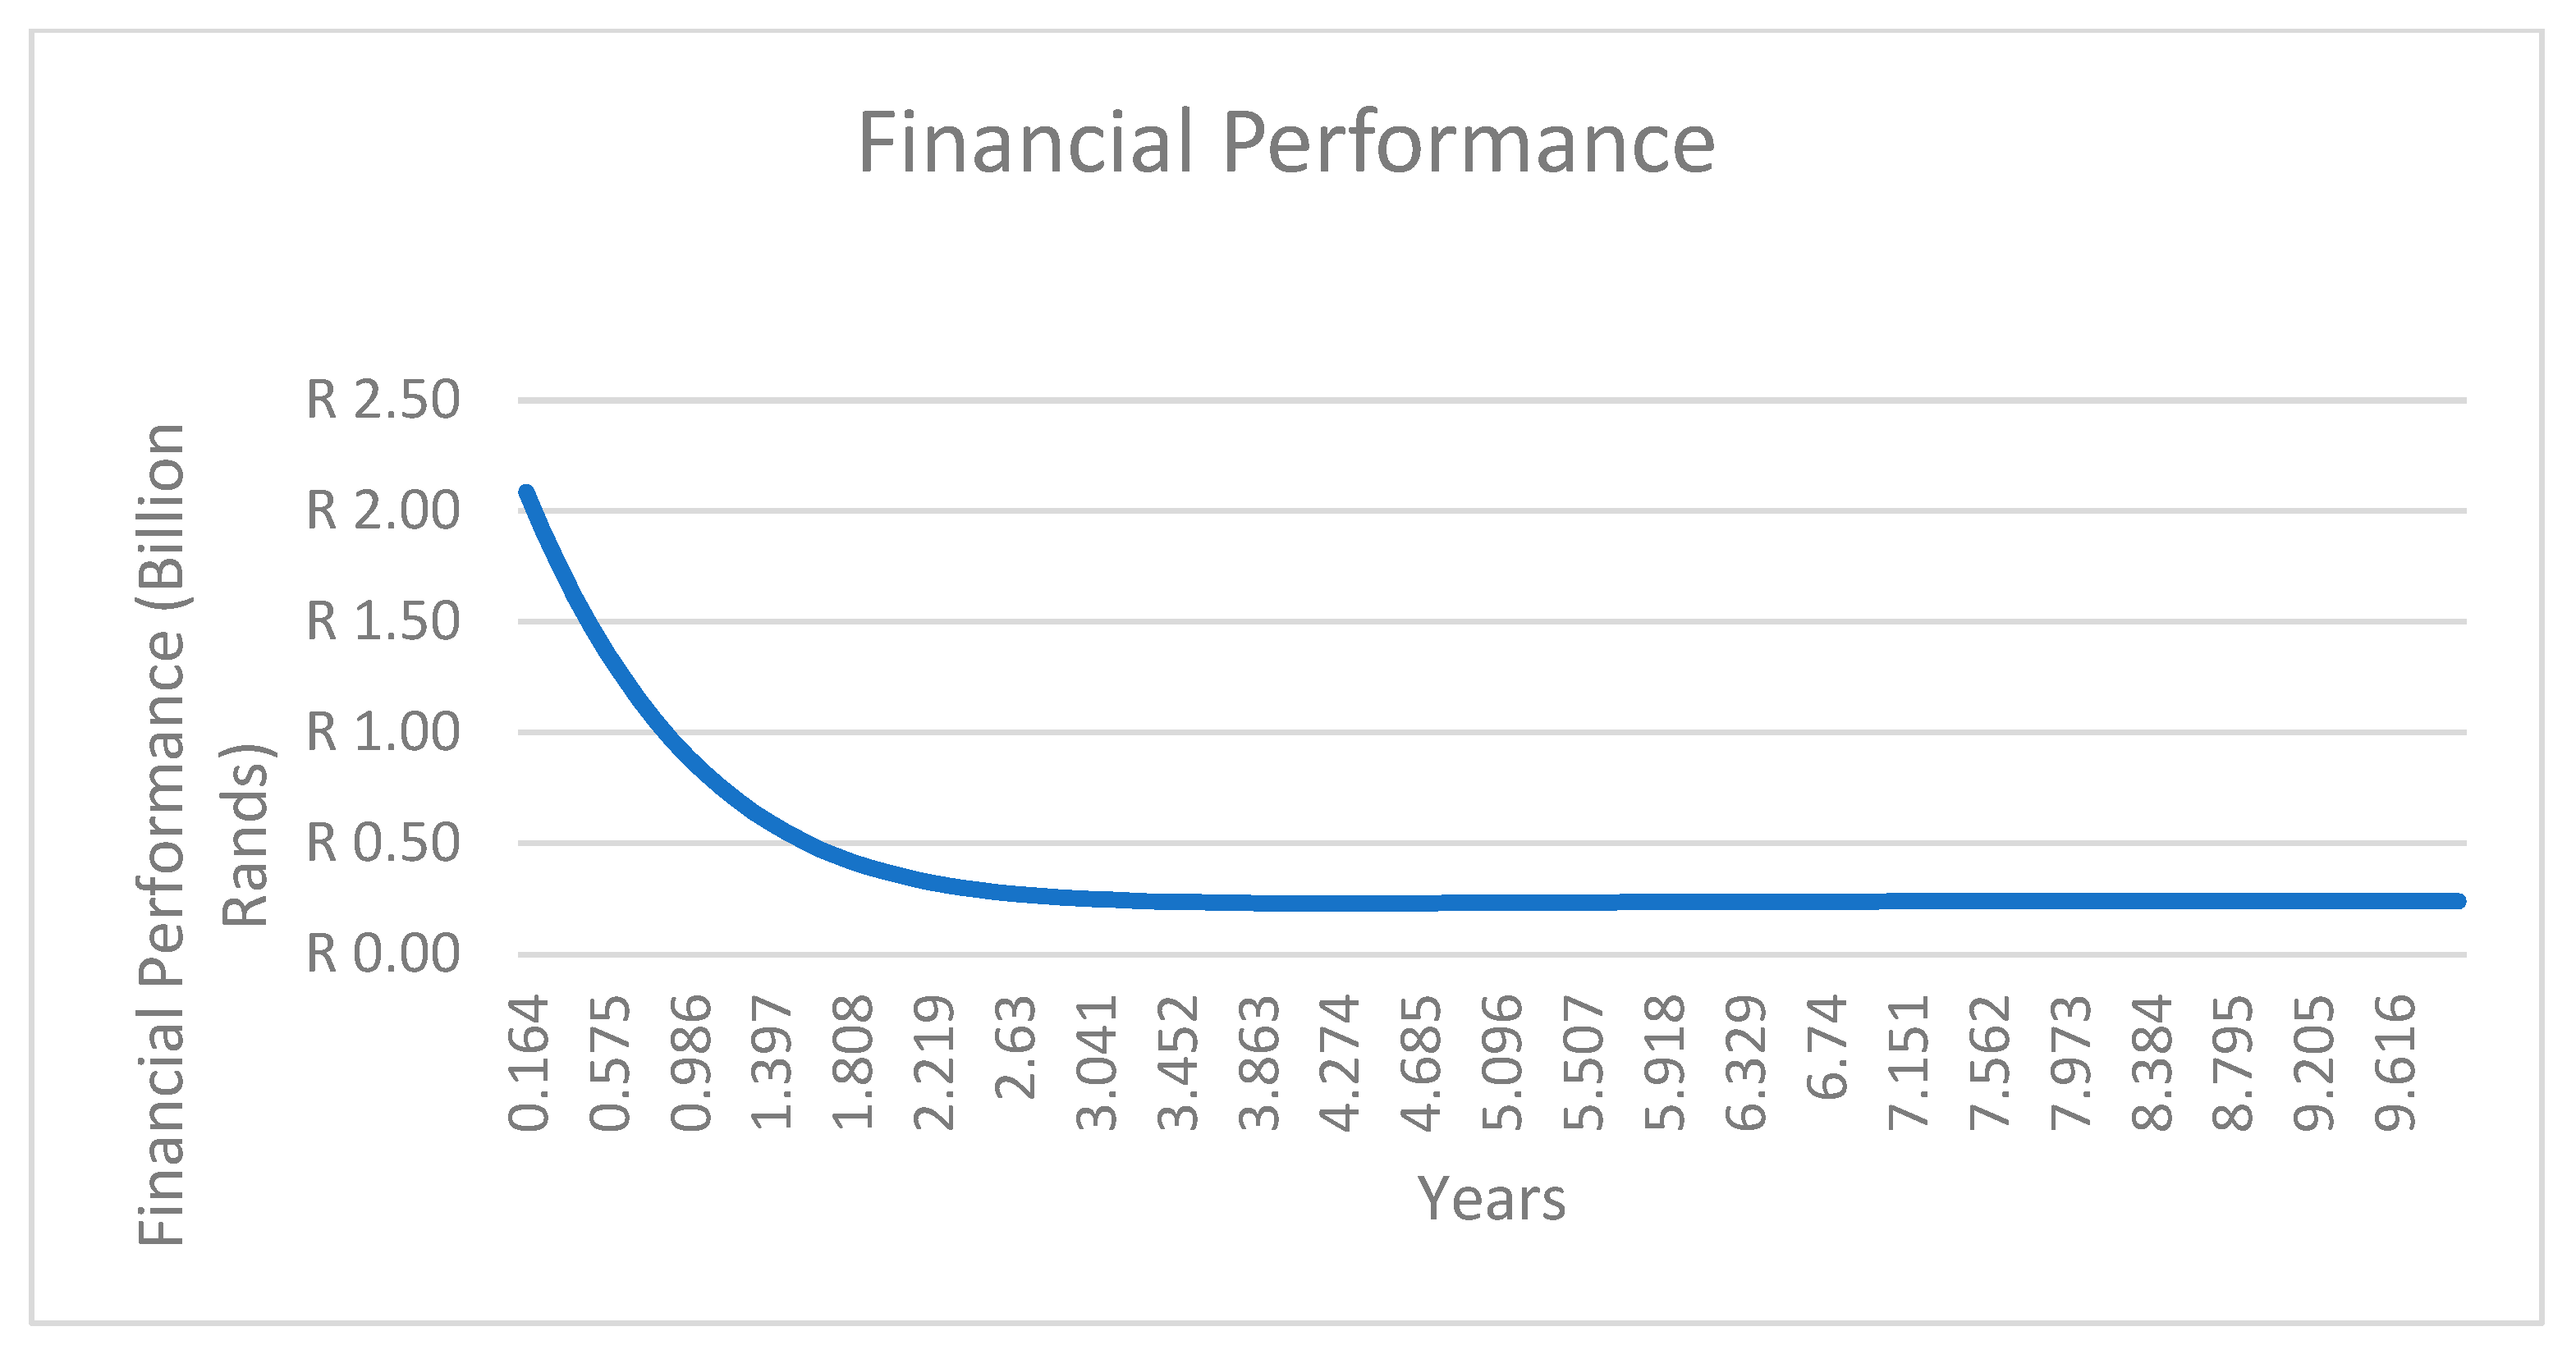
4.2.7. Financial Performance Improvement (Best-Case Scenario 7)

In the baseline conditions as depicted in Figure 9, financial performance is modelled as a function of revenue, other operating income, universal service obligation (USO) actual, USO shortfall, and rural population on the reinforcement side of the loop. The balancing loop parameters that are modelled are staff expenses, operating expenses (OPEX), transport costs, and depreciation. For the financial performance stock, it was found that at baseline conditions, financial performance drops to −0.85 (−R2.4 billion) in 2 years and climbs and flattens at −0.72 (−R2.04 billion) until the end of the simulation period of ten years. The baseline is modelled against the parameters of (i) revenue of 0.75, (ii) other operating income of 0.13, and (iii) actual USO of 0.086 and USO shortfall, which are represented in the reinforcing part of the model. The baseline was further modelled against parameters in the balancing part of the model, which were (i) a staff cost of 0.8, (ii) OPEX of 0.42, (iii) transport costs of 0.0551, and (iv) depreciation of 0.06.
The best-case scenarios, depicted in Figure 20 and Figure 21, respectively, are modelled against the parameters of (i) revenue of 0.75, (ii) other operating income of 0.13, and (iii) actual USO of 0.086. For the financial performance stock, it was found that in the best-case conditions, it begins at 0.687, which translates to R2.09 billion, and it then declines and settles in 2.2 years at 0.079, which translates to R0.240 billion. The best case was further modelled against parameters in the balancing part of the model, which were (i) a staff cost of 0.67, (ii) OPEX of 0.7, (iii) transport costs of 0.2, and (iv) depreciation of 0.06. The new contributions of expenses make up 100% of the 40% threshold of total expenses to total revenue as best practice. The results are consistent with the research on strategic management dynamics by [21,22], whose research was focused on business strategy effects on organizational performance.
In the overall best-case structure depicted in Figure 22, the different curves illustrate the desired performance of each stock (operations capability maturity, digital culture, adoption, and financial performance), as articulated in their respective reference mode behavior patterns, as well as the subsequent delayed responses for digital culture, adopters, and financial performance. The operations capability maturity stock exhibits a goal-seeking behavior pattern as it moves to its goal value of 1, which is the maximum point that can be reached; the goal is to reach an operations capability maturity of 1. The operations capability maturity commences at 0.334 and progressively settles at 0.9; this means that in the best-case conditions, it is possible to exceed the 0.6 set for Southern Africa and move closer to the ideal goal of 1, which is measured through the Integrated Index of Postal Development (2IPD).
The digital culture stock exhibits an s-shaped behavior and is consistent with the literature and real-life conditions, because culture is an integrator and diffuses over time. The digital culture stock is impacted by the adoption stock, which results in the digital culture stock exhibiting its s-shaped behavior. The digital culture stock starts at an initial value of 0.479 in the year 0.164 and eventually reaches a value of 0.947 after ten years. The potential adopters’ stock commences at an opening value of 0.98 and exhibits an inverse s-shaped behavior, ultimately reaching a low value of 0 in 2.5 years. The adopters’ stock commences at an opening value of 0.049 and exhibits an s-shaped behavior, eventually reaching a high value of 1 in 2.5 years. It should be noted that the stocks for potential adopters and adopters are interconnected, which implies that when a unit of the potential adopters’ stocks flows out, it becomes an inflow to the adopter stock (this relationship is demonstrated by their inverse behavior patterns).
The financial performance stock exhibits an interesting s-shaped behavior, and this behavior is expected because of the impact of the adoption stock and digital culture stock, which exhibit an s-shaped impact on the financial performance stock. The financial performance is depicted in Figure 21 and Figure 22 as a percentage and Rand value, respectively. The financial performance (competitiveness) stock stands at 0.684, which translates to R2.07 billion in year 0.164, and settles at 0.332, which translates to R0.970 billion in year 9.94. It is noteworthy that the best-case overall scenario for all stocks illustrates the core principle of the interplay of variables in a dynamic setting, as depicted in Figure 21. The interface of variables results in an improvement in all stocks compared to the best-case performance of the stocks as stand-alone stocks.
Figure 22 depicts the best-case performance that is shown in Figure 23 against the base-case performance originally depicted in Figure 9. There is a substantial improvement in the performance of all stocks from their base-case performance as depicted in Figure 23 The financial performance moves from −0.722 in 0.164 years, which translates to a loss of R2.04 billion in 9.945 years in the base-case scenario, to a profit of 0.322, which translates to R0.970 billion in 9.945 years in the best-case scenario. For the same period, digital culture moves from 0.673 in the base-case scenario to 0.947 in the best-case scenario, while operations capability moves from 0.479 in the base-case scenario to 0.901 in the best-case scenario. The dynamic behavior of potential adopters and adopters in the base-case scenario reach values of 0 and 1, respectively, in about four years, while, in the best-case scenario, the adopters and potential adopters reach values of 1 and 0, respectively, in about 2 years, which is an improvement of 50% in performance. The results are consistent with the systems theory that “the whole is greater than the sum of its parts”, articulated by Meadows [14,23,24,25]. Figure 23 demonstrates this timeless principle of systems theory when comparing standalone best-case scenarios for various stocks against when they interact in a dynamic setting.

5. Conclusions and Recommendations

5.1. Conclusions

In this paper, the system dynamics (SD) model was exposed to structure validity tests that comprised (i) direct structure tests, which included structure confirmation tests, parameter confirmation tests, and dimensional consistency tests; (ii) indirect structure tests, which included an extreme conditions test and boundary adequacy test. In the boundary adequacy test, the SD model was modified to include a plausible additional structure in which the following constants were made endogenous to vary with time based on feedback: (a) impact increase in adopters, (b) impact decrease in adopters, (c) impact increase in capability maturity, (d) impact decrease in capability maturity, (e) impact increase in digital culture, (f) impact decrease in digital culture, (g) postal readiness index, (h) compliance with electronic advance data (EAD), and (i) major obstacles to digital postal services.
During the structure confirmation test and parameter confirmation test, the model was shared with digital transformation experts and policymakers in the postal sector to assure that it mirrored the realities of the postal sector. The dimensional consistency tests were conducted to analyze the SD model’s rate equations, and the Anylogic Personal Learning Edition (PLE) software was used to scrutinize the consistency of the dimensions in the model. A structure-oriented behavior test was conducted to guarantee that the model correlated with the literature, while extreme conditions tests were conducted to assure that the SD model performed as anticipated even in extreme conditions.
Seven design and analysis scenarios were considered and covered the following aspects: (i) Scenario 1, which can be classified as business as usual, which was based on base-case conditions; (ii) adoption improvement, which is Scenario 2; (iii) adoption decline, which is Scenario 3, where an adoption decline results in the overall deterioration of all the other stocks; (iv) operations capability improvement, which is Scenario 4; (v) digital culture improvement, which is Scenario 5; (vi) financial performance improvement; and (vii) the combination of Scenarios 2, 4, 5, and 6.
The SD model that was conceptualized and constructed in this research and depicted in Figure 3, Figure 4 and Figure 5 represents the postal digital transformation dynamics in Southern Africa and on a global scale. The model was proven useful to postal administrators and policymakers during the validation and verification phase, and it will prove to be a useful tool for decision making in the postal sector in Southern Africa and globally. The policy design and analysis conducted in this study afford policymakers and postal administrators a vital tool to explore a range of choices and levers to pull to improve the sustainability of the postal sector. The SD model constructed in this research contributes to new knowledge that can be utilized by the postal sector to improve the sustainability of the postal sector in Southern Africa and beyond the Southern Africa region.

5.2. Recommendations

5.2.1. Implications for Practice

  • Improving marketing effectiveness to at least 20%, improving adoption fraction to at least 15%, and improving contact rate to at least 25 key customers per annum.
  • Managing and preventing “dis-adoption” by key customers and improving the postal readiness index to at least 90% by (a) increasing the number of digital financial payment services offered, (d) increasing the e-post and e-government services offered, (c) increasing the number of total support services offered, (d) increasing the number of e-commerce services offered, (e) expanding physical service features in line with integrated product plan.
  • Ensure that an enterprise architecture (EA) blueprint is developed and implemented through an employee engagement process to ensure the “alignment and buy-in” of all staff; the EA blueprint is the factor that ensures that everyone in the organization holds the same “mental picture”, which fosters a shared vision.
  • Enroll staff in train post courses to prepare a digitally competent workforce and ensure that at least 10% are trained by 2025, with the remainder scheduled to complete training before 2028.
  • Improve compliance with quality of service to above 85% and compliance with electronic advance data (EAD) to above 95% through improved scanning and business processes optimization.
  • Ensure cost optimization of staff expenses and operating expenses to ensure that the total expenses do not exceed the best practice of 40% of the total revenue; this is a critical success factor to ensure the sustainability of the DPO. This requires the streamlining of resources including human capital.

5.2.2. Implications for Policy

  • Ensure that designated postal operators receive the due Universal Service Obligations (USO); the DPOs should receive a percentage of their total expenses as USO. This is calculated from the percentage of the rural population; in the pilot study in the context of South Africa, the rural population stands at 33%. The rationale is that the total expenses are inclusive of shared services (e.g., ICT, human resources, properties, and finance) and operations (retail, delivery, and depot staff expenditure, transportation expenses, and sundry expenses); rural operations are not profitable compared to urban and metropolitan operations and, due to USO requirements, postal services are a universal right and even rural citizens are entitled to the services regardless of viability.
  • The stability of the executive is of prime importance and, in particular, the role of the Chief Operating Officer (CEO) or Postmaster General (PMG). The Board of Directors and particularly the shareholders should protect the office of the CEO/PMG and ensure that the CEO/PMG completes their term. This study’s findings point out that instability in the role of CEO/PMG results in instability of the entire organization. The CEO/PMG must be provided with the necessary support from the shareholders and the CEO/PMG must be allowed to execute their responsibilities without political hindrance. Instability at the upper echelons of the organization results in a morale decline and a toxic culture emerging, which undermines the shared vision and cohesion.

Author Contributions

Conceptualization, K.M.; methodology, K.M.; software, K.M.; validation, K.M. and S.X.; formal analysis, K.M.; investigation, K.M.; resources, K.M.; data curation, K.M. and S.X.; writing—original draft preparation, K.M.; writing—review and editing, M.G.K.-K. and R.W.M.; visualization, K.M.; supervision, M.G.K.-K. and R.W.M.; project administration, K.M. All authors have read and agreed to the published version of the manuscript.

Funding

This research received no external funding.

Data Availability Statement

Not applicable.

Conflicts of Interest

The authors declare no conflict of interest.

References

  1. UPU. Annual Strategic Review 2017. Bern. 2017. Available online: https://www.upu.int/UPU/media/upu/files/UPU/aboutUpu/strategy/annualStrategicReview2017En.pdf (accessed on 2 June 2023).
  2. UPU. Postal Development Report. Berne. 2018. Available online: https:www.upu.int/en/Publications/2IPD/Postal-Development-Report-2017 (accessed on 2 June 2023).
  3. UPU. Postal Development Report 2018. Available online: https://www.upu.int/en/Publications/2IPD/Postal-Development-Report-2018 (accessed on 2 June 2023).
  4. UPU. Postal Development Report. Berne. 2019. Available online: https://www.upu.int/en/Publications/2IPD/Postal-Development-Report-2019 (accessed on 2 June 2023).
  5. UPU. Postal Development Report 2020. Berne. 2020. Available online: https://www.upu.int/en/Publications/2IPD/Postal-Development-Report-2020 (accessed on 2 June 2023).
  6. Mutingi, M.; Matope, S. Dynamics of information technology adoption in a complex environment. In Proceedings of the 2013 IEEE International Conference on Industrial Technology (ICIT), Cape Town, South Africa, 25–28 February 2013; pp. 1466–1471. [Google Scholar] [CrossRef]
  7. USPS. Riding the Waves of Postal Digital Innovation. Washington DC. 2016. Available online: https://www.uspsoig.gov/sites/default/files/document-library-files/2016/RARC-WP-16-014.pdf (accessed on 5 July 2023).
  8. (ITU) International Telecommunication Union. Report on the Implementation of the Strategic Plan and Activities of the Union for 2018–2019 (ITU Annual Progress Report). 2019. Available online: https://www.itu.int/en/council/planning/Documents/Annual-report-2018.pdf (accessed on 5 July 2023).
  9. Melnikovas, A. Towards an Explicit Research Methodologyy: Adapting Research Onion Model for Future Studies. J. Futur. Stud. 2018, 23, 29–44. [Google Scholar] [CrossRef]
  10. Mokgohloa, K.; Kanakana-Katumba, G.; Maladzhi, R.; Xaba, S. A Grounded Theory Approach to Digital Transformation in the Postal Sector in Southern Africa. Adv. Sci. Technol. Eng. Syst. J. 2021, 6, 313–323. [Google Scholar] [CrossRef]
  11. Sterman, J.D. System dynamics modeling: Tools for learning in a complex world. IEEE Eng. Manag. Rev. 2002, 30, 42–52. [Google Scholar] [CrossRef]
  12. Richardson, G.P. System Dynamics Review. Syst. Dyn. Rev. 2011, 27, 219–243. [Google Scholar] [CrossRef]
  13. Maldonado, M.U.; Grobbelaar, S.; Uriona, M.M.; Grobbelaar, S.S. System Dynamics Modelling in the Innovation Systems Literature. No. June, p. 32. 2017. Available online: https://www.researchgate.net/publication/319545608 (accessed on 10 February 2023).
  14. Sterman, J.D. Business Dynamics: Systems Thinking and Modeling For a Complex World; McGraw-Hill: London, UK, 2000. [Google Scholar] [CrossRef]
  15. Mokgohloa, K.; Kanakana-Katumba, G.; Maladzhi, R. Development of a technology and digital transformation adoption framework of the postal industry in Southern Africa: From critical literature review to a theoretical framework. Adv. Sci. Technol. Eng. Syst. 2020, 5, 1190–1206. [Google Scholar] [CrossRef]
  16. Chao, C.M. Factors determining the behavioral intention to use mobile learning: An application and extension of the UTAUT model. Front. Psychol. 2019, 10, 1652. [Google Scholar] [CrossRef] [PubMed]
  17. Barlas, Y. Formal aspects of model validity and validation in system dynamics. Syst. Dyn. Rev. 1996, 12, 183–210. [Google Scholar] [CrossRef]
  18. Pruyt, E. Small System Dynamics Models for Big Issues; TU Delft Library: Delft, The Netherlands, 2013. [Google Scholar]
  19. Morecroft, J.D.W. Strategic Modelling and Business Dynamics: A Feedback Systems Approach; John Wiley & Sons: Hoboken, NJ, USA, 2015. [Google Scholar]
  20. Ceresia, F. The Dynamics of the Organizational Culture in a Municipality. In Proceedings of the 31st International Conference of the System Dynamics Society, Cambridge, MA, USA, 21–25 July 2013; ISBN 9781632661630. [Google Scholar]
  21. Trivellas, P.; Reklitis, P.; Konstantopoulos, N. A dynamic simulation model of organizational culture and business strategy effects on performance. AIP Conf. Proc. 2007, 963, 1074–1077. [Google Scholar] [CrossRef]
  22. Warren, K. Strategic Management Dynamics; John Wiley and Sons: West Sussex, UK, 2008. [Google Scholar]
  23. Meadows, D.H. Thinking in Systems; Earthscan Publishers: London, UK, 2009. [Google Scholar]
  24. Haraldsson, H.V. Introduction to System Thinking and Causal Loop Diagrams; Department of Chemical Engineering, Lund University: Lund, Sweden, 2004. [Google Scholar]
  25. Ennen, E.; Richter, A. The whole is more than the sum of its parts or is it? A review of the empirical literature on complementarities in organizations. J. Manag. 2010, 36, 207–233. [Google Scholar] [CrossRef]
Figure 1. The four waves of digital innovation in the global postal sector, adapted from United States Postal Service.
Systems 11 00508 g001
Figure 2. Postal development dynamics CLD as a hypothesis.
Systems 11 00508 g002
Figure 3. Goal-seeking capability structure model formulated in Anylogic PLE software.
Systems 11 00508 g003
Figure 4. S-shaped digital culture structure model formulated in Anylogic PLE software.
Systems 11 00508 g004
Figure 5. S-shaped adoption structure model formulated in Anylogic PLE software.
Systems 11 00508 g005
Figure 6. Dimension consistency check produced by Anylogic PLE software.
Systems 11 00508 g006
Figure 7. Extreme conditions test effects of zero value (adoption, capability maturity, digital culture) on financial performance stock.
Systems 11 00508 g007
Figure 8. Extreme conditions test effects of zero value (Adoption, capability maturity, digital culture) on financial performance stock (Rand).
Systems 11 00508 g008
Figure 9. Behavior reproduction tests (business as usual) at baseline values for all stocks.
Systems 11 00508 g009
Figure 10. A 50% increase in adoption parameter values for adoption stock.
Systems 11 00508 g010
Figure 11. Best-case scenario for adoption stock.
Systems 11 00508 g011
Figure 12. Worst-case scenario for adoption stock.
Systems 11 00508 g012
Figure 13. Impact of 20% drop in adopters on operations capability maturity (baseline).
Systems 11 00508 g013
Figure 14. Impact of 20% drop in adopters on digital culture (baseline).
Systems 11 00508 g014
Figure 15. Impact of 20% drop in adopters on financial performance (baseline).
Systems 11 00508 g015
Figure 16. Impact of 20% drop in adopters on financial performance in Rand (baseline).
Systems 11 00508 g016
Figure 17. Best-case scenario vs. worst-case scenario for adoption stock.
Systems 11 00508 g017
Figure 18. Best-case scenario for digital culture stock.
Systems 11 00508 g018
Figure 19. Best-case scenario for operations capability stock.
Systems 11 00508 g019
Figure 20. Best-case scenario for financial performance stock.
Systems 11 00508 g020
Figure 21. Best-case scenario for financial performance stock in Rand, overall performance (interaction of all stocks in a dynamic setting, Scenario 7).
Systems 11 00508 g021
Figure 22. Best-case dynamics of all stocks.
Systems 11 00508 g022
Figure 23. Best-case and base-case dynamics comparison of all stocks.
Systems 11 00508 g023
Table 1. Barriers to digital adoption and diffusion in the postal sector.
Geographic AreaBarriers
GloballyResource limitations
The shift toward a digital culture
Restrictions on IT capabilities
Deficiency of adequate inner proficiency required to develop e-services
Customs clearance is a significant barrier
Industrialised countriesThe time it takes to shift towards a digital culture
Overall client adoption of digital postal services is sluggish
AfricaLimited financial resources
Poor IT infrastructure
Lack of digital culture
Deficiency of the specialists required to develop e-services
Overall client adoption of digital postal services is sluggish
Disclaimer/Publisher’s Note: The statements, opinions and data contained in all publications are solely those of the individual author(s) and contributor(s) and not of MDPI and/or the editor(s). MDPI and/or the editor(s) disclaim responsibility for any injury to people or property resulting from any ideas, methods, instructions or products referred to in the content.

