
How Innovation Ecosystem Synergy Degree Influences Technology Innovation Performance—Evidence from China’s High-Tech Industry


1
Department of Information Management and Information Systems, School of Business, Jiaxing University, Jiaxing 314001, China
2
Department of Management Science and Engineering, School of Economics and Management, Tongji University, Shanghai 200092, China
3
Department of Network Engineering, School of Artificial Intelligence, Shanghai Normal University Tianhua College, Shanghai 201815, China
4
Department of Business Administration, School of Management, Nanjing University of Posts and Telecommunications, Nanjing 210003, China
*
Author to whom correspondence should be addressed.
Systems 2022, 10(4), 124; https://doi.org/10.3390/systems10040124
Submission received: 20 July 2022
/
Revised: 11 August 2022
/
Accepted: 15 August 2022
/
Published: 18 August 2022
Abstract
:The technology innovation of high-tech industries has become an important support for the innovation-driven strategy. This study introduces innovation ecosystem synergy as a moderating variable from a systemic and holistic perspective based on the traditional perspective of innovation factor input-output, and helps construct a technology innovation performance driving model based on the Cobb–Douglas knowledge production function, which enriches the discussion perspective and theoretical model research on technology innovation performance. With a sample of 28 provinces in mainland China, this study empirically analyzed the moderating mechanism of innovation performance by innovation synergy in high-tech industries during the two stages of technology development and technology transformation. The findings of the study are as follows: (1) Independent research and development has a positive and significant impact on technology development performance; product innovation has a positive and significant impact on technology transformation performance; (2) Technology introduction can weaken technology development performance due to technology dependence and the inhibitory effect on independent innovation, and inefficient technology renovation can negatively and significantly affect technology transformation performance.; (3) The degree of synergy has a positive and significant impact on the performance of technology development innovation and technology transformation innovation. The degree of synergy has a positive moderating effect on the innovation performance of independent R&D and technology development, as well as product innovation and technology renovation, and a negative moderating effect on the innovation performance of technology introduction and technology development, but no significant moderating effect on technology renovation and technology transformation performance. The research results can provide a reference for the improvement of the technology innovation performance of regional high-tech industries.
1. Introduction
In recent years, China’s economy has been in the transition stage of shifting from high-speed growth to high-quality development [1]. The implementation of an innovation-driven development strategy to achieve a fundamental shift in the dynamics of economic and social development has become an inevitable requirement and strategic initiative to enhance China’s comprehensive national power and international competitiveness. Technology innovation plays a very important role in economic and social development as well as coping with global emergencies in the context of the COVID-19 pandemic. High-tech industries, which are knowledge- and technology-intensive, have long been the main carrier and driving force of technology innovation in China [2]. Based on the subjective desire for industrial upgrading or the objective need of the market, technology innovation has become an important driving force for the transformation and upgrading of high-tech industries and the enhancement of their core competitiveness [3]. Technology innovation is an important basis for the development of the high-tech industry, the performance of technology innovation is an important indicator to measure the development level of the high-tech industry, and it is of great theoretical and practical significance to explore the mechanisms to enhance the technology innovation performance of the high-tech industry to achieve high-quality economic development.
Scholars have focused on the technology innovation performance of high-tech industries in the following two aspects: on the one hand, from the perspective of the influence of innovation factor inputs (including human, knowledge, technology, and funding factors) on technology innovation performance. In terms of the human factor, Wei et al. (2020) focused on the relationship between international talent inflow and enterprises’ R&D investment, and from this established a mathematical model of the synergistic effect of the two on the enterprises’ technological innovation performance [4]. Concerning knowledge factors, Zhou and Li (2012) analyzed the impact of external knowledge acquisition on radical innovation [5]. From a technical perspective, Usai et al. (2021) revealed the impact of digital technology adoption on the technological innovation performance of firms [6]. Considering the impact of funding sources, Yigitcanlar et al. (2018) empirically analyzed the impact of different sources of funding on innovation performance with the help of firm-level data from Brazil [7]. Focusing on government support, Shao and Chen (2022) discussed the role of government R&D subsidies in promoting green technology innovation [8].
On the other hand, from the perspective of the influence of industry-related characteristics and attributes on technology innovation performance. Wang and Wang (2022) used absorptive capacity as a mediating variable and confirmed that knowledge search capability is an effective way to rapidly improve technology innovation performance [9]; Kim and Kim (2018) analyzed the positive impact of IP management capability on firms’ open innovation performance using the ICT industry as an example [10]; Yang et al. (2020) investigated the interactive effects of global value chains and industrial agglomeration on technology innovation performance using the manufacturing industry as an example [11]. Puriwat and Hoonsopon (2022) discuss the impact of organizational agility and flexibility on technology innovation performance in the context of technological turbulence [12]. Hu et al. (2020) contrasted the impact of different innovation models on technology innovation performance, arguing that the impact of innovation models on technology innovation performance is regionally heterogeneous [13]. Lee and Tsai (2005) argued that a firm’s operating model indirectly affects technology innovation performance by influencing the innovation ability of the enterprise [14]. Jian and Heng (2017) argue that seeking external knowledge sourcing under open innovation conditions and valuing non-R&D innovation pathways are effective innovation transformation strategies compared to traditional in-house R&D innovation and internal R&D [15].
In general, the existing literature mostly considers the impact of a single factor or a combination of several factors on technology innovation performance. However, technology innovation is a complex systemic process, and the influence of related factors on innovation performance does not function independently [16]. The impact of correlated factors on technology innovation performance often works by influencing the technology innovation ecosystem [17]. The discussion of factors influencing technology innovation performance through single factors as well as simple combinations of several factors has yielded rich results, but related studies have neglected the impact of the degree of synergy between factors in the technology innovation ecosystem on technology innovation performance. Thus, it is necessary to further discuss the impact of synergy on technology innovation performance from the perspective of the innovation ecosystem.
Therefore, this study introduces the innovation ecosystem synergy degree as a moderating variable from the systematic and holistic perspective based on the technology innovation input-output perspective. We construct a technology innovation performance driving model based on the synergy degree model and knowledge production function, with the high-tech industry as the research object, and divide the technology innovation process into two stages: technology development and technology transformation, as shown in Figure 1, and we empirically analyze the influence mechanism of the regional high-tech industry innovation synergy degree on innovation performance with a sample of 28 provincial-level administrative regions in mainland China. This study enriches the theory related to technological innovation performance by exploring the influence of system synergy on the technological innovation performance of high-tech industries, and it also provides relevant policy optimization references for regional technology innovation.
The remainder of this paper is organized as follows. Section 2 provides a short review of the synergy degree model and the technology innovation performance model, and then explains the basis for the selection and screening of the variables and data; Section 3 conducts the correlation analysis and multicollinearity tests; Section 4 and Section 5 provide the empirical estimates and discusses the results, respectively; Section 6 presents the concluding remarks, policy implications, and limitations of this study briefly.
2. Materials and Methods
2.1. Synergy Degree Model
The synergy degree refers to the extent to which the innovative R&D population, production and operation population, and innovation habitat are synergistic and consistent with each other in the development of a high-tech industrial technology innovation ecosystem [18]. The innovation R&D population consists of four types of indicators: R&D innovation personnel, R&D innovation funds, R&D innovation technology, and R&D innovation organization. The production and operation population is composed of three types of indicators: production and operation scale, production experience quality, and product innovation performance. The innovation habitat consists of two types of indicators: fixed assets and basic investment.
According to the composite system synergy model proposed by Meng and Han [19], the corresponding synergy measurement model of this study is established by combining the characteristics of the high-tech industrial innovation ecosystem. The innovation ecosystem of high technology industries is denoted by T, and the population is denoted by , , and the population size variables in the development process are represented by In this study, it is assumed that the larger the value of , the higher the degree of order in the system and vice versa. It is also assumed that the larger the value of , the lower the degree of order in the system and vice versa. We define the order degree of scale component of the population as , as shown in Equation (1):
For a given initial moment , we set the orderliness of the population to . Then, for the whole innovation complex system at moment in the evolution process, the order parameter of each population is , and the synergy degree of the innovation ecosystem of high-tech industries is as shown in Equation (2):
2.2. Technology Innovation Performance Model
The knowledge production function reflects the relationship between knowledge production inputs and outputs and is widely used to assess the impact of R&D inputs on regional innovation levels [20,21]. Beckmann (1995) interpreted the knowledge production model of economic organizations from the perspective of knowledge networks and argued that when there is active cooperation among individuals, the knowledge production function is similar to the Cobb–Douglas production function [22]. Therefore, this study draws on the Cobb–Douglas knowledge production function model to construct an econometric model of technology innovation performance, as shown in Equation (3):
In Equation (3), is the generalized level of technological progress, is the enterprise technology innovation funding input, and is the personnel input.
Since the technological innovation population relationship and the synergy degree () also affect the technological innovation of enterprises, the ecological relationship and the synergy degree of the innovation ecosystem of the high-tech industry are introduced into the knowledge production function as the influencing factors of the innovation performance of the high-tech industry, and Equation (3) is logarithmically processed. Considering the lagged influence of the innovation input on innovation performance, the average lag period of the innovation input on the innovation performance of this study is set to 2 years [23]. The technology innovation process was also divided into two stages: the technology development stage and the technology transformation stage [23]. Considering the contribution of innovation inputs, such as independent R&D (), technology introduction (), product innovation (), and technology renovation () to innovation performance, and considering the influence of production and operation scale () and fixed assets and investment () on innovation performance, this study constructs two technology innovation performance measurement models: technology development performance model and technology transformation performance model.
The technology development performance () model is shown in Equation (4):
and the technology transformation performance () model is shown in Equation (5):
In Equations (4) and (5), denotes different provincial domains, denotes the year, and given that the innovation performance has a lagged effect, the year of the variable other than the explained variables are and are random intervention terms.
2.3. Variables and Data
The data samples for this study were taken from the China High Technology Industry Statistical Yearbook and China Statistical Yearbook, covering 28 provincial-level administrative regions in mainland China except for Tibet, Qinghai, and Xinjiang regions based on data availability, with an annual range of 1998–2015, containing nine variables and a total of 4032 observations. The data of the ecological relationships and synergy degree are obtained based on the results of the previous measurements (refer to Supplementary Materials for specific values). To further eliminate the effects of different magnitudes, this study normalizes the data of other variables in the range of [1–100] and does logarithmic treatment and corresponding deflator treatment for each variable. Meanwhile, because the innovation output has a certain lag relative to the innovation input, this study treats the technology innovation performance data with a two-year lag. The variable’s settings and description are shown in Table 1, and the descriptive statistical analysis of the sample is shown in Table 2.
2.3.1. Explained Variables: Technology Innovation Performance
Technology innovation is the process through which new (or improved) technologies are developed and brought into widespread use [24]. In this study, technology innovation is divided into two stages: technology development and technology transformation, and thus technology innovation performance is composed of two parts: technology development performance () and technology transformation performance ().
Technology development performance (). Technology development refers to the process of developing new technologies through both in-house research and development and external technology introduction [24]. As the most valuable output in innovation activities, patents are an important reflection of the innovation performance of industries and regions [25]. Patent applications are less affected by human factors such as government patent agencies, and better reflect the true level of innovation [26]; moreover, the uncertainties of data statistics are smaller, there is no time lag for patent grants, and the data are stable and accessible. Following the literature [26], this study selects the number of patent applications in high technology industries as a measure of technology development performance.
Technology transformation performance (). Technology transformation is the subsequent development, application, and diffusion of technology to increase productivity, resulting in new products, processes, materials, and even industries [27]. Technology transformation innovation is ultimately embodied in new products, and new product sales revenue directly reflects the revenue generated by enterprises’ innovation activities, which is an extremely obvious indicator to measure technology transformation performance [28]. Following the literature [28], this study selects new product sales revenue from the high-tech industry to measure the technology transformation performance.
2.3.2. Explanatory Variables: Independent R&D, Technology Introduction, Product Innovation, Technology Renovation
Technology development performance is mainly influenced by independent R&D and technology introduction, whereas technology transformation performance is mainly influenced by product innovation and technology renovation.
Independent R&D () is the independent innovation activity carried out by enterprises relying on their strength. It is the primary way for countries and industries to achieve technological progress [29]. Independent R&D can create and accumulate knowledge, promote product and technological progress, and technology renovation, thus providing a constant source of power and support for sustainable economic growth based on the new economic growth theory [30]. Following the literature [30,31], is measured by the actual expenditure of the enterprise on internal R&D activities in the reporting year, i.e., internal expenditure on R&D.
Technology introduction () refers to the process of acquiring advanced technology from abroad through international technology exchange and transfer [32]. It is an important way for developing countries to achieve a technological catch-up. International trade theory suggests that by introducing, digesting, and absorbing the advanced technology from developed countries, developing countries can acquire new international inventions, creativity, and technology more quickly [30]. Following the literature [33], is measured by the sum of expenditure on technology introduction, digestion and absorption, and purchase of domestic technology.
Product innovation () refers to the use of new technical principles, new design concepts, or significant improvements in structure, materials, and processes over the original product, thereby significantly improving the performance of the product or expanding the function of the product, to achieve technology transformation innovation, development, and production of new products [34]. According to the literature [34], product innovation investment contributes significantly to technology transformation innovation, therefore, product innovation is measured by expenditures on new product development in this study.
Technology renovation () refers to the enterprise adhering to the premise of scientific and technological progress, the application of scientific and technological achievements in the field of products, equipment, processes, etc., with advanced technology, equipment instead of backward technology, equipment, to achieve the expansion of reproduction based on internal content, to improve product quality, to promote product renewal, energy saving, reduce consumption, and improve overall comprehensive economic benefits. Following the literature [35], since organizations often view technology renovation investments as a way to combat competition by improving productivity, profitability, and operational quality, technology renovation is, therefore, measured by the expenditure on technology transformation in this study.
2.3.3. Moderator Variables: Synergy Degree
Synergetics focuses on how open systems evolve spontaneously from disordered to ordered states through their internal synergies in the presence of material or energy exchange with the outside world [36]. Synergy degree () is a measure of the degree of synergy between the subsystems in a system [36]. The synergy degree () of the high-tech industry in this study is measured by using the calculated synergy degree of the high-tech industry innovation ecosystem in 28 provinces of China and is standardized to adjust the value range of [1,100], which is assumed to have an impact on innovation performance.
Following the literature [18], the development level of the production and management population consists of three types of indicators: production and operation scale, production and operation quality, and production and innovation performance The scale of production and operation is measured by the number of enterprises, the number of employees, and the main business income; the quality of production and operation is measured by the total profit and the value of export delivery; the performance of production and innovation is measured by the sales revenue of new products, the number of valid invention patents, and the number of patent applications.
Following the literature [18,32,33], the level of innovative R&D population development consists of four types of indicators: R&D innovation personnel, R&D innovation funds, R&D innovation technology, and the R&D innovation organization. R&D innovation personnel are measured by a full-time equivalent of R&D personnel, R&D innovation funds are measured by the internal expenditure of R&D funds and expenditure of new product development funds, R&D innovation technology is measured by technology renovation funds and technology introduction funds, and the R&D innovation organization is measured by the number of R&D institutions, personnel of R&D institutions, and expenditure of R&D institutions. The level of innovative habitat development consists of two types of indicators: basic investment and fixed assets, with basic investment measured by the amount of investment and fixed assets measured by new fixed assets.
2.3.4. Control Variables: Production and Operation Scale, Fixed Assets and Investment
The innovation performance of a high-tech industrial innovation ecosystem is also influenced by the scale of production and operation and the level of fixed assets and investment. The scale of production and operation measures include the number of enterprises, enterprise personnel, and the main business income. In this study, the raw data of the above three factors are normalized and optimized, and then the average weighting method is applied to calculate the production and operation scale to measure the production and operation scale [18,28]. The level of fixed assets and investment () also has an impact on innovation performance, and the measured data are the values of fixed assets and investment [18].
The descriptive statistics of the data of the nine variables related to this study are shown in Table 2, which shows that the standard deviation of each variable is smaller than the mean value, which meets the requirements of normal distribution, which lays the foundation for the subsequent regression analysis.
3. Correlation Analysis and Multicollinearity Test
3.1. Correlation Analysis
In this study, the correlation analysis was conducted on the variables related to technology development performance and technology transformation performance, and the results are shown in Table 3 and Table 4, respectively. From the test results of the correlation coefficients, it can be seen that the probability of significance of t-values is less than 0.01, the correlation relationship between the measured variables is more significant, and the set model is initially verified. Meanwhile, the correlation coefficient of all variables is less than 0.7, which preliminarily excludes the existence of a multicollinearity of variables.
Moreover, the correlation analysis of the other related variables reveals that the correlation among the three variables of new product development expenditure, independent R&D expenditure, and independent R&D personnel is extremely high, so they cannot appear in one model as explanatory variables at the same time, otherwise, serious covariance may arise. Because of the strong correlation between new product development expenditure and technology transformation performance, new product development expenditure is used as an explanatory variable for technology transformation performance, whereas independent R&D expenditure and independent R&D personnel cannot appear as explanatory variables at the same time. The preliminary verification of the correctness of selecting new product development expenditure and technology transformation expenditure are the main explanatory variables for technology development performance. For technology transformation performance, the strongest correlation is between independent R&D expenditure and technology development performance, so independent R&D expenditure is chosen as an explanatory variable, so then new product development expenditure and independent R&D personnel cannot be used as explanatory variables. Therefore, it is also appropriate for technology transformation innovation to choose independent R&D funding and technology introduction funding as the main explanatory variables.
3.2. Multicollinearity Test
Multicollinearity refers to the distortion of model estimates or difficulty in estimating accurately due to the presence of exact correlations or high correlations among the explanatory variables in a linear regression model [37]. False regressions may occur if there is multicollinearity among the explanatory variables, so the explanatory variables should be tested for multicollinearity before regression analysis. If the tolerance ≤ 0.1 or the variance inflation factor (which is the inverse of the tolerance) ≥ 10, it indicates a serious case of multicollinearity among the independent variables. The variables were analyzed for multicollinearity separately, and the results are shown in Table 5. The results show that the tolerance of the explanatory variables is greater than 0.1, and the are all less than 10, indicating that there is no multicollinearity between the explanatory variables of the model and model, which lays the foundation for the next regression analysis.
4. Empirical Analysis
4.1. Analysis of Technology Development Performance
The empirical analysis of technology development performance was analyzed by the hierarchical regression method, and the variables were standardized to further reduce the effect of possible multicollinearity before constructing interaction terms, and the results of the regression analysis are shown in Table 6.
Model 1 introduces two control variables (production and operation scale, fixed assets and investment) in the regression equation, and the results show that the control variables have significant explanatory power on technology development performance (, ), and the regression coefficients and reach 0.01 significant level, which indicates that the control variables have a significant influence on the explanatory variables, with the coefficients of production and operation scale being 0.605, and the coefficient of fixed assets and investment is 0.242, which indicates that both control variables have a positive effect on technology development and innovation performance, and the effect of the production operation scale is stronger than that of the fixed assets and investment.
Model 2 introduces two explanatory variables (independent R&D innovation and technology introduction innovation) based on model 1 to test the contribution of explanatory variables to the explained variables when controlling for the control variables. After introducing the two variables of independent R&D innovation and technology introduction innovation, model 2 is significant () and has a better explanatory power of 91.1% for technology development performance than model 1 ). The regression results of model 2 showed that the independent R&D innovation had a significant positive effect on technology development performance (, ), whereas technology introduction innovation had a significant negative effect on the technology development performance ).
Model 3 introduces the moderating variable (synergy degree) based on model 2 to test the contribution of the moderating variable to the technology development performance. After adding the moderating variable, model 3 is significant () and has better explanatory power than model 2 () with an explanatory power of 91.3% on technology development performance. The results of model 3 regression analysis showed that the synergy degree of the innovation ecosystem in high-tech industries had a significant positive effect on the technology development performance ().
Model 4 incorporates an interaction term between the moderating variable and the independent variable to test the moderating effect of the synergy degree of the innovation ecosystem of high-tech industries on the relationship between independent R&D innovation, technology introduction innovation, and technology development performance. With the introduction of the interaction term, model 4 was significant () and had 92.4% explanatory power for the technology development performance, which had a better explanatory power than model 3 (). The regression results show that the interaction between the independent R&D innovation and synergy degree is significant, with a positive regression coefficient of the interaction term (); the interaction between the technology introduction innovation and synergy degree is significant, with a positive regression coefficient of the interaction term (). The above results indicate that the synergy degree of the innovation ecosystem in high-tech industries can significantly enhance the positive effect of independent R&D innovation on innovation performance, and it also has a positive effect on the relationship between technology introduction innovation and innovation performance.
To explain more intuitively the moderating effect of synergy degree on the performance of independent R&D innovation, technology introduction innovation, and technology development innovation, according to the research methods of the literature [38], this study plots the moderating effect of synergy degree on independent R&D innovation and synergy on technology introduction innovation, with one standard deviation above and one standard deviation below the mean, respectively, as shown in Figure 2 and Figure 3.
In Figure 2, the solid line indicates the impact relationship of independent R&D innovation on the technology development performance in the case of a high level of synergy degree in a high-tech industrial innovation ecosystem, and the dashed line indicates the influence relationship of independent R&D innovation on the technology development performance in the case of a low level of synergy degree accordingly. It can be seen that the slope of both the solid and dashed lines are positive, indicating that independent R&D innovation positively influences technology development performance, and the slope of the solid line is larger than the slope of the dashed line, so with the increase in independent R&D innovation, a high level of synergy degree can produce relatively high technology development performance.
Similarly, in Figure 3, the solid line indicates the influential relationship between technology introduction innovation and technology development innovation at a high level of synergy degree, and the dashed line indicates the influential relationship between technology introduction innovation and technology development innovation at a low level of synergy degree. It can be seen that the slopes of both the solid and dashed lines are negative, indicating that technology introduction innovation negatively affects technology development performance, and the slope of the dashed line is smaller than the slope of the solid line, indicating that with the increase in technology introduction innovation, the high level of synergy degree can produce a relatively high technology development performance.
4.2. Analysis of Technology Transformation Performance
Hierarchical regression was used to empirically study the technology transformation performance, and the variables were standardized before constructing the interaction terms to further reduce the effect of possible multicollinearity. The results of the regression analysis of technology transformation performance are shown in Table 7.
Model 5 introduces two control variables (production and operation scale, fixed assets and investment) in the regression equation, and the results show that the explanatory power of the control variables on technology transformation performance is high , ), and the regression coefficients and F-values reach 0.01 significant level, indicating that the control variables have a significant impact on the explanatory variables, with the coefficients of production and operation scale being 0.952, and the coefficient of fixed assets and investment is −0.100, indicating that both production and operation scale have a positive effect on technology transformation performance, whereas both fixed assets and investment have a positive effect on technology transformation performance.
Model 6 adds two explanatory variables (product innovation, technology renovation) to model 5 in order to test the contribution of explanatory variables to the explained variables, controlling for the control variables. With the introduction of two variables, product innovation and technology renovation, model 6 is significant () and has a better explanatory power of 88.9% for technology transformation performance than model 5 (). The regression analysis of model 6 showed that product innovation had a significant positive effect on technology transformation performance (), whereas technology transformation innovation had a significant negative effect on technology transformation performance ().
Model 7 introduces a moderating variable (synergy degree) based on model 6 to test the contribution of the moderating variable to the technology transformation performance. After adding the moderating variable, model 7 is significant () and has an 88.9% explanatory power on the technology transformation performance, which is similar to the explanatory power of model 6 (). The results of model 7 regression analysis showed that the synergy degree of the innovation ecosystem in high-tech industries had a significant positive effect on the technology transformation performance ().
Model 8 incorporates an interaction term between the moderating variable and the independent variable to test the moderating effect of the synergy degree of the innovation ecosystem of high-tech industries on the relationship between product innovation, technology renovation, and technology transformation performance. With the introduction of the interaction term, model 8 was significant () and had a better explanatory power of 89.0% on technology transformation performance than model 7 (). The regression results show that the interaction between product innovation and synergy degree is more significant, and the regression coefficient of the interaction term is positive (); the interaction between technology renovation and synergy is not significant. The above results indicate that the synergy of the innovation ecosystem in high-tech industries enhances the positive effect of product innovation on innovation performance, and it has no significant effect on the relationship between technology renovation and innovation performance.
To more intuitively explain the moderating effect of the synergy degree on product innovation and innovation performance, this study depicts the graph of the moderating effect of the synergy degree on product innovation with one standard deviation above the mean and one standard deviation below the mean, respectively, as shown in Figure 4, which shows that as the investment in the product innovation increases, the higher synergy degree in the innovation ecosystem of high-tech industries can produce a relatively higher innovation performance of technology transformation.
5. Results and Discussion
The results of the hierarchical regression analysis of technology innovation performance are analyzed and discussed in the following three aspects:
(1) According to the results of the regression analysis of the technology development performance above, it can be seen that in China’s provincial high-tech industries, independent R&D can significantly and positively influence technology development performance, and technology introduction can significantly and negatively influence technology development performance. Moreover, the absolute value of the regression coefficient of the independent R&D variable is much larger than that of the regression coefficient of the technology introduction variable, which indicates that the effect of the independent R&D on technology development performance is much stronger than that of the technology introduction on technology development performance, i.e., the internal expenditure of R&D funds can significantly increase the number of patent applications, whereas technology introduction can significantly reduce the number of patent applications.
The reason for this result is that, on one hand, since patents, as representatives of original technology and knowledge, can be generated mainly through independent innovation, an increase in investment in independent R&D will inevitably enhance technology development performance, which is reflected in an increase in the number of patent applications. On the other hand, the organization can improve the manufacturing capability, technology level, and management level of the enterprise faster through technology introduction. However, technology introduction tends to cause technology dependence in the organization, which inhibits the intrinsic motivation of technological innovation and results in poor performance of technology innovation. Moreover, with the limited total investment in technology innovation, the increase in technology introduction funds will inevitably lead to the reduction in independent R&D, which will also make the driving force of independent R&D decrease, resulting in a further reduction in technology innovation performance [39].
(2) According to the results of regression analysis of technology transformation performance, it can be seen that product innovation can significantly and positively influence technology transformation performance, whereas technology transformation can significantly and negatively influence technology transformation performance in China’s provincial high technology industries. Moreover, the absolute value of the regression coefficient of product innovation is much larger than the absolute value of technology renovation, so the strength of the influence of product innovation on technology transformation performance is much stronger than that of technology renovation on technology transformation performance.
The reason for this result is that, since the new products are developed and produced using new technology principles, new design concepts, or in a certain aspect such as structure, material, and technology, there is a significant improvement over the original products, thus significantly improving the performance of the products or expanding the use of the products, thus the new product development expenditure is bound to increase the new product sales revenue [40]. However, technology renovation refers to the application of technological achievements in various fields of production such as products, equipment, and processes by enterprises under the premise of adhering to technological progress, which should have also improved the quality of new products and increased the sales revenue of new products, but the empirical results are the opposite, on the one hand, because of the low efficiency of technology renovation in China’s high-tech industries, the contribution to product quality improvement is low [35]. On the other hand, because the amount of expenditure on technology renovation is too large, which to a certain extent limits the investment in new product development under a certain total amount of funding, and the two reasons lead to the negative impact of technology renovation on technology transformation innovation performance [27].
(3) From the regression results, it is clear that the synergy degree of the innovation ecosystem of the high-tech industry has a positive and significant effect on both technology development performance and technology transformation performance, and the effect on technology development performance is stronger. The system synergy degree has a significant positive moderating effect on the technology innovation input and technology innovation performance. This indicates that the higher the degree of synergy, the greater the positive influence of independent R&D on technology development performance, and the greater the influence of product innovation on technology transformation performance.
The reason for this result is that the differentiation of interests among innovation subjects in the innovation ecosystem is an important obstacle that restricts collaborative innovation between industry, university, and research [41]. The synergy of the technology innovation ecosystem reflects the closeness, orderliness, and intensity of interaction among the innovation elements in the evolution of the system [16]. By enhancing the synergy of the innovation ecosystem, it can promote the innovation subjects within the system can form a close combination and positive interaction between education and economy, technology research and development and industrialization through the cross-organizational synergy of resources and technologies, and promote the formation of a social system with close synergy and effective interaction among various types of science and technology innovation subjects to achieve the optimal allocation of innovation resources and thus enhance innovation performance. Enterprise innovation usually includes both independent R&D innovation and collaborative innovation [4]. Synergy in innovation ecosystems reflects the optimal allocation of innovation resources by reflecting the process of moving from disorder to order in complex ecosystems, thereby improving the efficiency of firms’ independent R&D and product innovation capabilities and enhancing technological innovation performance [42,43].
6. Conclusions and Implications
6.1. Conclusions
This study introduces an innovation ecosystem synergy as a moderating variable from a systemic and holistic perspective based on the traditional perspective of innovation factor input-output, and constructs a technology innovation performance driving model based on the Cobb–Douglas knowledge production function, which enriches the discussion perspective and theoretical model research on technology innovation performance. With a sample of 28 provinces in mainland China, this study empirically analyzed the moderating mechanism of innovation performance by innovation synergy in high-tech industries during the two stages of technology development and technology transformation. The findings of the study are as follows: (1) independent R&D positively and significantly affects technology development performance, and product innovation positively and significantly affects technology transformation performance; (2) technology introduction can weaken technology development performance due to technology dependence and the inhibitory effect on independent innovation, and inefficient technology renovation can negatively and significantly affect technology transformation performance; (3) the synergy degree of the innovation ecosystem positively and significantly affects technology development performance and technology transformation performance. The synergy degree of the innovation ecosystem of the high-tech industry has a positive moderating effect on the innovation performance of independent R&D and technology development, as well as the innovation performance of product innovation and technology renovation, and has a negative moderating effect on the innovation performance of technology introduction and technology development, but has no significant moderating effect on the technology renovation and the technology transformation performance.
6.2. Policy Implications
This study offers the following three policy implications for local governments and enterprises to improve their technology innovation performance:
(1) At the stage of technology development, enterprises should focus on the combination of independent R&D and technology introduction to realize the transformation from technology integration to technology leap [30]. Although the introduction of technology can promote the innovation ability of high-tech industries for a short time, this technological advantage may also disappear soon in the short term. Without independent R&D and innovation investment, enterprises will still face problems, such as a lack of new technology sources and the difficulty of technological breakthroughs, and thus fall into the dilemma of technological dependence. Therefore, after the rapid technological upgrading, enterprises should continuously increase their R&D efforts, seize the short-lived technological advantage acquired through technology introduction, and use the innovation platform of current technology introduction as a “springboard” to complete the major leap forward from technology integration and absorption to technology creation, to enhance the innovative competitiveness of China’s high-tech industry in the global value chain. The government should increase its support for enterprises’ independent innovation through financial subsidies and other incentives, making targeted adjustments to the subsidy rules according to differences in regions, industrial chains, and asset sizes, and establish a mechanism of responsibility for the whole process of supervision to improve the efficiency of the use of financial funds [44]. The government should also guide the participation of external financing channels, broaden financing channels, reduce financing costs, and promote more social capital support for technological innovation.
(2) At the stage of technology transformation, enterprises should take product innovation as the strategic core of survival and development. The process of developing new products is the process of technology transformation. Due to the limited resources at the disposal of the enterprise, to optimize the allocation of resources, the enterprise should allocate limited talent, capital, and facilities effectively to the much-needed development projects so that product innovation can achieve the best results, while accurately grasping the direction of product innovation, strengthening the research and evaluation of the pre-product innovation, taking the real or potential market demand as the basis of product innovation, seeking the intersection of enterprise advantages and market demand with the support of technological innovation capability, and taking whether it can achieve the maximum expected return on investment as the final selection criteria. For enterprises lacking in knowledge and technology accumulation, they should adopt external cooperation or rely on other subjects for product development when developing new products for innovation. They should focus on technology accumulation, strengthen communication and cooperation among enterprises, conduct technical knowledge learning and exchange, tap innovation information, and also make full use of global resources to cooperate with R&D institutions or enterprises in other countries to introduce and absorb technologies related to product innovation in order to promote R&D and the innovation of enterprises. The government should improve the rule of law environment for product innovation, provide appropriate tax incentives, introduce policies to support product innovation according to specific market conditions, strengthen the importance of the intellectual property protection system, increase the supervision and punishment of intellectual property rights and other crimes, and create an atmosphere that encourages product innovation [45]. The government should also clarify the relationship between the government and the market, play a decisive role in optimizing the allocation of resources, and strengthen and optimize the supervision and management of the market.
(3) The government should improve the government–industry research synergetic innovation system and play the role of moderating the technology innovation performance by the synergy degree of the industrial innovation ecosystem. It is important to build a healthy industrial innovation ecosystem to stimulate the regional technology innovation driving force and improve the regional innovation strength [27]. Therefore, it is necessary to improve the government–enterprise–university research institution collaborative innovation mechanism, in which the government’s innovation policy guidance role should be brought into play, and the policy environment should be gradually improved in terms of research management system formulation, modern market system improvement, technological innovation policy support, entrepreneurship support policy, and innovation culture cultivation. Enterprises must play a leading role in technological innovation and make every effort to promote the optimization and upgrading of the innovation ecosystem. Follower enterprises need to achieve incremental and intensive innovation through internal development, joint development, or open innovation under the influence of innovation of leading enterprises. New start-up enterprises, on the other hand, need to grasp the entrepreneurial timing and carry out breakthrough variant innovation through cooperation with research organizations or independent innovation. Scientific research organizations should take advantage of original innovation, realize the evolutionary upgrading of the innovation ecosystem, make full use of the basic scientific research resources provided by the government, and vigorously carry out basic, public welfare and original innovation activities.
6.3. Contributions
First, this study further extends to the systemic and holistic perspective based on the input-output perspective and introduces the innovation ecosystem synergy degree as the moderating variable of technology innovation input and technology innovation output-related variables, which enriches the research perspective of technology innovation performance.
Second, this study constructs a technological innovation performance driving model based on the synergy model and the Cobb–Douglas knowledge production function, which provides a theoretical reference for further research on the driving mechanism of technology innovation performance in high-tech industries.
Third, at the practical level, the relevant research findings of this study can provide policy and practical references for the technology innovation performance upgrading of regional high-tech industries.
6.4. Limitations
There are two limitations to this study that need to be improved in subsequent studies: first, the selection of variables in this study was not comprehensive and did not cover the full range of influencing factors, as technological innovation is a complex system that is also influenced by factors such as government attention and market size; second, in terms of variable measurement, specific data are not precisely characterized for each variable due to the limitation of data availability, and subsequent studies should further strengthen data integrity to improve the analysis of the impact mechanism of innovation ecosystem synergy on technology innovation performance.
Supplementary Materials
The following supporting information can be downloaded at: https://www.mdpi.com/article/10.3390/systems10040124/s1.
Author Contributions
Conceptualization, X.H.; methodology, X.H.; software, X.L.; validation, M.X., X.H. and X.L.; formal analysis, M.X.; investigation, M.X. and H.L.; resources, X.L.; data curation, X.L.; writing—original draft preparation, X.H.; writing—review and editing, M.X.; visualization, Z.X.; supervision, M.X.; project administration, X.H.; funding acquisition, Z.X. All authors have read and agreed to the published version of the manuscript.
Funding
This work was supported by the National Social Science Foundation of China, grant number 19BGL047.
Institutional Review Board Statement
Not applicable.
Informed Consent Statement
Not applicable.
Data Availability Statement
The data presented in this study are available in Supplementary Materials.
Acknowledgments
We express our most sincere gratitude to the editors and reviewers for their careful review of this study.
Conflicts of Interest
The authors declare no conflict of interest.
References
- Ma, D.; Zhu, Q. Innovation in emerging economies: Research on the digital economy driving high-quality green development. J. Bus. Res. 2022, 145, 801–813. [Google Scholar] [CrossRef]
- Harbi, S.; Amamou, M.; Anderson, A.R. Establishing high-tech industry: The Tunisian ICT experience. Technovation 2009, 29, 465–480. [Google Scholar] [CrossRef]
- Liu, C.; Gao, X.; Ma, W.; Chen, X. Research on regional differences and influencing factors of green technology innovation efficiency of China’s high-tech industry. J. Comput. Appl. Math. 2020, 369, 112597. [Google Scholar] [CrossRef]
- Wei, H.; Yuan, R.; Zhao, L. International talent inflow and R&D investment: Firm-level evidence from China. Econ. Model. 2020, 89, 32–42. [Google Scholar] [CrossRef]
- Zhou, K.Z.; Li, C.B. How knowledge affects radical innovation: Knowledge base, market knowledge acquisition, and internal knowledge sharing. Strat. Manag. J. 2012, 33, 1090–1102. [Google Scholar] [CrossRef]
- Usai, A.; Fiano, F.; Messeni Petruzzelli, A.; Paoloni, P.; Farina Briamonte, M.; Orlando, B. Unveiling the impact of the adoption of digital technologies on firms’ innovation performance. J. Bus. Res. 2021, 133, 327–336. [Google Scholar] [CrossRef]
- Yigitcanlar, T.; Marques, J.; Kamruzzaman, M.; Camargo, F.; Moreira Da-Costa, E.; Ioppolo, G.; Palandi, F.E.D. Impact of funding sources on innovation: Evidence from Brazilian software companies. R&D Manag. 2018, 48, 460–484. [Google Scholar] [CrossRef]
- Shao, Y.; Chen, Z. Can government subsidies promote the green technology innovation transformation? Evidence from Chinese listed companies. Econ. Anal. Policy 2022, 74, 716–727. [Google Scholar] [CrossRef]
- Wang, M.; Wang, H. Knowledge search and innovation performance: The mediating role of absorptive capacity. Oper. Manag. Res. 2022, 33, 444–446. [Google Scholar] [CrossRef]
- Kim, S.; Kim, E. How Intellectual Property Management Capability and Network Strategy Affect Open Technological Innovation in the Korean New Information Communications Technology Industry. Sustainability 2018, 10, 2600. [Google Scholar] [CrossRef]
- Yang, N.; Hong, J.; Wang, H.; Liu, Q. Global value chain, industrial agglomeration and innovation performance in developing countries: Insights from China’s manufacturing industries. Technol. Anal. Strat. Manag. 2020, 32, 1307–1321. [Google Scholar] [CrossRef]
- Puriwat, W.; Hoonsopon, D. Cultivating product innovation performance through creativity: The impact of organizational agility and flexibility under technological turbulence. J. Manuf. Technol. Manag. 2021, 33, 741–762. [Google Scholar] [CrossRef]
- Hu, S.; Wang, X.; Zhang, B. Are all innovation modes beneficial to firms’ innovation performance? New findings from an emerging market. Chin. Manag. Stud. 2020, 14, 1015–1034. [Google Scholar] [CrossRef]
- Lee, T.S.; Tsai, H.J. The effects of business operation mode on market orientation, learning orientation and innovativeness. Ind. Manag. Data Syst. 2005, 105, 325–348. [Google Scholar] [CrossRef]
- Heng, H.J.C. External Knowledge Sourcing, Non-R&D Innovation and Patent Output: Evidence from High-tech Industry. Sci. Res. 2017, 35, 447–458. [Google Scholar] [CrossRef]
- Wang, M.; Li, Y.; Wang, Z.; Li, J. The Heterogeneous Relationship between Pollution Charges and Enterprise Green Technology Innovation, Based on the Data of Chinese Industrial Enterprises. Energies 2022, 15, 1663. [Google Scholar] [CrossRef]
- Chen, W.-M.; Wang, S.-Y.; Wu, X.-L.; Nepomuceno, E.G. Concept Refinement, Factor Symbiosis, and Innovation Activity Efficiency Analysis of Innovation Ecosystem. Math. Probl. Eng. 2022, 2022, 1942026. [Google Scholar] [CrossRef]
- He, X.Z.w. A classified evaluation of innovation ecosystem cooperativity of regional high-tech industries. Stud. Sci. Sci. 2018, 36, 541–549. [Google Scholar] [CrossRef]
- Wenxiu, M.Q.H. Study of the coordinating measurement model with respect to composite system. J. Tianjin Univ. Sci. Technol. 2000, 2000, 444–446. [Google Scholar]
- Huallacháin, B.O.; Leslie, T.F. Rethinking the regional knowledge production function. J. Econ. Geogr. 2007, 7, 737–752. [Google Scholar] [CrossRef]
- Anselin, L.; Varga, A.; Acs, Z. Local Geographic Spillovers between University Research and High Technology Innovations. J. Urban Econ. 1997, 42, 422–448. [Google Scholar] [CrossRef]
- Yaoqi, D. Research on Knowledge Production Function Model in the Knowledge Network based on Intellectural Growth. J. Intell. 2011, 30, 114–118. [Google Scholar]
- Wang, Q.; Hang, Y.; Sun, L.; Zhao, Z. Two-stage innovation efficiency of new energy enterprises in China: A non-radial DEA approach. Technol. Forecast. Soc. Chang. 2016, 112, 254–261. [Google Scholar] [CrossRef]
- Klessova, S.; Engell, S.; Thomas, C. Assessment of the advancement of market-upstream innovations and of the performance of research and innovation projects. Technovation 2022, 116, 102495. [Google Scholar] [CrossRef]
- Succurro, M.; Boffa, F. Patenting patterns in the tourism industry: Evidence from Italy. Int. J. Tour. Res. 2018, 20, 538–541. [Google Scholar] [CrossRef]
- Sun, W.; Zhao, Y.; Sun, L. Big Data Analytics for Venture Capital Application: Towards Innovation Performance Improvement. Int. J. Inf. Manag. 2020, 50, 557–565. [Google Scholar] [CrossRef]
- Luna-Reyes, L.F.; Gil-Garcia, J.R. Digital government transformation and internet portals: The co-evolution of technology, organizations, and institutions. Gov. Inf. Q. 2014, 31, 545–555. [Google Scholar] [CrossRef]
- Yu, L.; Duan, Y.; Fan, T. Innovation performance of new products in China’s high-technology industry. Int. J. Prod. Econ. 2019, 219, 204–215. [Google Scholar] [CrossRef]
- Wang, S.; Liu, Q.; Chen, Y. Independent research and development, technology accumulation and innovation performance: Evidence from China’s pharmaceutical manufacturing industry. PLoS ONE 2022, 17, e0266768. [Google Scholar] [CrossRef]
- Cheng, Z.; Li, W. Independent R and D, Technology Introduction, and Green Growth in China’s Manufacturing. Sustainability 2018, 10, 311. [Google Scholar] [CrossRef]
- Gao, W.; Chou, J. Innovation efficiency, global diversification, and firm value. J. Corp. Finance 2015, 30, 278–298. [Google Scholar] [CrossRef]
- Li, Q.-X.; Ji, H.-M.; Huang, Y.-M. The information leakage strategies of the supply chain under the block chain technology introduction. Omega 2022, 110. [Google Scholar] [CrossRef]
- Cen, S.; Li, L.; Cui, W. How Does Foreign Equity Right Impact Manufacturing Enterprise Innovation Behaviors? Mediation Test Based on Technology Introduction. Discret. Dyn. Nat. Soc. 2020, 2020, 8921083. [Google Scholar] [CrossRef]
- Shu, C.; Zhou, K.Z.; Xiao, Y.; Gao, S. How Green Management Influences Product Innovation in China: The Role of Institutional Benefits. J. Bus. Ethics 2014, 133, 471–485. [Google Scholar] [CrossRef]
- Plewa, C.; Troshani, I.; Francis, A.; Rampersad, G. Technology adoption and performance impact in innovation domains. Ind. Manag. Data Syst. 2012, 112, 748–765. [Google Scholar] [CrossRef]
- Jin, X.; Chen, C.; Zhang, M. Research on Synergy between Entrepreneurial Service and Financial Support in Crowd Innovation Space Ecosystem. Sustainability 2022, 14, 5966. [Google Scholar] [CrossRef]
- Chen, G.J. A simple way to deal with multicollinearity. J. Appl. Stat. 2012, 39, 1893–1909. [Google Scholar] [CrossRef]
- Li, X.; Li, B.; Wang, G.; Zhan, X.; Holyoak, M. Deeply digging the interaction effect in multiple linear regressions using a fractional-power interaction term. MethodsX 2020, 7, 101067. [Google Scholar] [CrossRef]
- Poyago-Theotoky, J.A. The organization of R&D and environmental policy. J. Econ. Behav. Organ. 2007, 62, 63–75. [Google Scholar] [CrossRef]
- Bart, C.K. Product innovation charters: Mission statements for new products. R&D Manag. 2002, 32, 23–34. [Google Scholar] [CrossRef]
- Bai, X.-J.; Li, Z.-Y.; Zeng, J. Performance evaluation of China’s innovation during the industry-university-research collaboration process—an analysis basis on the dynamic network slacks-based measurement model. Technol. Soc. 2020, 62, 101310. [Google Scholar] [CrossRef]
- Liu, D.; Wang, D. Evaluation of the synergy degree of industrial de-capacity policies based on text mining: A case study of China’s coal industry. Resour. Policy 2022, 76, 102547. [Google Scholar] [CrossRef]
- Xia, C.; Bing, Y. Strategic leadership, environmental optimisation, and regional innovation performance with the regional innovation system coupling synergy degree: Evidence from China. Technol. Anal. Strat. Manag. 2022, 1–14. [Google Scholar] [CrossRef]
- Roberts, P.S.; Schmid, J. Government-led innovation acceleration: Case studies of US federal government innovation and technology acceleration organizations. Rev. Policy Res. 2022, 39, 353–378. [Google Scholar] [CrossRef]
- Yi, J.; Murphree, M.; Meng, S.; Li, S. The more the merrier? Chinese government R&D subsidies, dependence, and firm innovation performance. J. Prod. Innov. Manag. 2021, 38, 289–310. [Google Scholar] [CrossRef]
Figure 1.
Schematic diagram of the theoretical model.
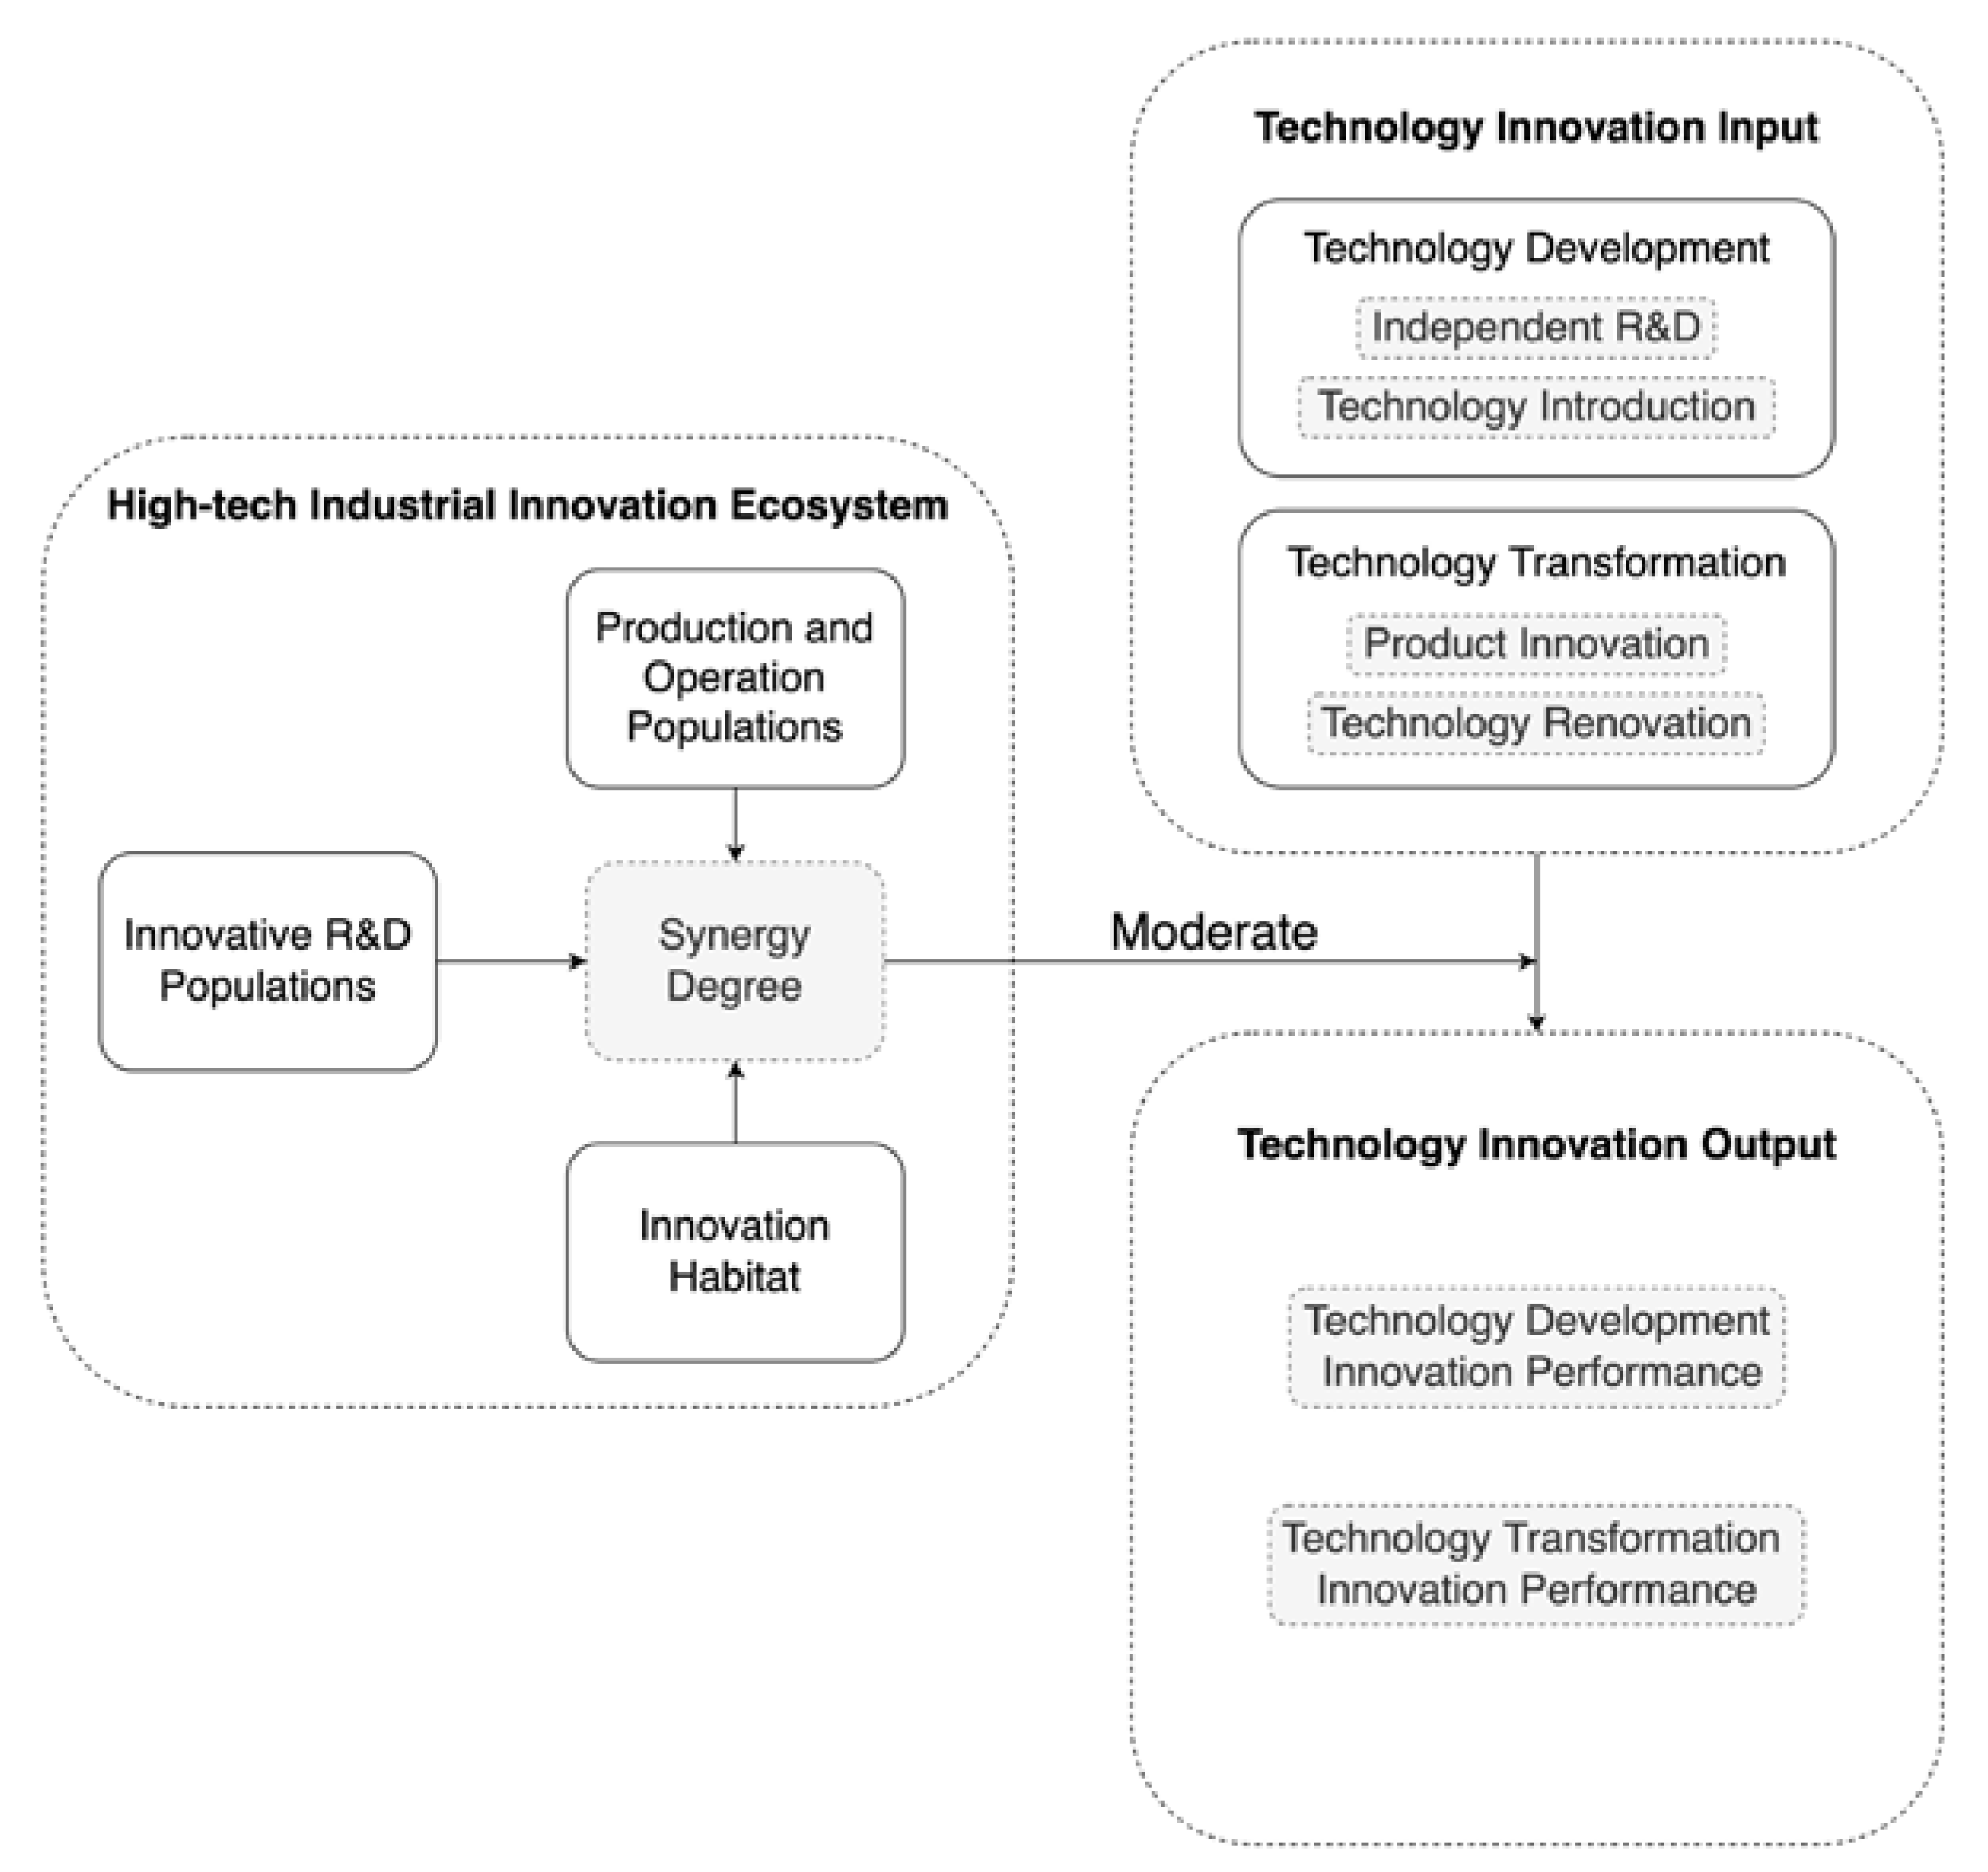
Figure 2.
The moderating effect of synergy degree on the independent R&D and technology development performance.
Figure 2.
The moderating effect of synergy degree on the independent R&D and technology development performance.

Figure 3.
The moderating effect of synergy degree on the technology introduction and technology development performance.
Figure 3.
The moderating effect of synergy degree on the technology introduction and technology development performance.
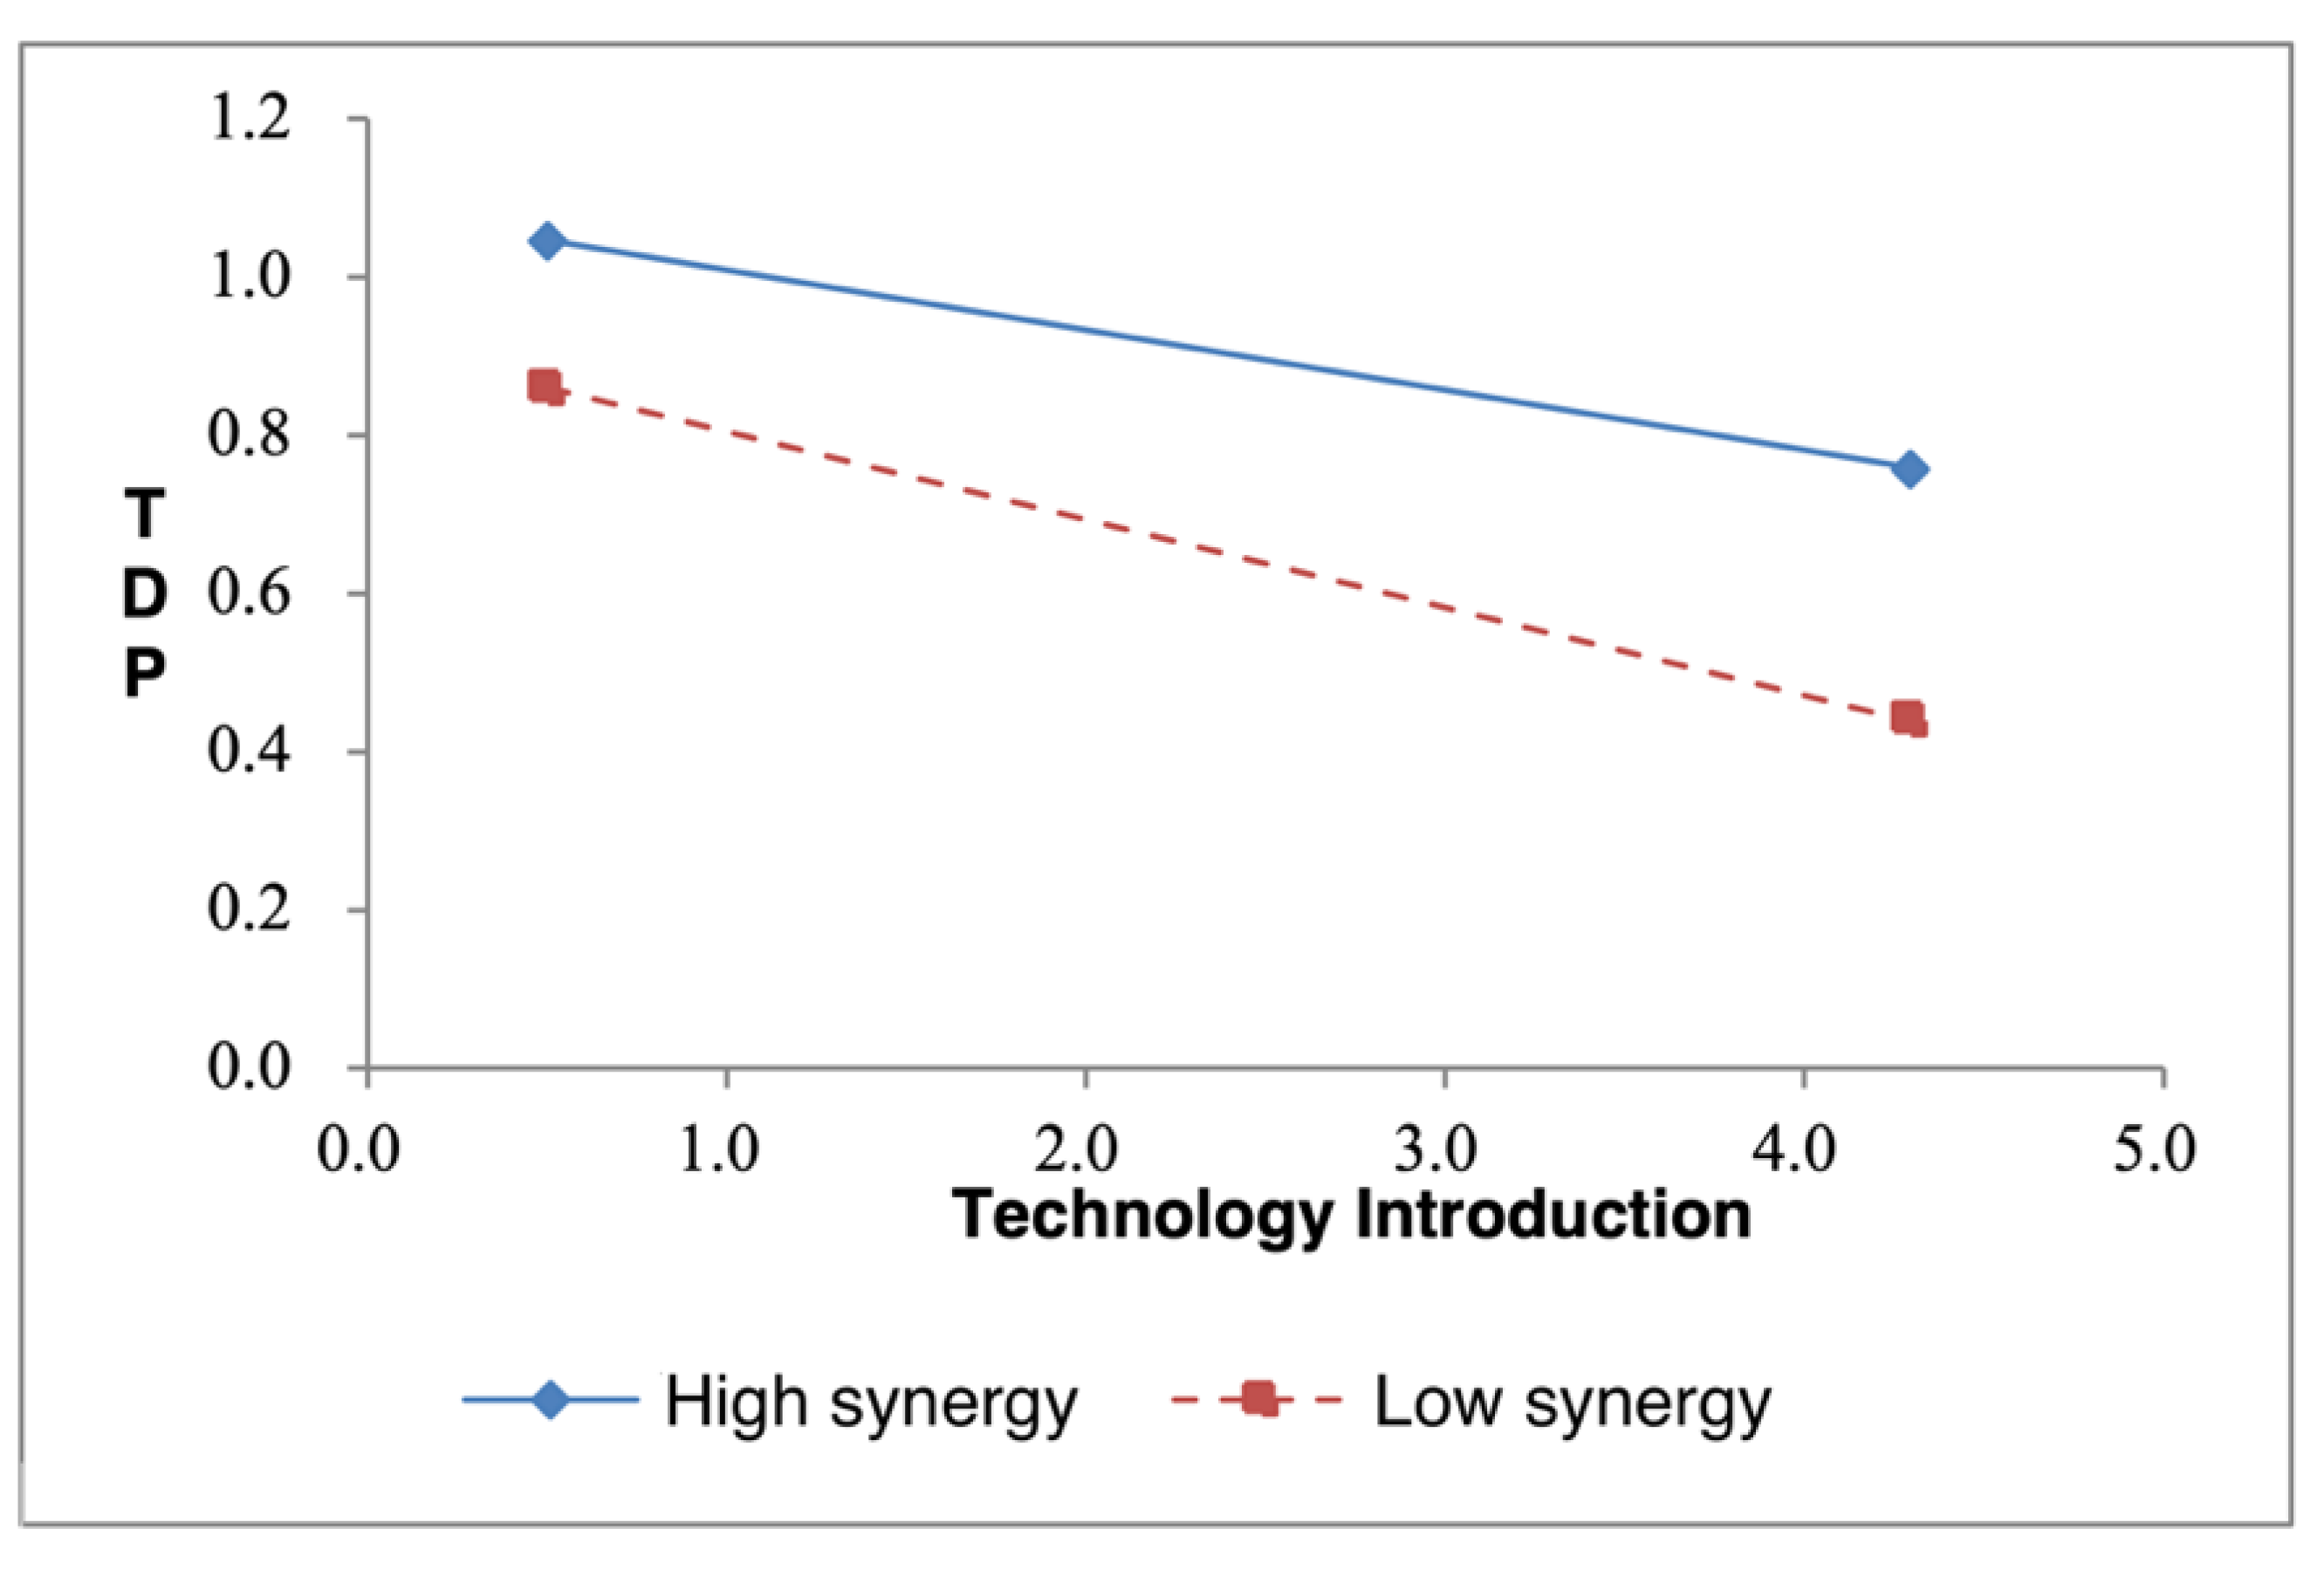
Figure 4.
The moderating effect of synergy degree on the product innovation and technology transformation performance.
Figure 4.
The moderating effect of synergy degree on the product innovation and technology transformation performance.


Table 1.
Variables selection and description.
| Variables | Year | Variable Codes | Measurement Description |
|---|---|---|---|
| Explained variables | |||
| Technology Development Performance | 2000–2015 | Number of patent applications | |
| Technology Transformation Performance | 2000–2015 | Sales revenue of new products | |
| Explanatory variables | |||
| Independent R&D | 1998–2013 | Expenditure of internal R&D | |
| Technology Introduction | 1998–2013 | Expenditure on technology introduction, absorption, and digestion | |
| Product Innovation | 1998–2013 | Expenditure on new product development | |
| Technology Renovation | 1998–2013 | Expenditure for technology renovation | |
| Moderator | |||
| Synergy Degree | 1998–2013 | Synergy model measurement | |
| Control Variables | |||
| Production and Operation Scale | 1998–2013 | Number of enterprises, enterprise personnel, the main revenue | |
| Fixed Assets and Investment | 1998–2013 | Fixed assets and investment amount |
Table 2.
Descriptive statistics of the sample.
| Variables | N | Min | Max | Mean | Std. |
|---|---|---|---|---|---|
| 448 | 0.000 | 4.605 | 0.786 | 0.616 | |
| 448 | 0.000 | 4.605 | 1.022 | 0.846 | |
| 448 | 0.003 | 4.376 | 1.192 | 0.935 | |
| 448 | 0.028 | 4.605 | 1.649 | 1.009 | |
| 448 | 0.000 | 4.430 | 0.845 | 0.676 | |
| 448 | 0.000 | 4.293 | 1.141 | 1.100 | |
| 448 | 0.000 | 4.305 | 0.783 | 0.645 | |
| 448 | 0.000 | 4.605 | 1.549 | 0.997 | |
| 448 | 2.035 | 4.563 | 3.977 | 0.253 |
Table 3.
Correlation analysis results of technology development performance.
| Variables | ||||||
|---|---|---|---|---|---|---|
| 1 | 0.791 ** | 0.768 ** | 0.751 ** | 0.642 ** | 0.635 ** | |
| 0.791 ** | 1 | 0.716 ** | 0.790 ** | 0.482 ** | 0.667 ** | |
| 0.768 ** | 0.716 ** | 1 | 0.799 ** | 0.752 ** | 0.577 ** | |
| 0.751 ** | 0.790 | 0.799 | 1 | 0.711 | 0.617 ** | |
| 0.642 ** | 0.482 ** | 0.752 ** | 0.711 ** | 1 | 0.400 ** | |
| 0.635 ** | 0.667 ** | 0.577 ** | 0.617 ** | 0.400 ** | 1 |
Note: **. Significantly correlated at the 0.01 level (bilaterally).
Table 4.
Correlation analysis results of technology transformation performance.
| Variables | ||||||
|---|---|---|---|---|---|---|
| 1 | 0.750 ** | 0.719 ** | 0.700 ** | 0.669 ** | 0.598 ** | |
| 0.750 ** | 1 | 0.716 ** | 0.798 ** | 0.637 ** | 0.667 ** | |
| 0.719 ** | 0.716 ** | 1 | 0.892 ** | 0.785 ** | 0.577 ** | |
| 0.700 ** | 0.798 ** | 0.792 ** | 1 | 0.726 ** | 0.632 ** | |
| 0.669 ** | 0.637 ** | 0.785 ** | 0.726 ** | 1 | 0.363 ** | |
| 0.598 ** | 0.667 ** | 0.577 ** | 0.632 ** | 0.363 ** | 1 |
Note: **. Significantly correlated at the 0.01 level (bilaterally).
Table 5.
Multicollinearity statistics.
| Variables | Tolerance | Variables | Tolerance | ||
|---|---|---|---|---|---|
| 0.233 | 4.284 | 0.269 | 3.715 | ||
| 0.122 | 8.166 | 0.143 | 6.989 | ||
| 0.168 | 5.952 | 0.175 | 5.707 | ||
| 0.363 | 2.757 | 0.361 | 2.767 | ||
| 0.528 | 1.896 | 0.495 | 2.019 | ||
Table 6.
Regression results of technology development performance.
| Model 1 | Model 2 | Model 3 | Model 4 | ||
|---|---|---|---|---|---|
| Constant | −0.500 *** | −0.116 *** | −0.927 *** | −1.420 *** | |
| Control variables | 0.242 *** | 0.067 ** | 0.035 | 0.007 | |
| 0.605 *** | 0.070 * | 0.081 ** | 0.162 *** | ||
| Explanatory variables | 0.922 *** | 0.901 *** | 0.768 *** | ||
| −0.063 *** | −0.066 *** | −0.094*** | |||
| Moderator | 0.214 *** | 0.334 *** | |||
| Interactive item | 0.054 *** | ||||
| 0.070 *** | |||||
| 0.774 | 0.911 | 0.913 | 0.924 | ||
| 0.773 | 0.910 | 0.912 | 0.923 | ||
| 761.273 *** | 1131.657 *** | 924.151 *** | 769.421 *** | ||
| 0.137 | 0.002 | 0.012 | |||
| 340.491 *** | 9.301 *** | 34.315 *** | |||
Note: * in the table is the significance level p < 0.1, ** is p < 0.05, *** is p < 0.01.
Table 7.
Regression results of technology transformation performance.
| Model 5 | Model 6 | Model 7 | Model 8 | ||
|---|---|---|---|---|---|
| Constant | −0.549 *** | −0.259 *** | −0.843 ** | −1.071 | |
| Control variables | −0.100 *** | −0.106 *** | −0.126 *** | −0.136 *** | |
| 0.952 *** | 0.756 *** | 0.756 *** | 0.782 *** | ||
| Explanatory variables | 0.552 *** | 0.532 *** | 0.463 *** | ||
| −0.175 *** | −0.165 *** | −0.157 *** | |||
| Moderator | 0.153 * | 0.207 ** | |||
| Interactive item | 0.033 * | ||||
| 0.006 | |||||
| 0.844 | 0.888 | 0.889 | 0.890 | ||
| 0.844 | 0.888 | 0.888 | 0.888 | ||
| 1206.704 *** | 885.272 *** | 711.467 *** | 509.466 *** | ||
| 0.044 | 0.001 | 0.001 | |||
| 88.624 *** | 2.695 * | 1.383 | |||
Note: * in the table is the significance level p < 0.1, ** is p < 0.05, *** is p < 0.01.
Publisher’s Note: MDPI stays neutral with regard to jurisdictional claims in published maps and institutional affiliations. |
© 2022 by the authors. Licensee MDPI, Basel, Switzerland. This article is an open access article distributed under the terms and conditions of the Creative Commons Attribution (CC BY) license (https://creativecommons.org/licenses/by/4.0/).
Share and Cite
MDPI and ACS Style
He, X.; Xia, M.; Li, X.; Lin, H.; Xie, Z. How Innovation Ecosystem Synergy Degree Influences Technology Innovation Performance—Evidence from China’s High-Tech Industry. Systems 2022, 10, 124. https://doi.org/10.3390/systems10040124
AMA Style
He X, Xia M, Li X, Lin H, Xie Z. How Innovation Ecosystem Synergy Degree Influences Technology Innovation Performance—Evidence from China’s High-Tech Industry. Systems. 2022; 10(4):124. https://doi.org/10.3390/systems10040124
Chicago/Turabian StyleHe, Xiangwu, Ming Xia, Xiuxian Li, Hui Lin, and Zhimin Xie. 2022. "How Innovation Ecosystem Synergy Degree Influences Technology Innovation Performance—Evidence from China’s High-Tech Industry" Systems 10, no. 4: 124. https://doi.org/10.3390/systems10040124
Note that from the first issue of 2016, this journal uses article numbers instead of page numbers. See further details here.