In Search of the Executive Cognitive Processes Proposed by Process-Overlap Theory


Abstract
:1. Introduction
1.1. What Executive Processes Are Proposed by POT?
1.2. How Are Executive Processes Measured?
1.3. The Present Study
2. Methods
2.1. Participants
2.2. Cognitive Measures
2.2.1. Fluid Intelligence (Gf)

| Task | Content Domain | Parcel | ||||
|---|---|---|---|---|---|---|
| Letter Sets | PN: verbal(1) | 1 | 0.20 | 1.00 | 0.77 | 0.18 |
| 2 | 0.40 | 1.00 | 0.85 | 0.14 | ||
| 3 | 0.20 | 1.00 | 0.79 | 0.19 | ||
| Relations | PN: verbal(2) | 1 | 0.20 | 1.00 | 0.71 | 0.17 |
| 2 | 0.30 | 1.00 | 0.72 | 0.15 | ||
| 3 | 0.39 | 1.00 | 0.81 | 0.14 | ||
| Locations | VS: visual | 1 | 0.00 | 1.00 | 0.53 | 0.21 |
| 2 | 0.00 | 1.00 | 0.53 | 0.24 | ||
| 3 | 0.00 | 1.00 | 0.56 | 0.21 | ||
| RAPM | VS: spatial/figural | 1 | 0.00 | 1.00 | 0.57 | 0.27 |
| 2 | 0.00 | 1.00 | 0.62 | 0.27 | ||
| 3 | 0.00 | 1.00 | 0.58 | 0.30 |
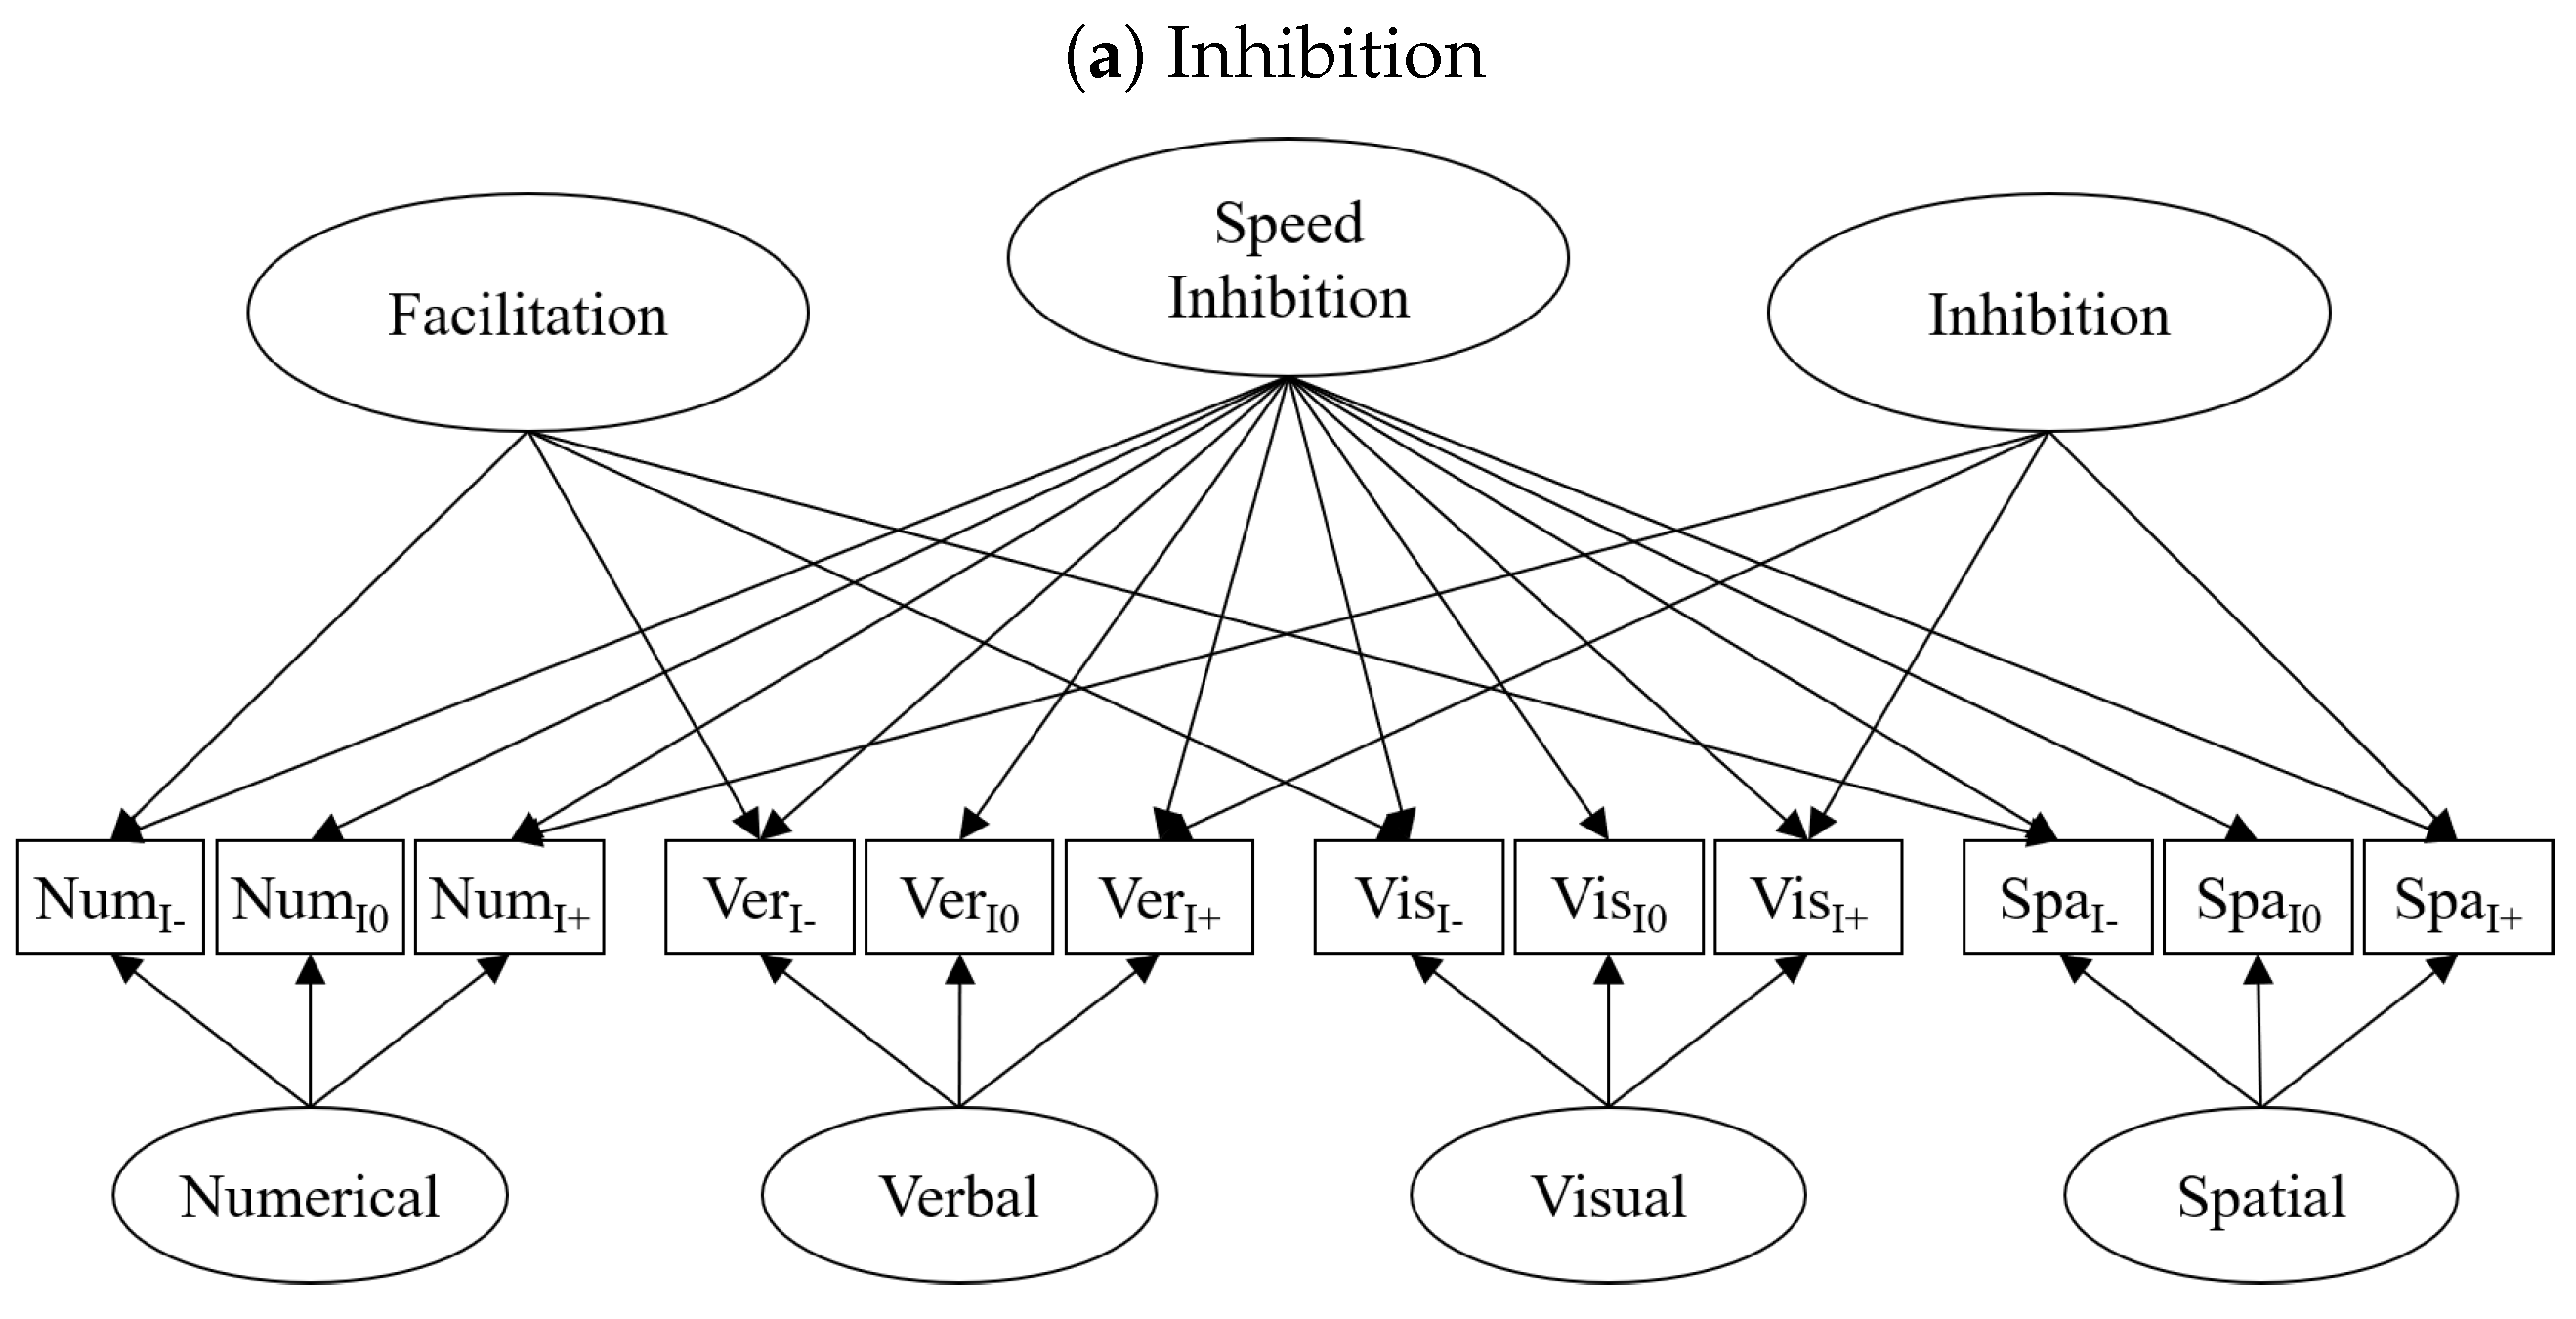
2.2.2. Inhibition
| Exec. Process | Task | Content Domain | Exp. Condition | ||||
|---|---|---|---|---|---|---|---|
| Inhibtion | Number Stroop | PN: numeric | congruent | 403.1 | 898.2 | 579.0 | 106.8 |
| neutral | 431.0 | 975.0 | 629.0 | 121.2 | |||
| incongruent | 438.8 | 1032.2 | 669.9 | 116.7 | |||
| Color Stroop | PN: verbal | congruent | 390.5 | 733.1 | 526.5 | 70.8 | |
| neutral | 398.0 | 746.2 | 542.0 | 72.9 | |||
| incongruent | 395.1 | 927.9 | 581.1 | 106.4 | |||
| Global-Local | VS: visual | congruent | 441.4 | 839.0 | 582.2 | 78.5 | |
| neutral | 447.4 | 903.6 | 600.4 | 85.5 | |||
| incongruent | 444.1 | 916.9 | 630.9 | 91.4 | |||
| Simon | VS: spatial | congruent | 882.0 | 1190.7 | 1001.7 | 62.1 | |
| neutral | 888.1 | 1168.3 | 1009.4 | 56.7 | |||
| incongruent | 916.9 | 1260.3 | 1040.9 | 62.3 | |||
| Shifting | Pairity-Magnitude | PN: numeric | single | 419.1 | 761.8 | 556.9 | 64.2 |
| repetition | 507.7 | 1434.1 | 783.5 | 195.6 | |||
| switch | 643.0 | 1793.2 | 1107.8 | 221.5 | |||
| Animacy-Size | PN: verbal | single | 457.0 | 823.7 | 599.2 | 68.2 | |
| repetition | 554.8 | 1507.4 | 904.2 | 217.8 | |||
| switch | 772.9 | 1960.4 | 1285.9 | 226.5 | |||
| Color-Shape | VS: visual | single | 389.6 | 691.1 | 507.4 | 60.0 | |
| repetition | 529.9 | 1589.4 | 935.2 | 225.1 | |||
| switch | 787.7 | 1951.4 | 1264.5 | 236.3 | |||
| Fill-Frame | VS: spatial | single | 390.3 | 665.3 | 502.0 | 56.4 | |
| repetition | 551.9 | 1719.2 | 998.9 | 232 | |||
| switch | 791.9 | 2078.8 | 1336.9 | 270.6 | |||
| Removal Efficiency | Digit | PN: numeric | short | 429.5 | 2466.8 | 1148.1 | 422.1 |
| long | 388.0 | 1953.3 | 899.9 | 305.7 | |||
| Letter | PN: verbal | short | 459.2 | 3848.9 | 1577.6 | 737.6 | |
| long | 383.3 | 3042.8 | 1182.8 | 531.4 | |||
| Arrows | VS: visual | short | 582.9 | 5707.2 | 2597.7 | 1110.6 | |
| long | 637.1 | 5407.3 | 2376.1 | 1046.0 | |||
| Locations | VS: spatial | short | 1049.1 | 6004.0 | 2814.0 | 1059.7 | |
| long | 1071.7 | 5901.0 | 2675.1 | 980.1 |
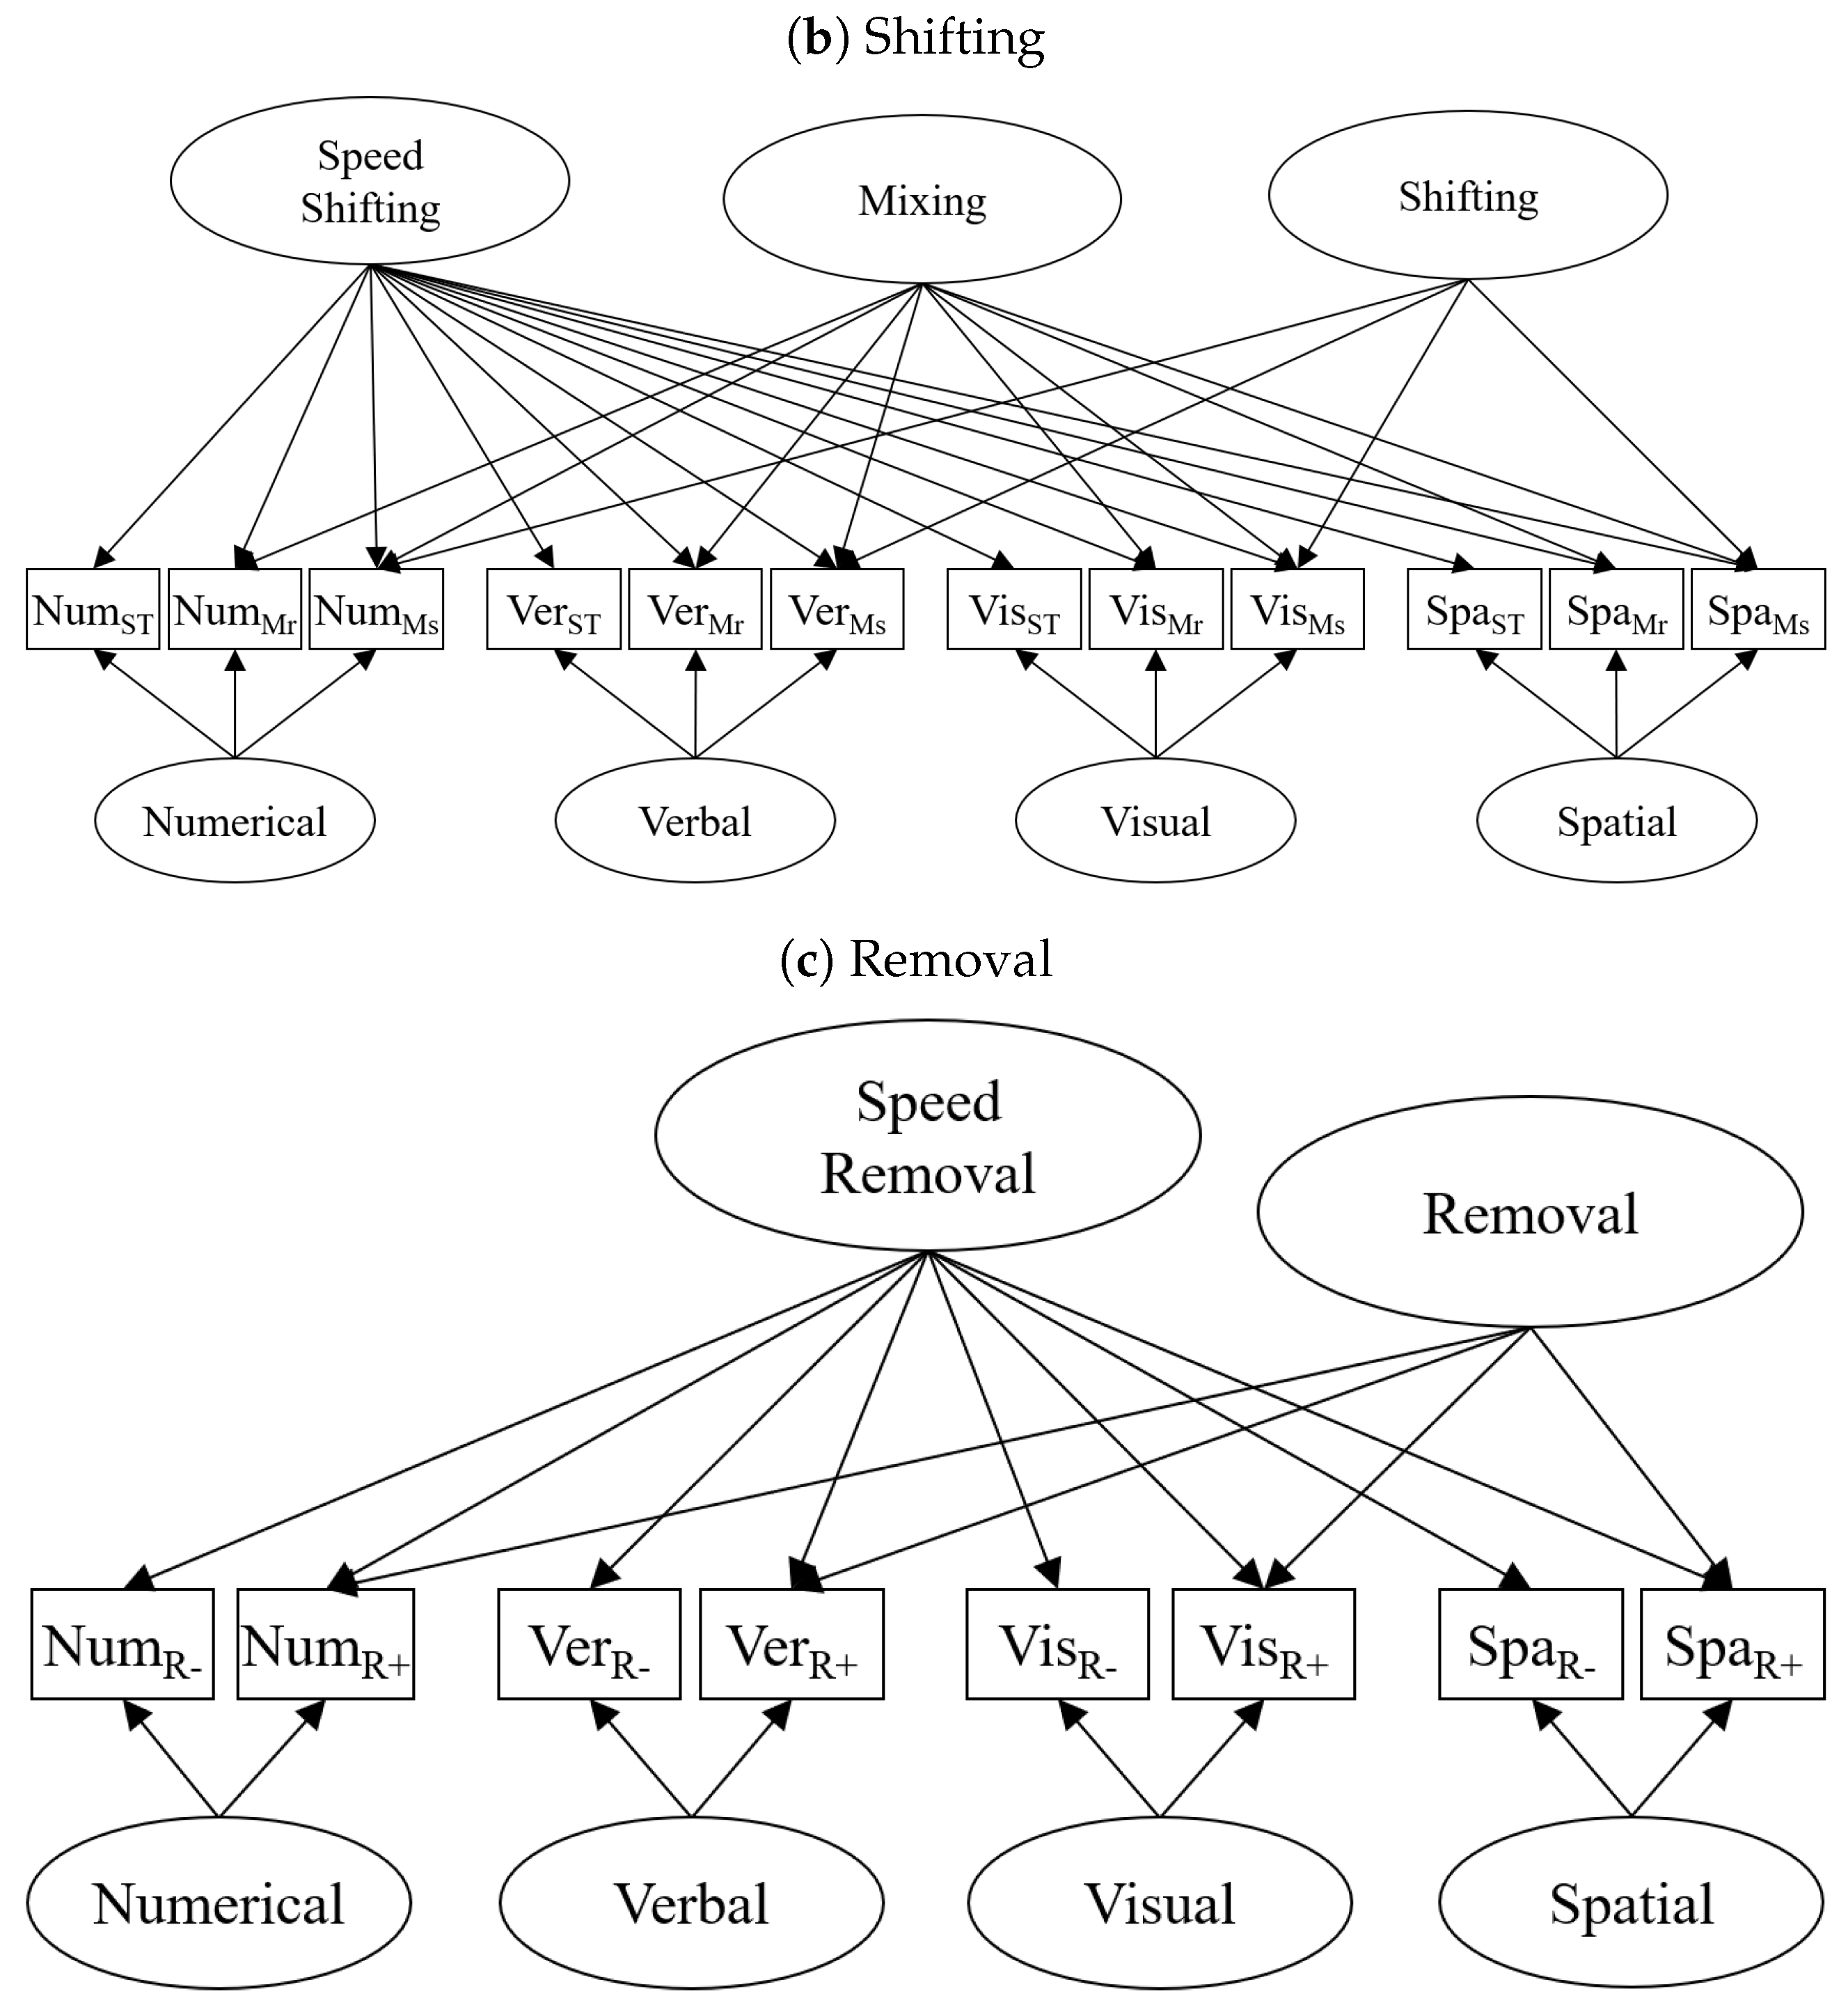
2.2.3. Shifting
2.2.4. Removal Efficiency
2.3. Analysis
2.3.1. Data Preprocessing
2.3.2. Structural Equation Models (SEMs)
3. Results
3.1. Experimental Effects in the Executive Processing Tasks
3.1.1. Inhibition Effects
3.1.2. Shifting Effects
3.1.3. Removal Efficiency Effects
3.2. Measurement Models
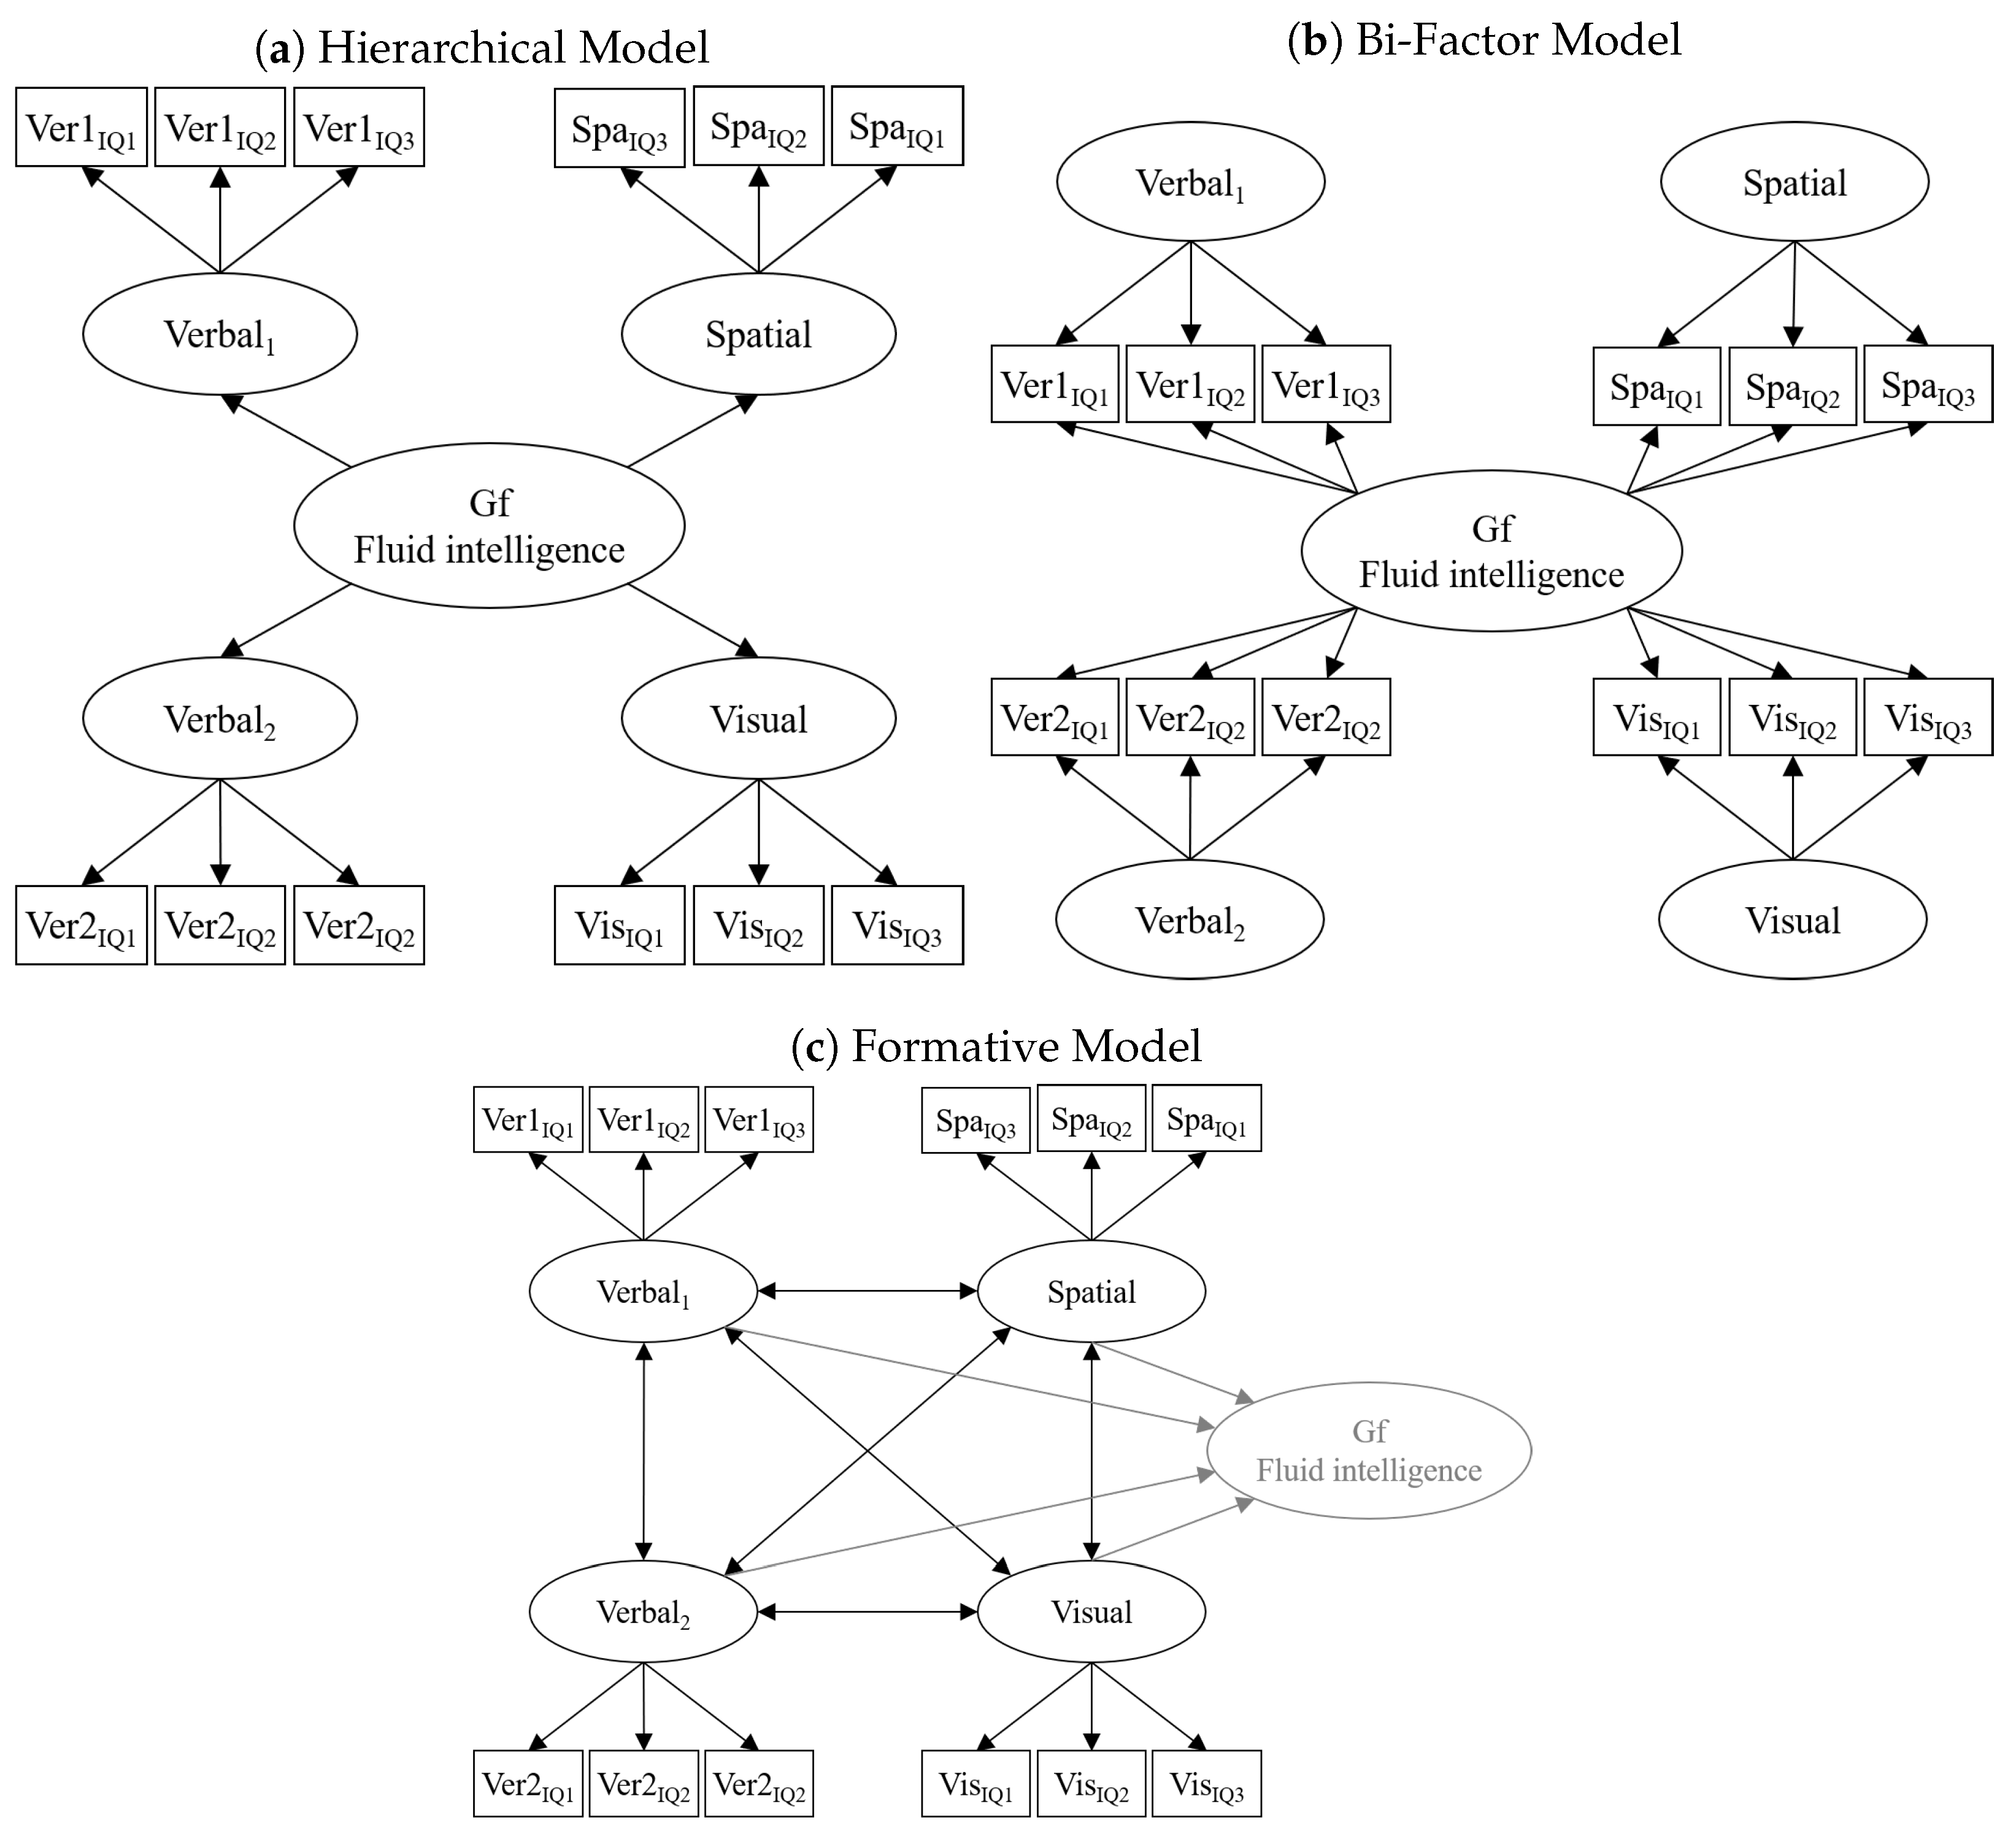
3.2.1. Fluid Intelligence (Gf)
- a hierarchical measurement model assuming a general Gf factor,
- a bi-factor measurement model separating a general Gf factor from task-specific factors, and
- a measurement model assuming correlated first-order factors not specifying a higher-order factor of Gf.
3.2.2. Inhibition
3.2.3. Shifting
3.2.4. Removal Efficiency
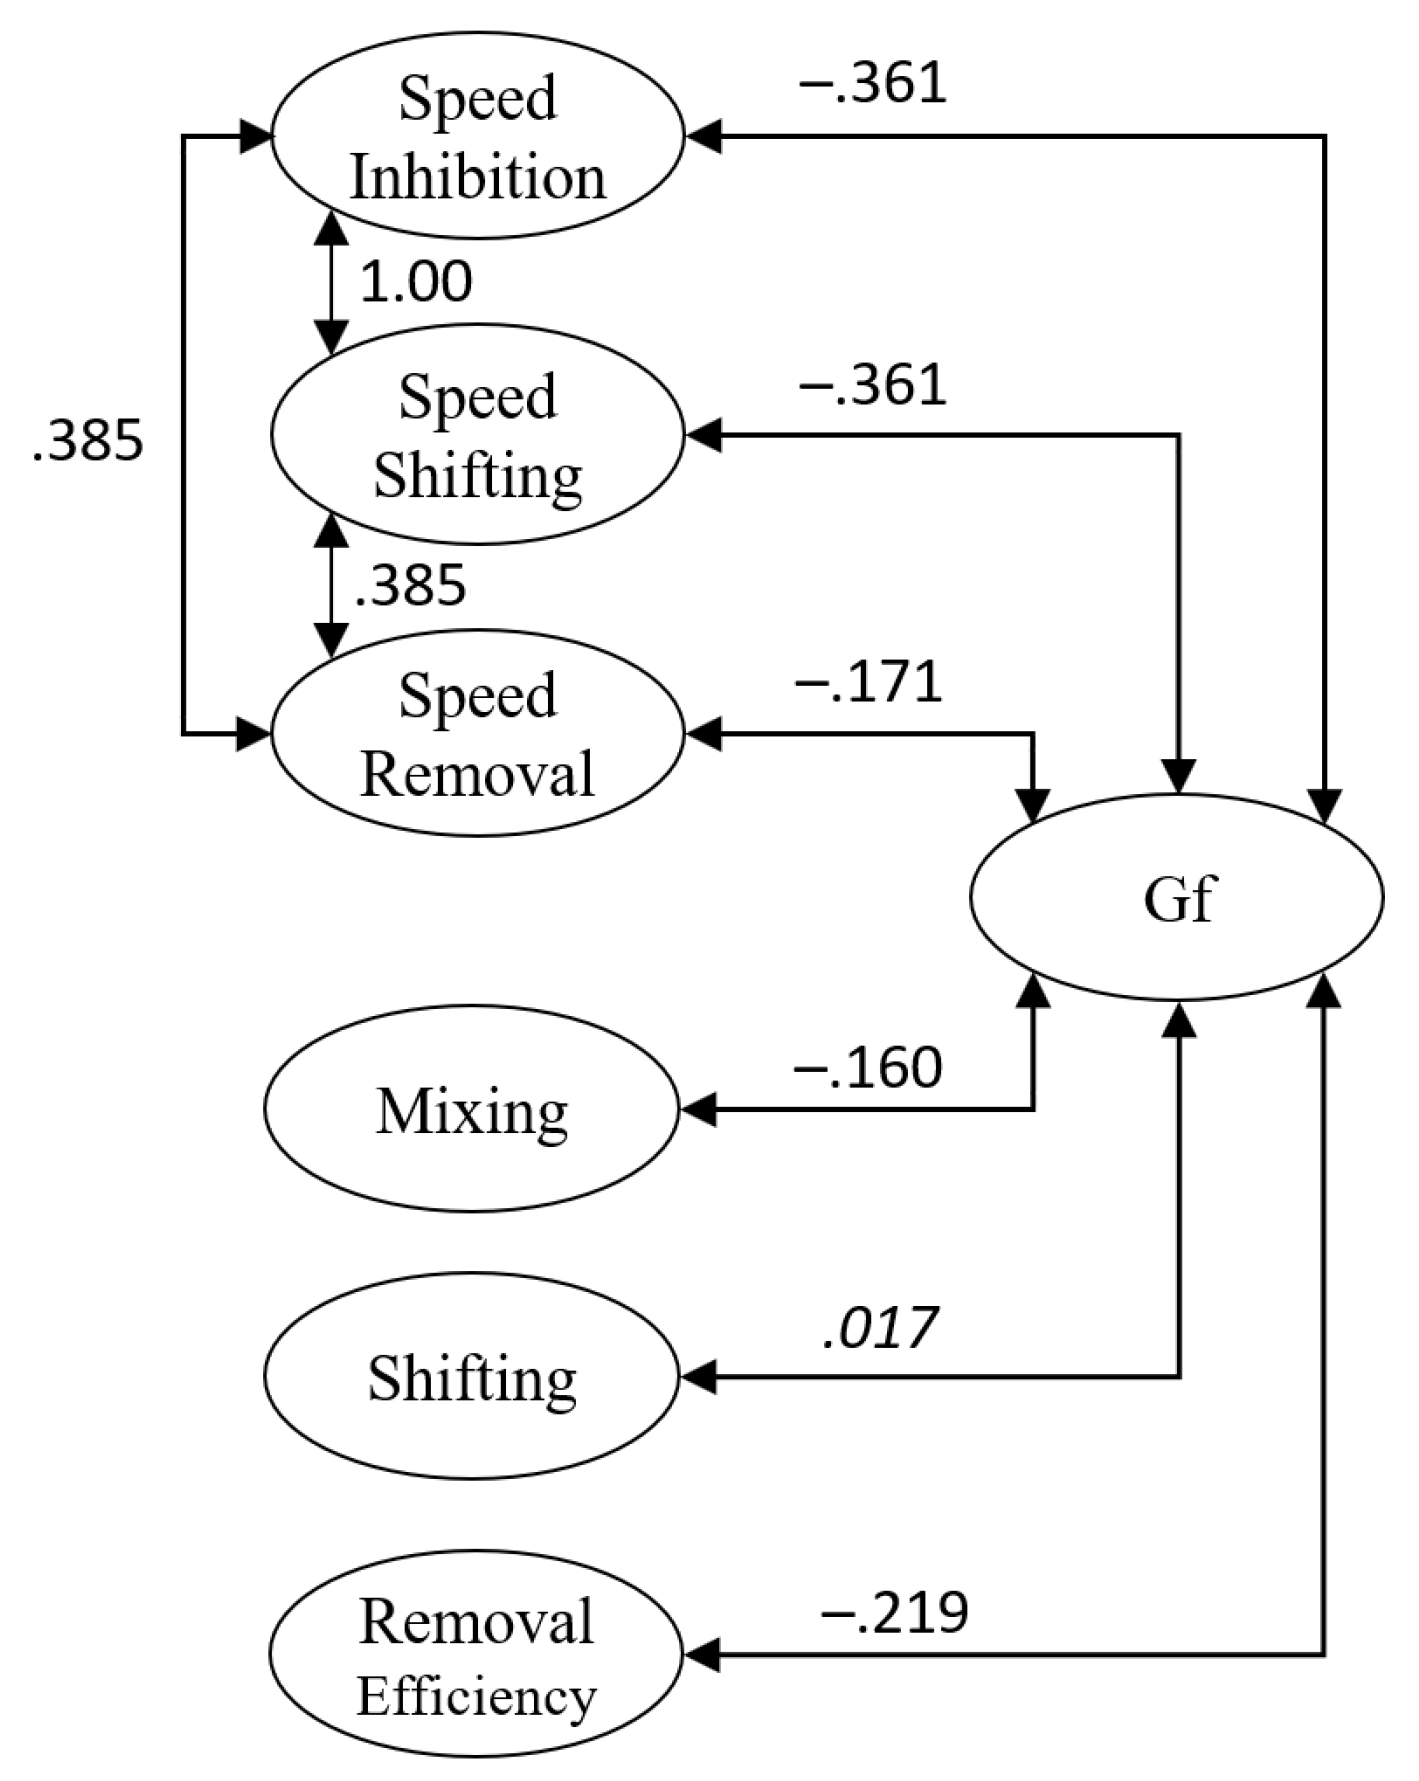
3.3. Relationships between Performance in Executive Processing Tasks and Intelligence Measures
4. Discussion
4.1. Isolating Variance from Domain-General Cognitive Processes in Executive Processing Tasks
4.2. Relationships of Domain-General Processing Speed and Executive Processes with Gf Measures
5. Conclusions
Author Contributions
Funding
Institutional Review Board Statement
Informed Consent Statement
Data Availability Statement
Acknowledgments
Conflicts of Interest
| 1 | POT does not assume the specific executive processes to be perfectly independent. In this, small correlations between the executive processing factors would not contradict POT. |
| 2 | Notably, results from other studies suggest that memory tasks only involving storage demands are equally—if not better—suited measures of individual differences in working memory capacity than complex span tasks and show similarly strong associations to intelligence measures (Wilhelm et al. 2013; Colom et al. 2005, 2008). It is, therefore, still a matter of debate to what extent executive processes limit the capacity of working memory (Oberauer et al. 2016; Shipstead et al. 2016). |
| 3 | Other common updating tasks, such as the N-back or keep-track tasks, measure updating as the accuracy of correct memory retrieval in WM tasks involving updating. In contrast, measures of removal efficiency indicate how long an individual takes to update information after having been cued to update one specific item in working memory. Therefore, the RT-based measure of removal efficiency more specifically isolates individual differences specific to the process of removing outdated information from memory (Ecker et al. 2014) and does not conflate basic WM maintenance abilities with updating specific processes (Frischkorn et al. 2020). |
| 4 | The term disengagement more generally refers to inhibition or removal of outdated or irrelevant information. Thus, disengagement is implemented by the three studied executive processes in different forms. |
| 5 | The original study (De Simoni and von Bastian 2018) distinguished between numerical, verbal, visual, and spatial tasks; however, in hindsight, we noted some problems with this distinction. For example, arguably, the Raven’s Advanced Progressive Matrices should be classified as a figural task, and the Locations Test could just as well be classified as a spatial instead of a visual task. Therefore, for the purpose of the present study, we decided to group verbal & numerical tasks into phonological tasks and visual, spatial, and figural tasks into visuospatial tasks. |
| 6 | Although a higher-order model could always be fit to a correlated factor model (Gignac and Kretzschmar 2017), some researchers argue that a correlated factor model more explicitly indicates that there are distinct but correlated dimensions (Van Der Maas et al. 2006). Additionally, there can be statistically equivalent models that still differ in their theoretical interpretation; thus, we cannot ground the interpretation of SEM solely on the existence of equivalent or other well-fitting models (Borsboom 2005; Borsboom et al. 2003). |
| 7 | In fact, this correlation was fixed to one because it was estimated to be larger than one. |
| 8 | As general processing speed in inhibition and shifting tasks was perfectly correlated, this correlation was constrained to be equal between general processing speed in inhibition and removal tasks, as well as in shifting and removal tasks. |
References
- Ackerman, Phillip L., and David Z. Hambrick. 2020. A primer on assessing intelligence in laboratory studies. Intelligence 80: 101440. [Google Scholar] [CrossRef]
- Arthur, Winfred, and David V. Day. 1994. Development of a Short form for the Raven Advanced Progressive Matrices Test. Educational and Psychological Measurement 54: 394–403. [Google Scholar] [CrossRef]
- Baddeley, Alan, and Graham Hitch. 1974. Working Memory. In Psychology of Learning and Motivation. Edited by Gordon H. Bower. Cambridge: Academic Press, vol. 8, pp. 47–89. [Google Scholar] [CrossRef]
- Bollen, Kenneth A. 1980. Issues in the Comparative Measurement of Political Democracy. American Sociological Review 45: 370. [Google Scholar] [CrossRef]
- Borsboom, Denny. 2005. Measuring the Mind: Conceptual Issues in Contemporary Psychometrics. New York: Cambridge University Press. [Google Scholar] [CrossRef]
- Borsboom, Denny, Gideon J. Mellenbergh, and Jaap van Heerden. 2003. The theoretical status of latent variables. Psychological Review 110: 203–19. [Google Scholar] [CrossRef] [PubMed] [Green Version]
- Carroll, John B. 1993. Human Cognitive Abilities: A Survey of Factor-Analytic Studies. New York: Cambridge University Press. [Google Scholar]
- Colom, Roberto, Francisco J. Abad, Mª Ángeles Quiroga, Pei Chun Shih, and Carmen Flores-Mendoza. 2008. Working memory and intelligence are highly related constructs, but why? Intelligence 6: 584–606. [Google Scholar] [CrossRef]
- Colom, Roberto, Carmen Flores-Mendoza, M. Ángeles Quiroga, and Jesús Privado. 2005. Working memory and general intelligence: The role of short-term storage. Personality and Individual Differences 39: 1005–14. [Google Scholar] [CrossRef]
- Conway, Andrew R. A., Nelson Cowan, Michael F. Bunting, David J. Therriault, and Scott R. B. Minkoff. 2002. A latent variable analysis of working memory capacity, short-term memory capacity, processing speed, and general fluid intelligence. Intelligence 30: 163–83. [Google Scholar] [CrossRef]
- Cronbach, Lee J., and Lita Furby. 1970. How we should measure “change”: Or should we? Psychological Bulletin 74: 68–80. [Google Scholar] [CrossRef] [Green Version]
- De Simoni, Carla, and Claudia C. von Bastian. 2018. Working memory updating and binding training: Bayesian evidence supporting the absence of transfer. Journal of Experimental Psychology: General 147: 829–58. [Google Scholar] [CrossRef]
- Diamond, Adele. 2013. Executive Functions. Annual Review of Psychology 64: 135–68. [Google Scholar] [CrossRef] [PubMed] [Green Version]
- Draheim, Christopher, Cody A. Mashburn, Jessie D. Martin, and Randall W. Engle. 2019. Reaction time in differential and developmental research: A review and commentary on the problems and alternatives. Psychological Bulletin 145: 508–35. [Google Scholar] [CrossRef]
- Draheim, Christopher, Jason S. Tsukahara, Jessie D. Martin, Cody A. Mashburn, and Randall W. Engle. 2021. A toolbox approach to improving the measurement of attention control. Journal of Experimental Psychology: General 150: 242–75. [Google Scholar] [CrossRef] [PubMed]
- Ecker, Ullrich K. H., Klaus Oberauer, and Stephan Lewandowsky. 2014. Working memory updating involves item-specific removal. Journal of Memory and Language 74: 1–15. [Google Scholar] [CrossRef] [Green Version]
- Ecker, Ullrich K. H., Stephan Lewandowsky, Klaus Oberauer, and Abby E. H. Chee. 2010. The components of working memory updating: An experimental decomposition and individual differences. Journal of Experimental Psychology: Learning, Memory, and Cognition 36: 170–89. [Google Scholar] [CrossRef] [Green Version]
- Ecker, Ullrich K. H., Stephan Lewandowsky, and Klaus Oberauer. 2014. Removal of information from working memory: A specific updating process. Journal of Memory and Language 74: 77–90. [Google Scholar] [CrossRef] [Green Version]
- Ekstrom, Ruth B., John M. French, Harry H. Harman, and Diran Derman. 1976. Manual for Kit of Factor-Referenced Cognitive Tests. Princeton: Educational Testing Service. [Google Scholar]
- Engle, Randall W., Stephen W. Tuholski, James E. Laughlin, and Andrew R. Conway. 1999. Working memory, short-term memory, and general fluid intelligence: A latent-variable approach. Journal of Experimental Psychology General 128: 309–31. [Google Scholar] [CrossRef]
- Eriksen, Barbara A., and Charles W. Eriksen. 1974. Effects of noise letters upon the identification of a target letter in a nonsearch task. Perception & Psychophysics 16: 143–49. [Google Scholar]
- Fleming, Kimberly A., Samantha J. Heintzelman, and Bruce D. Bartholow. 2016. Specifying Associations Between Conscientiousness and Executive Functioning: Mental Set Shifting, Not Prepotent Response Inhibition or Working Memory Updating. Journal of Personality 84: 348–60. [Google Scholar] [CrossRef] [Green Version]
- Friedman, Naomi P., Robin P. Corley, John K. Hewitt, and Kenneth P. Wright. 2009. Individual Differences in Childhood Sleep Problems Predict Later Cognitive Executive Control. Sleep 32: 323–33. [Google Scholar] [CrossRef] [Green Version]
- Friedman, Naomi P., and Akira Miyake. 2017. Unity and diversity of executive functions: Individual differences as a window on cognitive structure. Cortex 86: 186–204. [Google Scholar] [CrossRef] [PubMed] [Green Version]
- Friedman, Naomi P., Akira Miyake, Lee J. Altamirano, Robin P. Corley, Susan E. Young, Sally Ann Rhea, and John K. Hewitt. 2016. Stability and change in executive function abilities from late adolescence to early adulthood: A longitudinal twin study. Developmental Psychology 52: 326–40. [Google Scholar] [CrossRef]
- Friedman, Naomi P., Akira Miyake, Susan E. Young, John C. DeFries, Robin P. Corley, and John K. Hewitt. 2008. Individual differences in executive functions are almost entirely genetic in origin. Journal of Experimental Psychology: General 137: 201–25. [Google Scholar] [CrossRef] [PubMed]
- Frischkorn, Gidon T., and Anna-Lena Schubert. 2018. Cognitive Models in Intelligence Research: Advantages and Recommendations for Their Application. Journal of Intelligence 6: 34. [Google Scholar] [CrossRef] [PubMed] [Green Version]
- Frischkorn, Gidon T., Anna-Lena Schubert, and Dirk Hagemann. 2019. Processing speed, working memory, and executive functions: Independent or inter-related predictors of general intelligence. Intelligence 75: 95–110. [Google Scholar] [CrossRef] [Green Version]
- Frischkorn, Gidon T., Claudia Christina von Bastian, Alessandra S. Souza, and Klaus Oberauer. 2020. Individual Differences in Updating are not related to Reasoning Ability and Working Memory Capacity. PsyArXiv. [Google Scholar] [CrossRef]
- Gignac, Gilles E. 2016. The higher-order model imposes a proportionality constraint: That is why the bifactor model tends to fit better. Intelligence 55: 57–68. [Google Scholar] [CrossRef]
- Gignac, Gilles E., and André Kretzschmar. 2017. Evaluating dimensional distinctness with correlated-factor models: Limitations and suggestions. Intelligence 62: 138–47. [Google Scholar] [CrossRef]
- Hedge, Craig, Georgina Powell, and Petroc Sumner. 2018. The reliability paradox: Why robust cognitive tasks do not produce reliable individual differences. Behavior Research Methods 50: 1166–86. [Google Scholar] [CrossRef]
- Horn, John L. 1965. A rationale and test for the number of factors in factor analysis. Psychometrika 30: 179–85. [Google Scholar] [CrossRef] [PubMed]
- Hu, Li-tze, and Peter M. Bentler. 1998. Fit Indices in Covariance Structure Modeling: Sensitivity to Underparameterized Model Misspecification. Psychological Methods 3: 424–53. [Google Scholar] [CrossRef]
- Hu, Li-tze, and Peter M. Bentler. 1999. Cutoff criteria for fit indexes in covariance structure analysis: Conventional criteria versus new alternatives. Structural Equation Modeling 6: 1–55. [Google Scholar] [CrossRef]
- Hübner, Ronald, and Thomas Pelzer. 2020. Improving parameter recovery for conflict drift-diffusion models. Behavior Research Methods 52: 1848–66. [Google Scholar] [CrossRef] [PubMed]
- Huebner, Ronald, Marco Steinhauser, and Carola Lehle. 2010. A dual-stage two-phase model of selective attention. Psychological Review 117: 759–84. [Google Scholar] [CrossRef] [PubMed] [Green Version]
- Jensen, Arthur R. 1998. The g Factor—The Science of Mental Ability. Westport: Praeger Publishers. [Google Scholar]
- Johnson, Wendy, Jan te Nijenhuis, and Thomas J. Bouchard. 2008. Still just 1 g: Consistent results from five test batteries. Intelligence 36: 81–95. [Google Scholar] [CrossRef]
- Jurado, María Beatriz, and Mónica Rosselli. 2007. The Elusive Nature of Executive Functions: A Review of our Current Understanding. Neuropsychology Review 17: 213–33. [Google Scholar] [CrossRef] [PubMed]
- Kane, Michael J., David Z. Hambrick, Stephen W. Tuholski, Oliver Wilhelm, Tabitha W. Payne, and Randall W. Engle. 2004. The Generality of Working Memory Capacity: A Latent-Variable Approach to Verbal and Visuospatial Memory Span and Reasoning. Journal of Experimental Psychology: General 133: 189–217. [Google Scholar] [CrossRef] [PubMed]
- Karr, Justin E., Corson N. Areshenkoff, Philippe Rast, Scott M. Hofer, Grant L. Iverson, and Mauricio A. Garcia-Barrera. 2018. The unity and diversity of executive functions: A systematic review and re-analysis of latent variable studies. Psychological Bulletin 144: 1147–85. [Google Scholar] [CrossRef]
- Kirchner, Wayne K. 1958. Age differences in short-term retention of rapidly changing information. Journal of Experimental Psychology 55: 352–58. [Google Scholar] [CrossRef]
- Kline, Rex B. 2016. Principles and Practice of Structural Equation Modeling, 4th ed. New York: Guilford Press. [Google Scholar]
- Kovacs, Kristof, and Andrew R. A. Conway. 2016. Process Overlap Theory: A Unified Account of the General Factor of Intelligence. Psychological Inquiry 27: 151–77. [Google Scholar] [CrossRef]
- Kovacs, Kristof, and Andrew R. A. Conway. 2019. A Unified Cognitive/Differential Approach to Human Intelligence: Implications for IQ Testing. Journal of Applied Research in Memory and Cognition 8: 255–72. [Google Scholar] [CrossRef]
- Kramer, Joel H., Dan Mungas, Katherine L. Possin, Katherine P. Rankin, Adam L. Boxer, Howard J. Rosen, Alan Bostrom, Lena Sinha, Ashley Berhel, and Mary Widmeyer. 2014. NIH EXAMINER: Conceptualization and Development of an Executive Function Battery. Journal of the International Neuropsychological Society 20: 11–19. [Google Scholar] [CrossRef] [Green Version]
- Lerche, Veronika, Mischa von Krause, Andreas Voss, Gidon T. Frischkorn, Anna-Lena Schubert, and Dirk Hagemann. 2020. Diffusion modeling and intelligence: Drift rates show both domain-general and domain-specific relations with intelligence. Journal of Experimental Psychology: General 149: 2207–49. [Google Scholar] [CrossRef] [PubMed]
- McArdle, John J. 2009. Latent Variable Modeling of Differences and Changes with Longitudinal Data. Annual Review of Psychology 60: 577–605. [Google Scholar] [CrossRef] [PubMed]
- McArdle, John J., and Richard W. Woodcock. 1997. Expanding test–retest designs to include developmental time-lag components. Psychological Methods 2: 403–35. [Google Scholar] [CrossRef]
- McGrew, Kevin S. 2005. The Cattell-Horn-Carroll Theory of Cognitive Abilities: Past, Present, and Future. In Contemporary Intellectual Assessment: Theories, Tests, and Issues. Edited by Dawn P. Flanagan and Patti L. Harrison. New York and London: The Guilford Press. [Google Scholar]
- Miyake, Akira, Naomi P. Friedman, Michael J. Emerson, Alexander H. Witzki, Amy Howerter, and Tor D. Wager. 2000. The Unity and Diversity of Executive Functions and Their Contributions to Complex “Frontal Lobe” Tasks: A Latent Variable Analysis. Cognitive Psychology 41: 49–100. [Google Scholar] [CrossRef] [PubMed] [Green Version]
- Miyake, Akira, Naomi P. Friedman, David A. Rettinger, Priti Shah, and Mary Hegarty. 2001. How are visuospatial working memory, executive functioning, and spatial abilities related? A latent-variable analysis. Journal of Experimental Psychology: General 130: 621–40. [Google Scholar] [CrossRef] [PubMed]
- Monsell, Stephen. 2003. Task switching. Trends in Cognitive Sciences 7: 134–40. [Google Scholar] [CrossRef]
- Monsell, Stephen, and Jon Driver. 2000. Control of Cognitive Processes. Cambridge: The MIT Press. [Google Scholar]
- Navon, David. 1977. Forest before trees: The precedence of global features in visual perception. Cognitive Psychology 9: 353–83. [Google Scholar] [CrossRef]
- Oberauer, Klaus, Simon Farrell, Christopher Jarrold, and Stephan Lewandowsky. 2016. What limits working memory capacity? Psychological Bulletin 142: 758–99. [Google Scholar] [CrossRef] [PubMed] [Green Version]
- RStudio Team. 2015. RStudio: Integrated Development Environment for R. Available online: http://www.rstudio.com/ (accessed on 22 January 2019).
- R Core Team. 2018. R: A Language and Environment for Statistical Computing. Vienna: R Foundation for Statistical Computing. [Google Scholar]
- Raykov, Tenko. 2001. Estimation of congeneric scale reliability using covariance structure analysis with nonlinear constraints. British Journal of Mathematical and Statistical Psychology 54: 315–23. [Google Scholar] [CrossRef] [PubMed]
- Rey-Mermet, Alodie, and Miriam Gade. 2018. Inhibition in aging: What is preserved? What declines? A meta-analysis. Psychonomic Bulletin & Review 25: 1695–716. [Google Scholar]
- Rey-Mermet, Alodie, Miriam Gade, and Klaus Oberauer. 2018. Should we stop thinking about inhibition? Searching for individual and age differences in inhibition ability. Journal of Experimental Psychology: Learning, Memory, and Cognition 44: 501–26. [Google Scholar] [CrossRef]
- Rey-Mermet, Alodie, Miriam Gade, Alessandra S. Souza, Claudia C. von Bastian, and Klaus Oberauer. 2019. Is executive control related to working memory capacity and fluid intelligence? Journal of Experimental Psychology: General 148: 1335–72. [Google Scholar] [CrossRef] [PubMed] [Green Version]
- Rey-Mermet, Alodie, Kris Singh, Gilles E. Gignac, Christopher Brydges, and Ullrich K. H. Ecker. 2020. Removal of information from working memory is not related to inhibition. PsyArXiv, 1–44. [Google Scholar] [CrossRef]
- Rosseel, Yves, Daniel Oberski, Jarrett Byrnes, Leonard Vanbrabant, Victoria Savalei, Ed Merkle, Michael Hallquist, Mijke Rhemtulla, Myrsini Katsikatsou, Mariska Barendse, and et al. 2018. Lavaan: Latent Variable Analysis. Available online: https://cran.r-project.org/web/packages/lavaan/ (accessed on 13 September 2018).
- Rouder, Jeffrey N., and Julia M. Haaf. 2019. A psychometrics of individual differences in experimental tasks. Psychonomic Bulletin & Review 26: 452–67. [Google Scholar]
- Salthouse, Timothy A., and Elizabeth J. Meinz. 1995. Aging, Inhibition, Working Memory, and Speed. The Journals of Gerontology: Series B 50B: P297–P306. [Google Scholar] [CrossRef] [Green Version]
- Schmiedek, Florian, Klaus Oberauer, Oliver Wilhelm, Heinz-Martin Süß, and Werner W. Wittmann. 2007. Individual differences in components of reaction time distributions and their relations to working memory and intelligence. Journal of Experimental Psychology: General 136: 414–29. [Google Scholar] [CrossRef] [Green Version]
- Sheppard, Leah D., and Philip A. Vernon. 2008. Intelligence and speed of information-processing: A review of 50 years of research. Personality and Individual Differences 44: 535–51. [Google Scholar] [CrossRef]
- Shipstead, Zach, Tyler L. Harrison, and Randall W. Engle. 2016. Working Memory Capacity and Fluid Intelligence: Maintenance and Disengagement. Perspectives on Psychological Science 11: 771–99. [Google Scholar] [CrossRef] [PubMed] [Green Version]
- Simon, J. Richard, Paul E. Sly, and Sivakumar Vilapakkam. 1981. Effect of compatibility of S-R mapping on reactions toward the stimulus source. Acta Psychologica 47: 63–81. [Google Scholar] [CrossRef]
- Singh, Krishneil A., Gilles E. Gignac, Christopher R. Brydges, and Ullrich K. H. Ecker. 2018. Working memory capacity mediates the relationship between removal and fluid intelligence. Journal of Memory and Language 101: 18–36. [Google Scholar] [CrossRef] [Green Version]
- Singmann, Henrik, Ben Bolker, Jake Westfall, Frederik Aust, Søren Højsgaard, John Fox, Michael A. Lawrence, Ulf Mertens, Jonathon Love, Russell Lenth, and et al. 2018. Afex: Analysis of Factorial Experiments. Available online: https://cran.r-project.org/web/packages/afex/ (accessed on 11 September 2018).
- Spearman, Charles. 1904. “General Intelligence”, Objectively Determined and Measured. The American Journal of Psychology 15: 201–92. [Google Scholar] [CrossRef]
- Stahl, Christoph, Andreas Voss, Florian Schmitz, Mandy Nuszbaum, Oliver Tüscher, Klaus Lieb, and Karl Christoph Klauer. 2014. Behavioral components of impulsivity. Journal of Experimental Psychology: General 143: 850–86. [Google Scholar] [CrossRef] [PubMed]
- Stroop, J. Ridley. 1935. Studies of interference in serial verbal reactions. Journal of Experimental Psychology 18: 643–62. [Google Scholar] [CrossRef]
- Thomson, Godfrey H. 1916. A Hierarchy Without a General Factor. British Journal of Psychology, 1904-1920 8: 271–81. [Google Scholar] [CrossRef] [Green Version]
- Primary Mental Abilities. 1938. Chicago: University of Chicago Press.
- Ulrich, Rolf, Hannes Schröter, Hartmut Leuthold, and Teresa Birngruber. 2015. Automatic and controlled stimulus processing in conflict tasks: Superimposed diffusion processes and delta functions. Cognitive Psychology 78: 148–74. [Google Scholar] [CrossRef]
- Van Der Maas, Han L. J., Conor V. Dolan, Raoul P. P. P. Grasman, Jelte M. Wicherts, Hilde M. Huizenga, and Maartje E. J. Raijmakers. 2006. A dynamical model of general intelligence: The positive manifold of intelligence by mutualism. Psychological Review 113: 842–61. [Google Scholar] [CrossRef]
- von Bastian, Claudia Christina, Chris Blais, Gene Arnold Brewer, Mate Gyurkovics, Craig Hedge, Patrycja Kałamała, Matt Ethan Meier, Klaus Oberauer, Alodie Rey-Mermet, Jeffrey N. Rouder, and et al. 2020. Advancing the understanding of individual differences in attentional control: Theoretical, methodological, and analytical considerations. PsyArXiv, 1–81. [Google Scholar] [CrossRef]
- von Bastian, Claudia C., and Michel D. Druey. 2017. Shifting between mental sets: An individual differences approach to commonalities and differences of task switching components. Journal of Experimental Psychology: General 146: 1266–85. [Google Scholar] [CrossRef] [PubMed] [Green Version]
- von Bastian, Claudia C., Alessandra S. Souza, and Miriam Gade. 2016. No evidence for bilingual cognitive advantages: A test of four hypotheses. Journal of Experimental Psychology: General 145: 246–58. [Google Scholar] [CrossRef]
- White, Corey N., Roger Ratcliff, and Jeffrey Starns. 2011. Diffusion models of the flanker task: Discrete versus gradual attentional selection. Cognitive Psychology 63: 210–238. [Google Scholar]
- Wilhelm, Oliver, Andrea Hildebrandt, and Klaus Oberauer. 2013. What is working memory capacity, and how can we measure it? Frontiers in Psychology 4: 433. [Google Scholar] [CrossRef] [PubMed] [Green Version]
| Model | Constraints | df | p | CFI | RMSEA | AIC | BIC | p | ||
|---|---|---|---|---|---|---|---|---|---|---|
| Hierarchical | no | 47.5 | 62 | .914 | 1.00 | .00 [.00; .02] | 7353.0 | 7450.1 | ||
| I | 61.2 | 78 | .920 | 1.00 | .00 [.00; .01] | 7334.7 | 7376.3 | 13.7 | .621 | |
| I & II | 61.5 | 81 | .947 | 1.00 | .00 [.00; .00] | 7329.1 | 7360.3 | 0.4 | .946 | |
| Bi-Factor | no | 38.9 | 54 | .940 | 1.00 | .00 [.00; .01] | 7360.4 | 7485.2 | ||
| I | 57.9 | 70 | .848 | 1.00 | .00 [.00; .02] | 7347.5 | 7416.8 | 19.1 | .264 | |
| I & II | 62.4 | 81 | .938 | 1.00 | .00 [.00; .00] | 7329.9 | 7361.1 | 4.4 | .956 | |
| Correlated | no | 44.9 | 60 | .926 | 1.00 | .00 [.00; .01] | 7354.5 | 7458.5 | ||
| I | 59.2 | 76 | .922 | 1.00 | .00 [.00; .01] | 7336.8 | 7385.3 | 14.3 | .577 | |
| I & II | 61.5 | 81 | .947 | 1.00 | .00 [.00; .00] | 7329.1 | 7360.3 | 2.3 | .805 |
| Indicator | Domain-General Factors | Task-Specific Factors | ||||||||
| Task | Condition | Speed | Inhibition | Facilitation | Num | Ver | Vis | Spa | Error | |
|---|---|---|---|---|---|---|---|---|---|---|
| Inhibition | Numerical | neutral | .71 | .73 | .00 | |||||
| congruent | .72 | .06 | .67 | .04 | ||||||
| incongruent | .74 | .06 | .66 | .05 | ||||||
| Verbal | neutral | .78 | .61 | .03 | ||||||
| congruent | .79 | .06 | .58 | .04 | ||||||
| incongruent | .74 | .13 | .61 | .08 | ||||||
| Visual | neutral | .76 | .59 | .10 | ||||||
| congruent | .78 | .11 | .63 | .02 | ||||||
| incongruent | .78 | .03 | .59 | .08 | ||||||
| Spatial | neutral | .80 | .62 | .03 | ||||||
| congruent | .78 | −.04 | .57 | .08 | ||||||
| incongruent | .77 | .05 | .60 | .08 | ||||||
| Indicator | Domain-General Factors | Task-Specific Factors | ||||||||
| Task | Condition | Speed | Mixing | Shifting | Num | Ver | Vis | Spa | Error | |
| Shifting | Numerical | single task | .86 | .31 | .21 | |||||
| mixed repeat | .57 | .48 | .54 | .18 | ||||||
| mixed switch | .58 | .33 | .45 | .45 | .17 | |||||
| Verbal | single task | .92 | .16 | .17 | ||||||
| mixed repeat | .67 | .61 | .35 | .07 | ||||||
| mixed switch | .64 | .27 | .47 | .43 | .14 | |||||
| Visual | single task | .91 | .20 | .16 | ||||||
| mixed repeat | .54 | .64 | .46 | .08 | ||||||
| mixed switch | .54 | .29 | .51 | .36 | .24 | |||||
| Spatial | single task | .84 | .13 | .29 | ||||||
| mixed repeat | .57 | .52 | .70 | −.04 | ||||||
| mixed switch | .63 | .23 | .36 | .46 | .24 | |||||
| Indicator | Domain-General Factors | Task-Specific Factors | ||||||||
| Task | Condition | Speed | Removal | Num | Ver | Vis | Spa | Error | ||
| Removal | Numerical | long CTI | .99 | .09 | ||||||
| short CTI | .98 | .32 | * | |||||||
| Verbal | long CTI | .76 | .01 | |||||||
| short CTI | .68 | .23 | .09 | |||||||
| Visual | long CTI | .36 | .01 | |||||||
| short CTI | .33 | .05 | .06 | |||||||
| Spatial | long CTI | .38 | .03 | |||||||
| short CTI | .36 | .02 | .01 | |||||||
Publisher’s Note: MDPI stays neutral with regard to jurisdictional claims in published maps and institutional affiliations. |
© 2021 by the authors. Licensee MDPI, Basel, Switzerland. This article is an open access article distributed under the terms and conditions of the Creative Commons Attribution (CC BY) license (https://creativecommons.org/licenses/by/4.0/).
Share and Cite
Frischkorn, G.T.; von Bastian, C.C. In Search of the Executive Cognitive Processes Proposed by Process-Overlap Theory. J. Intell. 2021, 9, 43. https://doi.org/10.3390/jintelligence9030043
Frischkorn GT, von Bastian CC. In Search of the Executive Cognitive Processes Proposed by Process-Overlap Theory. Journal of Intelligence. 2021; 9(3):43. https://doi.org/10.3390/jintelligence9030043
Chicago/Turabian StyleFrischkorn, Gidon T., and Claudia C. von Bastian. 2021. "In Search of the Executive Cognitive Processes Proposed by Process-Overlap Theory" Journal of Intelligence 9, no. 3: 43. https://doi.org/10.3390/jintelligence9030043
APA StyleFrischkorn, G. T., & von Bastian, C. C. (2021). In Search of the Executive Cognitive Processes Proposed by Process-Overlap Theory. Journal of Intelligence, 9(3), 43. https://doi.org/10.3390/jintelligence9030043