Socio-Demographic Indicators, Intelligence, and Locus of Control as Predictors of Adult Financial Well-Being
Abstract
:1. Introduction
Hypotheses
2. Method
2.1. Participants
2.2. Measures
- (1)
- Family social background includes information on parental social class and parental education. Parental social class at birth was measured by the Registrar General’s measure of social class (RGSC). RGSC is defined according to occupational status [30]. Where the father was absent, the social class (RGSC) of the mother’s father was used. RGSC was coded on a 6-point scale: I professional; II managerial/technical; IIIN skilled non-manual; IIIM skilled manual; IV semi-skilled; and V unskilled occupations [31]. Scores were reversed. Parental education is measured by the age parents had left their full-time education.
- (2)
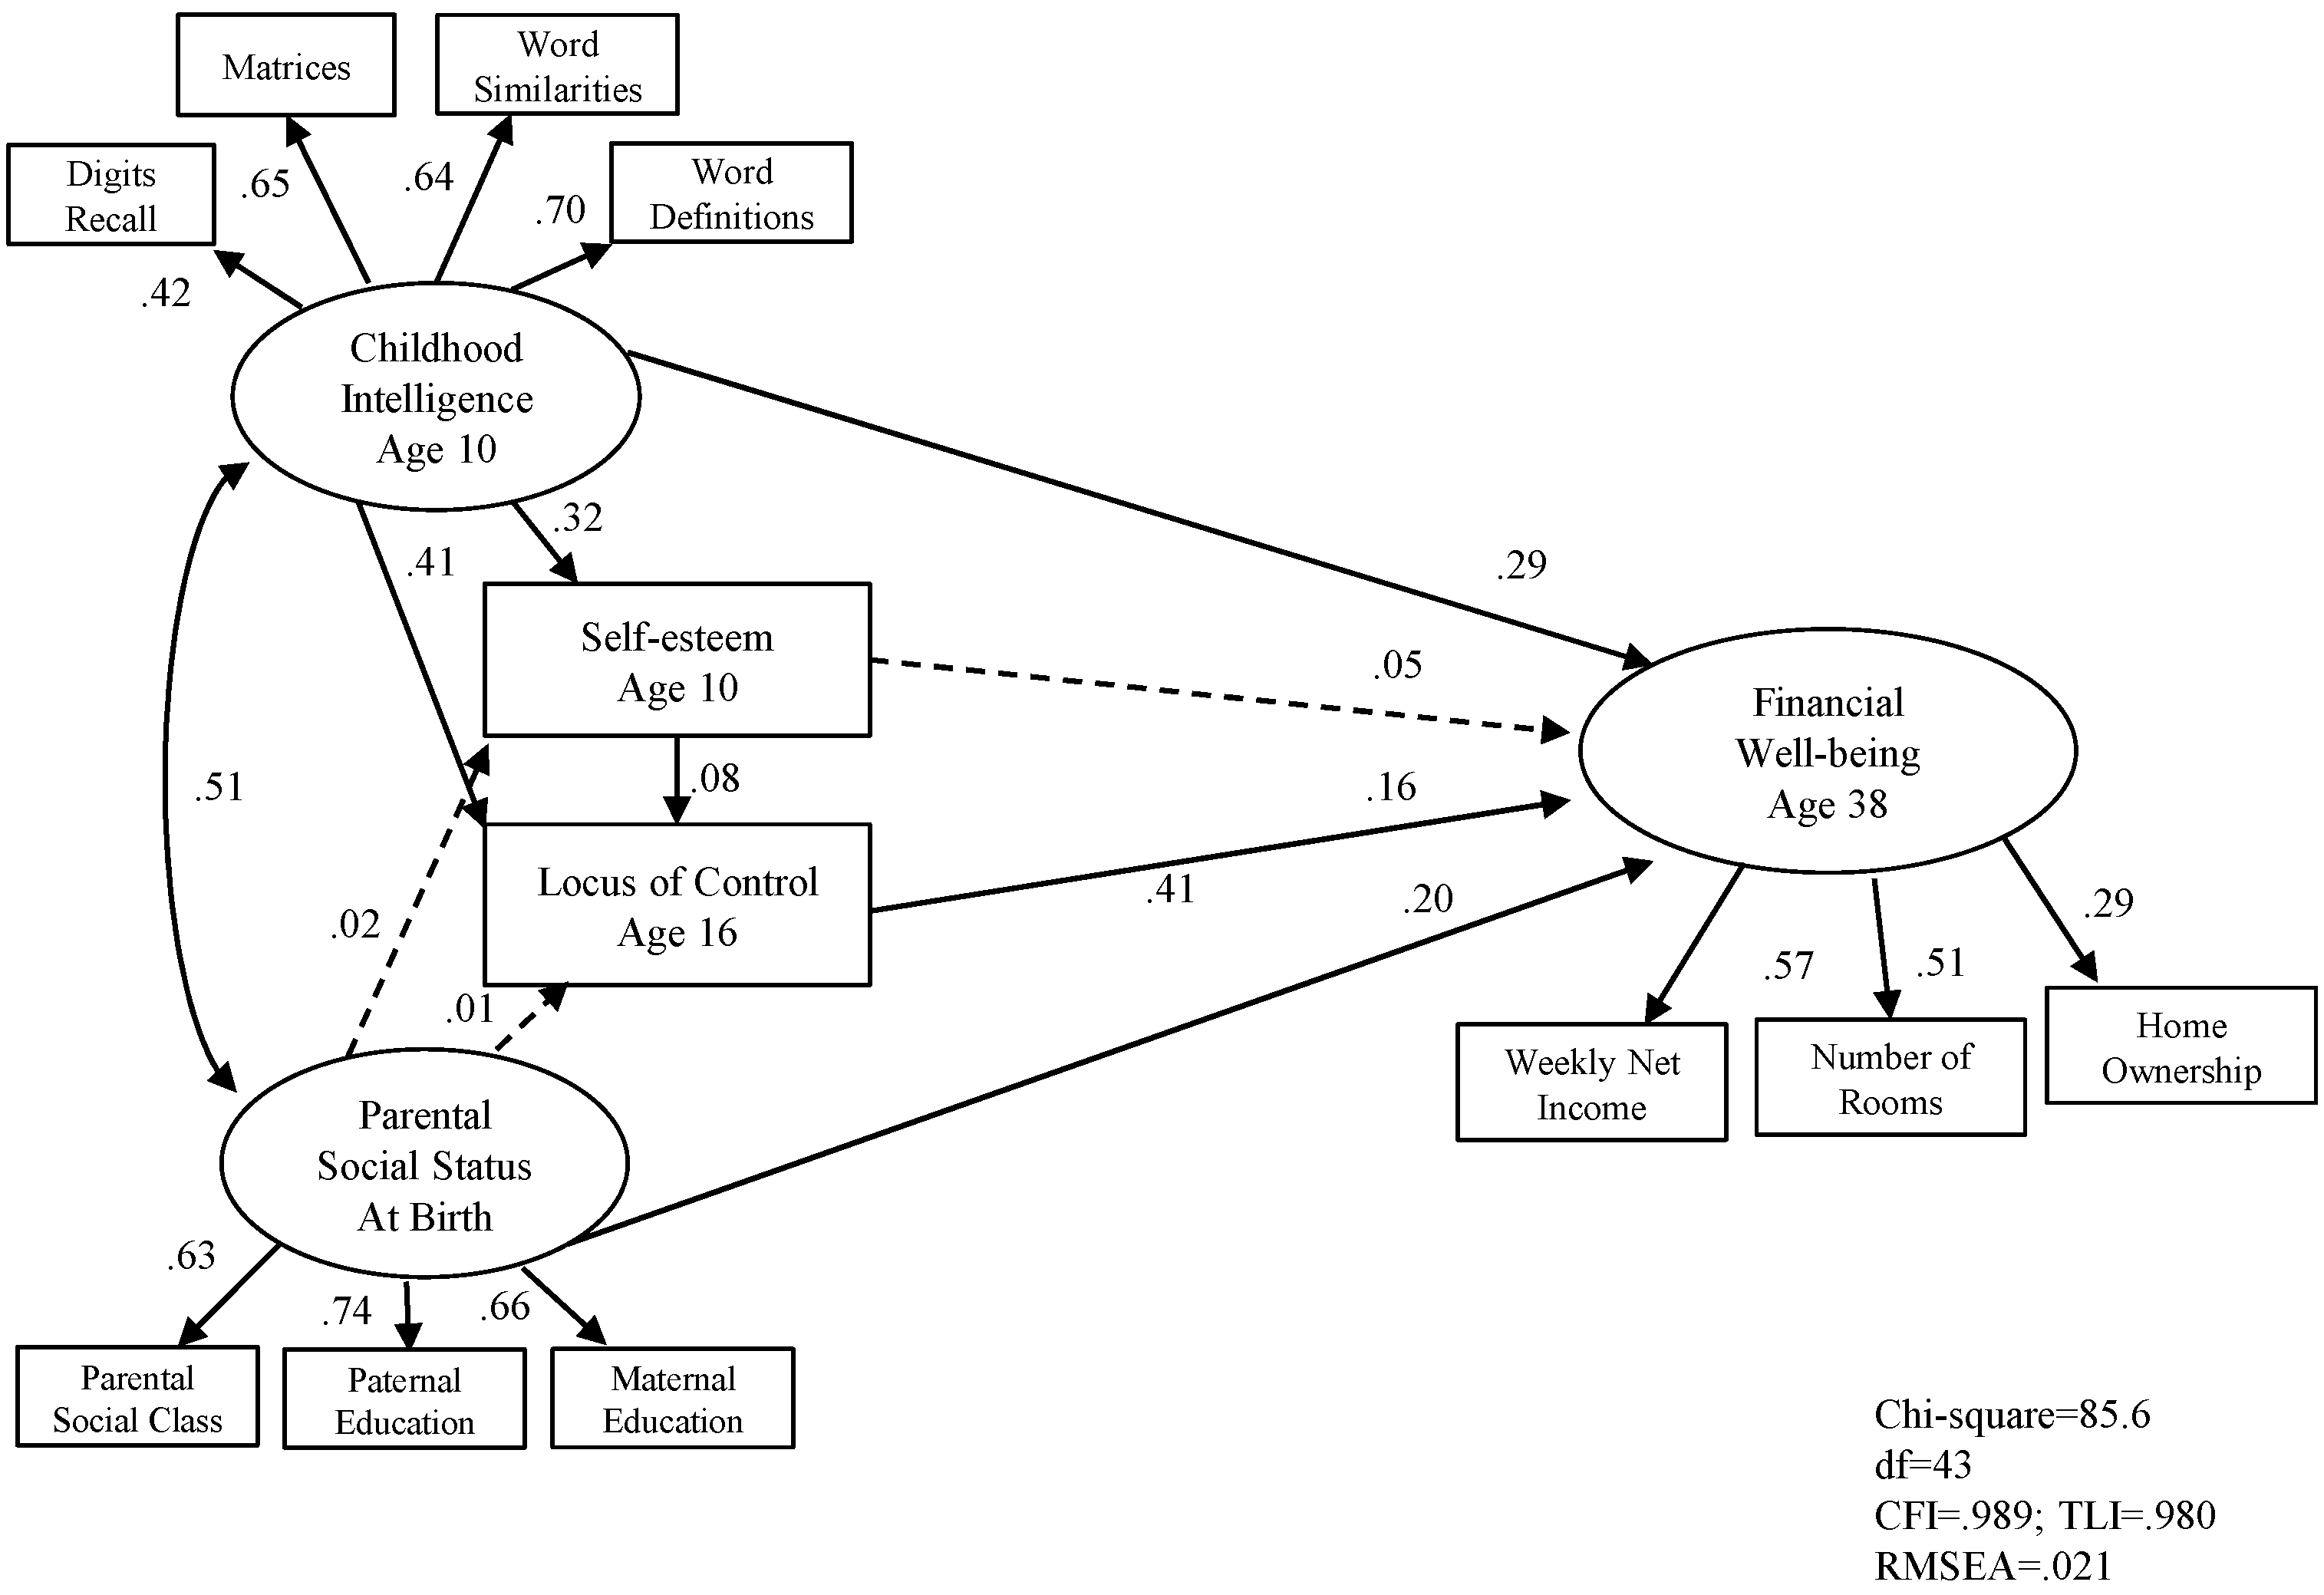
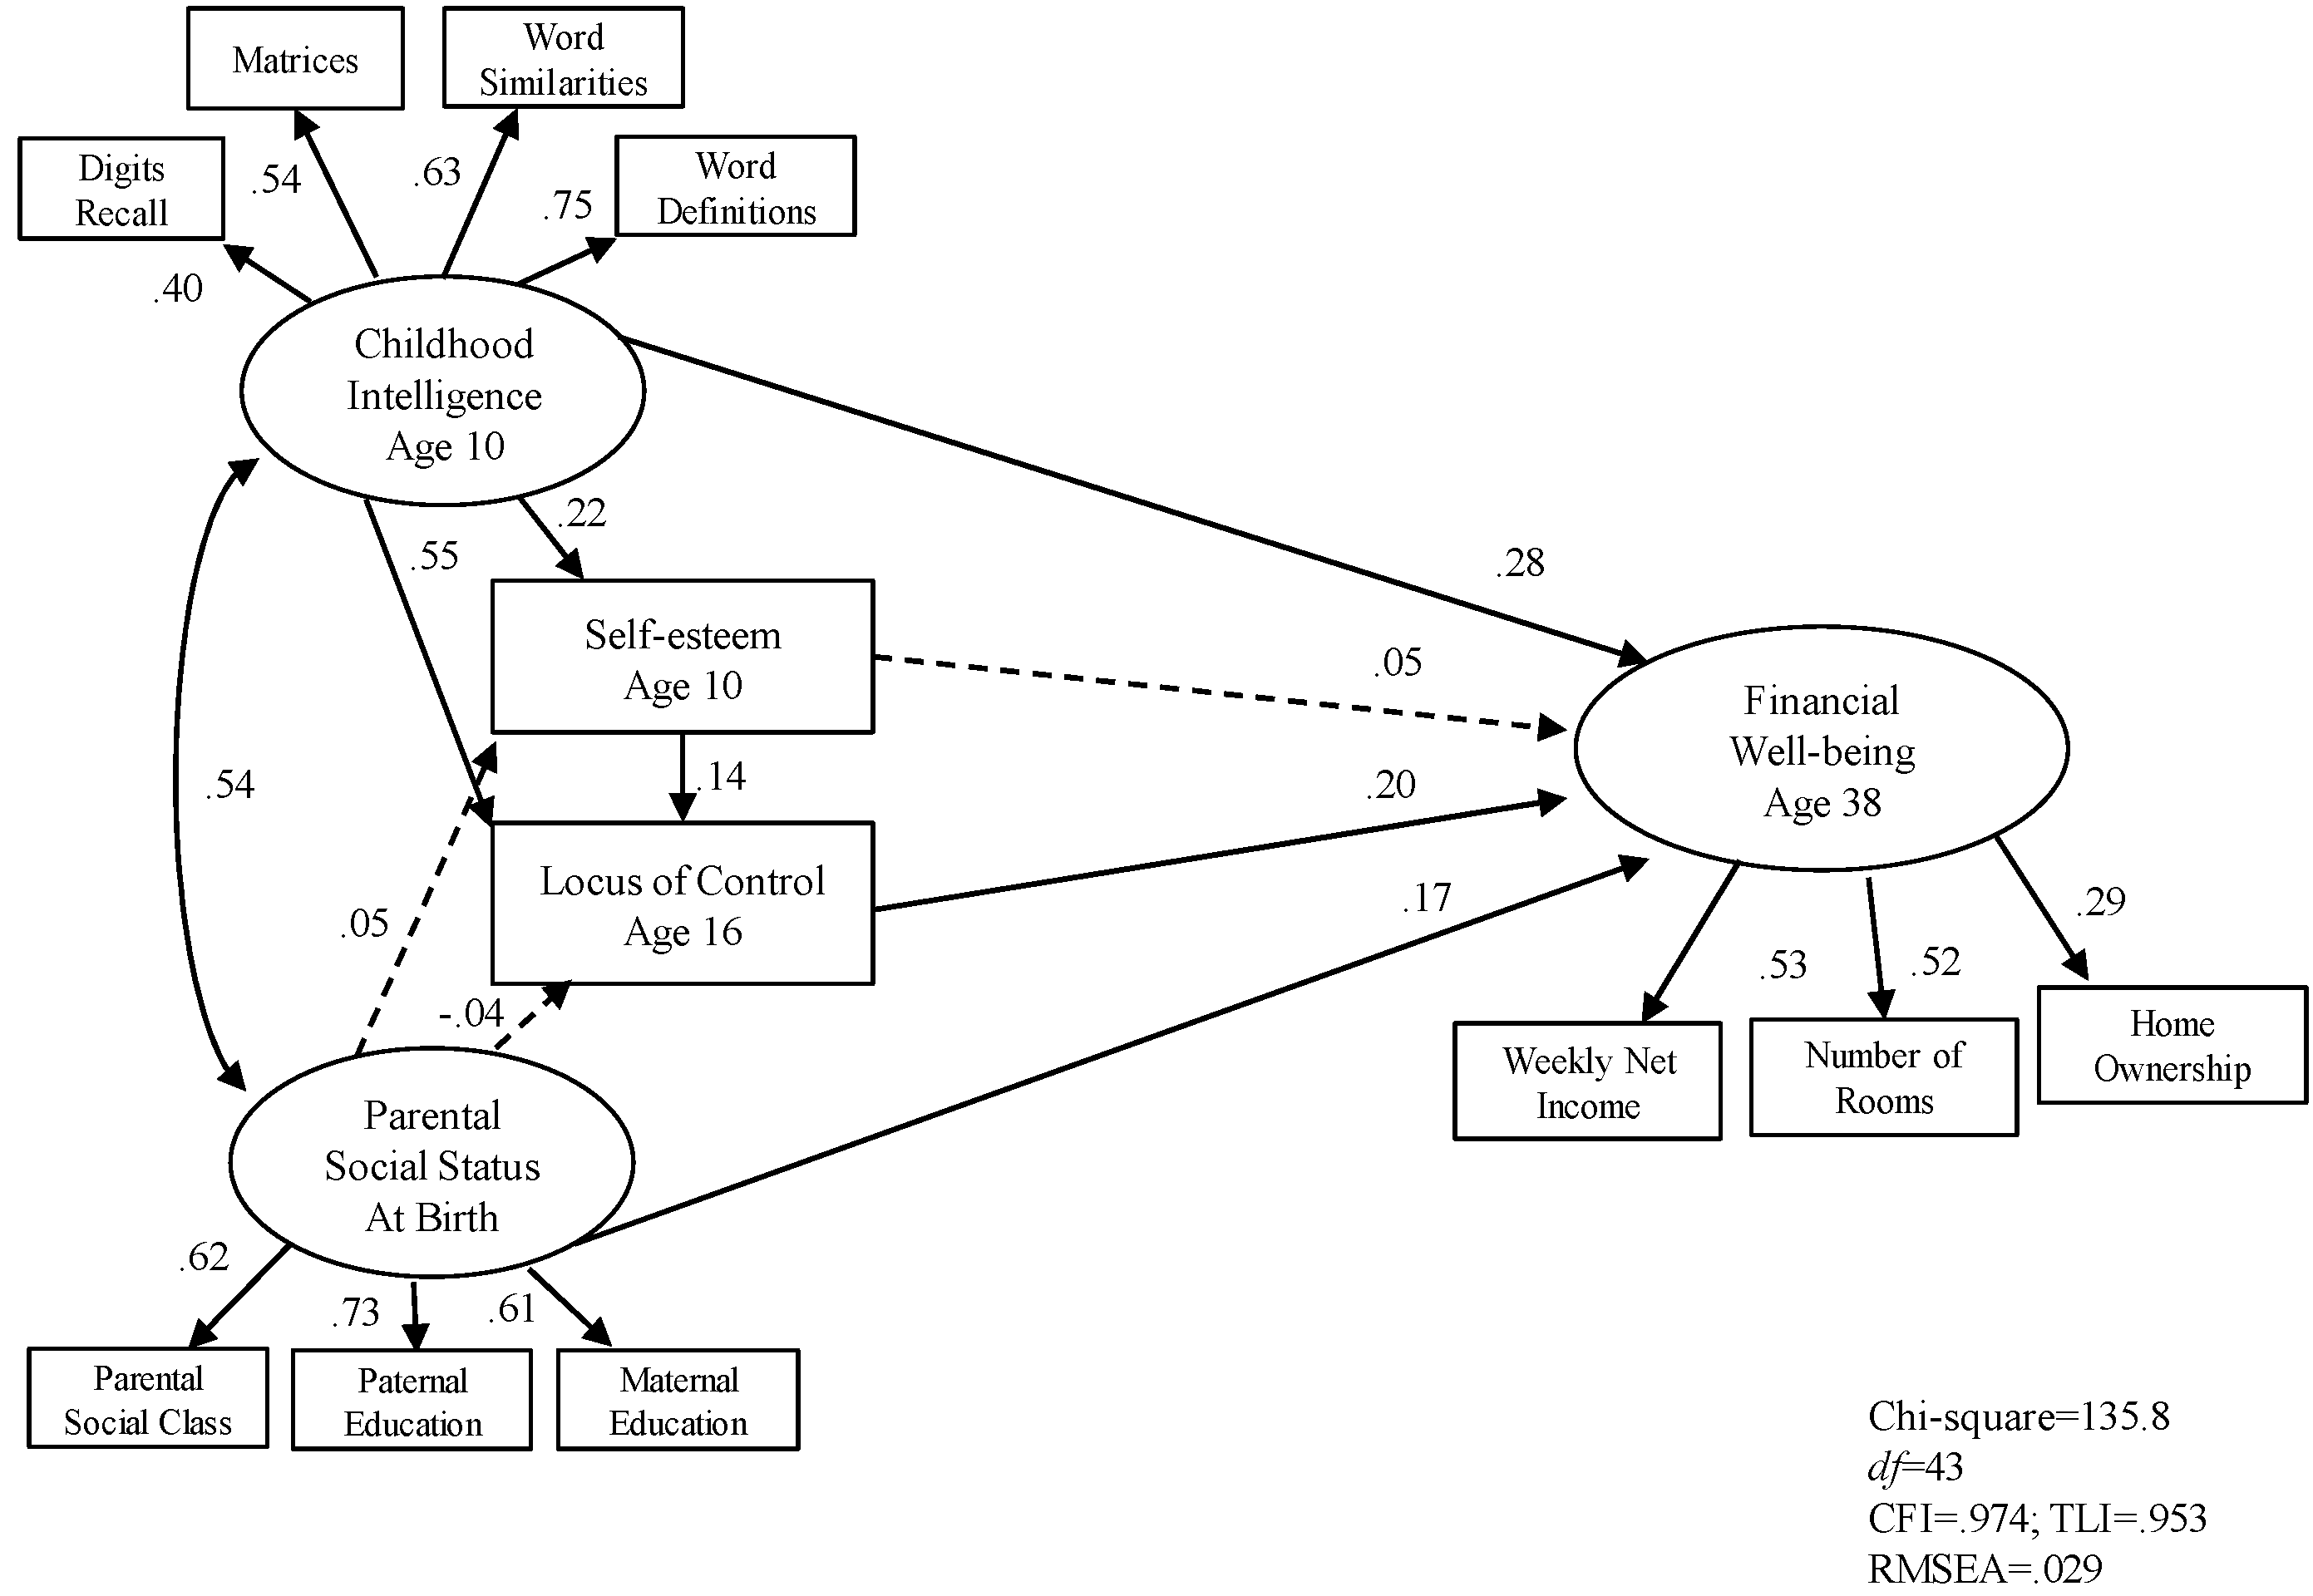
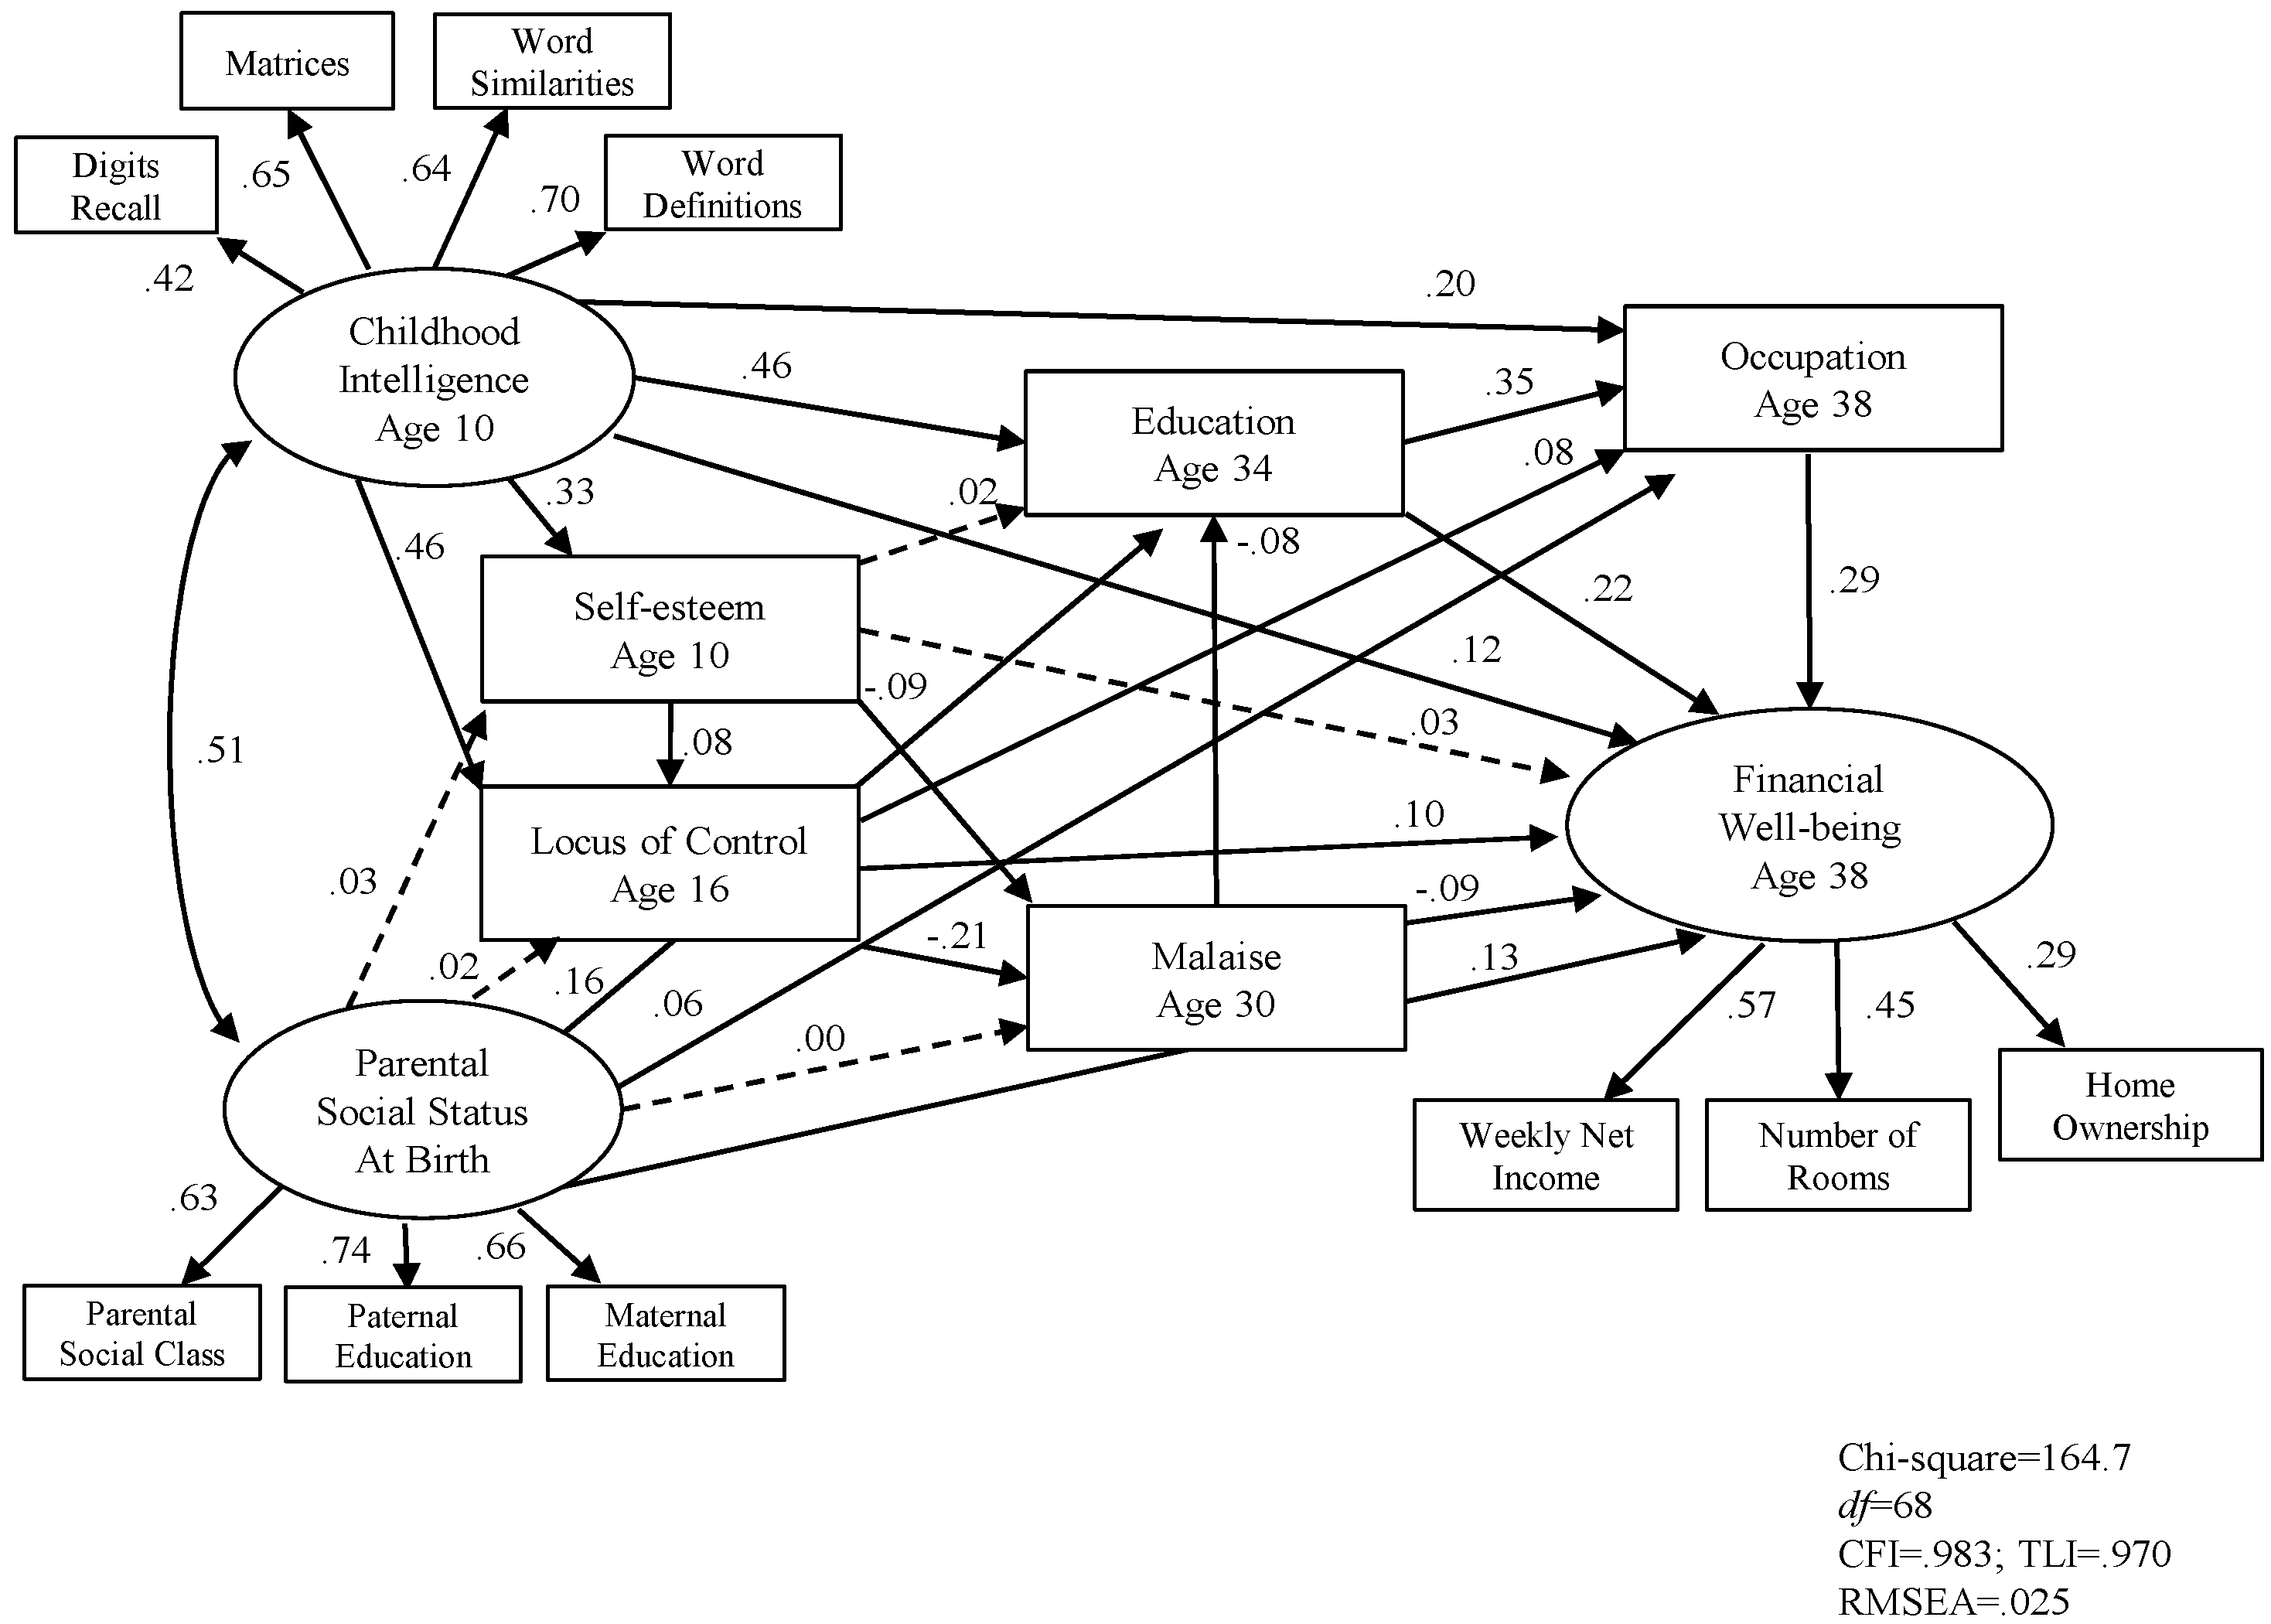
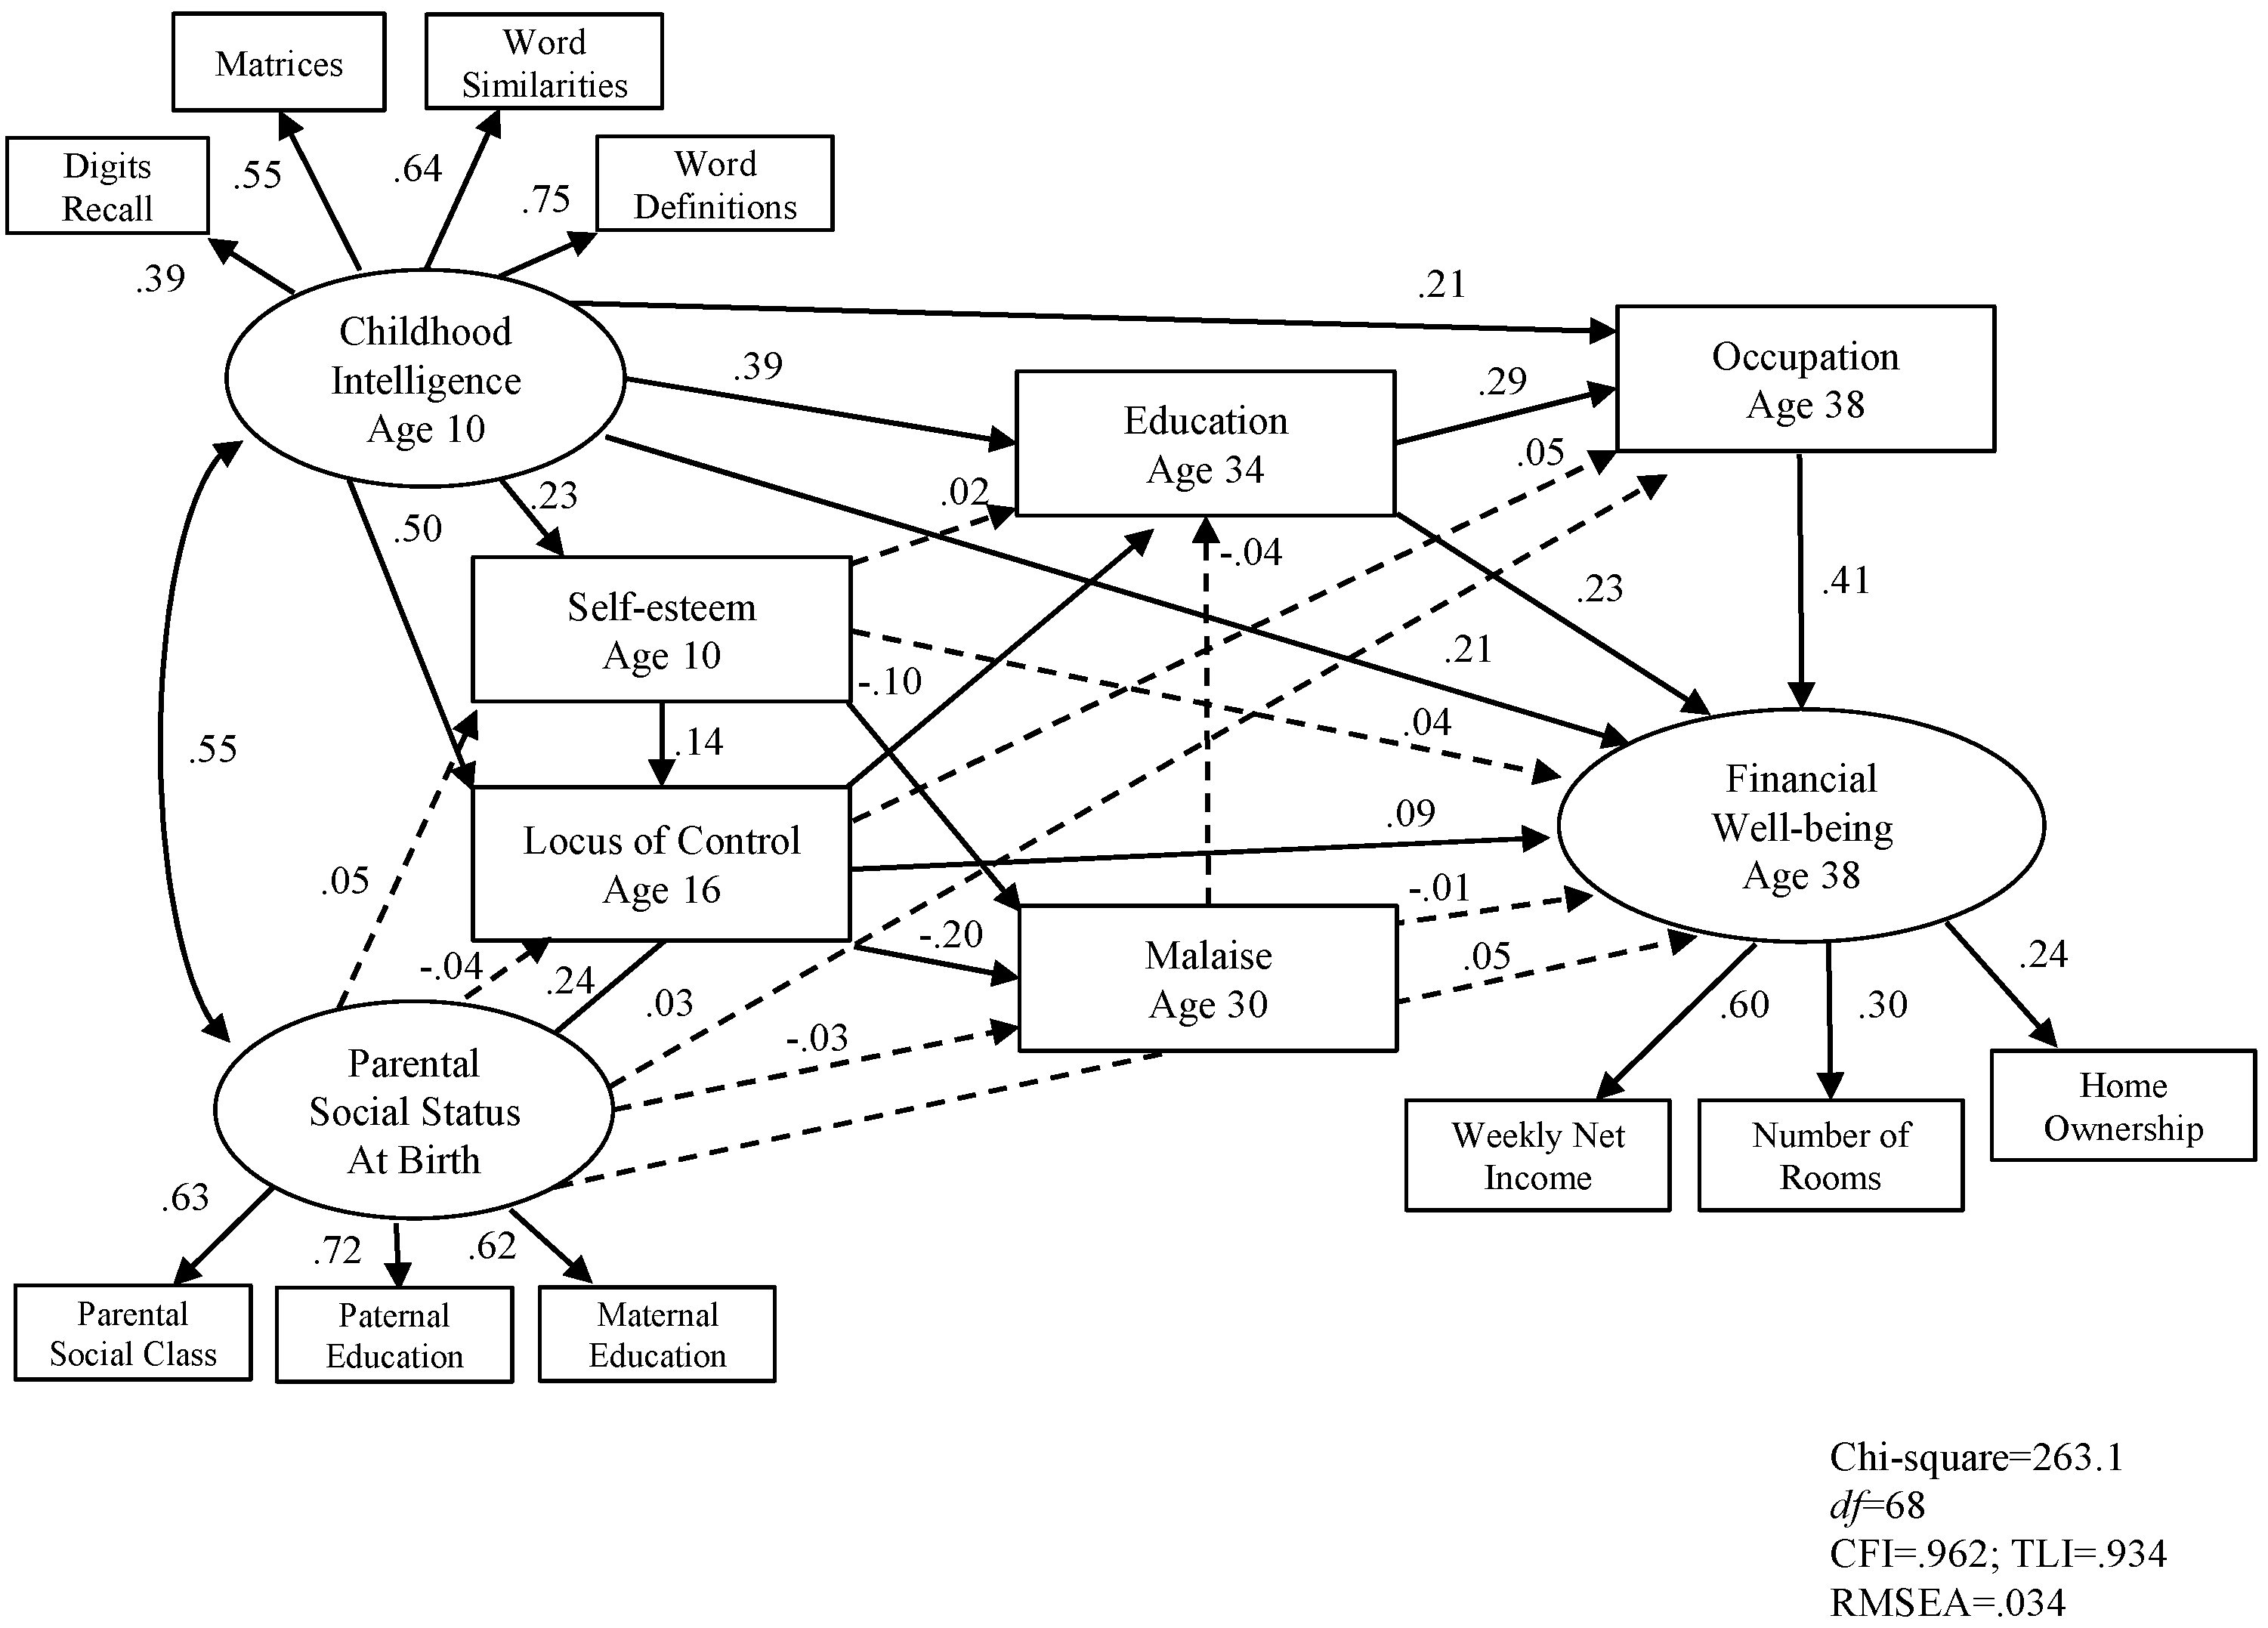
- Childhood Intelligence was assessed at age 10 in school using assessed in school, using a modified version of the British Ability Scales (BAS) which can serve as a measure for childhood IQ. The assessment involved the administration of four sub-scales: word definitions and word similarities which were used to measure verbal ability, and recall of digits and matrices which were used to measure non-verbal ability. The alpha for the four measures combined into a total scale was .92.
- (3)
- (4)
- Locus of Control was measured at age 16. Cohort members completed a 19-item Locus of Control Scale (Yes/No) [34]. The alpha was .72.
- (5)
- Malaise Inventory is a 24-item self-completion instrument, measuring depression, anxiety and psychosomatic illness [35] and it correlates significantly with previously diagnosed and currently treated depression. The alpha was .81.
- (6)
- Educational Qualifications was assessed at age 34, participants were asked about their highest academic or vocational qualifications. Responses are coded to the six-point scale of National Vocational Qualifications levels (NVQ) which ranges from ‘none’ to ‘university degree/higher’/equivalent NVQ 5 or 6.
- (7)
- Occupational Prestige was measured at age 38. Current or last occupation held by cohort members were coded according to the Registrar General’s Classification of Occupations (RGSC), described above, using a 6-point classification mentioned above.
- (8)
- Adult Financial Well-being is a latent variable indicated by weekly income, house ownership status, and living space (number of rooms) measured at age 38. Participants were asked about their current net payment per week (incomes were logged in the following analyses), number of rooms; and their house ownership status (1 = Live rent-free, 2 = Rent it, 3 = Buying with help of mortgage, 4 = Outright own).
3. Results
3.1. Descriptive Analysis
3.2. Correlational Analysis
3.3. Structural Equation Modelling
3.4. Model Fit
4. Discussion
Acknowledgments
Author Contributions
Conflicts of Interest
References
- Breen, R. Educational Expansion and Social Mobility in the 20th Century. Soc. Forces 2010, 89, 365–388. [Google Scholar] [CrossRef]
- Duncan, O.D.; Featherman, D.L.; Duncan, B. Socioeconomic Background and Achievement; Seminar Press: New York, NY, USA, 1972. [Google Scholar]
- Deary, I.J.; Taylor, M.D.; Hart, C.L.; Wilson, V.; Smith, D.G.; Blane, D.; Starr, J.M. Intergenerational mobility and mid-life status attainment: Influences of childhood intelligence, childhood social factors, and education. Intelligence 2005, 33, 455–472. [Google Scholar] [CrossRef]
- Erikson, R.; Goldthorpe, J.H. Has social mobility in Britain decreased? Reconciling divergent findings on income and class mobility. Br. J. Sociol. 2010, 61, 211–230. [Google Scholar] [CrossRef] [PubMed]
- Furnham, A. The New Psychology of Money; Routledge: London, UK, 2014. [Google Scholar]
- Geyer, S.; Hemstrom, O.; Peter, R.; Vagero, D. Education, income and occupational class cannot be used interchangeably in social epidemiology. J. Epidemiol. Commun. Health 2006, 60, 804–810. [Google Scholar] [CrossRef] [PubMed]
- Haveman, R.; Smeeding, T. The role of higher education in social mobility. Future Child. 2006, 16, 125–150. [Google Scholar] [CrossRef]
- Heath, A. Social Mobility; Fontana: Glasgow, UK, 1981. [Google Scholar]
- Kiker, B.; Condon, C. The influence of socioeconomic background on the earnings of young men. Hum. Relat. 1981, 16, 94–105. [Google Scholar] [CrossRef]
- Spinath, B.; Spinath, F.M.; Harlaar, N.; Plomin, R. Predicting school achievement from general cognitive ability, self-perceived ability, and intrinsic value. Intelligence 2006, 34, 363–374. [Google Scholar] [CrossRef]
- Tong, S.; Baghurst, P.; Vimpani, G.; McMichael, A. Socioeconomic position, maternal IQ, home environment, and cognitive development. J. Paediatr. 2007, 151, 284–288. [Google Scholar] [CrossRef] [PubMed]
- Von Stumm, S.; Macintyre, S.; Batty, D.; Clark, H.; Deary, I. Intelligence, social class of origin, childhood behaviour disturbance and education as predictors of status attainment in midlife in men. Intelligence 2010, 38, 202–211. [Google Scholar] [CrossRef]
- Feinstein, L.; Bynner, J. The importance of cognitive development in middle childhood for adulthood socioeconomic status, mental health, and problem behaviour. Child Dev. 2004, 75, 1329–1339. [Google Scholar] [CrossRef] [PubMed]
- Zagorsky, J. Do you have to be smart to be rich? The impact of IQ on wealth, income and financial distress. Intelligence 2007, 35, 489–501. [Google Scholar] [CrossRef]
- Conell-Price, L.; Jamison, J. Predicting health behaviours with economic preferences and locus of control. J. Behav. Exp. Econ. 2015, 54, 1–9. [Google Scholar] [CrossRef]
- Plunkett, H.; Buehner, M. The relation of general and specific locus of control to intertemporal monetary choice. Personal. Sci. Individ. Differ. 2007, 42, 1233–1242. [Google Scholar] [CrossRef]
- Von Stumm, S.; Gale, C.; Batty, G.; Deary, I. Childhood intelligence, locus of control and behaviour disturbance as determinants of intergenerational social mobility. Intelligence 2009, 37, 329–340. [Google Scholar] [CrossRef]
- Furnham, A.; Cheng, H. The stability and change of malaise scores over 27 years: Findings from a nationally representative sample. Personal. Sci. Individ. Differ. 2015, 79, 30–34. [Google Scholar] [CrossRef]
- Lim, V.; Teo, T.; Loo, G. Sex, financial hardship and locus of control. Personal. Sci. Individ. Differ. 2003, 34, 411–429. [Google Scholar] [CrossRef]
- Duckworth, A.L.; Weir, D.; Tsukayama, E.; Kwok, D. Who does well in life? Conscientious adults excel in both objective and subjective success. Front. Personal. Sci. Individ. Differ. 2012, 3, 1–8. [Google Scholar] [CrossRef] [PubMed]
- Gelissen, J.; de Graaf, P. Personality, social background, and occupational career success. Soc. Sci. Res. 2006, 35, 702–726. [Google Scholar] [CrossRef]
- Office for National Statistics (ONS). Patterns of Pay: Estimates from the Annual Survey of Hours and Earnings, UK, 1997 to 2013; ASHE Results Release; Office for National Statistics: London, UK, 2014. [Google Scholar]
- Haberfeld, Y. Pay, valence of pay and gender. J. Econ. Psychol. 1992, 13, 93–109. [Google Scholar] [CrossRef]
- Judge, T.; Cable, D. When it comes to pay, do the thin win? The effect of weight on pay for men and women. J. Appl. Psychol. 2011, 96, 95–112. [Google Scholar] [CrossRef] [PubMed]
- Judge, T.; Livingstone, B. Is the gap more than gender? A Longitudinal analysis of gender, gender role orientation, and earnings. J. Appl. Psychol. 2008, 93, 994–1012. [Google Scholar] [CrossRef] [PubMed]
- Semykina, A.; Linz, S.J. Gender differences in personality and earnings: Evidence from Russia. J. Econ. Psychol. 2007, 28, 387–410. [Google Scholar] [CrossRef]
- Ashby, J.S.; Schoon, I. Career success: The role of teenage career aspirations, ambition value and gender in predicting adult social status and earnings. J. Vocat. Behav. 2010, 77, 350–360. [Google Scholar] [CrossRef]
- Elliott, J.; Shepherd, P. Cohort profile of the 1970 British Birth Cohort (BCS70). Int. J. Epidemiol. 2006, 35, 836–843. [Google Scholar] [CrossRef] [PubMed]
- Plewis, I.; Calderwood, L.; Hawkes, D.; Nathan, G. National Child Development Study and 1970 British Cohort Study; Technical Report: Changes in the NCDS and BCS70 populations and samples over time; Centre for Longitudinal Studies, Institute of Education: London, UK, 2004. [Google Scholar]
- Marsh, C. Social class and occupation. In Key Variables in Social Investigation; Burgess, R., Ed.; Routledge: London, UK, 1986. [Google Scholar]
- Leete, R.; Fox, J. ‘Registrar General’s social classes: Origins and users. Popul. Trends 1977, 8, 1–7. [Google Scholar]
- Lawrence, D. Improved Reading through Counselling; Ward Lock Educational: London, UK, 1973. [Google Scholar]
- Lawrence, D. Counselling Students with Reading Difficulties. Good Reading Magazine, 30 June 1978. [Google Scholar]
- Gammage, P. Socialisation, Schooling and Locus of Control. Ph.D. Thesis, University of Bristol, Bristol, UK, 1975. [Google Scholar]
- Rutter, M.; Tizard, J.; Whitmore, K. Education, Health and Behaviour; Longman: London, UK, 1970. [Google Scholar]
- Arbuckle, J.L. IBM Amos 22 User’s Guide; Amos Development Corporation: Spring House, PA, USA, 2013. [Google Scholar]
- Arbuckle, J.L. Full information estimation in the presence of incomplete data. In Advanced Structural Equation Modeling; Marcoulides, G.A., Schumacker, R.E., Eds.; Lawrence Erlbaum Associates, Inc.: Mahwah, NJ, USA, 1996; pp. 243–277. [Google Scholar]
- Bentler, P.M. Comparative fit indexes in structural models. Psychol. Bull. 1990, 107, 238–246. [Google Scholar] [CrossRef] [PubMed]
- Bollen, K.A.; Bauldry, S. Three Cs in Measurement Models: Causal Indicators, Composite Indicators, and Covariates. Psychol. Methods 2011, 16, 265–284. [Google Scholar] [CrossRef] [PubMed]


| Variables | Correlation | |||||||||||||||||
|---|---|---|---|---|---|---|---|---|---|---|---|---|---|---|---|---|---|---|
| Mean SD | 1 | 2 | 3 | 4 | 5 | 6 | 7 | 8 | 9 | 10 | 11 | 12 | 13 | 14 | 15 | 16 | ||
| 1. | Weekly net income | 402.5 (307.3) | – | |||||||||||||||
| 2. | Number of rooms | 5.06 (1.61) | .209 | – | ||||||||||||||
| 3. | House ownership | 2.93 (.56) | .116 | .203 | – | |||||||||||||
| 4. | Gender | .53 (.50) | −.366 | .003 | .003 | – | ||||||||||||
| 5. | Parental social class | 3.37 (1.20) | .158 | .057 | .159 | −.034 | – | |||||||||||
| 6. | Paternal education | 15.54 (1.15) | .147 | .051 | .110 | −.011 | .460 | – | ||||||||||
| 7. | Maternal education | 15.50 (1.05) | .132 | .046 | .119 | −.010 | .351 | .491 | – | |||||||||
| 8. | Word Definition scores | 11.05 (4.88) | .246 | .080 | .162 | −.133 | .296 | .257 | .262 | – | ||||||||
| 9. | Word Similarities scores | 28.80 (4.06) | .198 | .100 | .132 | −.109 | .269 | .226 | .218 | .624 | – | |||||||
| 10. | Digits recall scores | 22.78 (4.14) | .095 | .064 | .097 | .031 | .116 | .117 | .083 | .294 | .265 | – | ||||||
| 11. | Matrices scores | 16.50 (5.09) | .152 | .107 | .148 | .033 | .211 | .174 | .178 | .415 | .405 | .249 | – | |||||
| 12. | Self-esteem | 8.79 (2.60) | .134 | .101 | .080 | −.090 | .110 | .098 | .123 | .207 | .166 | .121 | .184 | – | ||||
| 13. | Locus of control | 14.39 (3.15) | .177 | .143 | .111 | −.012 | .165 | .143 | .134 | .320 | .283 | .166 | .259 | .216 | – | |||
| 14. | Malaise | 3.09 (3.05) | −.095 | −.093 | −.092 | .095 | −.066 | −.050 | −.066 | −.065 | −.061 | −.058 | −.100 | −.155 | −.210 | – | ||
| 15. | Educational qualifications | 2.68 (1.37) | .285 | .195 | .146 | .032 | .313 | .272 | .284 | .390 | .323 | .183 | .341 | .181 | .335 | −.127 | – | |
| 16. | Occupational levels | 4.21 (1.15) | .335 | .173 | .138 | −.032 | .210 | .190 | .182 | .287 | .245 | .169 | .253 | .146 | .223 | −.072 | .451 | – |
| Variables | Males | Females | ||||
|---|---|---|---|---|---|---|
| Unstandardized Estimate | Standard Error | Standardised Estimate | Unstandardized Estimate | Standard Error | Standardised Estimate | |
| Parental social status | ||||||
| RGSC | 1 | .633 | 1 | .625 | ||
| Father’s education | 1.153 | .053 *** | .762 | 1.117 | .053 *** | .715 |
| Mather’s education | .887 | .044 *** | .655 | .885 | .044 *** | .62 |
| Childhood Intelligence | ||||||
| Word Definition scores | 1 | .701 | 1 | .747 | ||
| Word Similarities scores | .734 | .028 *** | .64 | .735 | .030 *** | .635 |
| Digits recall scores | .496 | .034 *** | .416 | .455 | .033 *** | .389 |
| Matrices scores | .962 | .047 *** | .654 | .795 | .044 *** | .555 |
| Adult financial well-being | ||||||
| Weekly net income | 1 | .574 | 1 | .596 | ||
| Number of rooms | .004 | .001 *** | .448 | .003 | .001 *** | .296 |
| House ownership | .001 | .001 *** | .286 | .001 | .001 *** | .236 |
| Predicting adult financial well-being | ||||||
| Parental social status | 33.174 | 11.491 ** | .134 | 10.536 | 9.000 *** | .045 |
| Childhood Intelligence | 6.177 | 3.763 * | .116 | 8.707 | 3.530 * | .213 |
| Self-esteem | 2.676 | 2.702 | .034 | 1.906 | 1.818 | .036 |
| Locus of control | 6.092 | 3.617 * | .099 | 5.295 | 3.769 * | .085 |
| Malaise | −5.848 | 2.087 ** | −.091 | −.502 | 1.503 | −.011 |
| Educational qualifications | 29.605 | 5.638 *** | .217 | 23.965 | 3.930 *** | .228 |
| Occupational levels | 33.174 | 5.927 *** | .293 | 51.180 | 3.992 *** | .406 |
© 2017 by the authors. Licensee MDPI, Basel, Switzerland. This article is an open access article distributed under the terms and conditions of the Creative Commons Attribution (CC BY) license (http://creativecommons.org/licenses/by/4.0/).
Share and Cite
Furnham, A.; Cheng, H. Socio-Demographic Indicators, Intelligence, and Locus of Control as Predictors of Adult Financial Well-Being. J. Intell. 2017, 5, 11. https://doi.org/10.3390/jintelligence5020011
Furnham A, Cheng H. Socio-Demographic Indicators, Intelligence, and Locus of Control as Predictors of Adult Financial Well-Being. Journal of Intelligence. 2017; 5(2):11. https://doi.org/10.3390/jintelligence5020011
Chicago/Turabian StyleFurnham, Adrian, and Helen Cheng. 2017. "Socio-Demographic Indicators, Intelligence, and Locus of Control as Predictors of Adult Financial Well-Being" Journal of Intelligence 5, no. 2: 11. https://doi.org/10.3390/jintelligence5020011
APA StyleFurnham, A., & Cheng, H. (2017). Socio-Demographic Indicators, Intelligence, and Locus of Control as Predictors of Adult Financial Well-Being. Journal of Intelligence, 5(2), 11. https://doi.org/10.3390/jintelligence5020011


