Sex differences in intelligence are a perennial interest in human abilities research. The rise of hierarchical theories of intelligence, most notably the Cattell-Horn-Carroll model [
1]. have led to studies of sex differences at every level specificity. Sex differences research on general intelligence (
g), “broad” abilities including fluid intelligence (
Gf), as well as the more specific “narrow” abilities (including such things as verbal comprehension) have led to conflicting results in terms of the size and direction of differences [
2,
3,
4,
5]. The enduring controversy over sex differences has also led to a number of theories about why so many conflicting results are found.
Given that mean differences are for the most part trivial in size [
4,
5,
6], especially for general and many broad abilities, the observation of disproportionately large numbers of males in the right and left tail of the ability distribution has led to the variability hypothesis. This hypothesis holds that males exhibit greater variation than females in many cognitive ability domains, which may explain their overrepresentation in the tails of ability distributions and creates the appearance of mean differences in incomplete or selected samples [
7,
8]. Some researchers have proposed explanatory theories for greater variability (such as a bimodal distribution with an excessively large left tail caused by higher rates of birth defects in males [
8]), but descriptive analysis of variability differences is also critical when it comes to estimating the size of the effect to be explained [
9]. Importantly, the mere existence of variability differences, regardless of their cause, could explain differential representation of males and females at the extremes of the distributions of many cognitive traits.
Another important hypothesis in explaining variations in the results of sex differences studies is the masking hypothesis which holds that the method of extracting ability estimates influences the magnitude of differences observed [
10]. Specifically, the masking effect results from not partialling out the effects of general ability when estimating broad or specific ability factors. When the general (or higher-order) factor does not show sex differences, it washes out true differences in broad and specific abilities and underestimates those differences. Likewise, it can create differences in the higher-order factor that are really due to differences in the lower-order abilities that contribute to the estimation of the higher-order factor [
2,
4]. This hypothesis will be explored in more detail in a later section.
The focus on broad and, especially narrow abilities in addition to general intelligence is important because of the implications many feel that these abilities (and the sex differences they show) have for participation of men and women in various careers. In particular, there has been a strong interest in the specific/narrow abilities of quantitative reasoning, math and science aptitude, and mechanical reasoning because of their potential impact on highly valued science, technology, engineering, and mathematics (STEM) fields [
11,
12,
13].
Of course, differences in general ability are also of interest for a variety of reasons. While researchers have reached a degree of consensus on sex differences in some broad and specific abilities (e.g., consistent advantages for females in processing speed [Gs] [
14]; large differences favoring males in mechanical reasoning [
15]), the magnitude of differences in general intelligence (
g) still sparks significant debate and conflicting results. In estimating sex differences in
g, the choice of tests in a battery, the age and selection of the sample, and the methods used to analyze the data all appear to impact results [
3,
16]. What researchers can agree on is that conflating
g with broad abilities confuses the discussion of sex differences in both areas of research [
2,
3,
10]. Therefore, choice of methodology to describe differences in
g and broad abilities is important for the estimation of sex differences in both means and variances [
3,
4,
5].
1.1. Competing Hypotheses and Impact of Methodology
In the effort to uncover the nature of sex differences, research has repeatedly shown that methodology matters. In their review of the literature and empirical findings, Steinmayr
et al. [
3] found that restricted sampling [
16], selection of tests, and, in particular, the statistical methods used to analyze the constructs of interest can impact the research results.
From studies comparing various measurement models (manifest variables, latent bifactor models, latent hierarchical models,
etc.), researchers have put forward the
masking hypothesis [
10]. The masking hypothesis concerns whether sex differences arise from broad abilities (used to estimate general ability) or from general ability itself. In some cases, analyses showed that broad ability differences were independent of
g. In particular, Johnson and Bouchard [
10] found that small or nonexistent differences in
g washed out substantial sex differences in broad abilities when the two constructs were comingled. As a result, they found that many of the specific ability tests showed larger mean sex differences with
g variance partialled out than in the manifest scores with
g variance included. Their conclusion was that large mean differences in broad abilities were not related to differences in g and that, overall, there was a non-significant difference in
g. Brunner, Krauss, and Kunter [
17] argued for a similar approach to studying sex differences in mathematics achievement, where they found substantial sex differences in mathematical ability once the influence of a general factor was partialled out.
Although Johnson and Bouchard’s and Brunner
et al.’s findings are compelling, other research has not confirmed this finding. Specifically, Lemos
et al. [
15] found the opposite trend in their study, showing that the mean differences they detected in subtest scores on a reasoning battery were entirely explained by differences in
g (differences around 2–4 points favoring males), with the exception of mechanical reasoning which showed large mean differences and numerical reasoning which showed small differences, both independent of differences in
g. A key limitation of their study was that their battery consisted of only five subtests (compared to much larger and varied batteries in Johnson & Bouchard), and, furthermore, that one of these subtests was mechanical reasoning, one of the few reasoning domains to show very large male advantages, which may have skewed their general factor to favor males.
Importantly, although little research has addressed the masking hypothesis with respect to the variability hypothesis, Brunner
et al. [
9] showed in their study of achievement that masking
can occur with variability differences and thus warrants study with ability test batteries. In their study, partialling out general achievement from specific mathematics and reading achievement showed that although general achievement and manifest mathematics achievement demonstrated substantial variability differences (Variance Ratio [VR] = 1.23 and 1.18, respectively, where a VR of 1.23 indicates that the males are 23% more variable than females), specific mathematics achievement did not show differences in variability once general achievement was partialled out (M-g). (Note that a variance ratio (calculated as the ratio of male variance to female variance) greater than 1.0 indicates that males were more variable than females. Feingold [
18] suggested that a variance ratio of 1.10 or greater would be of practical importance on these types of tests.) This finding was replicated for the other achievement domains they observed (reading, science, and problem solving)—greater male variability was
only observed for general achievement and not broad abilities when a nested latent model was used. In contrast, manifest variables for these other domains (with
g and broad ability confounded) all showed substantially greater male variability.
1.2. Previous Research on Manifest and Latent Differences in Means and Variability
Given the volume of literature on the magnitude of sex differences in
g and broad abilities [
11,
12], a general review is not given here. In this review, we focus on studies using large representative samples, broad assessment batteries, and preferably reporting manifest and latent estimates of sex differences in both means and variances in
g and broad abilities.
A small number of studies have compared sex differences in latent and manifest models and found mixed results as to the impact of model selection (latent vs. manifest) on the size and nature of mean differences observed. Very few studies have compared the effects of latent versus manifest models on estimates of variance differences.
Irwing [
19] studied an adult population (age 16–89) using the WAIS-III norm sample. Two latent models were applied and the results indicated that both the hierarchical and bifactor multi-group confirmatory factor analyses (MG-CFA) yielded comparable mean estimates. The manifest and latent estimates of mean differences in
g were also similar (
d = 0.18 and
d = 0.22, respectively). See
Table 1. Irwing only touched on the variability hypothesis in his discussion, but, in fact, his data shows interesting differences in the estimates of variance ratios from manifest to latent factors. The manifest variables show variability differences in
g (VR = 0.86, surprisingly showing greater variability for
females) while the latent
g shows effectively no difference in variability (VR = 1.04). For the broad factors measured by WAIS-III, effects varied. Verbal Comprehension and Perceptual Organization were not much affected (VR around 1.0 for VC and 1.1 for PO), but Working Memory and Processing Speed demonstrated larger difference in the latent model than the manifest variables (VR 1.39
vs. 1.01, respectively, for WM; 0.65
vs. 0.88 for PS). In sum, latent models in some cases increased the size of VR estimates while other cases decreased the VR estimates. Irwing used his results to argue that the common observation of greater male variability is an artifact of manifest variables and that latent models will not show variability differences, but the surprising observation of greater
female variance in his manifest variables calls into question the original data and whether there is something unusual about the battery of tests or the sample that reverses the typical observation of greater male variability.
Table 1.
Compilation of Irwing’s findings from WAIS-III.
Table 1.
Compilation of Irwing’s findings from WAIS-III.
| Scale | Cohen’s d Effect Size | VR |
|---|
| Manifest | Latent (Bifactor) | Manifest | Latent (Bifactor) |
|---|
| Full-Scale IQ (g) | 0.18 | 0.22 | 86% | 104% |
| Verbal Comprehension | 0.23 | NR | 99% | 103% |
| Perceptual Organization | 0.22 | NR | 110% | 114% |
| Working Memory | 0.24 | NR | 101% | 139% |
| Processing Speed | −0.31 | −1.30 | 88% | 65% |
Despite Irwing’s contention, variability differences have been found to persist in latent models. For example, Keith
et al. [
20] (2008) estimated the variance ratio for
g to be 1.18 from the WJ-III norm sample (ages 2–90). In a separate study of the DAS norms sample (ages 2–17), Keith
et al. [
14] estimated the variance ratio for latent
g to be 1.10, indicating that boys were 10% more variable than girls. See
Table 2. Their estimate of the variance ratio for the latent
Gf (1.55) was substantial. Both Keith
et al. studies had large samples and lend strong evidence that variability differences are not solely an artifact of manifest variable models.
Table 2.
Results from Keith
et al. [
20] (WJ-III, ages 6–59) and Keith
et al. [
14] (DAS (2nd ed.), ages 5–17).
Table 2.
Results from Keith et al. [20] (WJ-III, ages 6–59) and Keith et al. [14] (DAS (2nd ed.), ages 5–17).
| | WJ-III | DAS (2nd. ed.) |
|---|
| d a | VR b | d a | VR c |
|---|
| Manifest | Latent | Manifest | Latent | Latent | Latent |
|---|
| g | NA | 0.08 | NA | 1.18 | 0.03 d | 1.10 |
| Gf | −0.03 | −0.35 ** | 1.20 | NR | 0.00 d | 1.55 |
| Gc | 0.08 | −0.14 ** | 1.11 | NR | −0.12 d | 1.05 |
| RQ | 0.14 | −0.21 ** | 1.17 | NR | -- | -- |
| Gv | 0.00 | −0.24 | 1.05 | NR | −0.12 | 1.20 |
| Gs | −0.29 | 0.40 ** | 1.03 | NR | 0.11* | 1.20 |
| Glr | 0.08 | NR | 1.05 | NR | 0.15 | 1.10 |
| Ga | 0.03 | −0.13 | 1.09 | NR | -- | -- |
| Gsm | −0.06 | −0.09 | 1.16 | NR | 0.04 | 0.85 |
In their study of general achievement, Brunner
et al. [
9] also showed important (though mixed) differences between manifest achievement variables and those from a nested latent model. See
Table 3. Specifically, mean differences in mathematics achievement grew when a latent model was applied (from
d = .10 to .21), though reading achievement stayed about the same (
d = -.36 to -.39). The general achievement factor showed near-zero mean differences, but substantially greater male variability (VR = 1.23), consistent with many studies of ability distributions. Brunner
et al. did not report variance information for most of their latent variables, but their Mathematics Achievement factor did show diminished variance effect (VR = 1.19 in manifest and 1.02 in latent models).
Table 3.
Brunner et al.’s PISA achievement results.
Table 3.
Brunner et al.’s PISA achievement results.
| | d a | VR b |
|---|
| | manifest | Latent | manifest | latent |
|---|
| General achievement | NA | 0.01 | NA | 1.23 |
| Mathematics achievement | 0.10 | 0.21 | 1.19 | 1.02 |
| Reading achievement | −0.36 | −0.39 | 1.22 | NR |
| Science achievement | 0.05 | NR | 1.16 | NR |
| Problem solving | −0.01 | NR | 1.18 | NR |
Steinmayr
et al. [
3] analyzed a relatively small (N = 977) sample of students age 16–18 to compare the impact of model selection on sex differences. The assessment battery was the I-S-T 2000 R, which consists of nine reasoning tasks and a knowledge test. Because of their relatively small and nonrepresentative sample (coming from a university-track school), the exact estimates of differences themselves are not compelling. However, the differences between the manifest and latent estimates are of interest. Specifically, mean differences for the three broad abilities were smaller (reversing sign for verbal) in the latent model compared to the manifest estimates. See
Table 4. The method of estimating the models did not meaningfully affect the VR estimates, which remained considerable (
i.e., greater than 1.10) for several of the factors.
Table 4.
Compilation of Steinmayr et al.’s findings from I-S-T 2000 R.
Table 4.
Compilation of Steinmayr et al.’s findings from I-S-T 2000 R.
| d | VR |
|---|
| Manifest | Latent | Manifest | Latent |
|---|
| V | −0.43 | 0.23 | 0.96 | 1.11 |
| N | −0.81 | −0.49 | 1.12 | 1.06 |
| F | −0.50 | −0.19 | 1.12 | 1.13 |
| Gf | −0.62 | −0.62 | 0.99 | 1.09 |
| Gc | −0.78 | −0.77 | 1.22 | 1.29 |
These findings indicate that there is reason to believe that greater male variability can persist in latent models, and is not an artifact of manifest variables. Thus, the latent model evidence does not contradict the variability hypothesis for
g and other broad abilities, despite Irwing’s [
19] contention. Clearly, however, the magnitude of those differences can vary, depending on the sample under study and the construct considered.
1.3. The Current Study
The Cognitive Abilities Test (CogAT) [
21,
22] is a battery of reasoning tasks measuring verbal, quantitative, and figural reasoning abilities for students in grades K-12 in the United States. Previous research on the CogAT [
23,
24] used observed (manifest) scores, which is appropriate when the goal is to inform practical uses of assessment results. In this study, our aim is to extend this analysis using latent models to probe sex differences at the construct level.
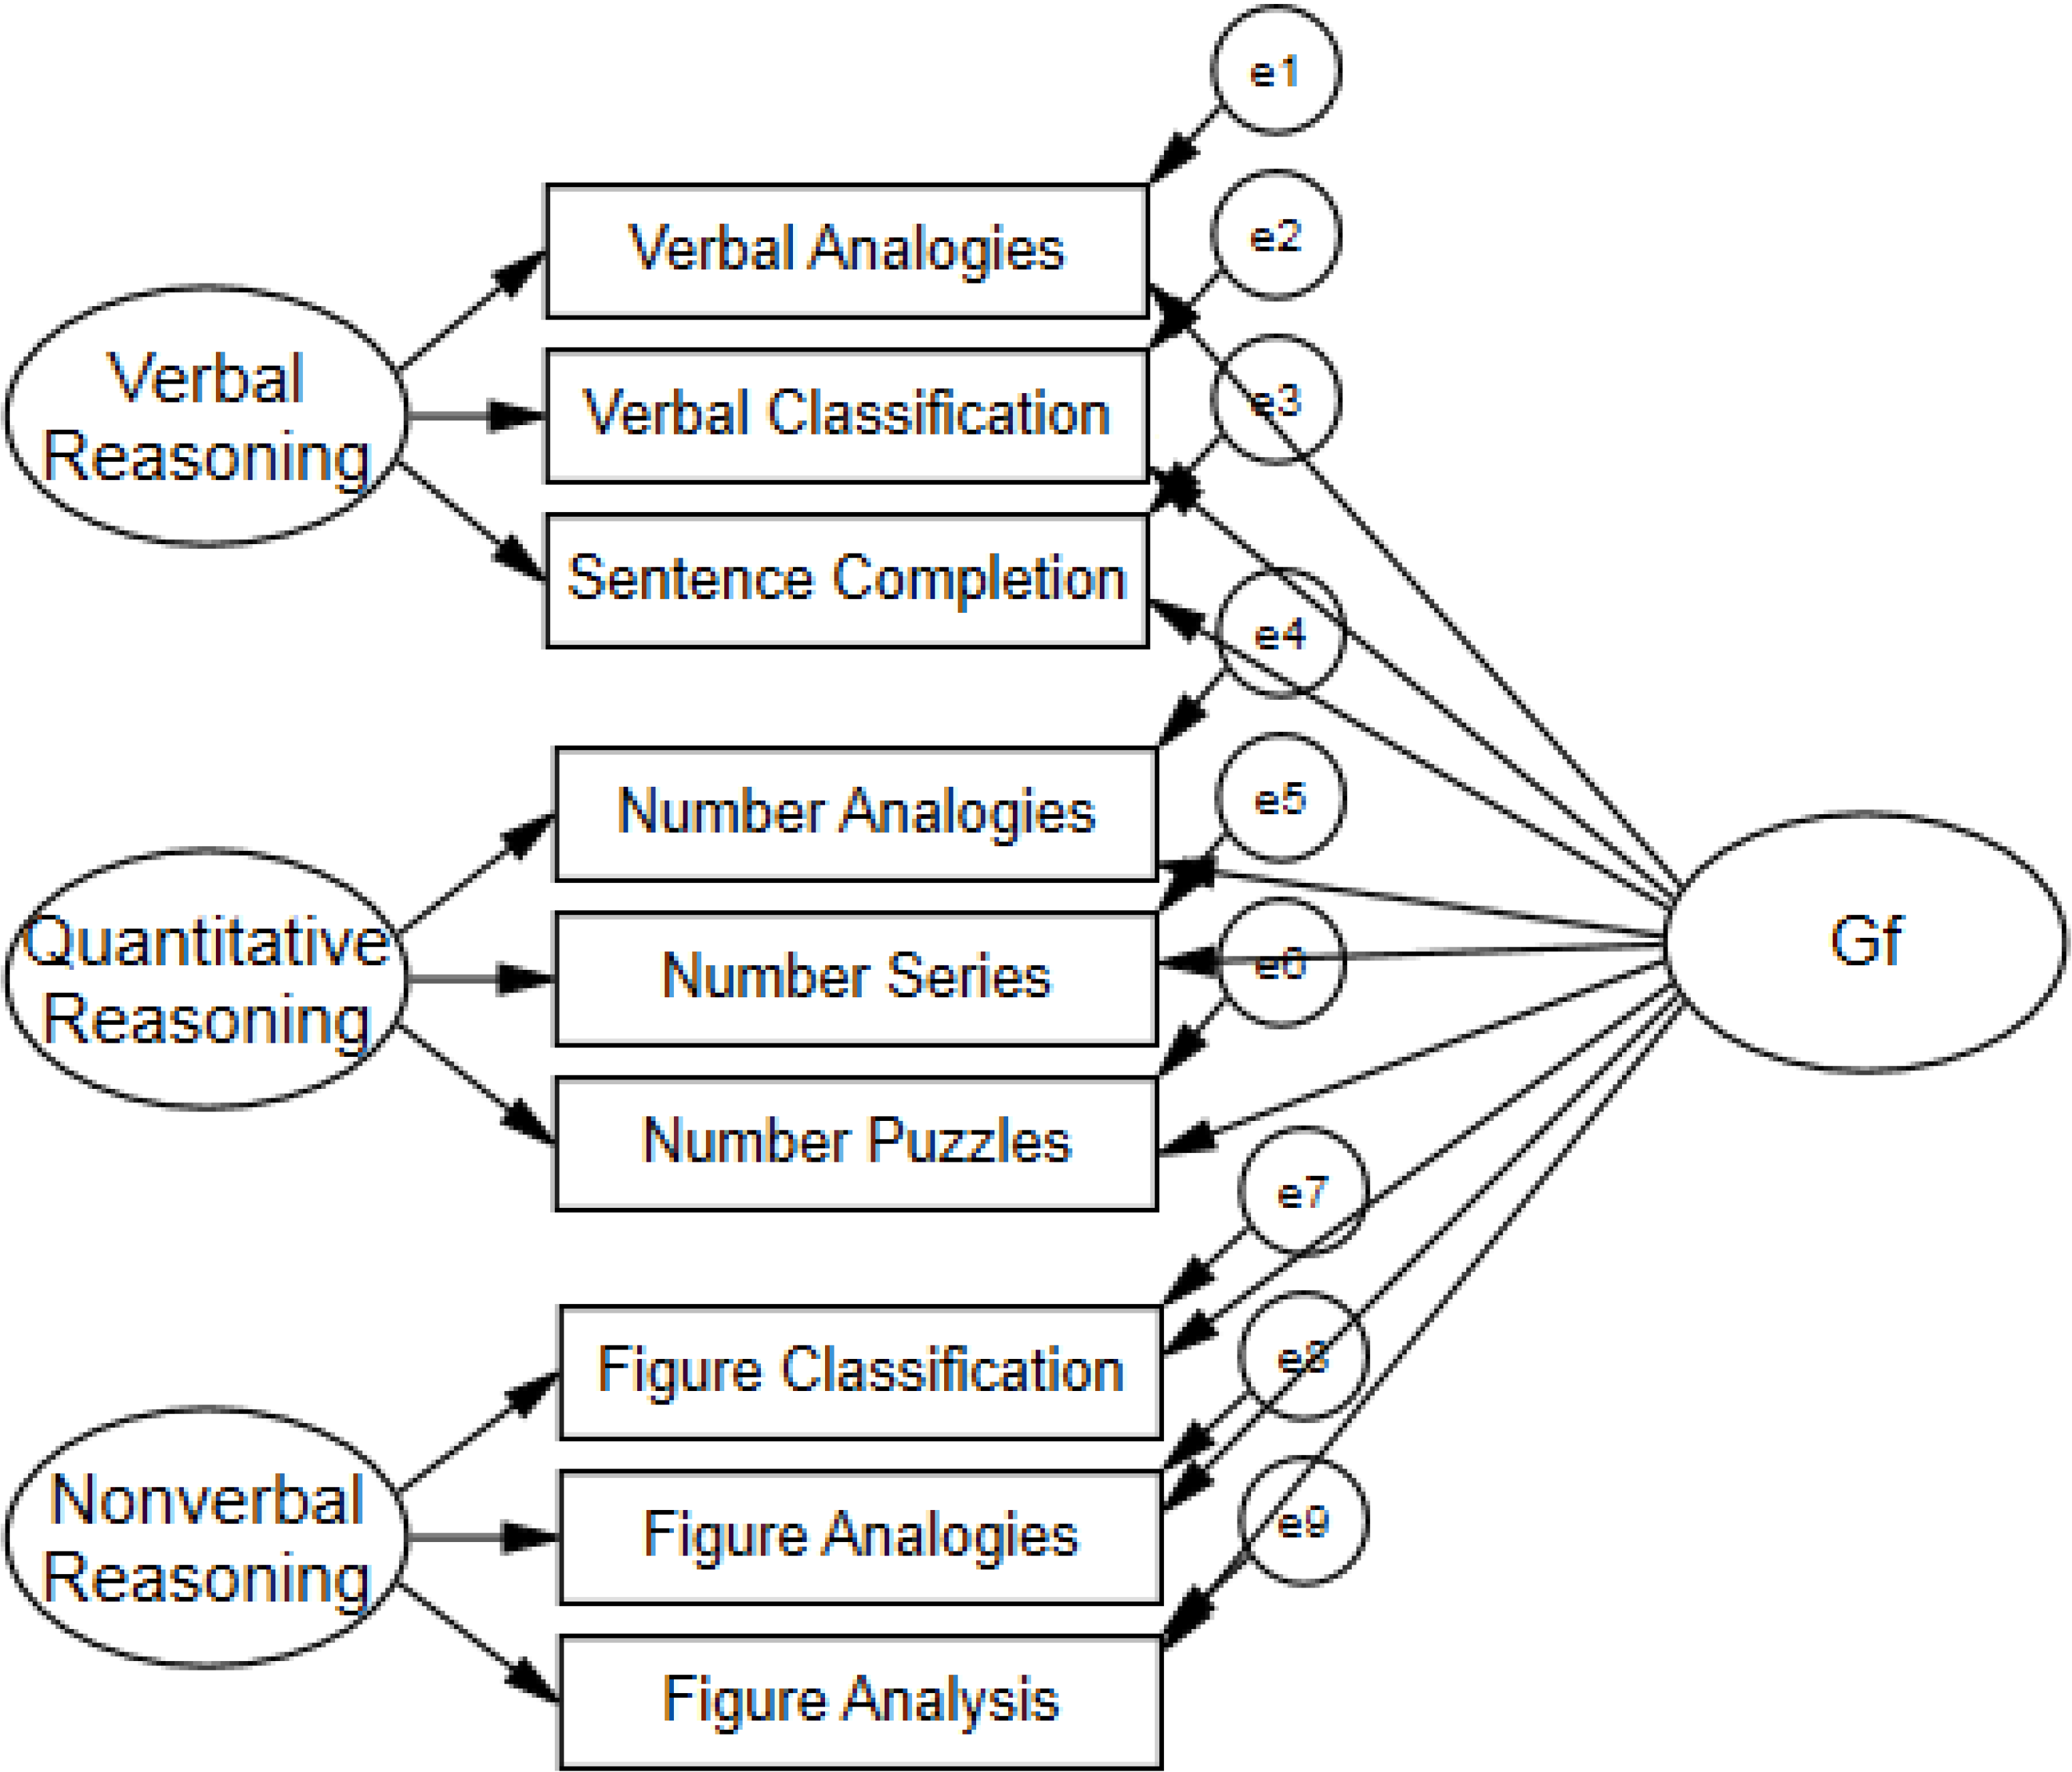
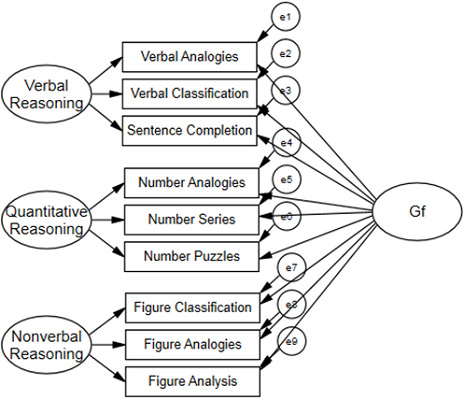
In this study, we considered
Gf, three narrow abilities subsumed under
Gf, and residual narrow abilities (with the general factor partialled out of the variance). Analyses were conducted on the norms samples from Form 6 and 7 of the CogAT. Previous work on the CogAT has not explored the general factor from the batteries or latent variables, but has addressed mean and variability differences in manifest variables representing the three reasoning batteries—Verbal, Quantitative, and Nonverbal (figural) Batteries—as measured in four cohorts between 1984 and 2011. Consistent with work on other batteries, the Nonverbal (figural) Battery showed negligible differences across test forms while the Quantitative Battery showed slight male advantages (0.05 to 0.15 across forms) and the Verbal Battery showed slight female advantages (−0.11 to −0.04). Variance ratios showed consistent advantages for males, with quantitative showing the largest differences (VR = 1.21 to 1.53). The greater differences in means and variance for quantitative reasoning is consistent with previous work [
17,
20], but differences for all three batteries were considerable (
i.e., greater than 1.10).
Data from the CogAT is relevant to this discussion because the test represents a balanced measure of fluid intelligence under Carroll’s definition [
25], which includes inductive, quantitative, and sequential reasoning components. The data is also informative because sampling is intentionally representative of the school-going population in the U.S., with large samples ranging across the 5–18 age group.


