
Wavelet Power Spectral Domain Functional Principal Component Analysis for Feature Extraction of Epileptic EEGs


Abstract
:1. Introduction
2. Methods
2.1. Wavelet Power Spectra
2.1.1. Continuous Wavelet Transform
2.1.2. Discrete Wavelet Transform
2.2. Principal Component Analysis
2.3. Functional Principal Component Analysis
Feature Extraction by Functional Principal Component Analysis
2.4. Discussion
3. Results
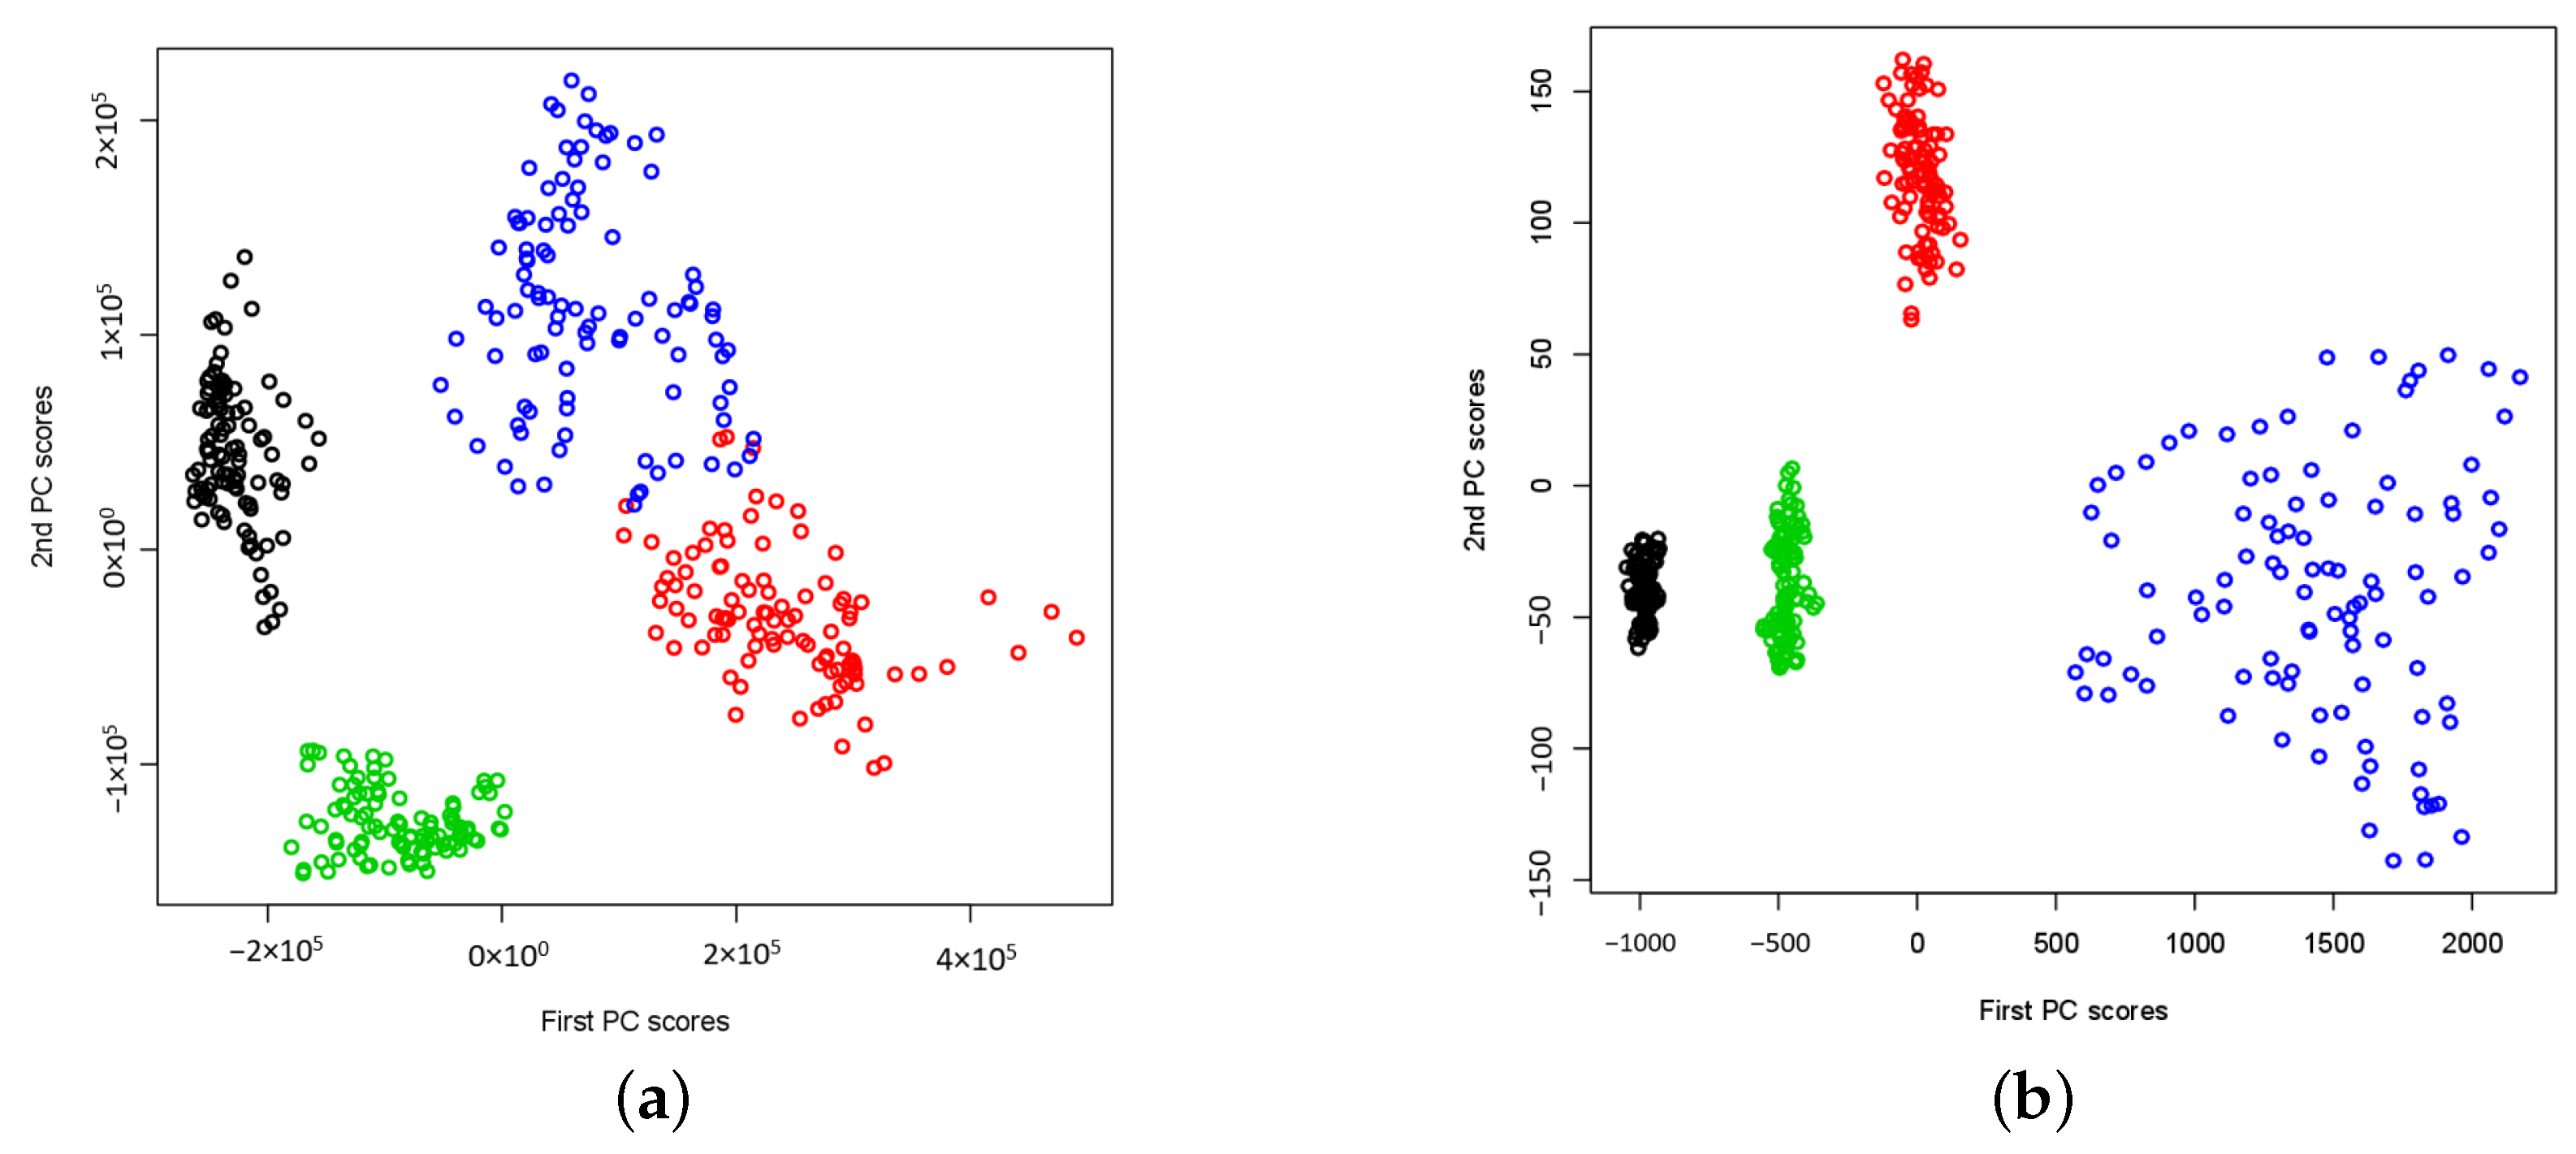
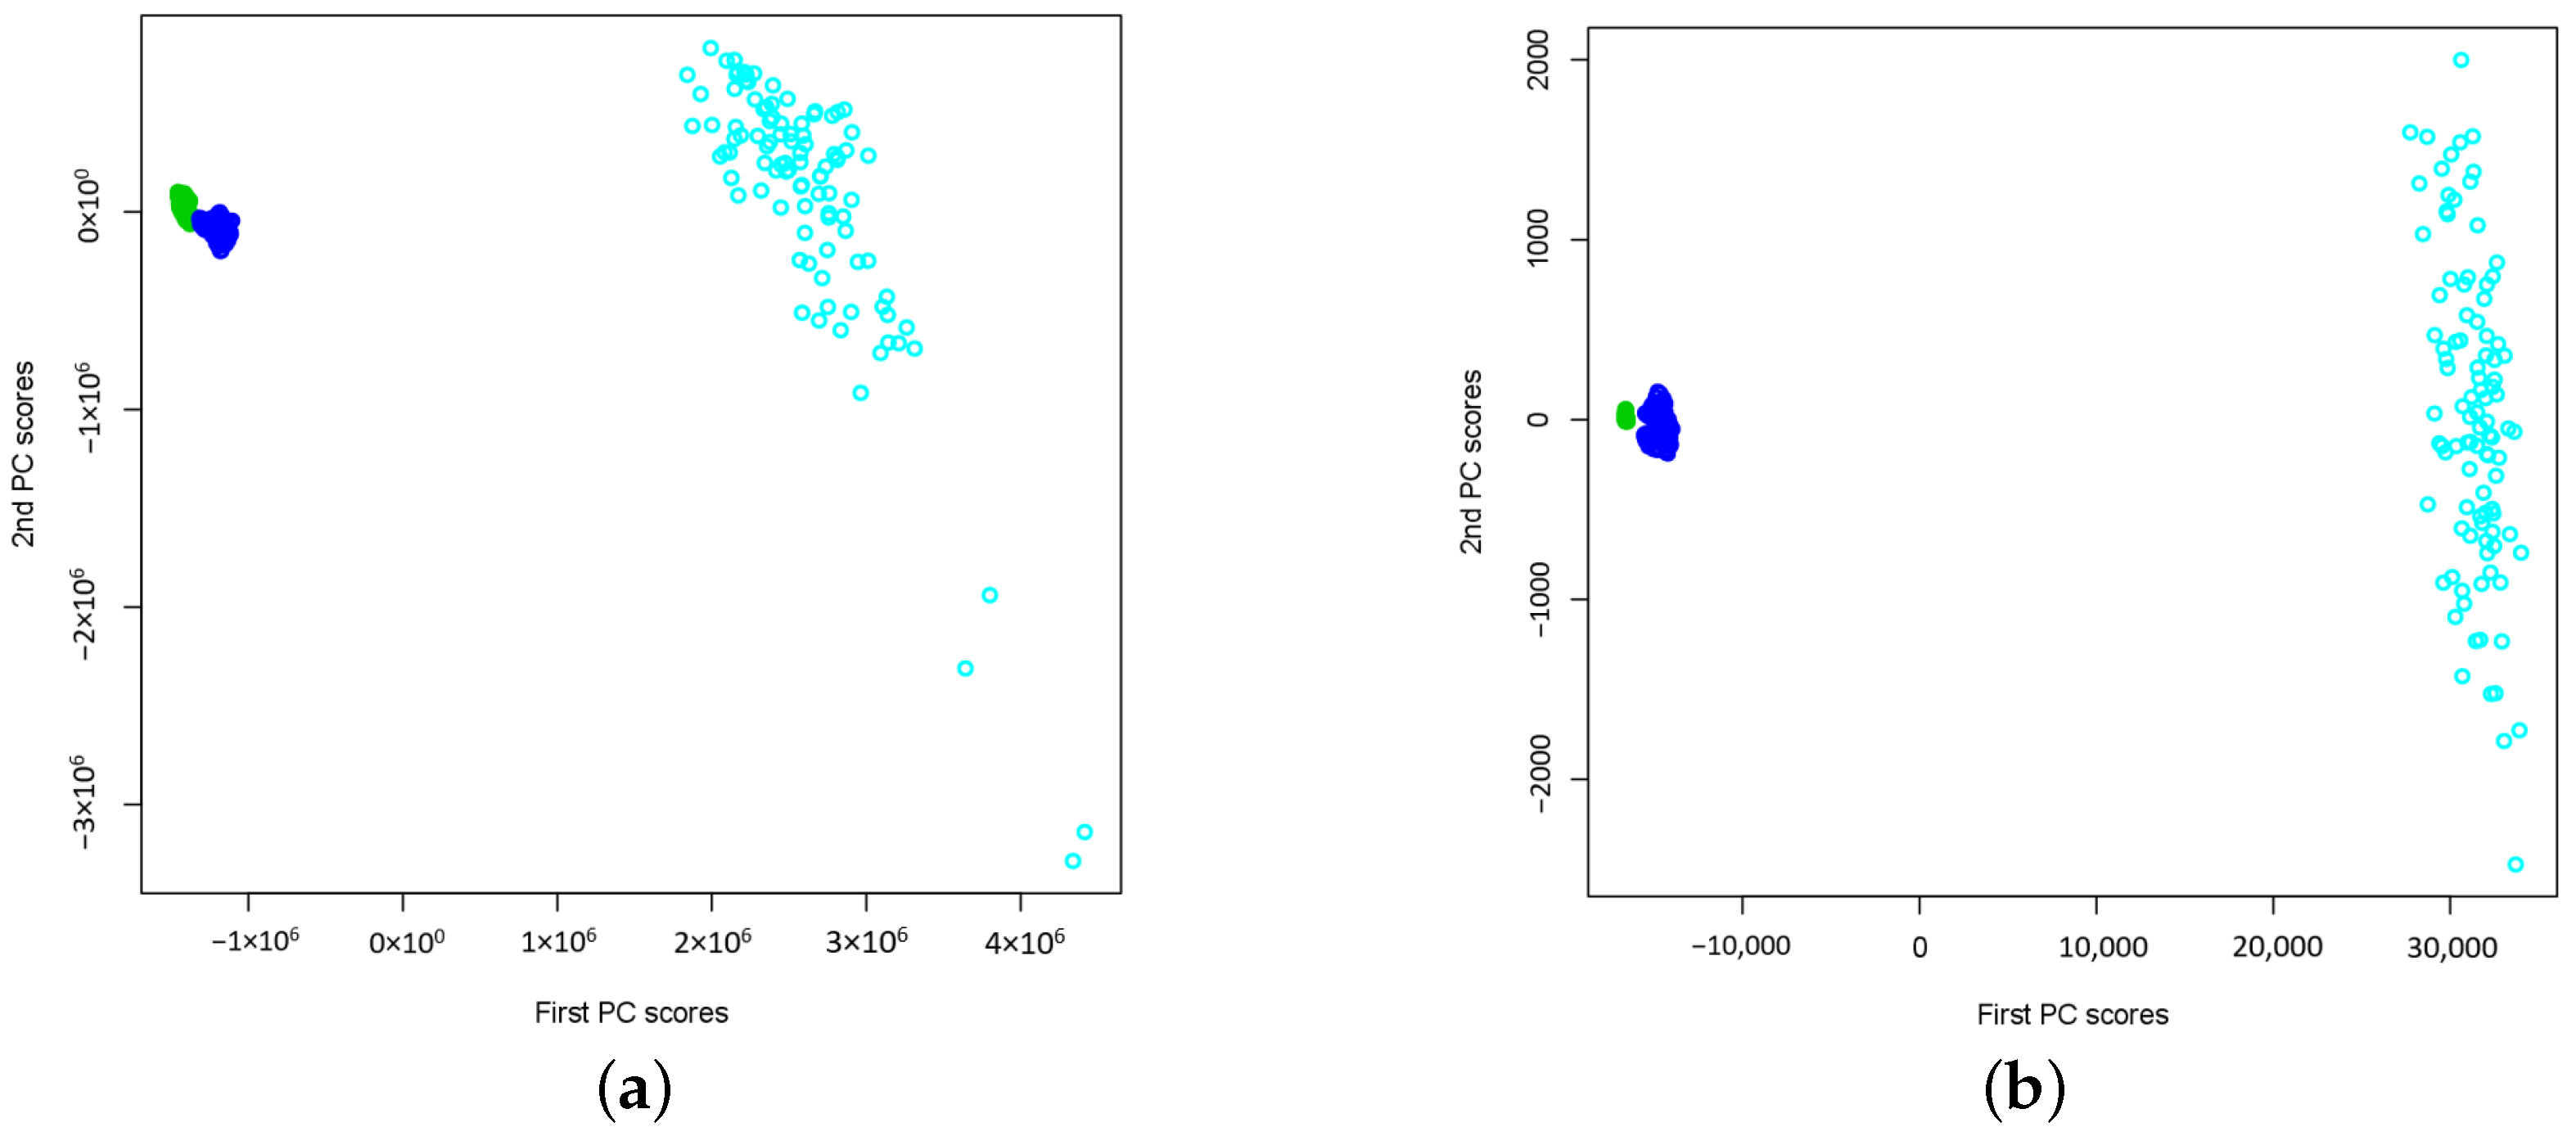
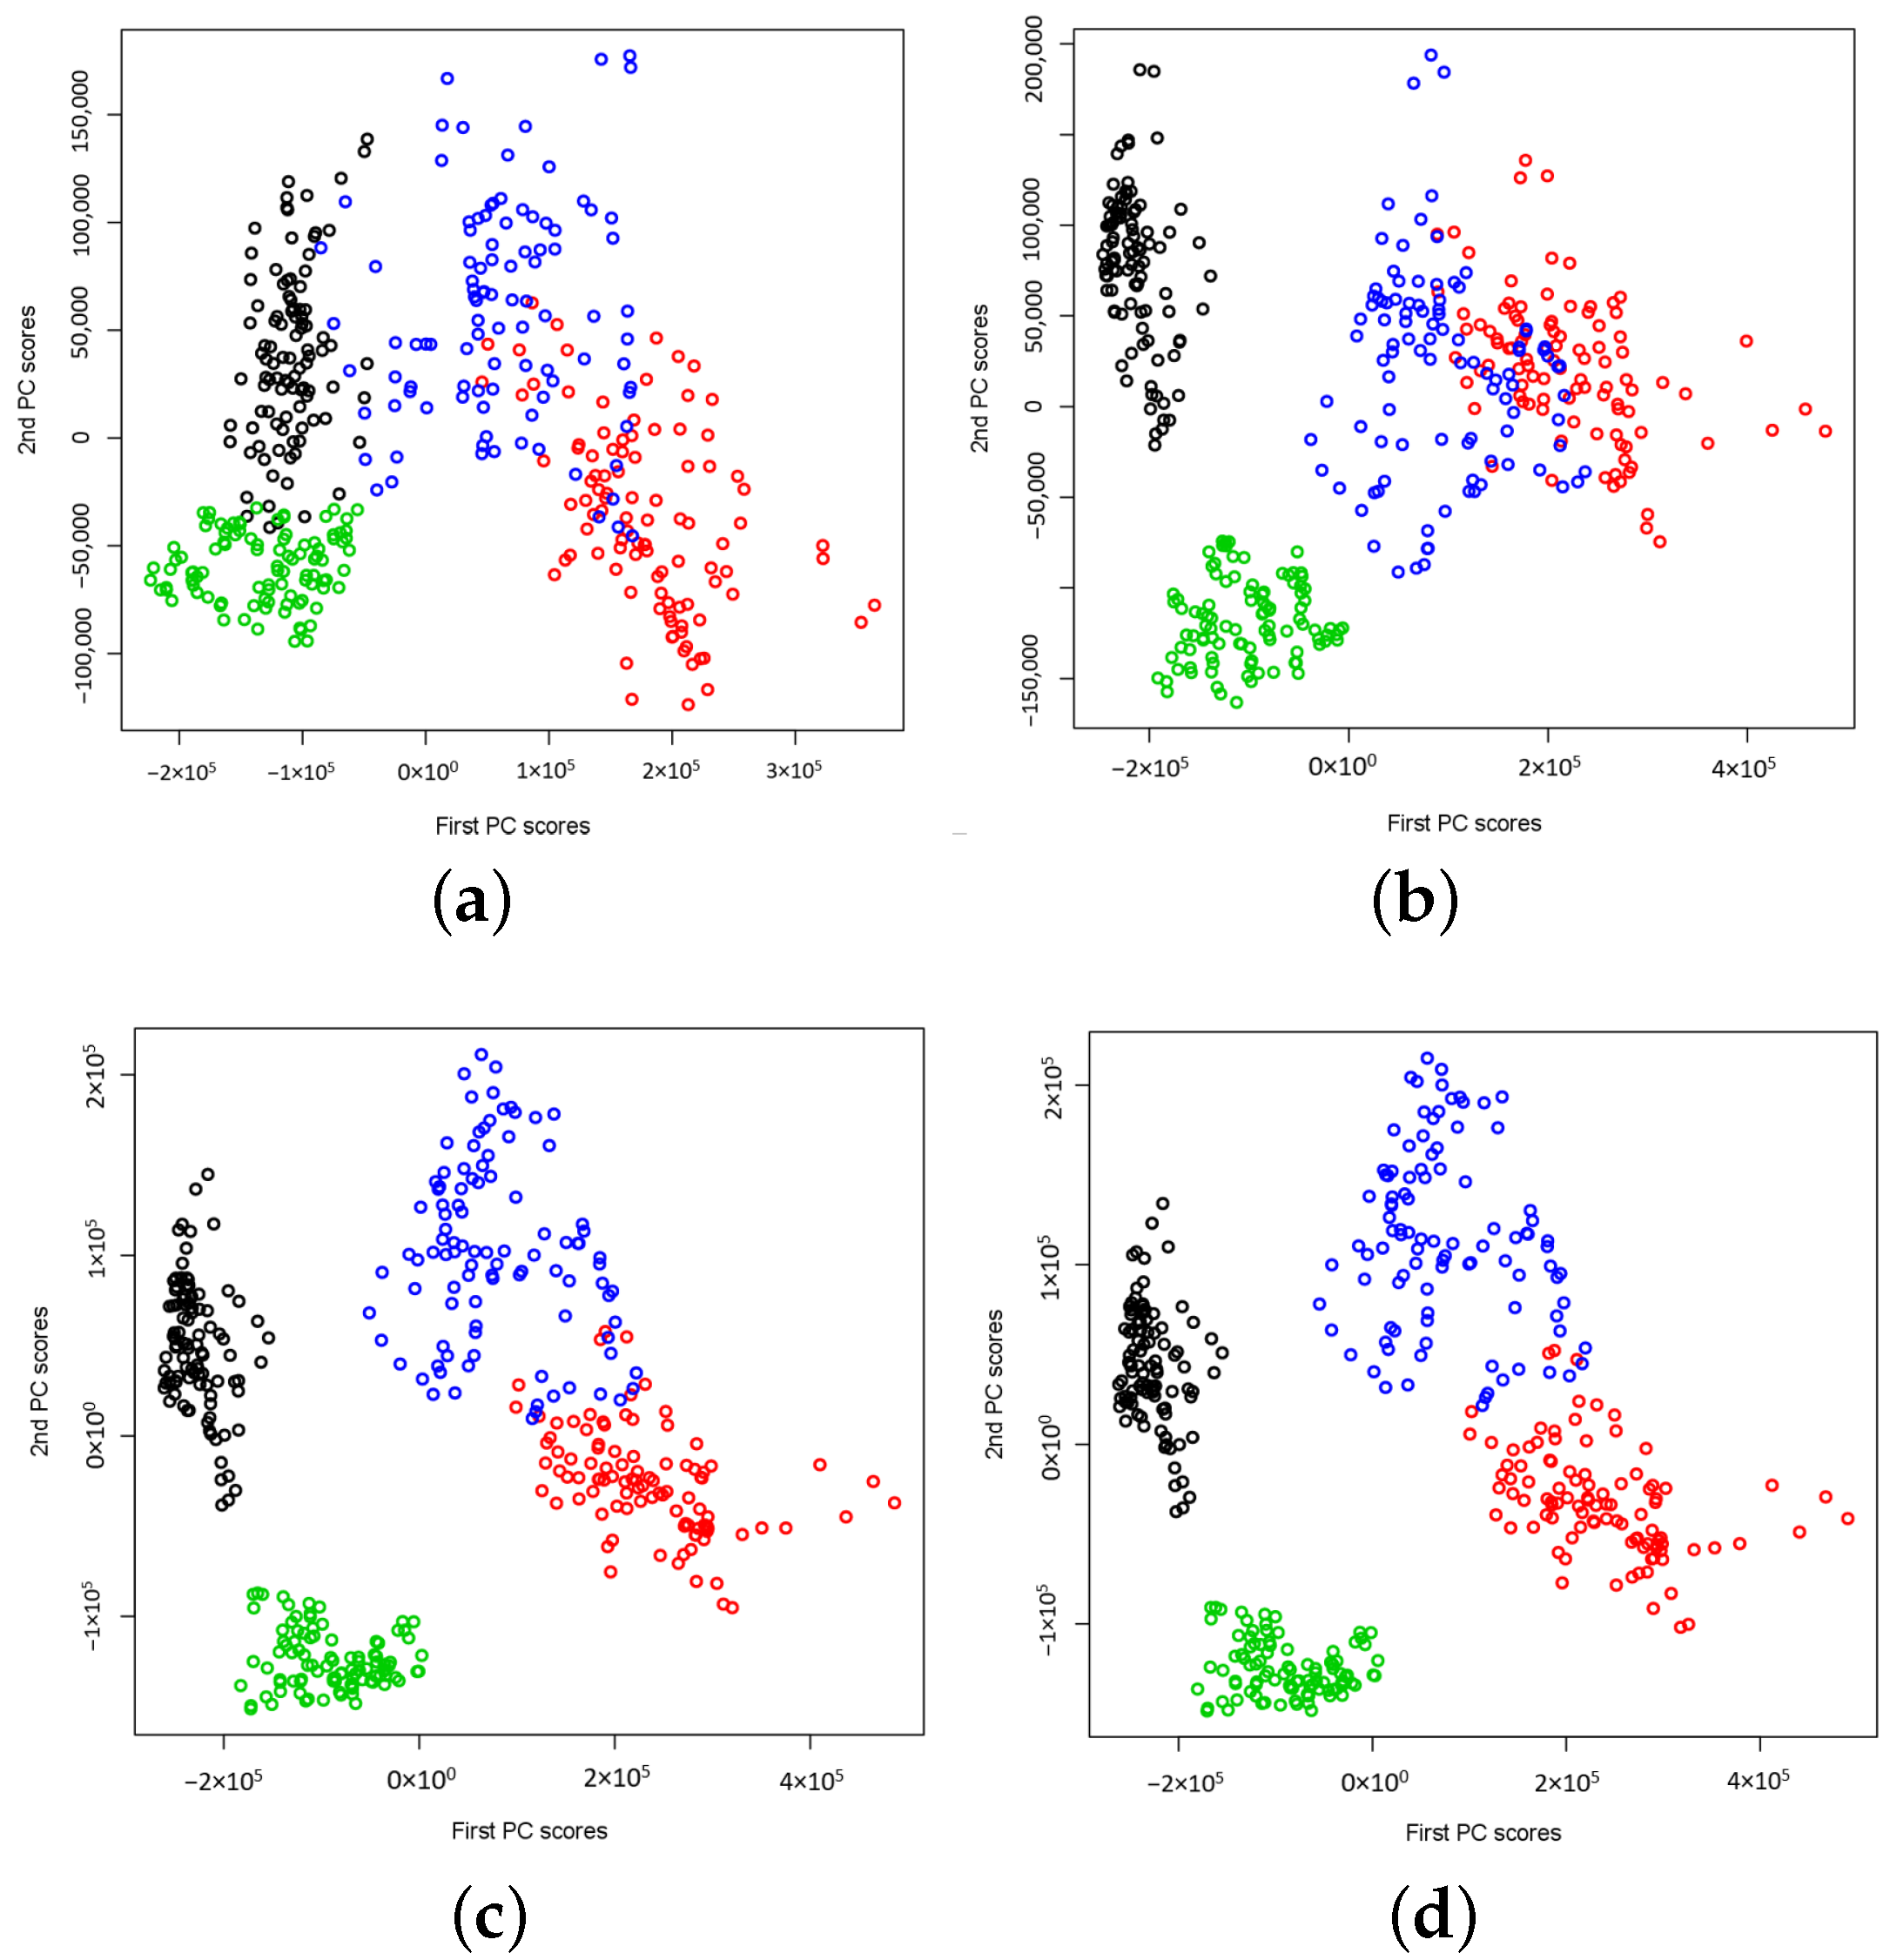
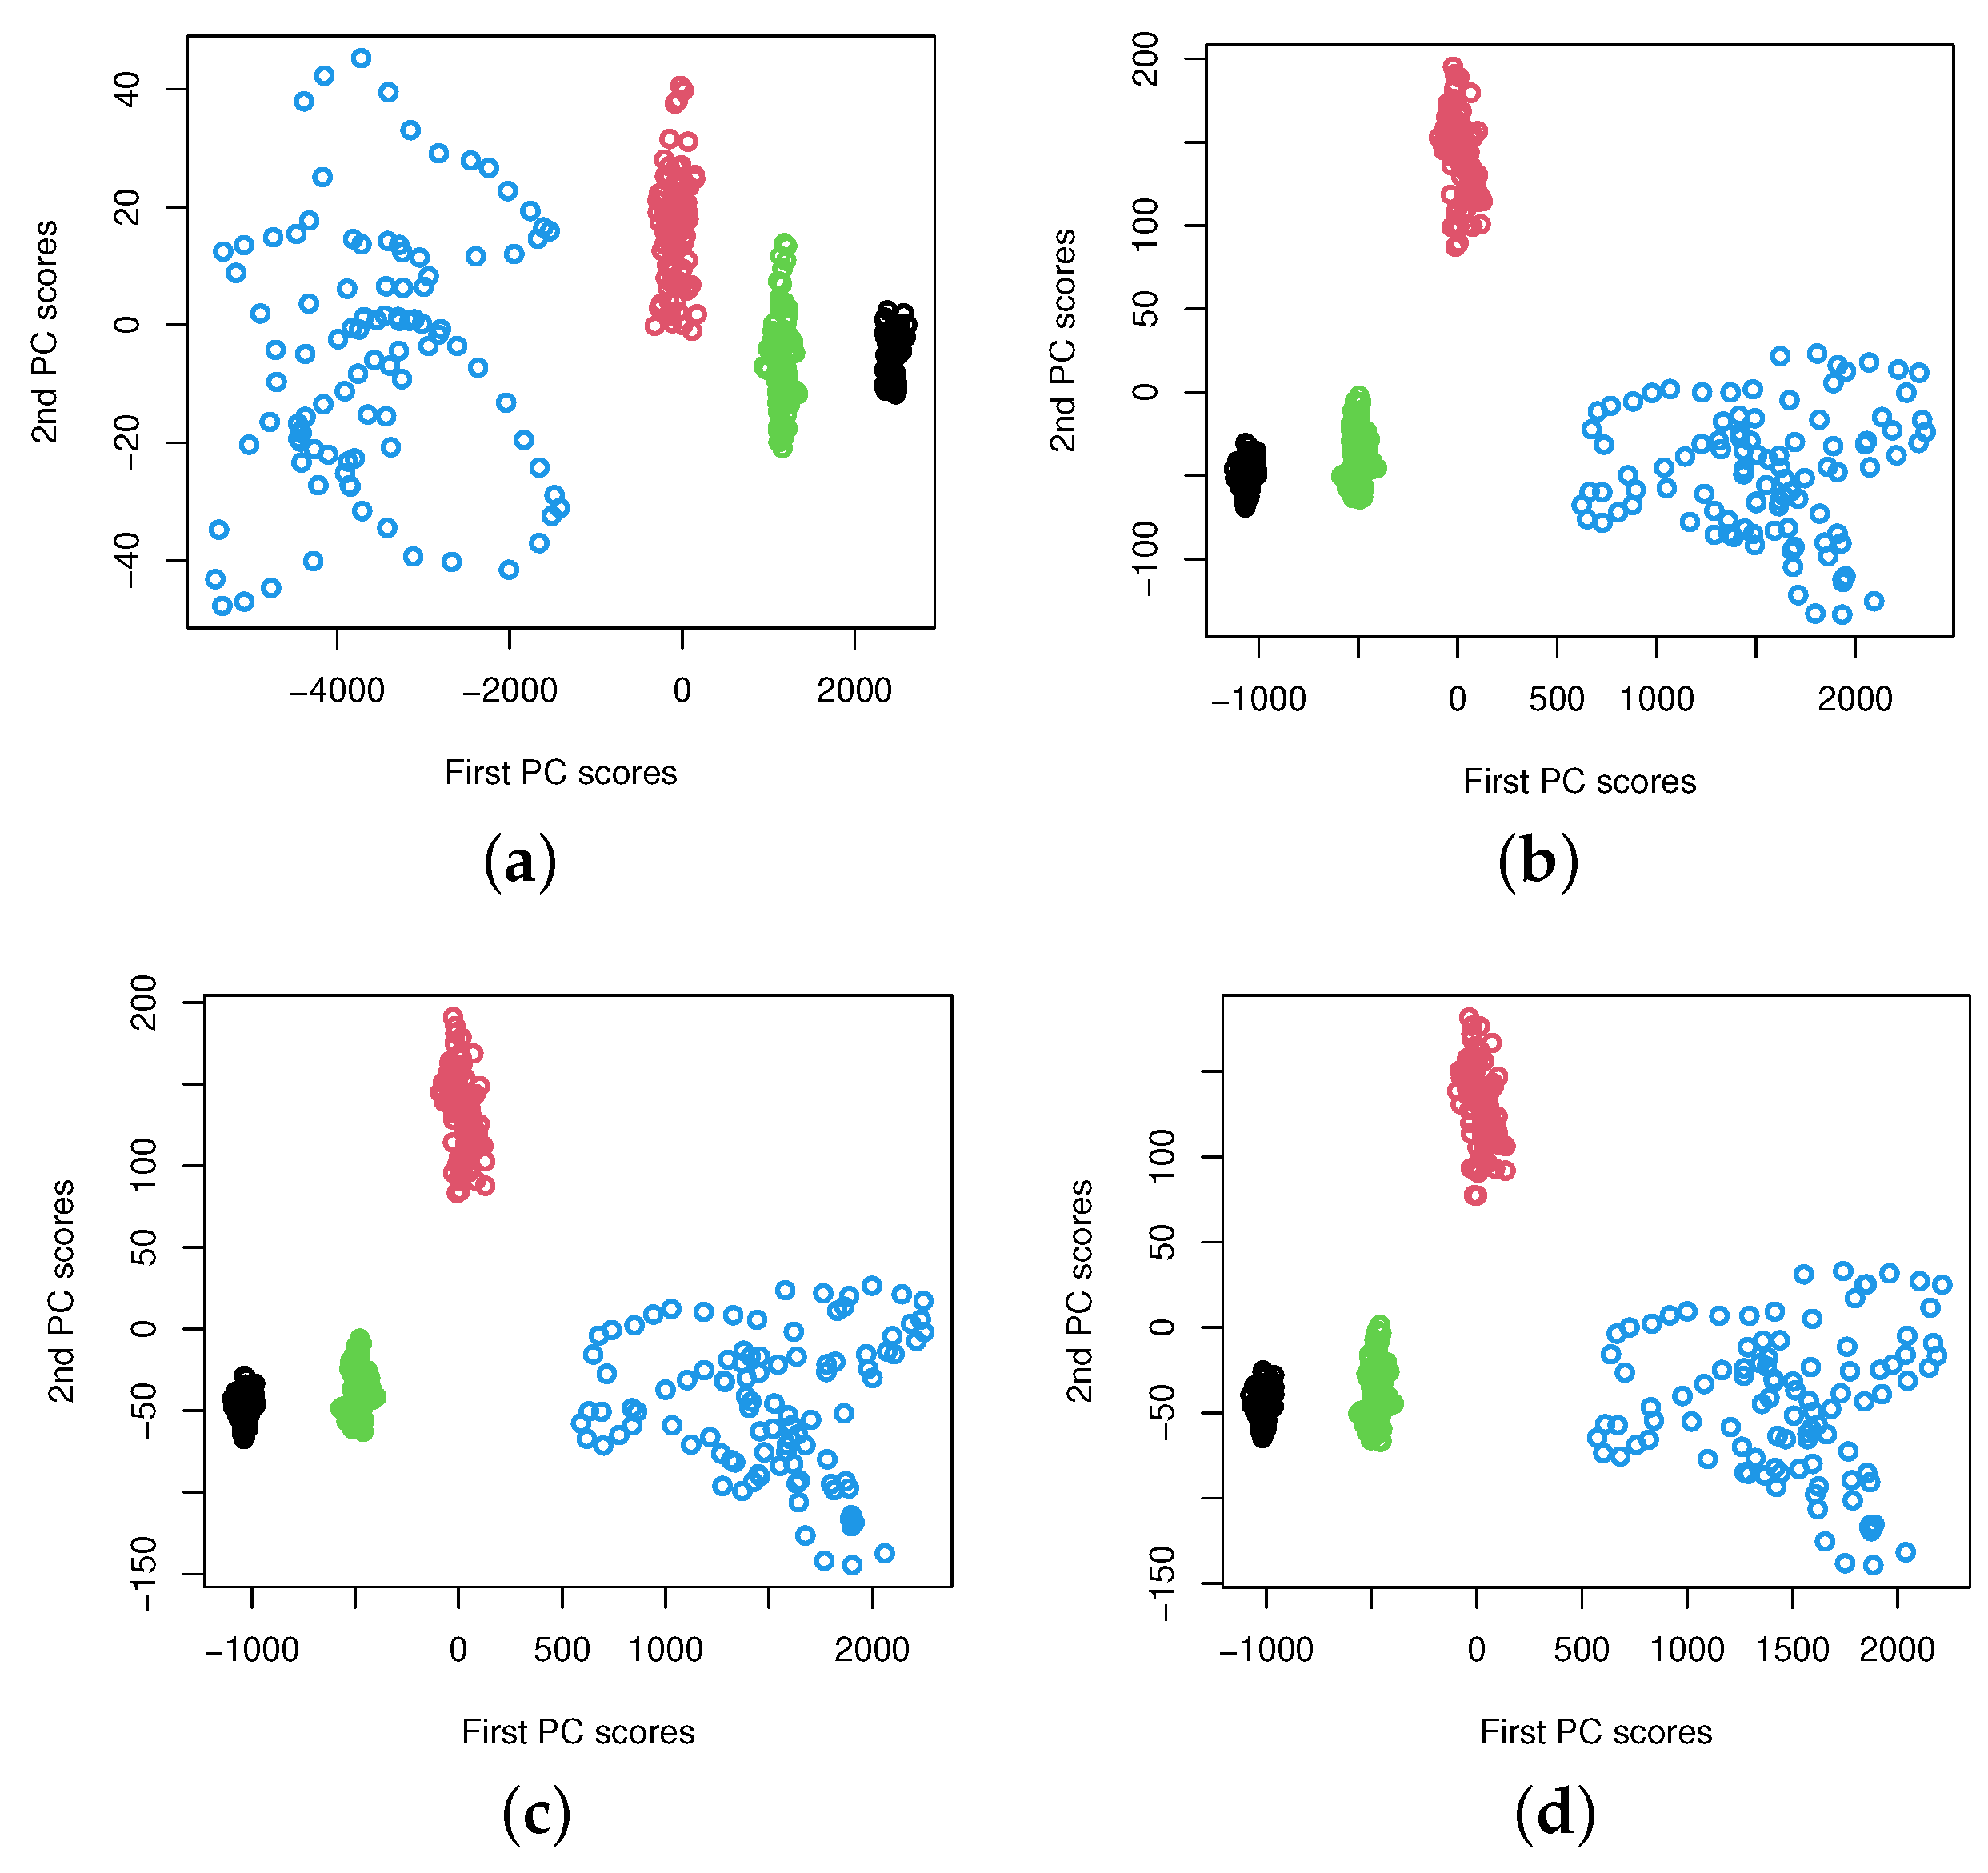
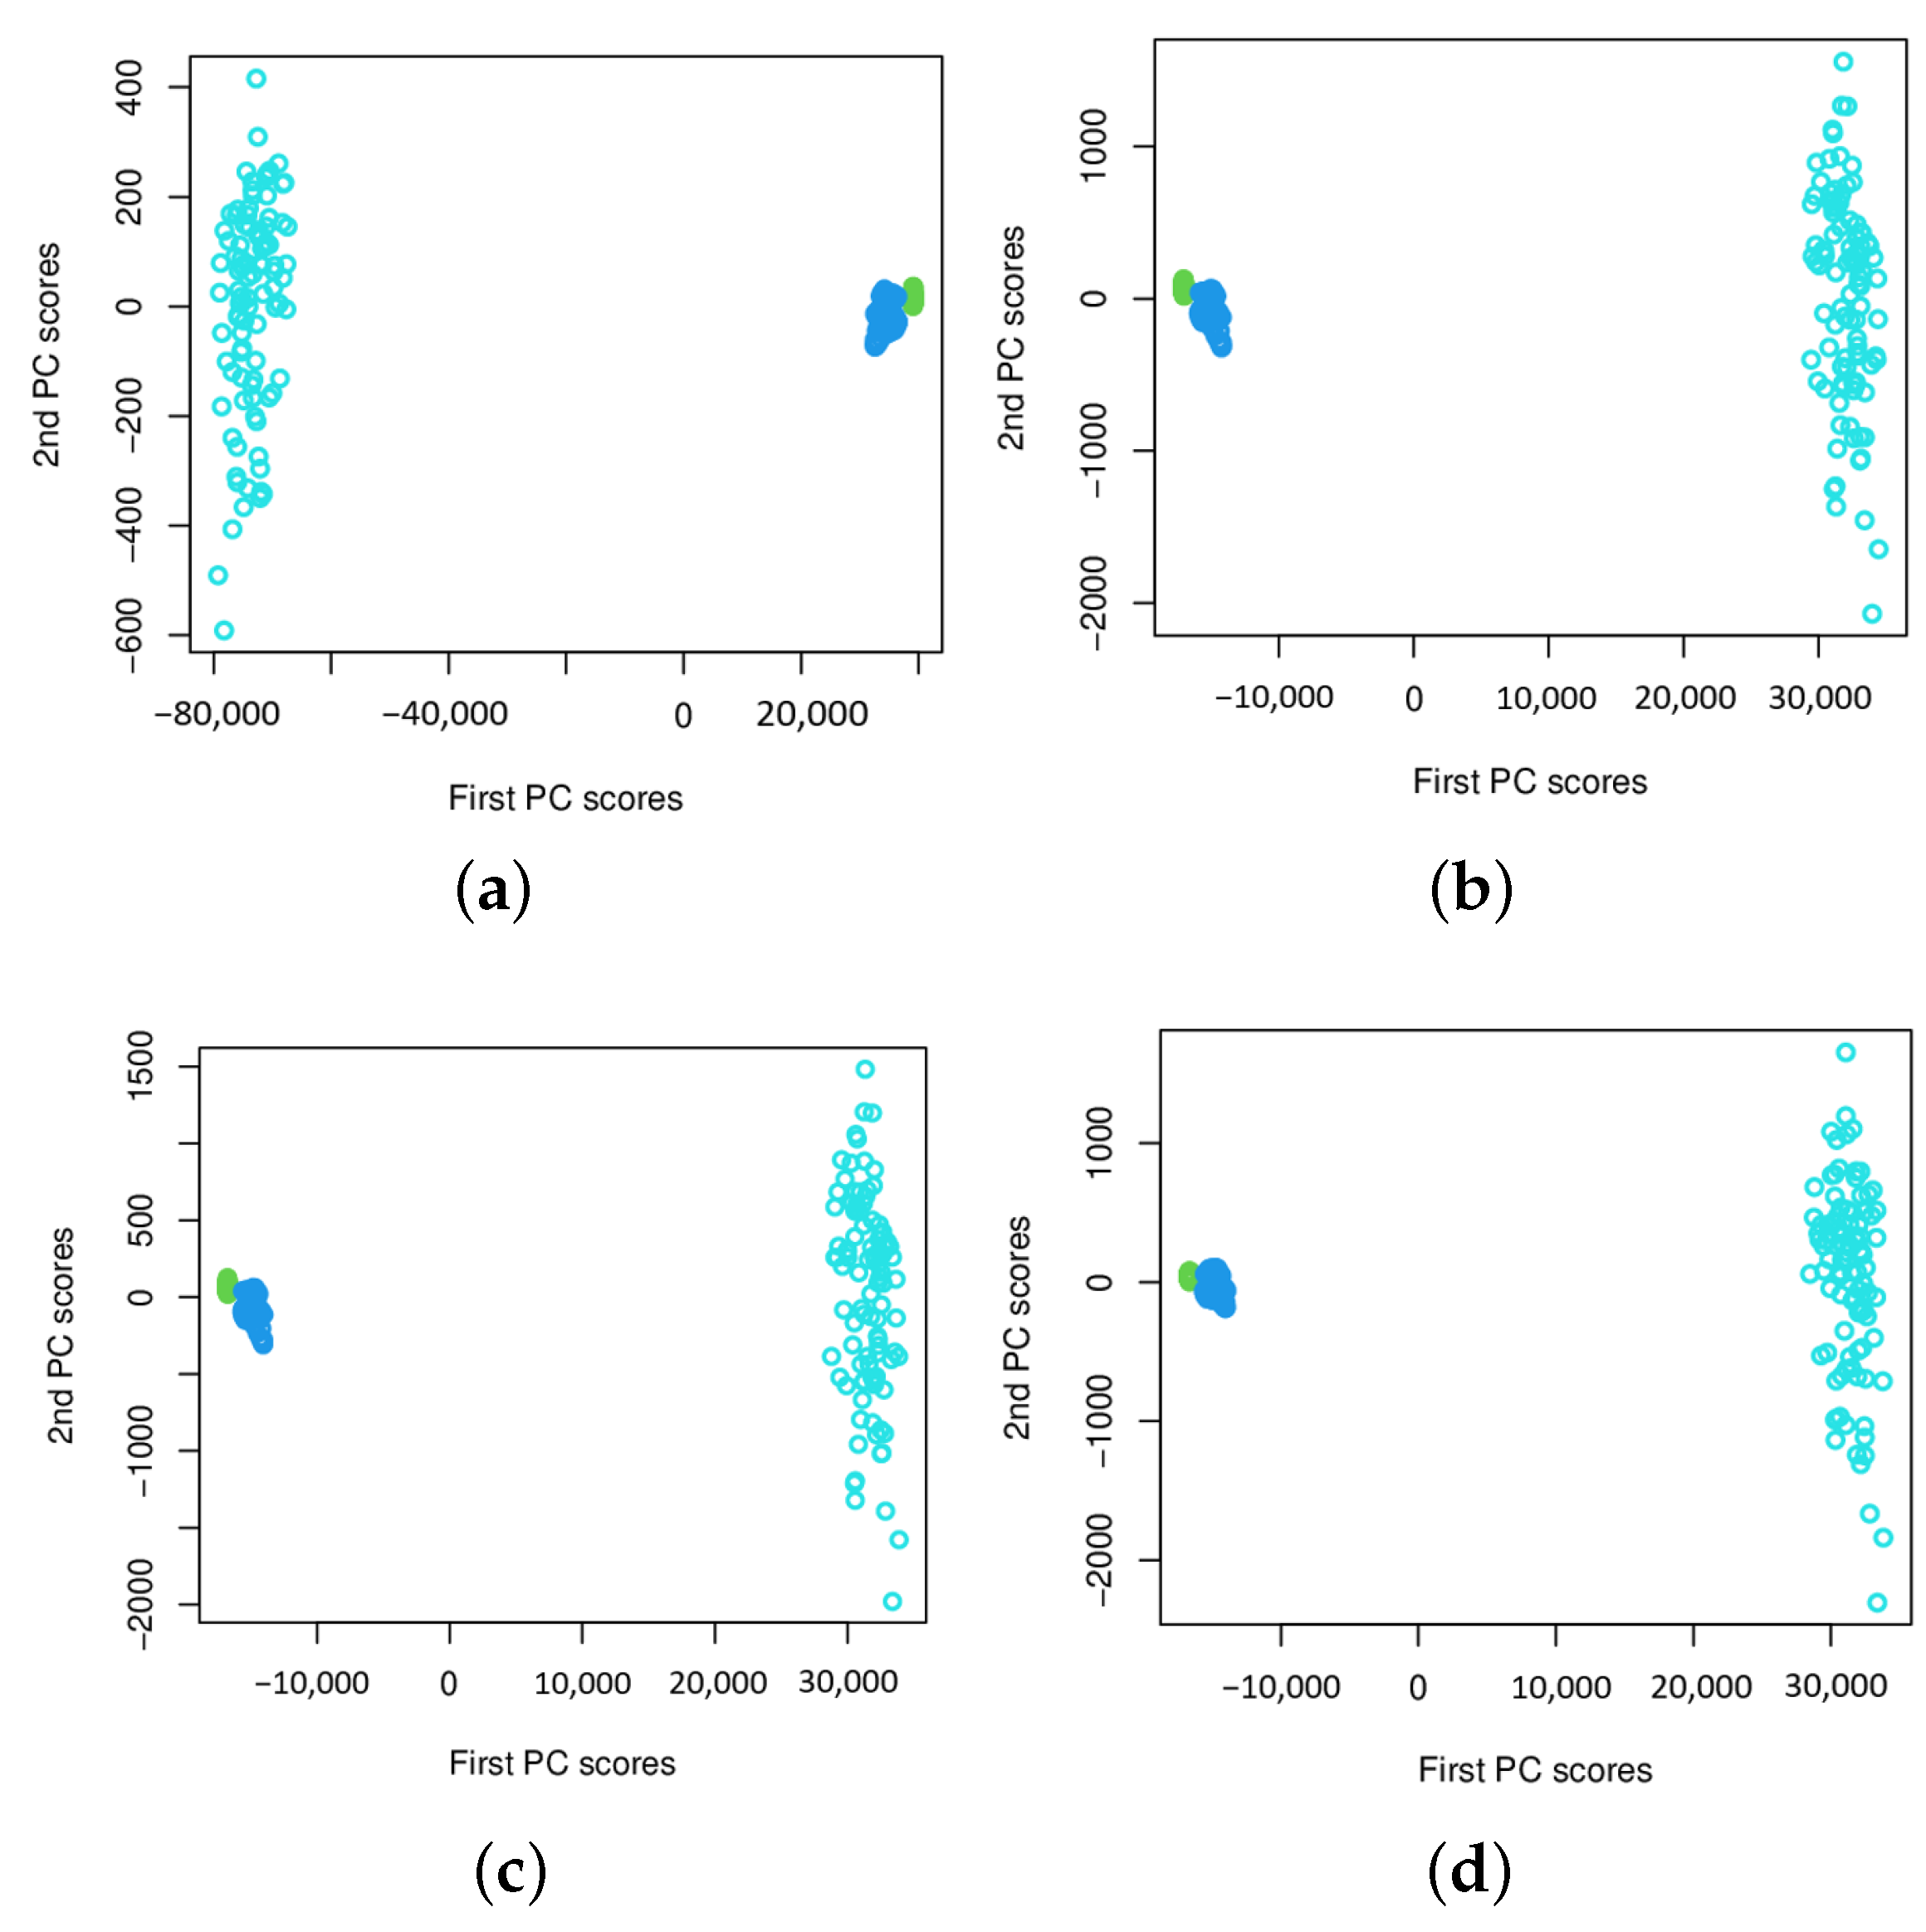
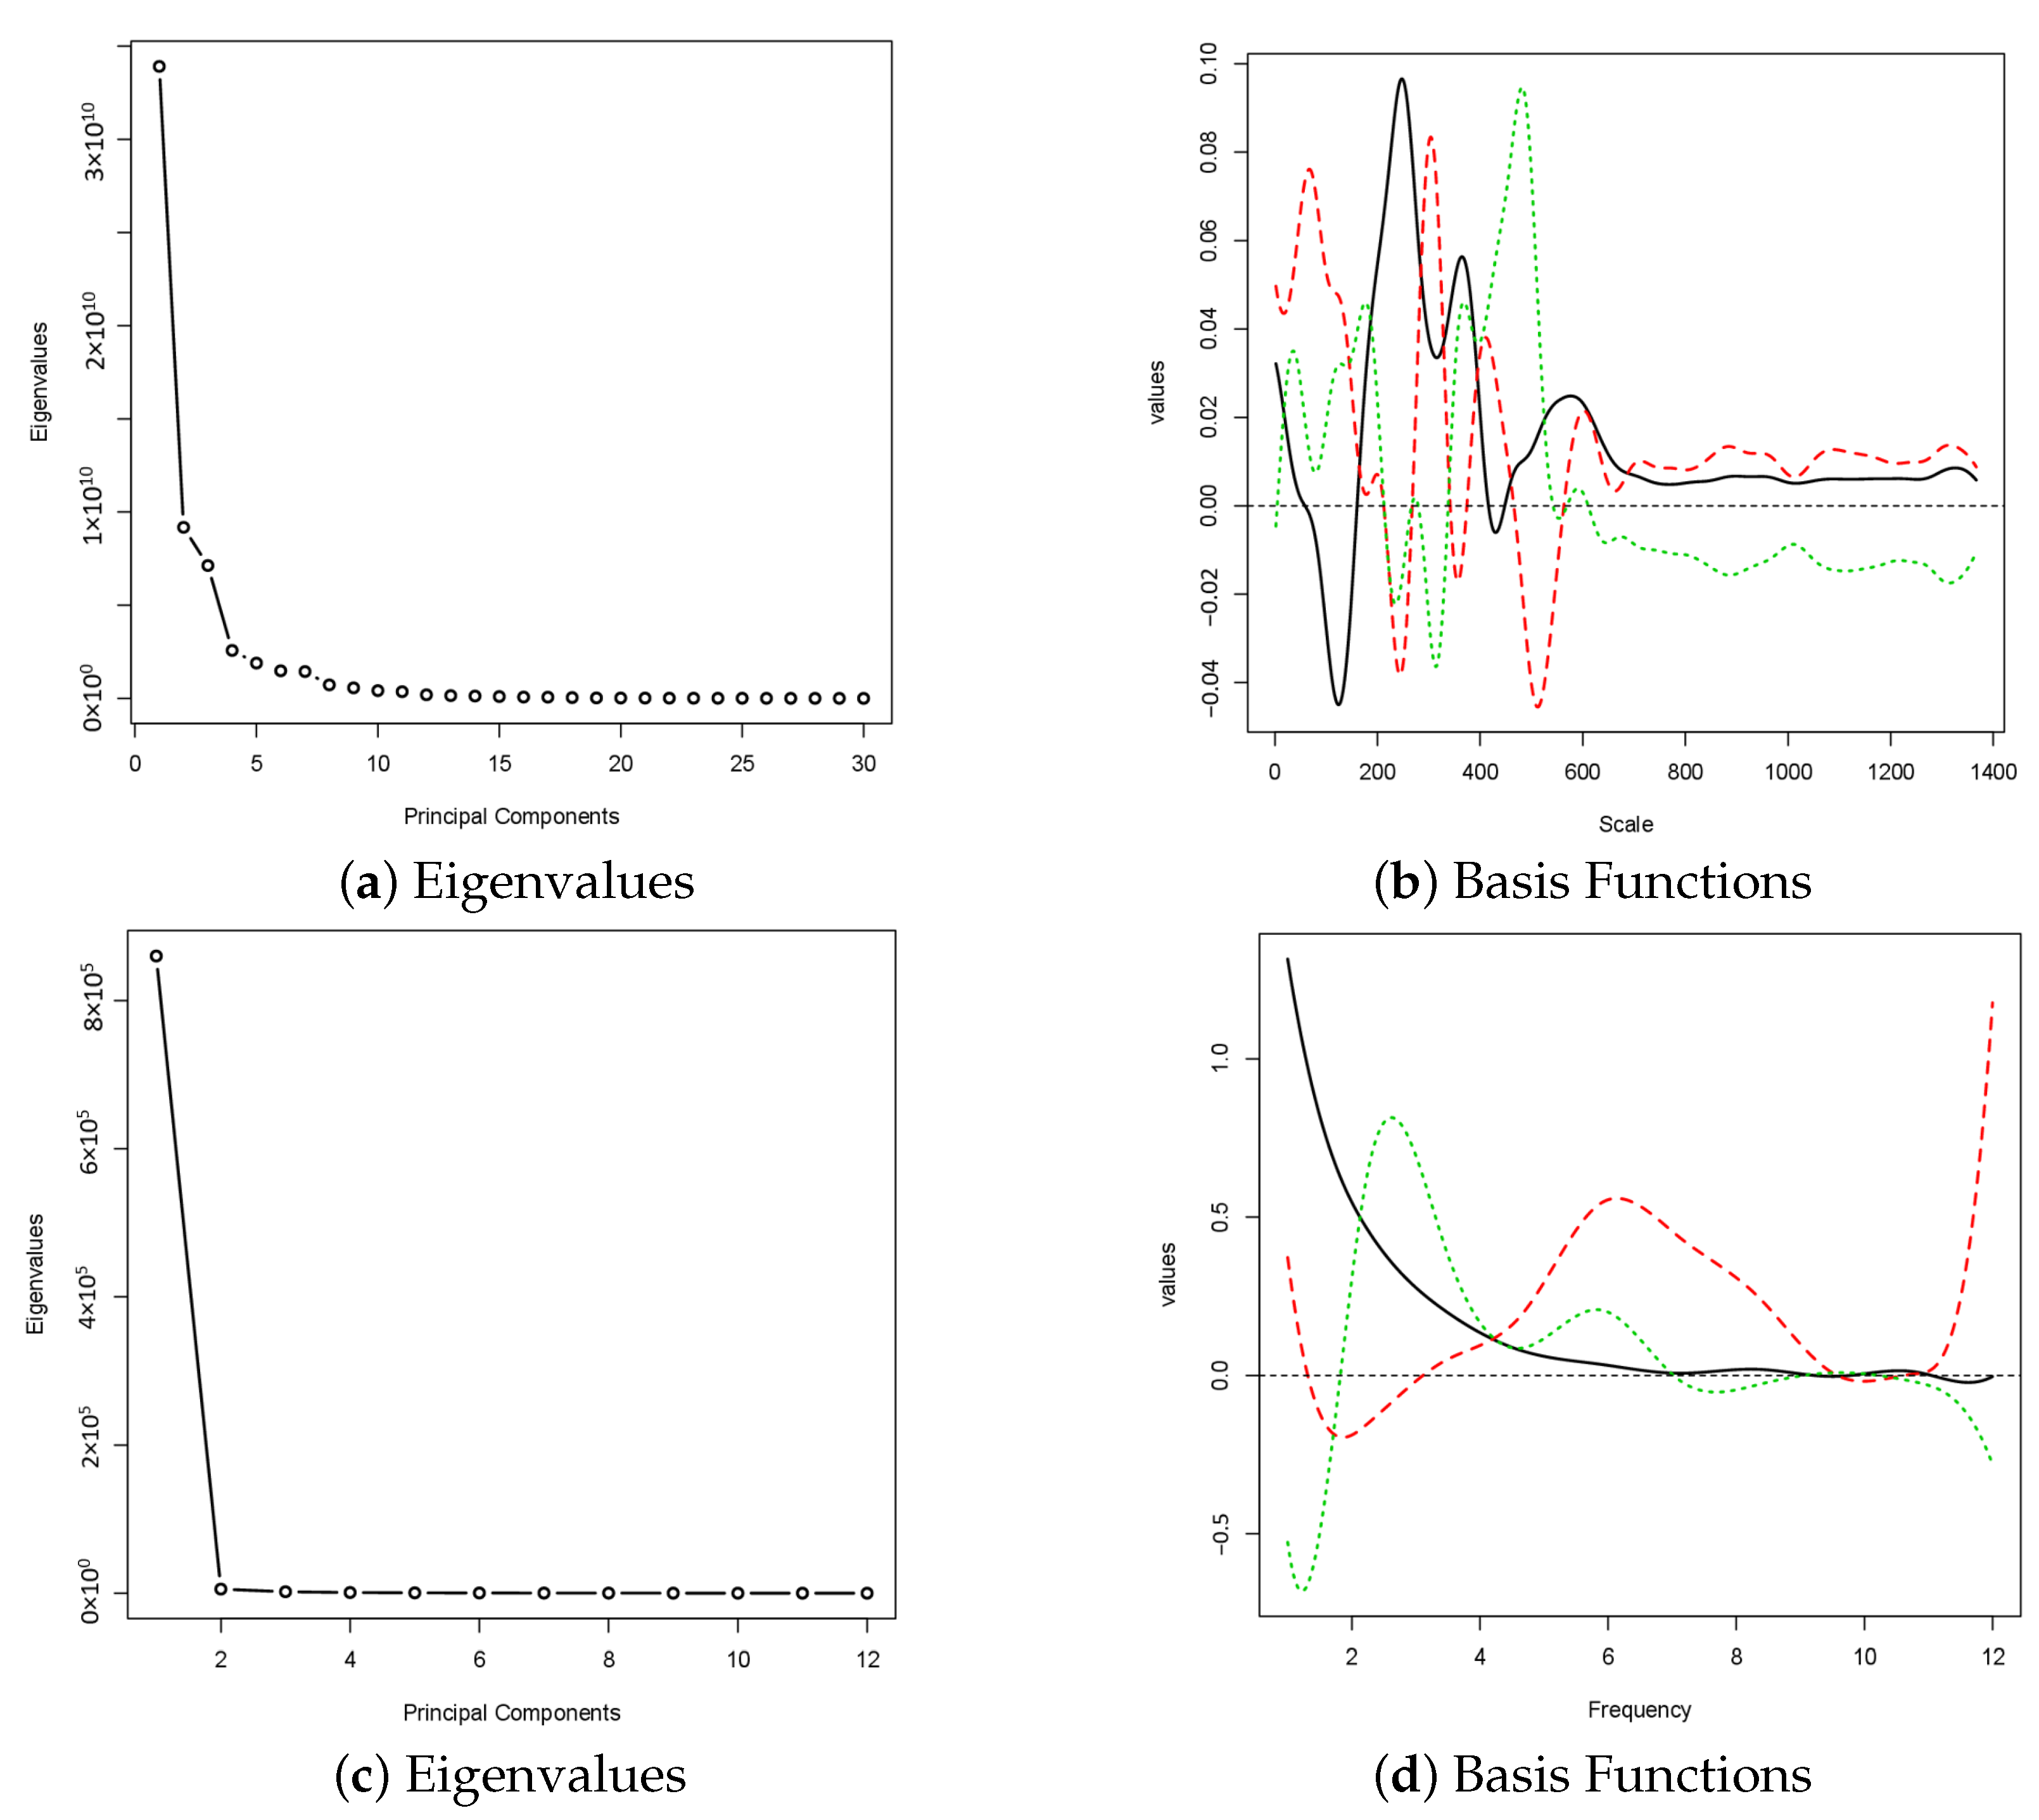
3.1. Feature Extraction of Short Epileptic EEGs
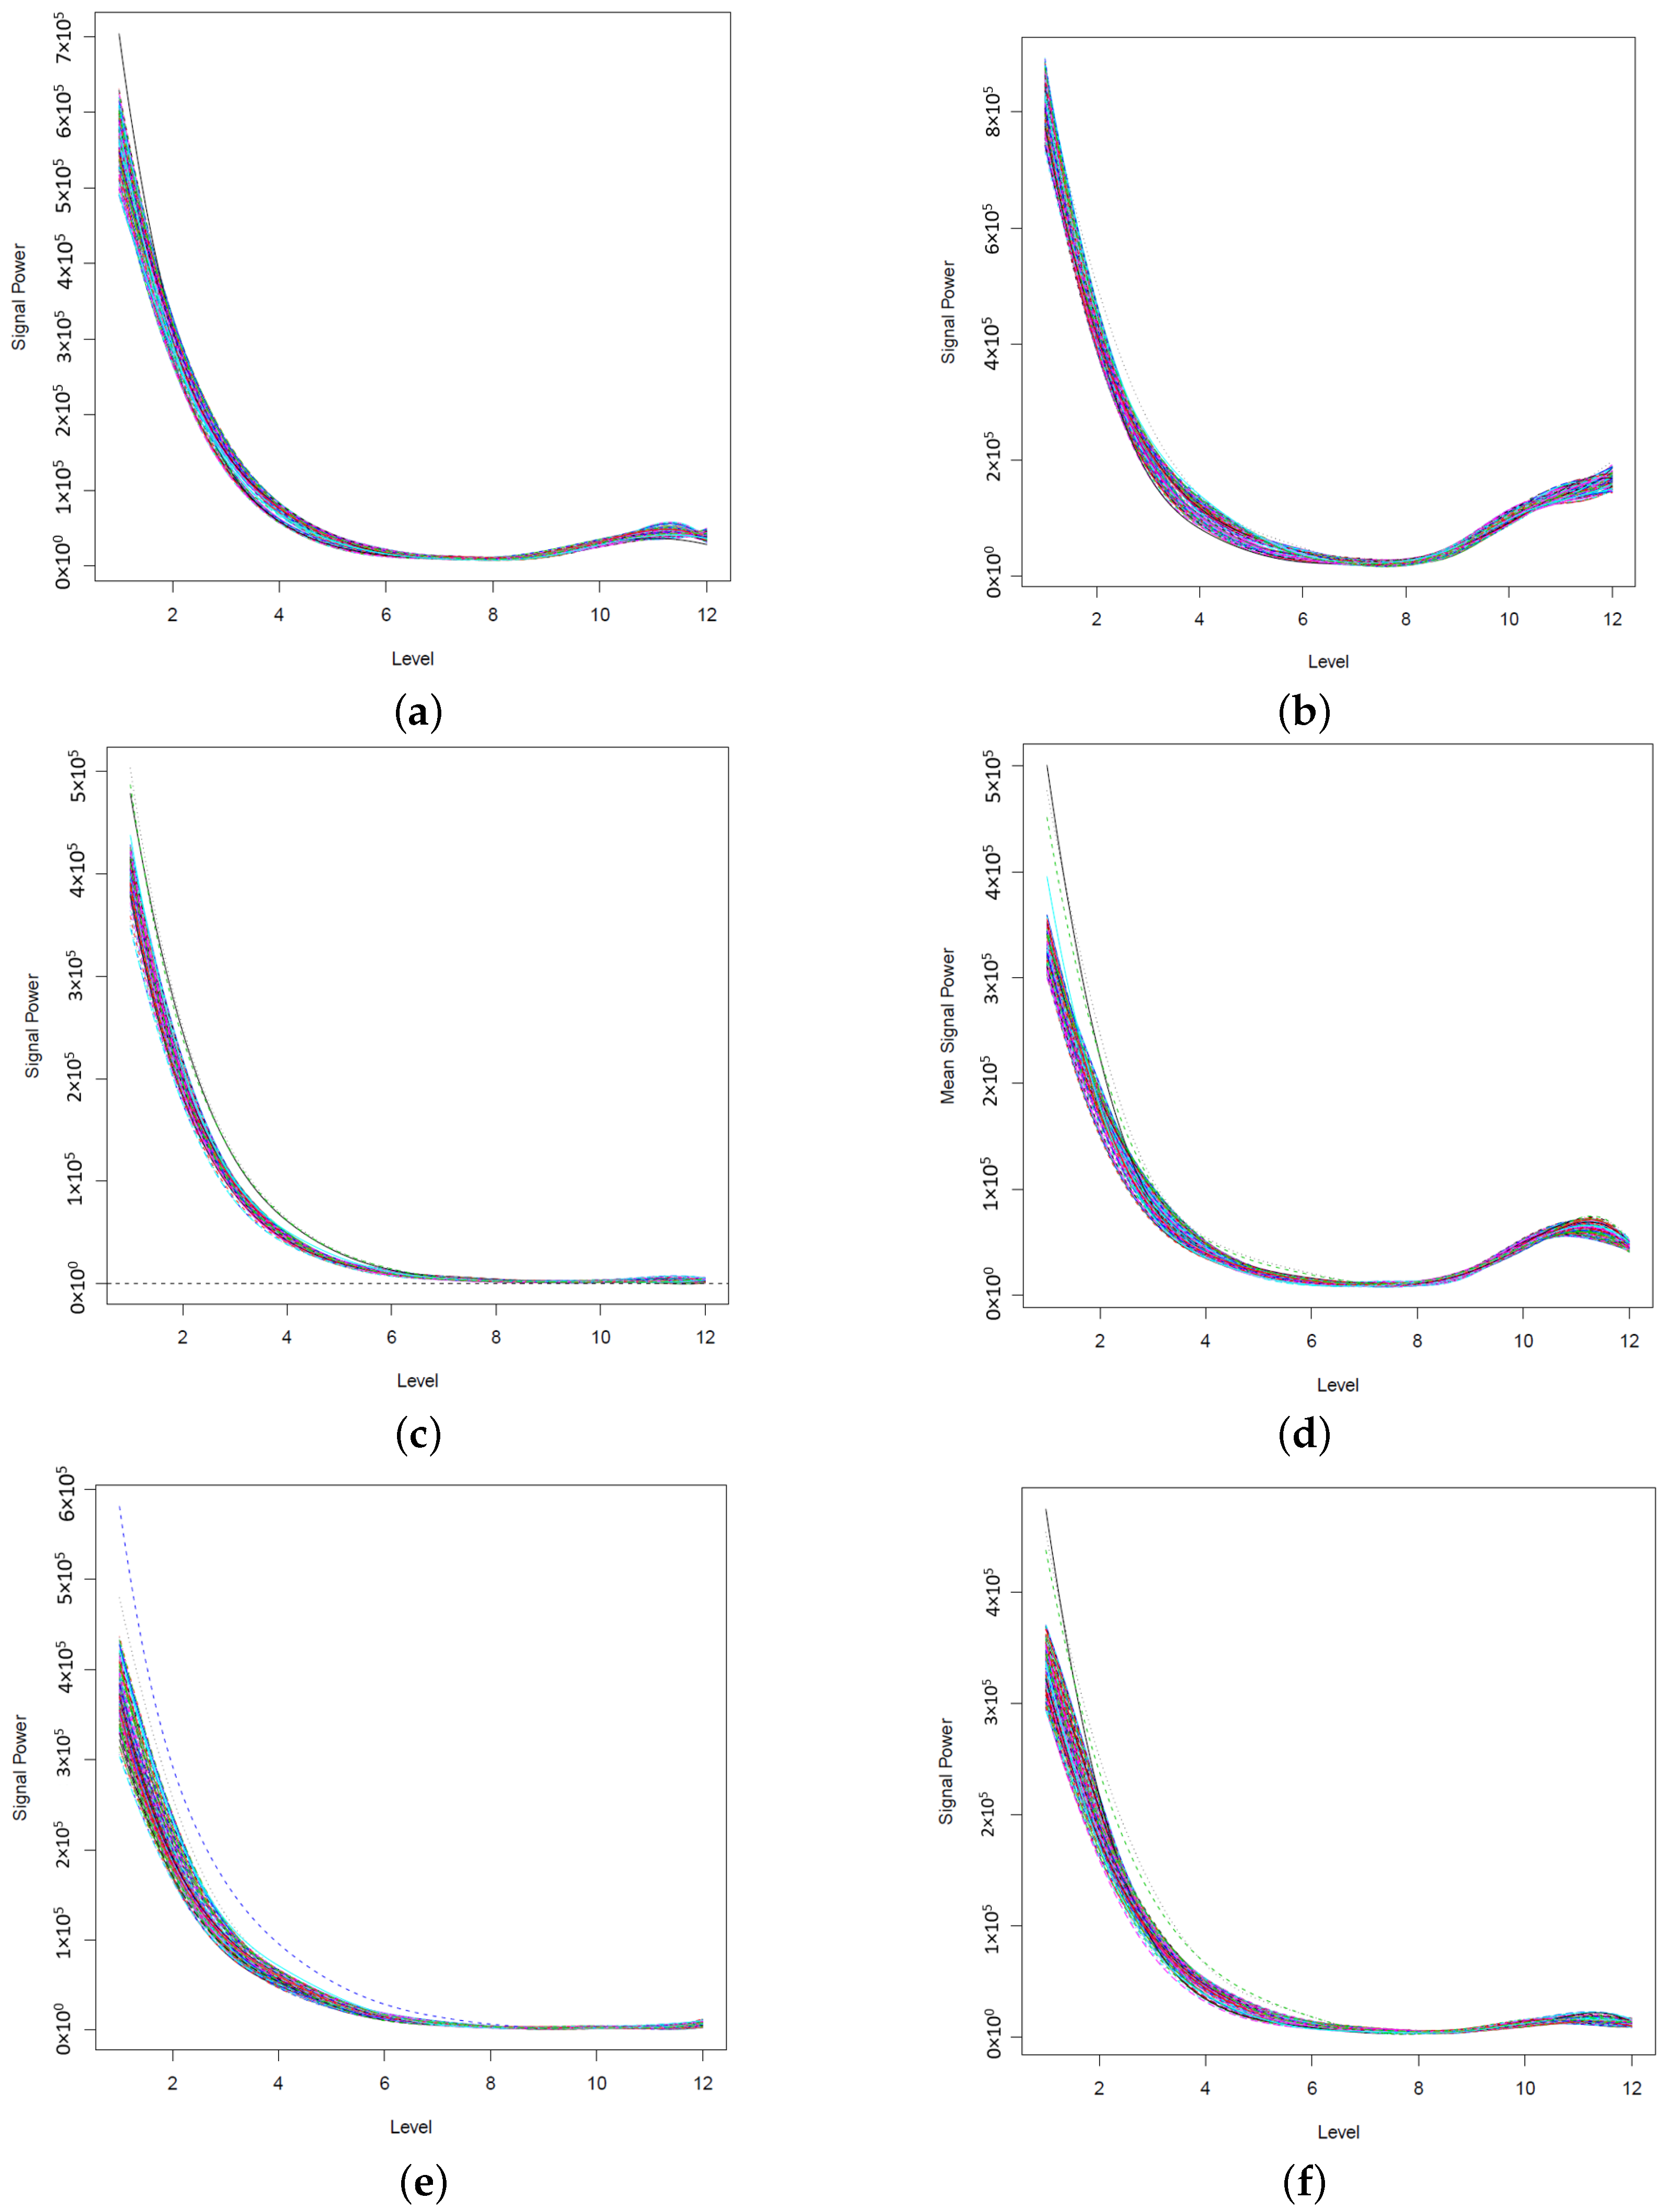
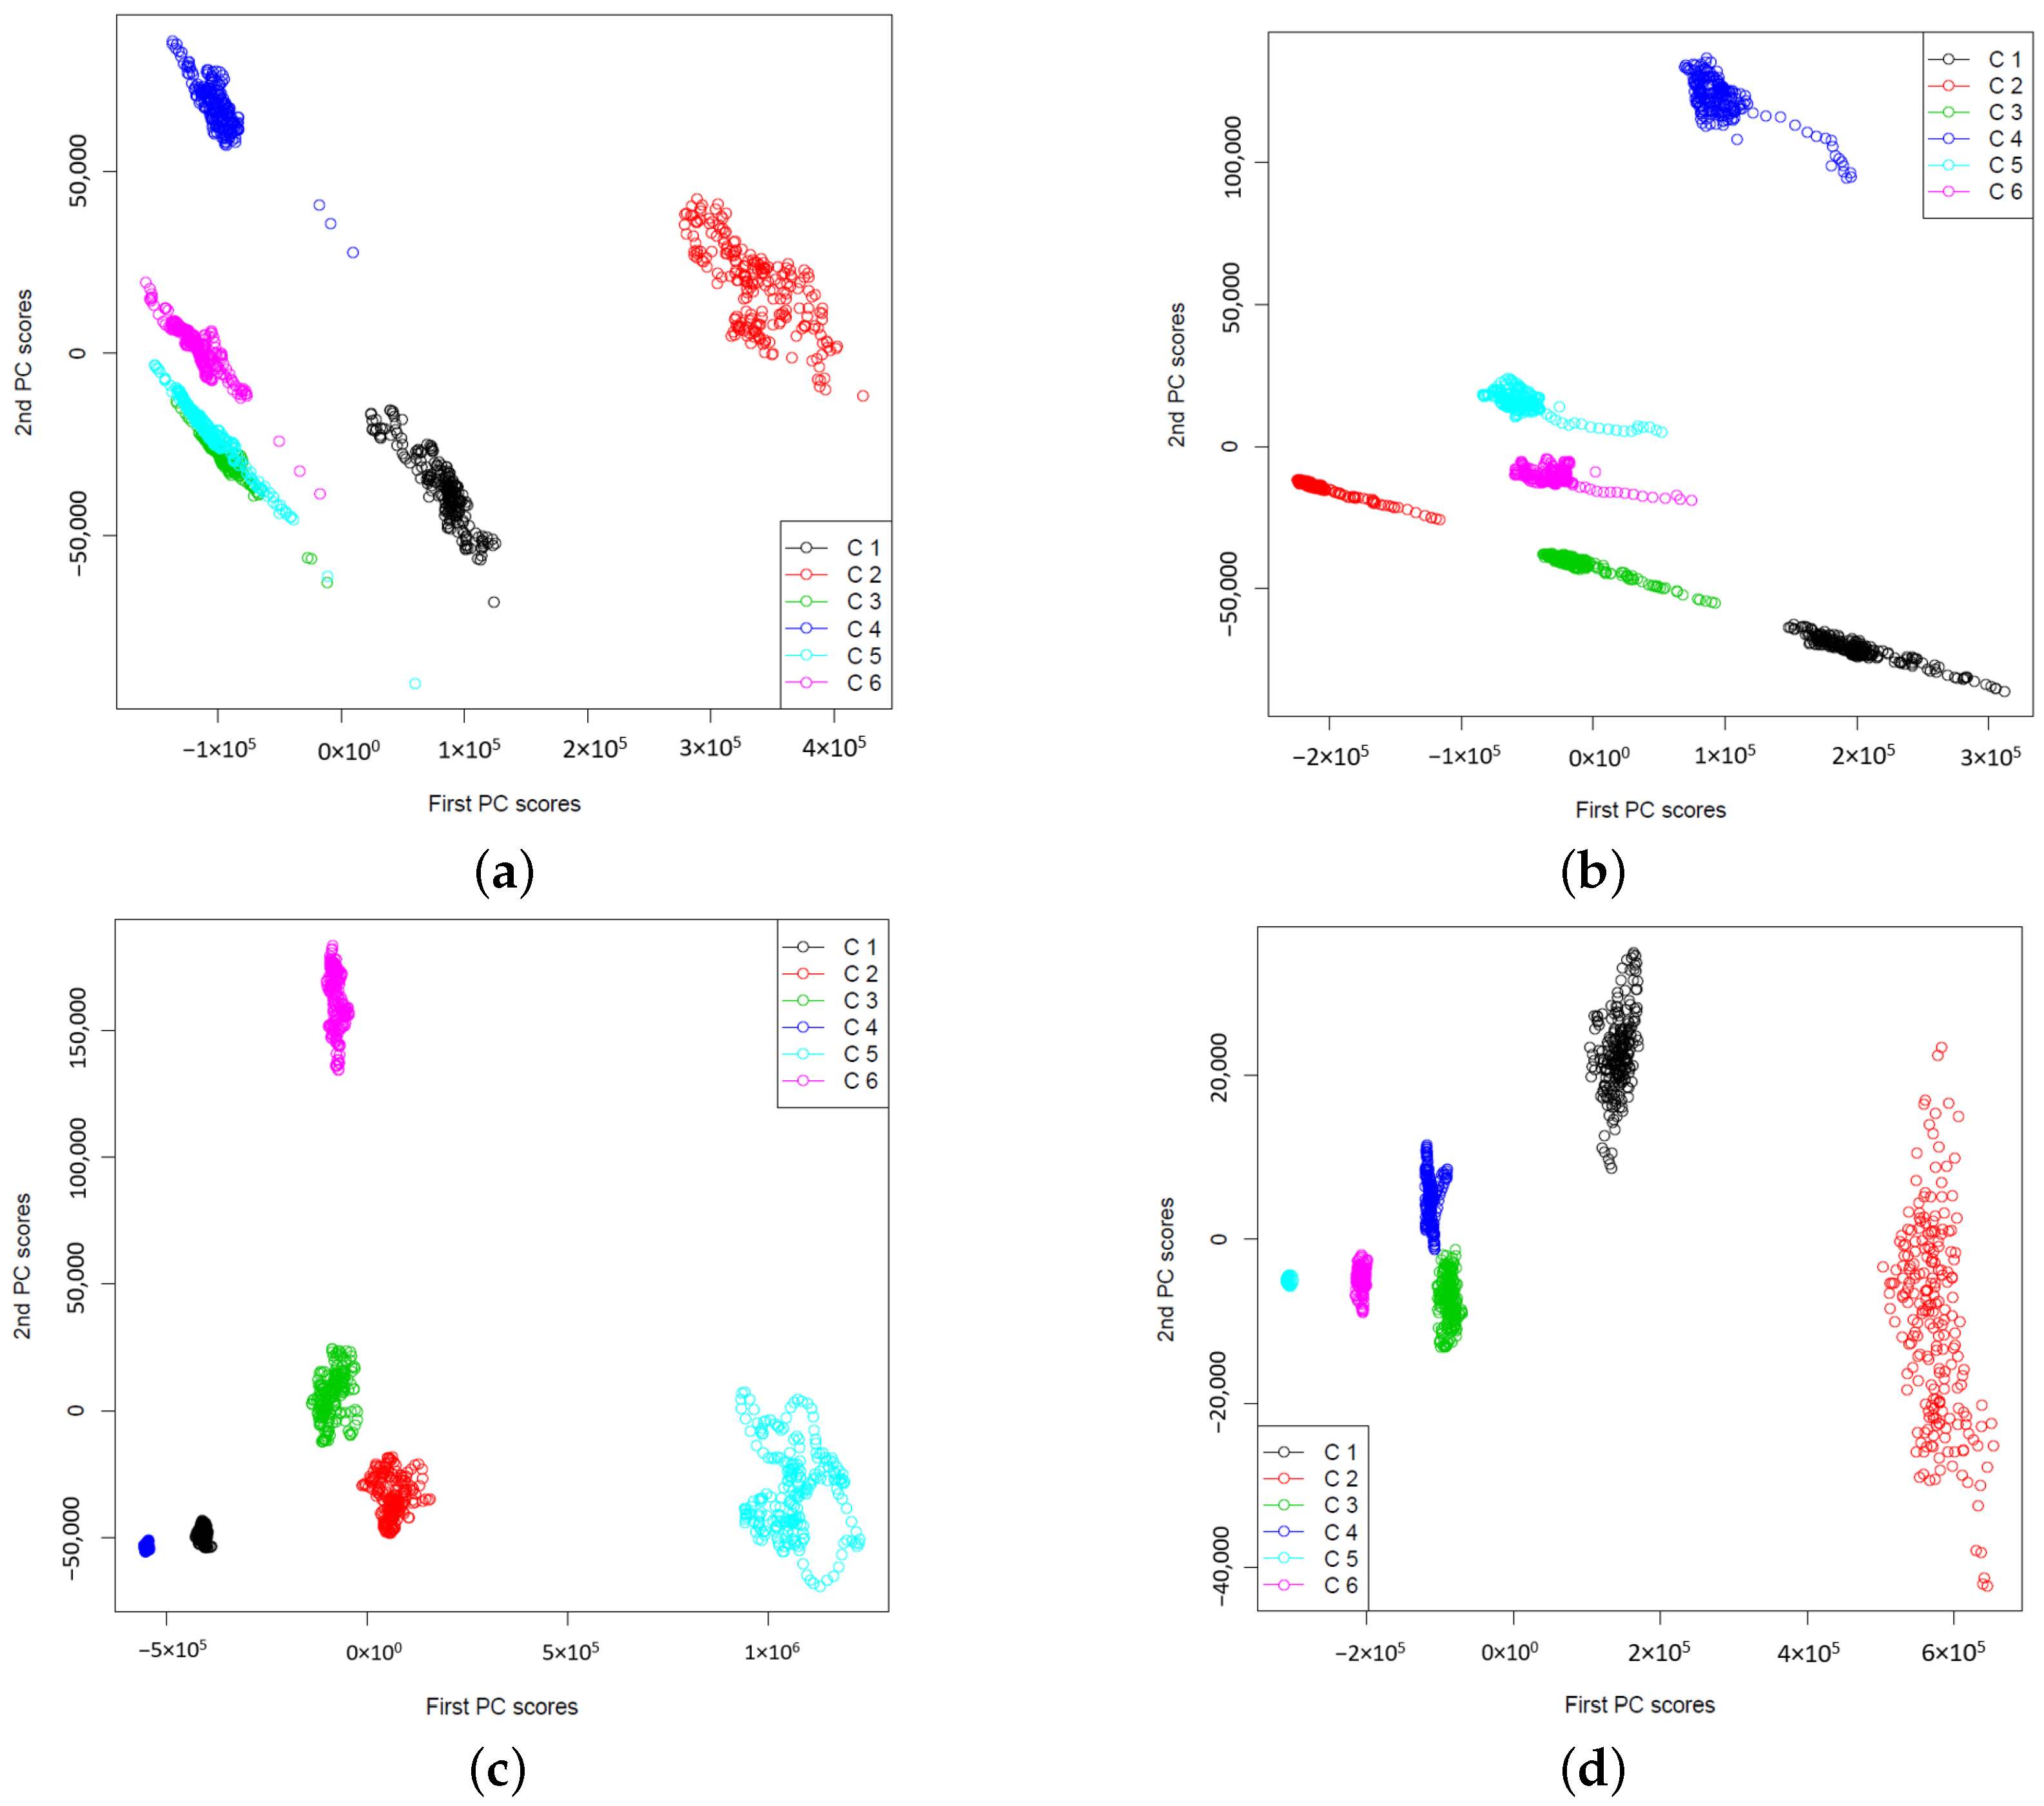
3.2. Feature Extraction of Long Term Multi-Channel Patient Specific Epileptic EEGs
4. Conclusions
Funding
Institutional Review Board Statement
Informed Consent Statement
Data Availability Statement
Conflicts of Interest
References
- Ceylan, R. The effect of feature extraction based on dictionary learning on ecg signal classification. Int. J. Intell. Syst. Appl. Eng. 2018, 6, 40–46. [Google Scholar] [CrossRef]
- Krishnan, S.; Athavale, Y. Trends in biomedical signal feature extraction. Biomed. Signal Process. Control 2018, 43, 41–63. [Google Scholar] [CrossRef]
- Xie, S.; Lawniczak, A.T.; Song, Y.; Liò, P. Feature extraction via dynamic pca for epilepsy diagnosis and epileptic seizure detection. In Proceedings of the 2010 IEEE International Workshop on Machine Learning for Signal Processing, Kittila, Finland, 29 August–1 September 2010; pp. 337–342. [Google Scholar]
- Xie, S.; Krishnan, S. Model based sparse feature extraction for biomedical signal classification. Int. J. Stat. Med. Res. 2017, 6, 10–21. [Google Scholar] [CrossRef]
- Chen, D.; Wan, S.; Xiang, J.; Bao, F.S. A high-performance seizure detection algorithm based on discrete wavelet transform (dwt) and eeg. PLoS ONE 2017, 12, e0173138. [Google Scholar] [CrossRef] [PubMed] [Green Version]
- Subasi, A. Eeg signal classification using wavelet feature extraction and a mixture of expert model. Expert Syst. Appl. 2007, 32, 1084–1093. [Google Scholar] [CrossRef]
- Siuly, S.; Li, Y. Designing a robust feature extraction method based on optimum allocation and principal component analysis for epileptic eeg signal classification. Comput. Methods Programs Biomed. 2015, 119, 29–42. [Google Scholar] [CrossRef] [PubMed]
- Faust, O.; Acharya, U.R.; Adeli, H.; Adeli, A. Wavelet-based eeg processing for computer-aided seizure detection and epilepsy diagnosis. Int. J. Eng. Res. Appl. 2017, 7, 39–41. [Google Scholar] [CrossRef] [PubMed] [Green Version]
- Kaleem, M.; Guergachi, A.; Krishnan, S. Patient-specific seizure detection in long-term eeg using wavelet decomposition. Biomed. Signal Process. Control 2018, 46, 157–165. [Google Scholar] [CrossRef]
- Kaleem, M.; Gurve, D.; Guergachi, A.; Krishnan, S. Patient-specific seizure detection in long-term eeg using signal-derived empirical mode decomposition (emd)-based dictionary approach. J. Neural Eng. 2018, 15, 056004. [Google Scholar] [CrossRef] [PubMed]
- Matin, A.; Bhuiyan, R.A.; Shafi, S.R.; Kundu, A.K.; Islam, M.U. A hybrid scheme using pca and ica based statistical feature for epileptic seizure recognition from eeg signal. In Proceedings of the 2019 Joint 8th International Conference on Informatics, Electronics & Vision (ICIEV) and 2019 3rd International Conference on Imaging, Vision & Pattern Recognition (icIVPR), Cheney, WA, USA, 26–29 April 2019; pp. 301–306. [Google Scholar]
- Hamaneh, M.B.; Chitravas, N.; Kaiboriboon, K.; Lhatoo, S.D.; Loparo, K.A. Automated removal of ekg artifact from eeg data using independent component analysis and continuous wavelet transformation. IEEE Trans. Biomed. Eng. 2014, 61, 1634–1641. [Google Scholar] [CrossRef] [PubMed]
- Subasi, A.; Gursoy, M.I. Eeg signal classification using pca, ica, lda and support vector machines. Expert Syst. Appl. 2010, 37, 8659–8666. [Google Scholar] [CrossRef]
- Kevric, J.; Subasi, A. The effect of multiscale pca de-noising in epileptic seizure detection. J. Med. Syst. 2014, 38, 131. [Google Scholar] [CrossRef] [PubMed]
- Xie, S.; Krishnan, S. Wavelet-based sparse functional linear model with applications to eegs seizure detection and epilepsy diagnosis. Med. Biol. Eng. Comput. 2013, 51, 49–60. [Google Scholar] [CrossRef] [PubMed]
- Tsipouras, M.G. Spectral information of eeg signals with respect to epilepsy classification. EURASIP J. Adv. Signal Process. 2019, 2019, 10. [Google Scholar] [CrossRef] [Green Version]
- Xie, S.; Lawniczak, A. Feature extraction of epileptic eeg in spectral domain via functional data analysis. In Proceedings of the ICPRAM, Prague, Czech Republic, 19–21 February 2019. [Google Scholar]
- Xie, S.; Lawniczak, A.T. Fourier spectral domain functional principal component analysis of eeg signals. In Proceedings of the International Conference on Pattern Recognition Applications and Methods, Prague, Czech Republic, 19–21 February 2019; pp. 3–22. [Google Scholar]
- Pohl, M.; Wiltner, S.; Rind, A.; Aigner, W.; Miksch, S.; Turic, T.; Drexler, F. Patient development at a glance: An evaluation of a medical data visualization. In Proceedings of the IFIP Conference on Human-Computer Interaction, Lisbon, Portugal, 5–9 September 2011; pp. 292–299. [Google Scholar]
- Xie, S.; Krishnan, S. Feature extraction of epileptic eeg using wavelet power spectra and functional pca. In Proceedings of the 2019 41st Annual International Conference of the IEEE Engineering in Medicine and Biology Society (EMBC), Berlin, Germany, 23–27 July 2019; pp. 2551–2554. [Google Scholar]
- Ramsay, J.O. Functional data analysis. In Encyclopedia of Statistical Sciences; John Wiley & Sons: Hoboken, NJ, USA, 2004; Volume 4. [Google Scholar]
- Torrence, C.; Compo, G.P. A practical guide to wavelet analysis. Bull. Am. Meteorol. Soc. 1998, 79, 61–78. [Google Scholar] [CrossRef] [Green Version]
- Jolliffe, I. Principal component analysis. In International Encyclopedia of Statistical Science; Springer: Berlin/Heidelberg, Germany, 2011; pp. 1094–1096. [Google Scholar]
- Ramsay, J. Functional data analysis. In Encyclopedia of Statistics in Behavioral Science; John Wiley & Sons: Hoboken, NJ, USA, 2005. [Google Scholar]
- Wang, J.L.; Chiou, J.M.; Müller, H.G. Functional data analysis. Annu. Rev. Stat. Appl. 2016, 3, 257–295. [Google Scholar] [CrossRef] [Green Version]


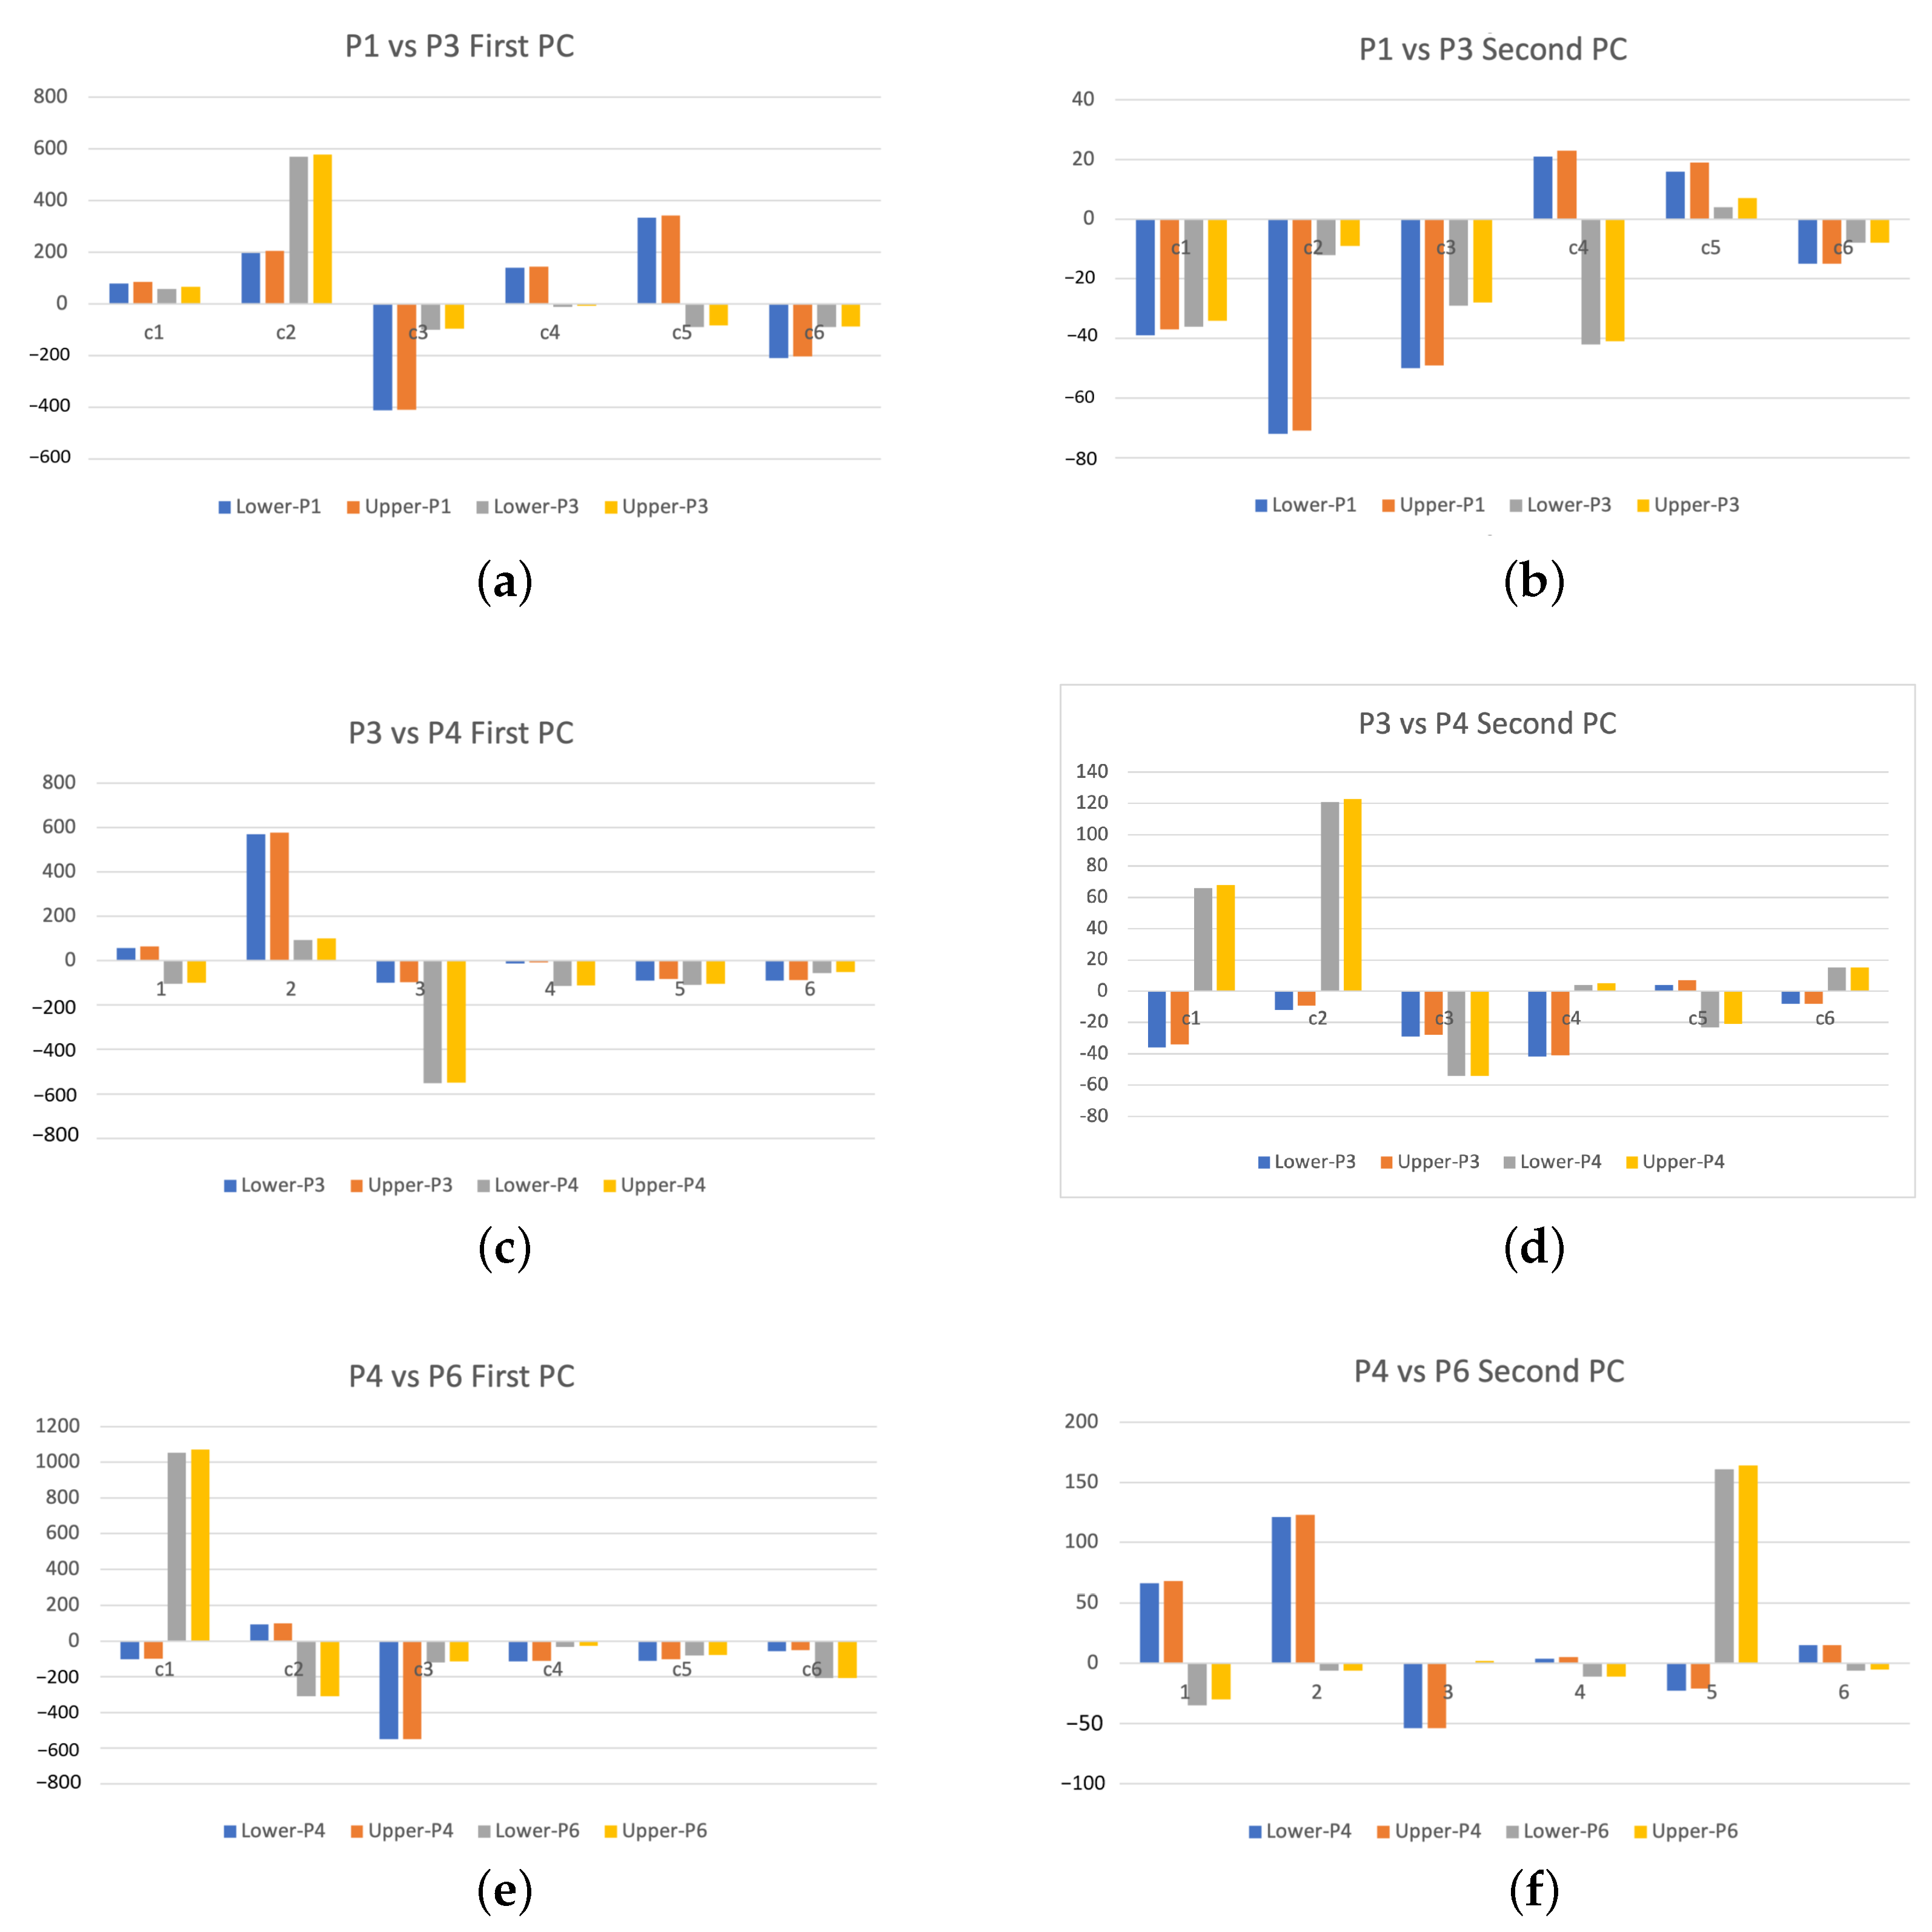
| First PC | Second PC | Third PC | |||||
|---|---|---|---|---|---|---|---|
| Patient | Channel | Lower | Upper | Lower | Upper | Lower | Upper |
| P1 | c1 | 79 | 84 | −39 | −37 | 0 | 2 |
| c2 | 196 | 204 | −72 | −71 | −9 | −7 | |
| c3 | −412 | −410 | −50 | −49 | 1 | 1 | |
| c4 | 140 | 144 | 21 | 23 | −1 | 0 | |
| c5 | 333 | 341 | 16 | 19 | −5 | 1 | |
| c6 | −209 | −204 | −15 | −15 | −18 | −17 | |
| P3 | c1 | 57 | 65 | −36 | −34 | −2 | −1 |
| c2 | 569 | 577 | −12 | −9 | −1 | 1 | |
| c3 | −100 | −96 | −29 | −28 | −12 | −11 | |
| c4 | −13 | −7 | −42 | −41 | −7 | −6 | |
| c5 | −90 | −83 | 4 | 7 | −8 | −6 | |
| c6 | −89 | −88 | −8 | −8 | −2 | −1 | |
| P4 | c1 | −103 | −99 | 66 | 68 | −2 | 0 |
| c2 | 94 | 100 | 121 | 123 | −9 | −8 | |
| c3 | −551 | −550 | −54 | −54 | 1 | 2 | |
| c4 | −114 | −112 | 4 | 5 | 1 | 1 | |
| c5 | −110 | −103 | −23 | −21 | 6 | 7 | |
| c6 | −57 | −51 | 15 | 15 | 12 | 13 | |
| P6 | c1 | 1053 | 1071 | −35 | −30 | 0 | 4 |
| c2 | −309 | −309 | −6 | −6 | −1 | −1 | |
| c3 | −119 | −113 | 0 | 2 | 3 | 4 | |
| c4 | −33 | −27 | −11 | −11 | 25 | 27 | |
| c5 | −80 | −77 | 161 | 164 | 1 | 2 | |
| c6 | −208 | −207 | −6 | −5 | 0 | 0 |
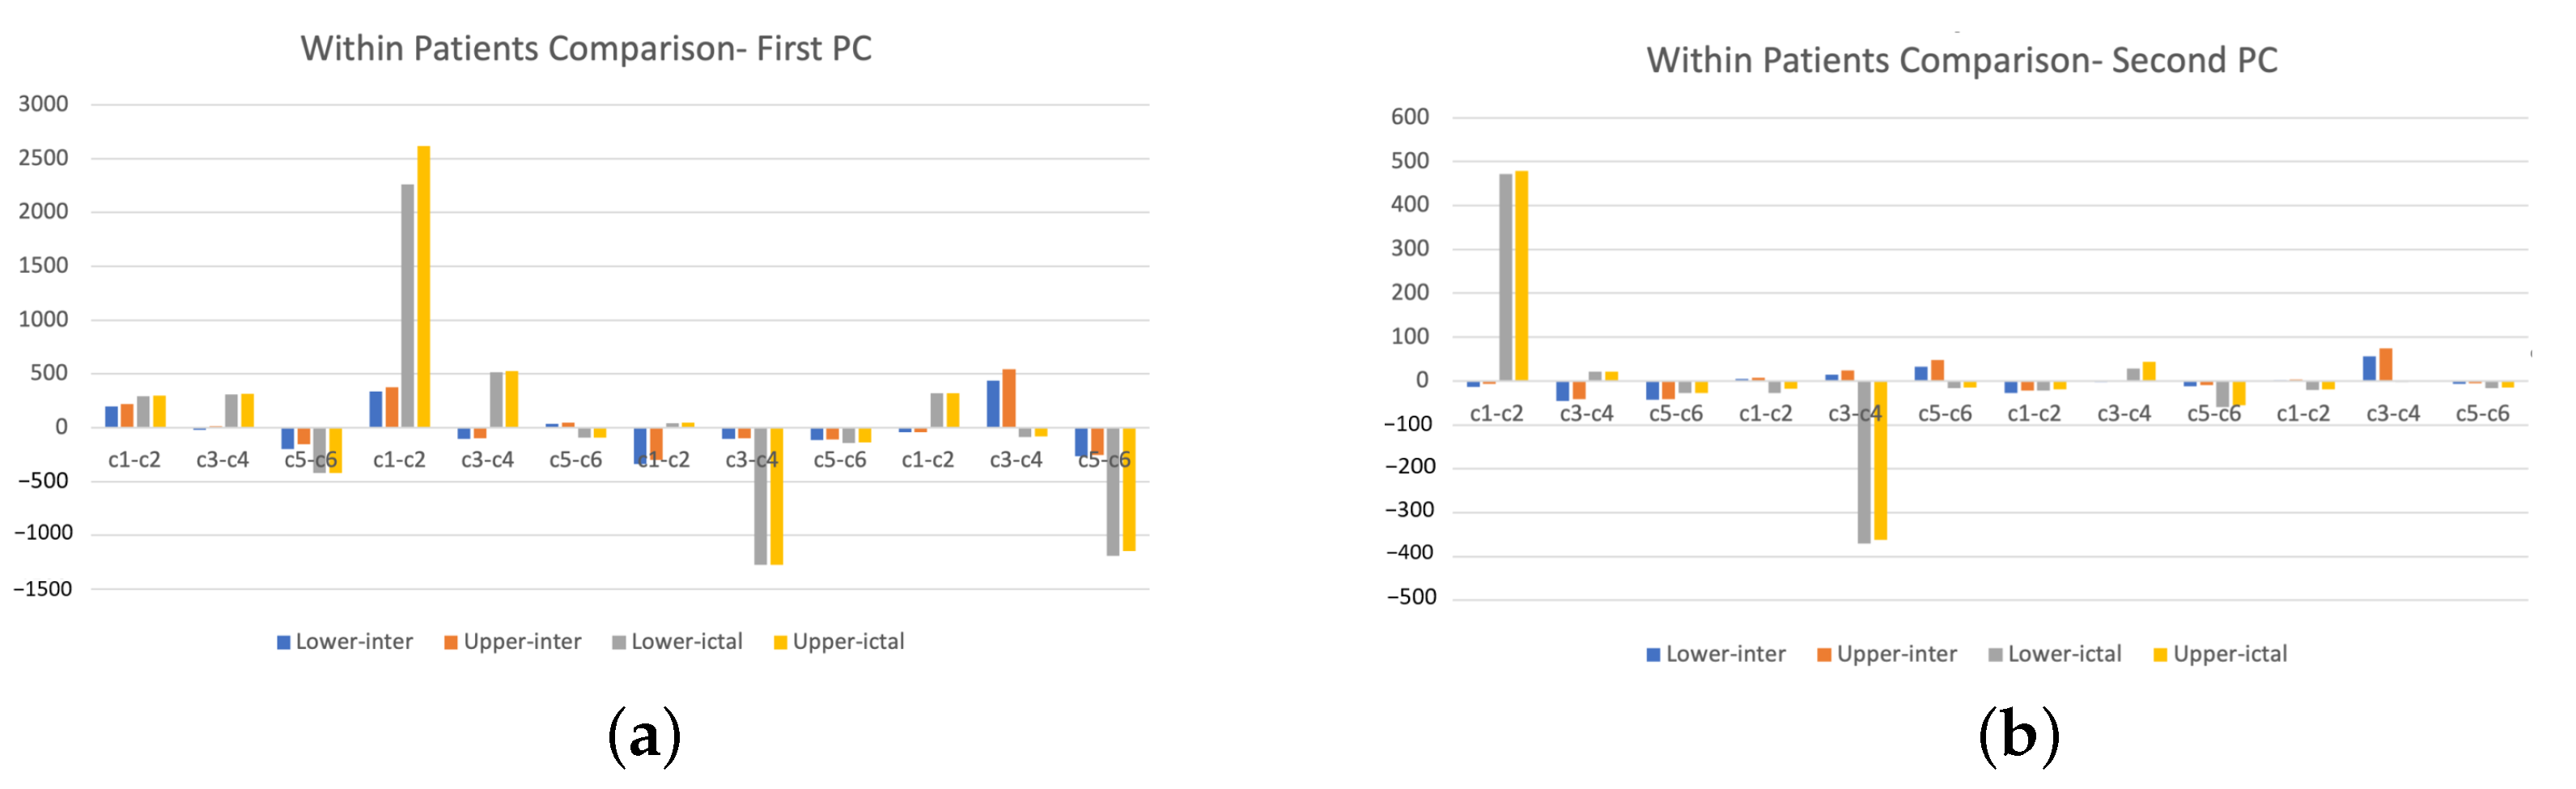
| Interictal | Ictal | Interictal | Ictal | ||||||
|---|---|---|---|---|---|---|---|---|---|
| First PC | First PC | Second PC | Second PC | ||||||
| Patients | Channel | Lower | Upper | Lower | Upper | Lower | Upper | Lower | Upper |
| #1 | c1–c2 | 197 | 221 | 291 | 297 | −13 | −7 | 472 | 479 |
| c3–c4 | −22 | 16 | 310 | 313 | −46 | −41 | 21 | 22 | |
| c5–c6 | −197 | −153 | −422 | −419 | −43 | −41 | −28 | −27 | |
| #3 | c1–c2 | 337 | 377 | 2264 | 2617 | 4 | 7 | −28 | −17 |
| c3–c4 | −101 | −98 | 516 | 525 | 15 | 24 | −371 | −362 | |
| c5–c6 | 38 | 49 | −94 | −93 | 32 | 48 | −16 | −15 | |
| #4 | c1–c2 | −340 | −297 | 41 | 49 | −27 | −22 | −22 | −19 |
| c3–c4 | −102 | −99 | −1273 | −1272 | −2 | −1 | 29 | 44 | |
| c5–c6 | −113 | −109 | −143 | −139 | −12 | −9 | −60 | −56 | |
| #6 | c1–c2 | −44 | −40 | 319 | 321 | 1 | 3 | −21 | −19 |
| c3–c4 | 439 | 545 | −87 | −81 | 56 | 74 | −3 | 0 | |
| c5–c6 | −263 | −253 | −1191 | −1148 | −6 | −5 | −16 | −15 |
Publisher’s Note: MDPI stays neutral with regard to jurisdictional claims in published maps and institutional affiliations. |
© 2021 by the author. Licensee MDPI, Basel, Switzerland. This article is an open access article distributed under the terms and conditions of the Creative Commons Attribution (CC BY) license (https://creativecommons.org/licenses/by/4.0/).
Share and Cite
Xie, S. Wavelet Power Spectral Domain Functional Principal Component Analysis for Feature Extraction of Epileptic EEGs. Computation 2021, 9, 78. https://doi.org/10.3390/computation9070078
Xie S. Wavelet Power Spectral Domain Functional Principal Component Analysis for Feature Extraction of Epileptic EEGs. Computation. 2021; 9(7):78. https://doi.org/10.3390/computation9070078
Chicago/Turabian StyleXie, Shengkun. 2021. "Wavelet Power Spectral Domain Functional Principal Component Analysis for Feature Extraction of Epileptic EEGs" Computation 9, no. 7: 78. https://doi.org/10.3390/computation9070078
APA StyleXie, S. (2021). Wavelet Power Spectral Domain Functional Principal Component Analysis for Feature Extraction of Epileptic EEGs. Computation, 9(7), 78. https://doi.org/10.3390/computation9070078