Article

Performance of Overset Mesh in Modeling the Wake of Sharp-Edge Bodies

Department of Mechanical Engineering, University of Alberta, Edmonton, AB T6G 2R3, Canada
*
Author to whom correspondence should be addressed.
These authors contributed equally to this work.
Computation 2020, 8(3), 66; https://doi.org/10.3390/computation8030066
Submission received: 10 June 2020 / Revised: 4 July 2020 / Accepted: 9 July 2020 / Published: 13 July 2020
(This article belongs to the Section Computational Engineering)

Abstract

:
The wake dynamics of sharp-edge rigid panels is examined using Overset Grid Assembly (OGA) utilized in OpenFOAM, an open-source platform. The OGA method is an efficient solution technique based on overlap of a single or multiple moving grids on a stationary background grid. Five test cases for a stationary panel at different angle of attack are compared with available computational data, which show a good agreement in predicting global flow variables, such as mean drag. The models also provided accurate results in predicting the main flow features and structures. The flow past a pitching square panel is also investigated at two Reynolds numbers. The study of surface pressure distribution and shear forces acting on the panel suggests that a higher streamwise pressure gradient exists for the high Reynolds number case, which leads to an increase in lift, whereas the highly viscous effects at low Reynolds number lead to an increased drag production. The wake visualizations for the stationary and pitching motion cases show that the vortex shedding and wake characteristics are captured accurately using the OGA method.

1. Introduction

The study of flow over stationary and moving bodies has been an important area of investigation in fluid mechanics which dates back to the pioneering work of Karman [1]. Studies related to the flow around cylinders and other prominent bluff bodies have been more thoroughly dealt with compared to two-dimensional (2D) and three-dimensional (3D) flat panels and foils [2,3]. Oscillating hydrofoils are commonly investigated for various industrial applications including underwater propulsors, marine propellers and bio-inspired ocean profilers [4,5]. These applications commonly experience vibratory or steady uniform loading, which is most often a direct consequence of flow separation and vortex detachment [3,6].
Several experimental studies have laid out the foundation for general characteristics of wake around bodies [2,3,6,7]. The study of Fage et al. [8], provided an in depth understanding of the vortex shedding phenomenon in the wake of inclined flat plates at different angles of attack. Flow features such as the size of vortex structures [8], rate at which they are shed, their separation from the body and their movement in the wake [8], formed the basis of research in this field. Ohmi et al. [6] experimentally examined the complex vortex formation mechanisms around unsteady airfoils subjected to oscillating and translating motion. Changes in the wake interaction process were identified at different combinations of Reynolds number, reduced frequency, amplitude and pitching angle. Three dimensionality and phase changes between different combination of motion motivated experimental studies. For example, generation of leading edge and trailing edge vortices on finite span wings and their shedding patterns at different Strouhal numbers was explored by Ellenrieder et al. [4]. Buchholz et al. [7] explained that in the case of low aspect ratio pitching panels, there is an inherent dependence of wake structures on shape parameters of the body. The characteristics of both streamwise and spanwise vorticity were explored using a wake model [7]. The difference between the wake structures in flow over two dimensional foils and the finite span foils was investigated by Ellenrieder et al. [9]. The airfoils undergoing a heaving motion were studied using dye flow visualization. The development of computing resources enabled detailed wake dynamics analysis using computational fluid dynamics, particularly Large eddy simulations (LES) and Direct numerical simulations (DNS).
Blondeaux’s study on in-line and transverse oscillating cylinders [10] highlighted the capabilities of numerical simulations in explaining the features of vortex shedding. These results were further validated by Senturk et al. [11] using Immersed Boundary Method (IBM) to model the wake of moving and oscillating bodies. The changes in the vortex dynamics around pitching square panels at different Reynolds numbers was also explored by Senturk et al. [12]. Using a modified solver based on OpenFOAM, they provided insights into unsteady pressure variations on the panel surfaces [12]. Thrust and efficiency, which were the major parameters observed in oscillating foils were also investigated numerically. Lewin et al. [13] studied heaving foils to obtain frequencies corresponding to maximum efficiency. Their description of the interactions between leading and trailing edge vortices indicated that higher thrust and efficiency can be obtained if strength of the trailing edge vortex is supplemented by the detached leading edge vortex [13]. The vortex dynamics of oscillating foils with combined heaving and pitching motion was investigated by Guglielmini et al. [5]. This study provided insight on how the combination of pitching and heaving motion results in higher thrust and efficiency.
Dynamic mesh morphing, arbitrary mesh interface (AMI) and sliding grid interface method are three of the most common methods in simulating moving bodies with a broad engineering application such as rotating turbines, floating and oscillatory bodies in fluids [14,15]. The concept of Overset meshes has also been implemented in some rotorcraft [16] and hydrodynamic applications [17,18]. Dominic et al. [19] discussed and compared three dynamic grid techniques in OpenFOAM, namely AMI, generalized grid interface (GGI), and an in-house Overset method. This study identified that Overset method offered comparable results to other established techniques, with an increase in efficiency of parallel computing [19]. Park et al. [16] had demonstrated a new in-house Overset implementation for exploring the complex aerodynamic wake interactions between stationary fuselage and a rotating blade of a Rotorcraft. The adaptive overset methodology was able to provide insight into the vortex-fuselage impingement phenomenon [16], which was not observed using any existing dynamic mesh methods. Liu et al. [20] detailed the functionality of an in-house CFD solver, which implemented an unstructured overset meshing capability. This overset methodology applied to both viscid and inviscid flows, including dynamic motion cases such as a moving valve, pitching airfoil and more complex flows around butterfly valves. The results of the new method compared well with the corresponding experimental observations [21].
Here, we provide benchmark results for the wake of finite aspect ratio stationary and pitching panels, using the overset solution technique implemented in OpenFOAM. The requirement of smaller grids in overset method, as seen in a study by Aarnes et al. [22] for simulating flows over two dimensional bodies, highlighted its potentially better computational efficiency compared to other techniques, such as IBM [11,23]. We therefore utilize OGA method for simulating flows over three dimensional square panels. A total of seven case studies are performed and presented in this paper. The details of the studies are provided in the next section. The computational setup and boundary conditions, which were utilized for simulating the flow field, are then explained. A brief description of the Overset methodology, utilized by the solver, is provided for clarity. This is followed by discussion of the wake in terms of quantitative and qualitative vortex characteristics that influence the surface pressure and force distributions. Investigation into parallel scalability features further provided evidence on the effective functionality of the Overset grid assembly technique implemented in OpenFOAM with respect to parallel processing and accurate modeling of the wake of underwater swimming systems.

2. Problem Description

The performance of overset solution technique was evaluated by directly solving the Navies–Stokes equations, in case studies related to unsteady wake dynamics in hydrodynamic applications, such as swimming of fish and propulsors.

2.1. Cases 1–5

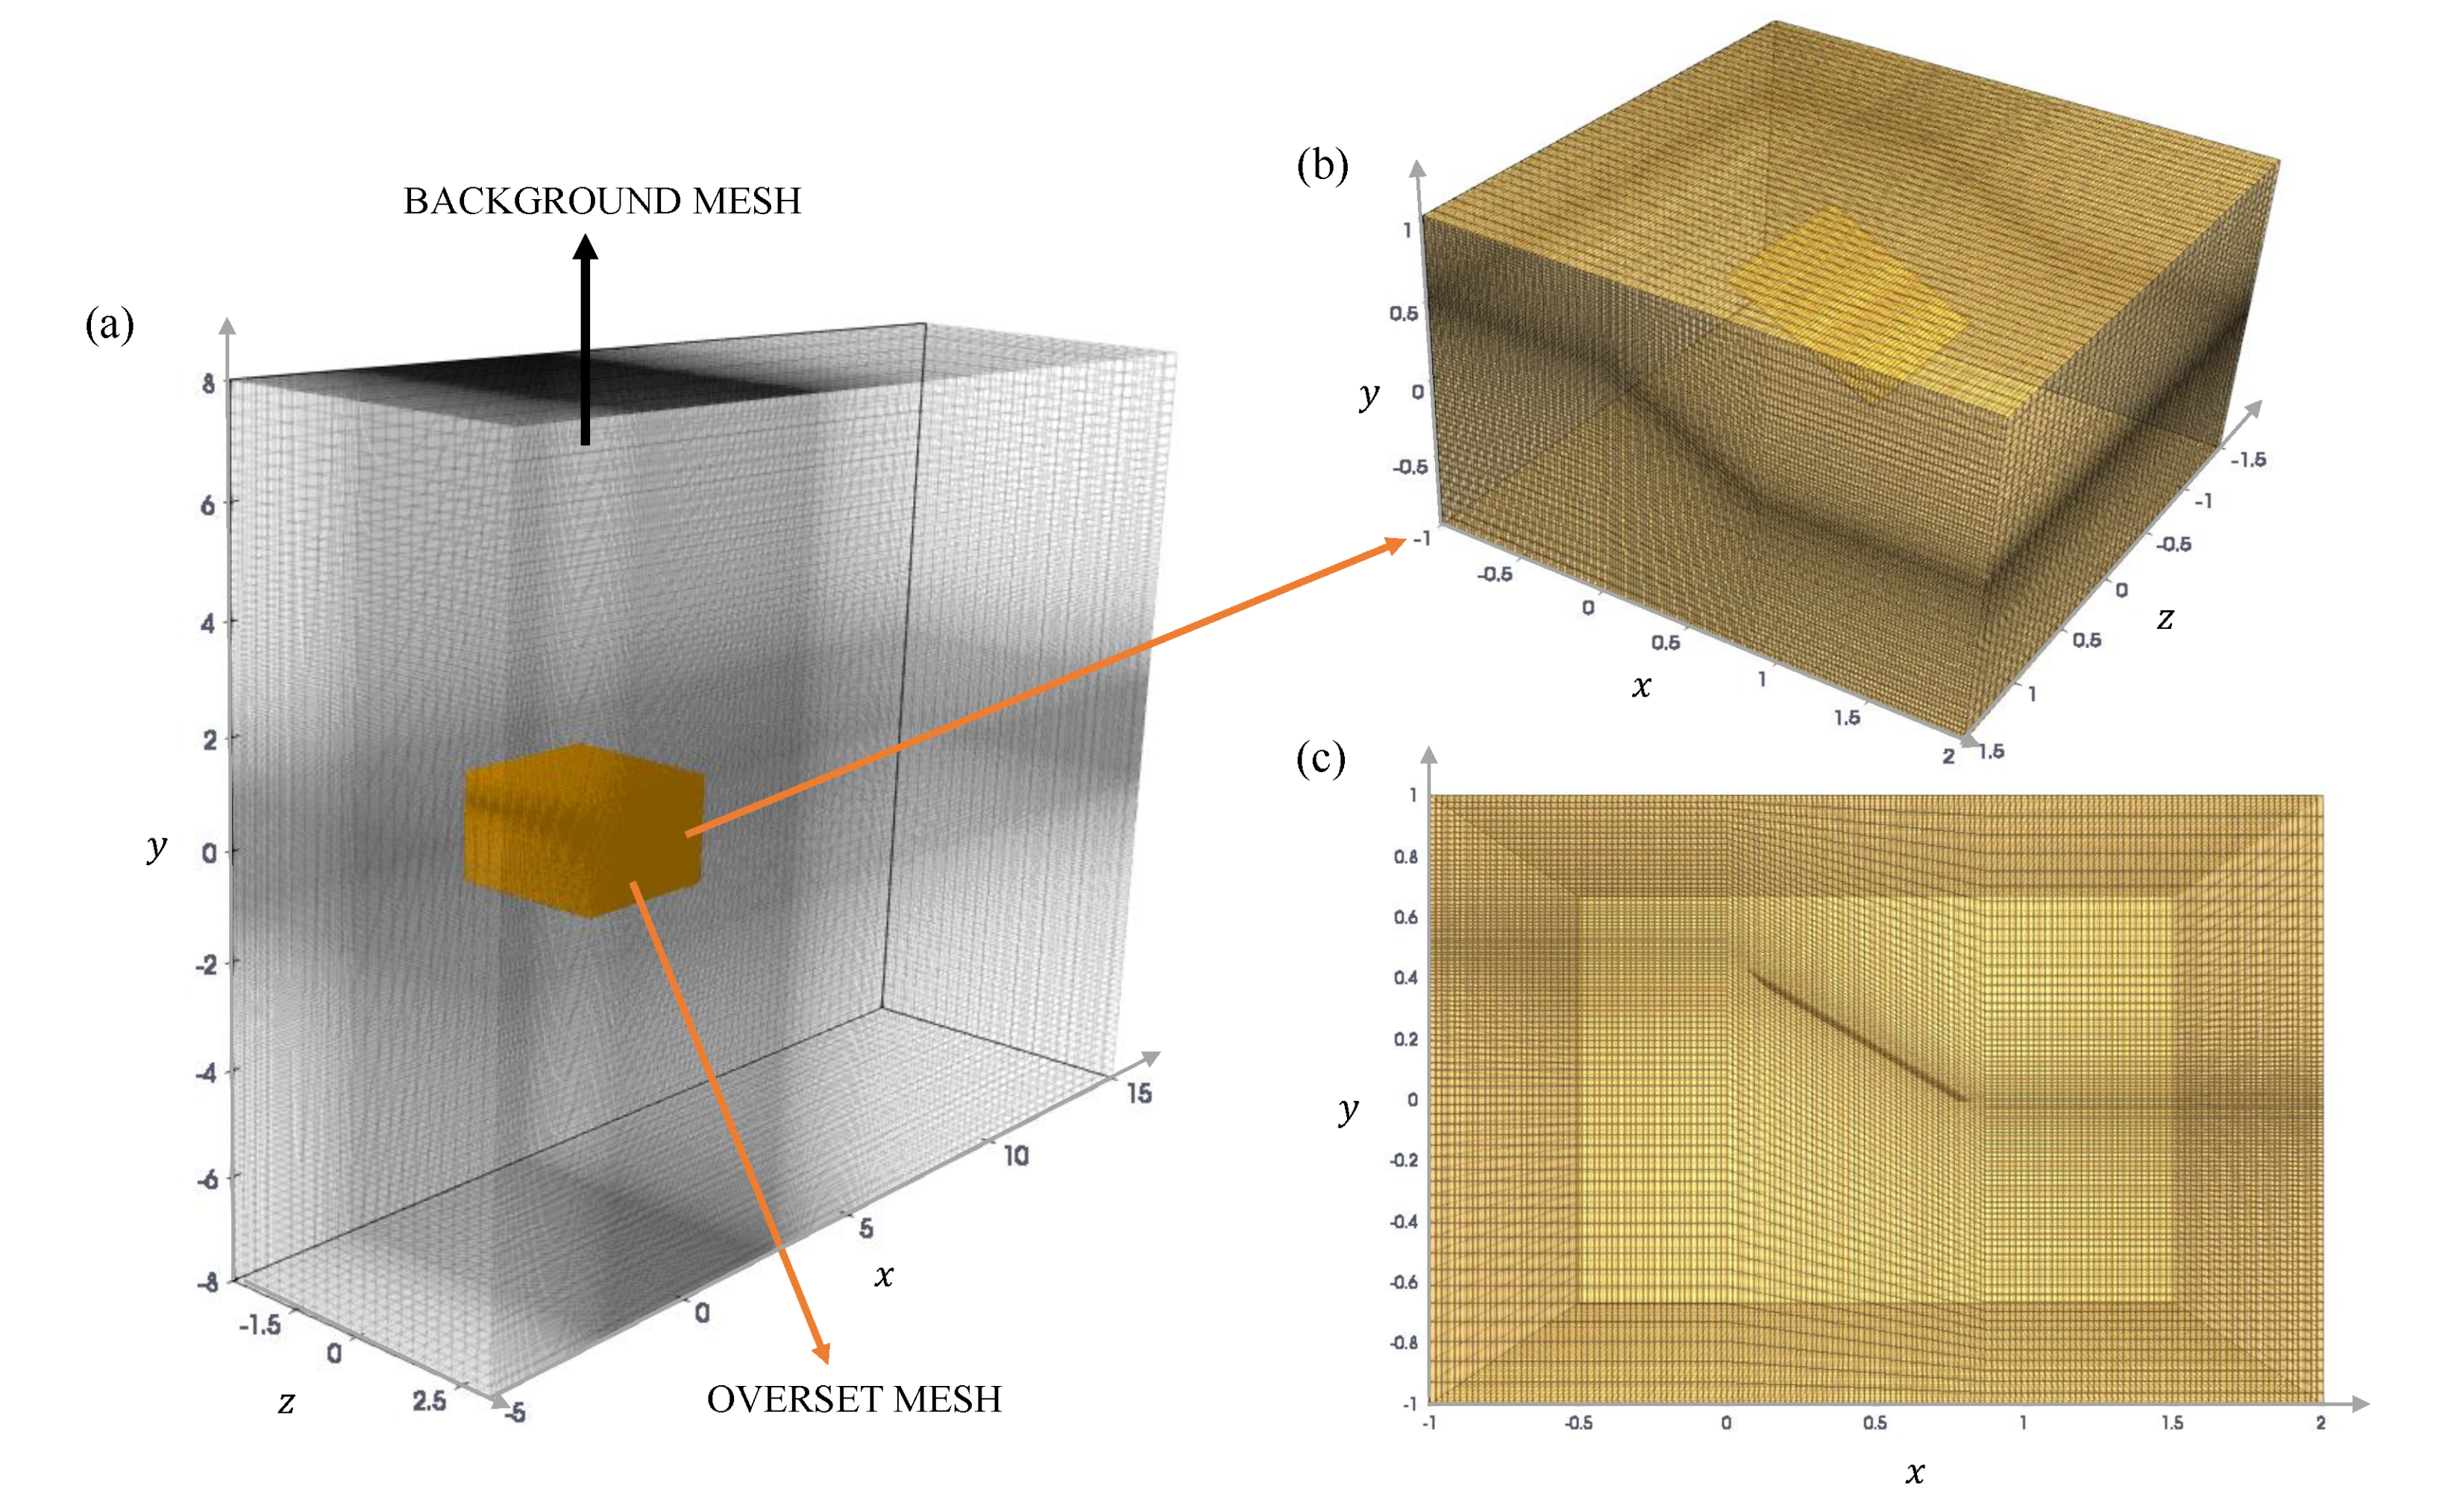
The initial case studies comprise of flow past a 3D stationary square panel. Five cases are considered (Table 1), in which the panel was kept at angles varying from 0 to 60 (in intervals of 15 ), to the incoming freestream flow. A rectangular computational domain was used with dimensions 20 c × 16 c × 6.28 c in the x (streamwise), y (cross-flow) and z (spanwise) directions, respectively (Figure 1). This domain size ensured that 2 or 3 vortex pairs are captured in the wake and minimizes the effects of side and top boundaries on the wake characteristics [24,25]. This domain size follows past numerical studies that investigate the three-dimensional wake characteristics behind normal thin flat plates [24,25] and flapping foils [26,27,28]. The spatial grid consisted of an inhomogeneous grid, with finer mesh around the body and coarser mesh closer to the domain boundaries (Figure 2). A secondary grid was set over the background grid, which had a mesh spacing equal to the corresponding spacing observed in the background mesh.
The Reynolds number was 300, where R e = U c / ν , U is the freestream velocity, c is the chord length, and ν is the kinematic viscosity. This R e was similar to the cases studied by Taira et al. [23] and Senturk et al. [11]. Grids used in the current simulations required finer resolution near the flat panel, where the critical wake features dominate the flow (Figure 2). The secondary or “overset” mesh consists of the panel geometry. The panel is modeled to be infinitely thin with its thickness equal to the minimum spatial grid element size, which resembles the shape of a beveled panel, following the simulations of Najjar et al. [24], Narasimhamurthy et al. [29], Hemmati et al. [30], and Hemmati and Smits [31]. The dimensions of this mesh extend from 1 c to 2 c in the x direction, 1 c to 1 c in the y direction, and 1.5 c to 1.5 c in the z direction.
The quantitative analysis of the wake of stationary panel was based on measuring the mean drag coefficient defined as C d ¯ = 2 F x ¯ / ( ρ U 2 S c ) , where F x ¯ is the mean force acting on the panel in the streamwise direction, S is the span and c is chord length of the panel.

2.2. Cases 6–7

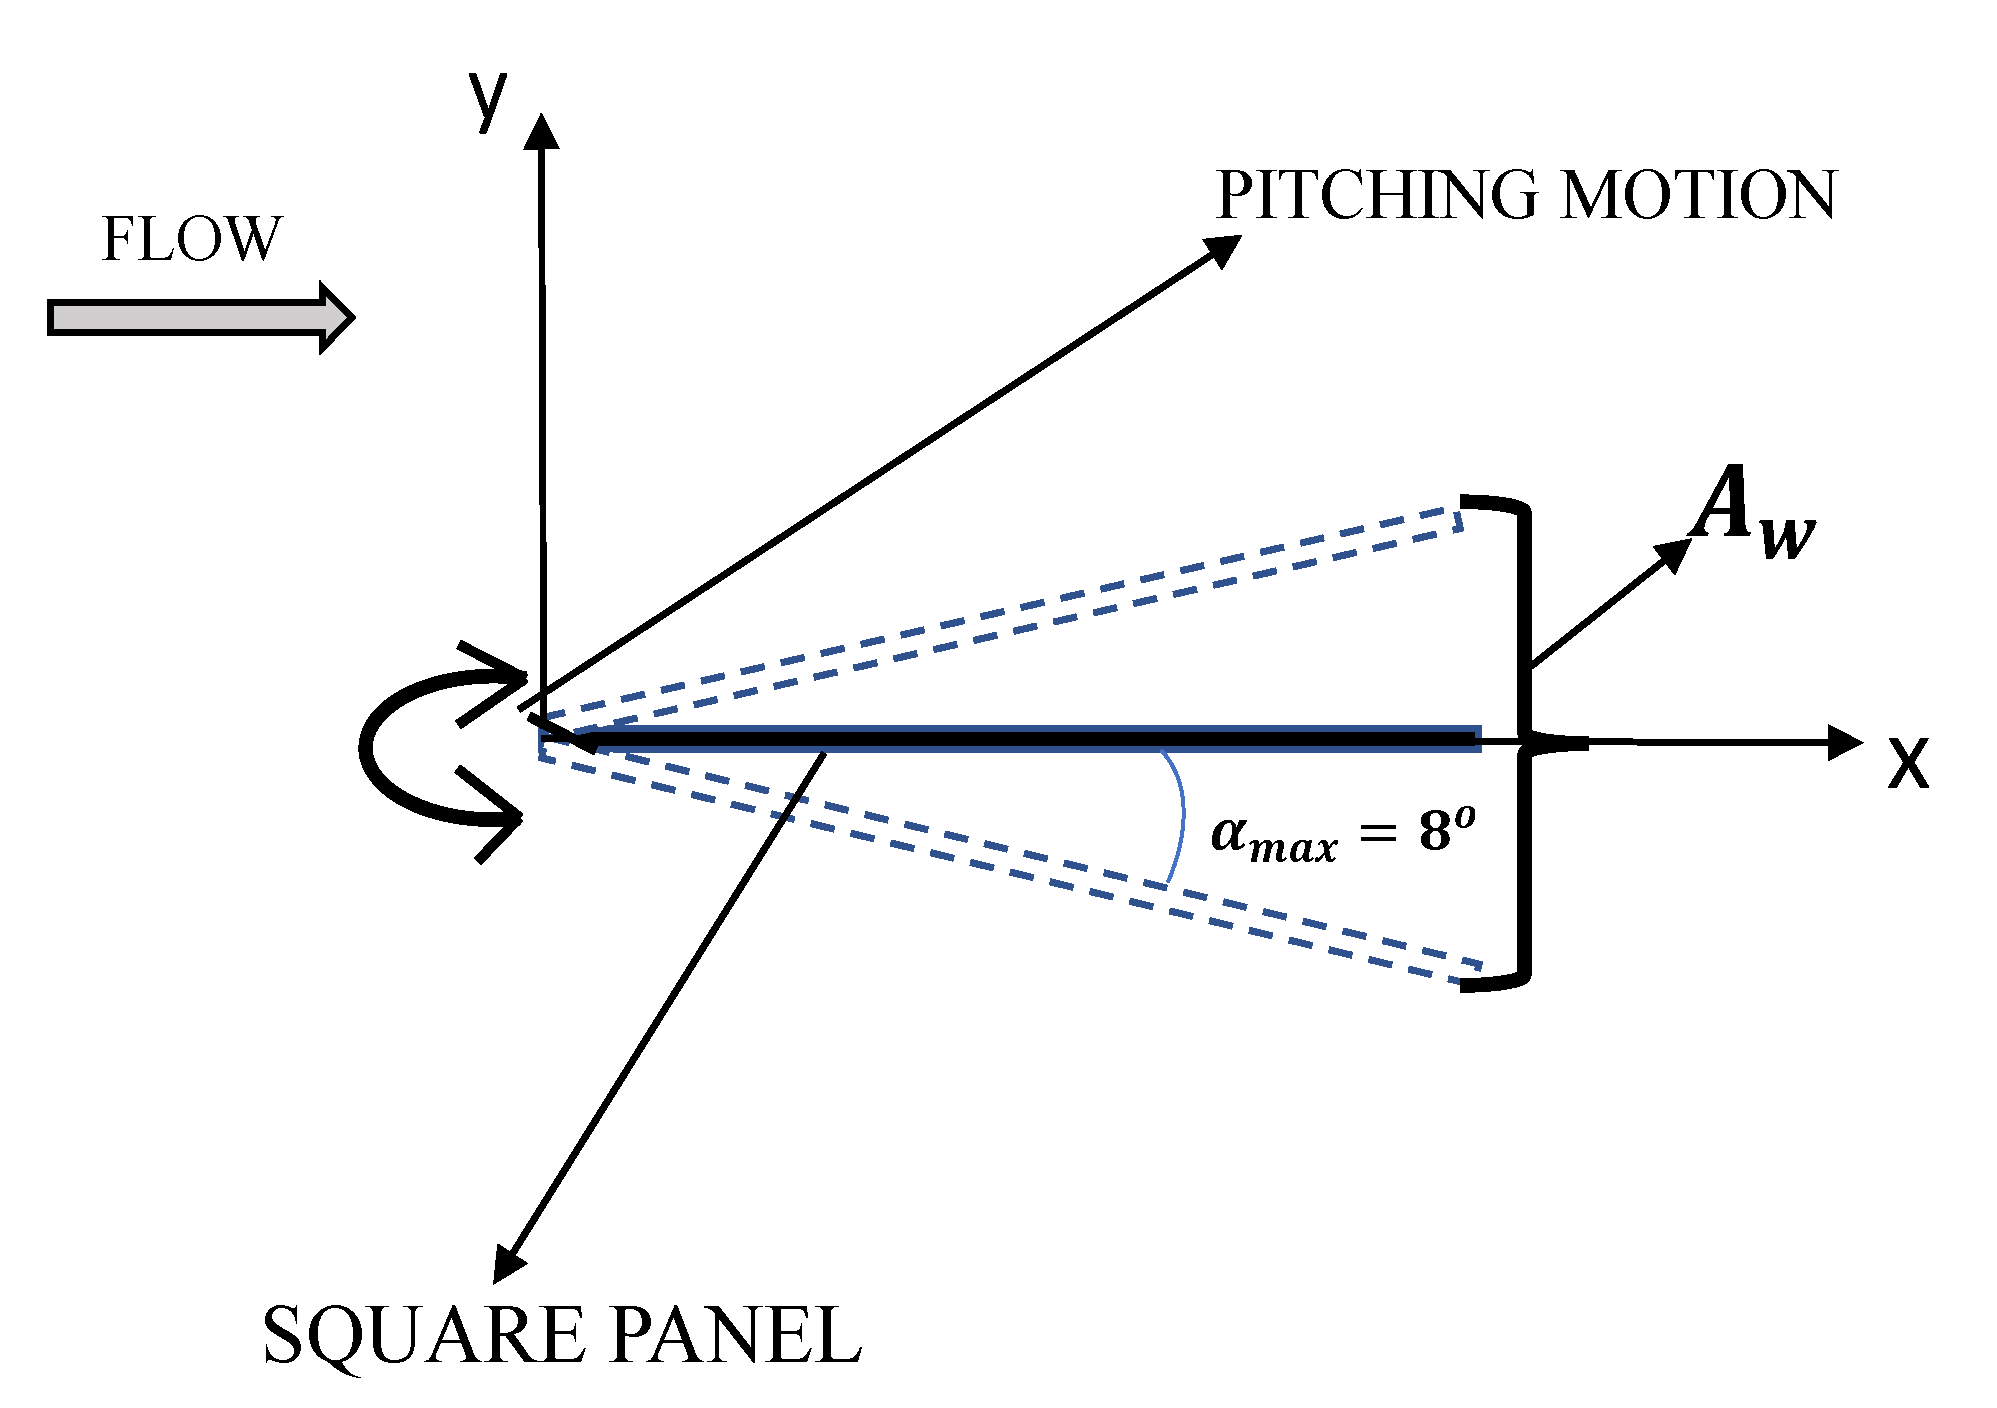
The wake of a pitching square panel is simulated at Reynolds number of 500 and 2000 (Table 1). These Reynolds numbers allow for a direct comparison of results with Senturk et al. [11,12], which simulated the flow using a viscous flow solver and Immersed Boundary method (IBM) in OpenFOAM. The Strouhal number ( S t = f A w / U ), where f and A w are the oscillation frequency and the wake width, respectively was kept constant at 0.2. This generally promotes production of drag force instead of thrust [7,11].
The pitching motion is modeled as a sinusoidal function about a point located at 0.1c downstream of the panel’s leading edge, based on:
α ( t ) = α max sin ( 2 π t T )
Here, α max is the maximum amplitude. For the pitching motion defined in this study, the value of α max was fixed at 8 degrees. A general description of motion is depicted in Figure 3.

2.3. Governing Equations

The three-dimensional incompressible Navies–Stokes and continuity equations were solved using the finite volume discretization method implemented in OpenFOAM:
u i x i = 0
u i t + u j u i x j = 1 ρ p x i + ν 2 u i x j x j .
Here, u i is the velocity, p is pressure, ρ is density and υ is the kinematic viscosity of the fluid. All the flow parameters were normalized using the freestream velocity ( U ) and chord length of the body (c).
The Poisson equation used for calculating pressure was defined as:
2 p = · Φ + φ ,
where, φ denotes the source term given by φ = · ϕ + 2 p . Here, p and ϕ represent the pressure and mass flux defined for the cells lying on the interface of overlapping grids. Further details on the Poisson equation formulations for the overset grids can be found in Dominic [15].

2.4. Computational Setup and Boundary Conditions

The computational setup for an overset solver generally consists of a primary solution domain and either a single or multiple secondary grids, which are overlapping the primary domain (background grid). This allow users to mesh multiple complex geometries separately, and then merging those secondary meshes to the primary background grid for solving the dynamics of a complete system. This technique also provides flexibility in terms of defining different forms of motion for each secondary grid, or even assigning them as motion free. The current study features a single overlapping grid that was configured to be either moving (Cases 6–7) or stationary (Cases 1–5). The two meshes were assigned different zone identities (for example, zone 1 for moving and zone 0 for stationary grid), as per the solver requirements.
The Inlet boundary is located at 5 c from the body with a uniform velocity u = U . Further, the normal gradient of pressure at inlet was set to zero in the solution of pressure poisson equation similar to Najjar et al. [24]. At the outlet, a zero gradient (Neumann) velocity boundary condition was used to allow for the shed vortices to freely convect across the boundary, while the pressure was constant, similar to three-dimensional numerical studies on the wake of flapping foils [27,28] and normal thin flat plates [25]. In OpenFOAM, this boundary condition is designated to “zeroGradient” and “fixedValue” for velocity and pressure, respectively. It is located 15 c downstream of the panel’s leading edge. The side and top boundaries were assigned the slip boundary condition, which was also used by Senturk et al. [11] and Hemmati et al. [32] for their 3D simulations. The wall boundary condition for the panel was set to a “moving” no slip wall condition, which is used in dynamic motion study of rigid bodies [33]. The second order backward Euler scheme was used for time discretization. The spatial discretization was second order, and gradients and divergence terms were calculated using a second order accurate method.
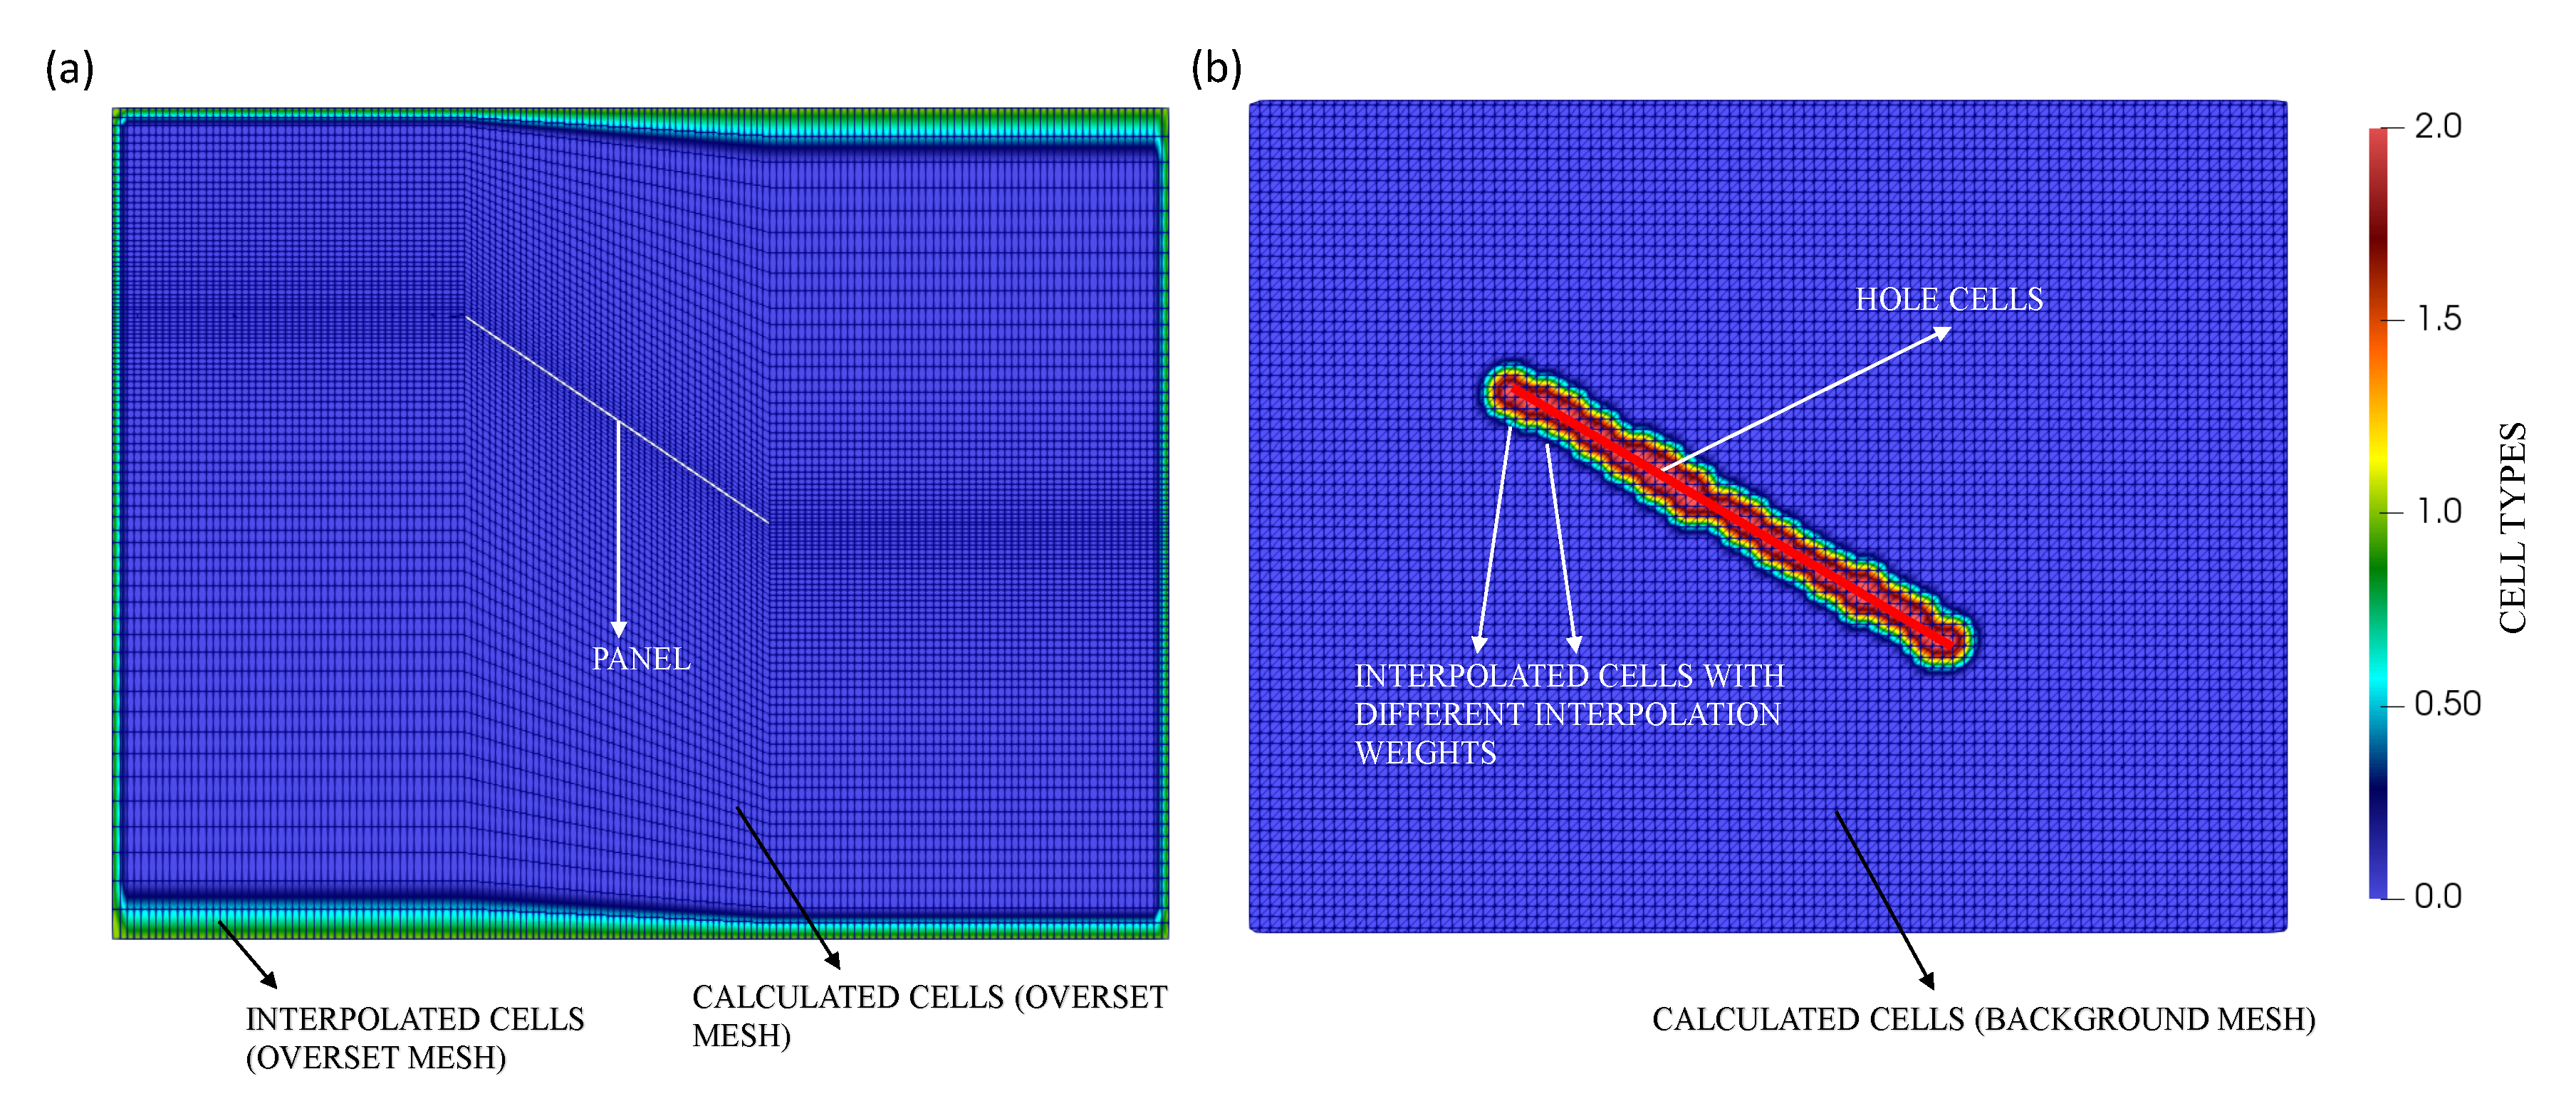
The simulations in this study utilized overset dynamic mesh solver, “overPimpleDyMFoam”, implemented in OpenFOAM. The solver is based on the Overset Grid Assembly (OGA) methodology, where different regions of overlapping meshes are attributed to calculated, interpolated and hole cells, respectively [34]. The automated identification of these cells (depicted in Figure 4) was by the solver at initial step of simulation. The steps are briefly explained below and detailed analysis of the algorithm is provided by Petra [34]:
  • Step (1): The addressing of all the cells which will act as neighbors (donors) to an acceptor cell is conducted by employing their index number defined within the mesh. The solver also identifies the fields (pressure, velocity and turbulence quantities) that are required for interpolation in acceptor cells on the background and the overset grids.
  • Step (2): Hole, interpolated and calculated cells are then set by the solver. Hole cells are generally identified in the underlying background or overset grid, which could be stationary or prescribed to execute a motion. They are governed by the secondary (overlapping) grid, which approximates the representation of wall boundary of moving body. The flow field is not solved within these cells. Interpolated cells require interpolation from donor cells, present on the overlapping regions of mesh, i.e., Interpolated cells lying on the background grid have their donors on overset grid and vice-versa. All the remaining cells that are not identified as interpolated or hole cells are assigned as calculated cells.
  • Step (3): The interpolation scheme specified by the user is used by the solver to perform interpolation from field values of identified donor cells. For instance, if the scheme is specified to be inverse distance, a corresponding list of donor cells and their weights (calculated based on the distance between centroid of acceptor and donor cell) is supplied for each interpolated cell.
Several schemes are available for the performing overset interpolation and some schemes offer higher solution accuracy than others, as determined by Dominic [15], which are not available in OpenFOAM unlike commercial software packages and in-house codes, such as Opera [15] and SUGGAR++ [35]. The Inverse-Distance scheme in OpenFOAM-v1712 was selected for the overset interpolation. The potentially higher conservation errors in this method is compensated by using a refined overlapping grid and temporal grid, based on recommendations of Dominic [15]. An additional verification analysis for different overset interpolation schemes is carried out to illustrate the lower computational time requirement for Inverse-Distance scheme.
The combination of pressure implicit with splitting of operator (PISO), and semi-implicit method for pressure linked equations (SIMPLE) forms the PIMPLE solver, which is combined with the overset methodology (overPimpleDyMFoam) in OpenFOAM. The PIMPLE algorithm offers a better accuracy in capturing turbulent features of the flow [33] and allows for larger time step in transient simulations, comparatively [33]. Due to the large number of grids ( 2 × 10 7 hexahedral elements) for all the case studies presented here, the simulations of stationary panels (Cases 1–5) took an average of 360 h to reach statistical convergence. The simulations of pitching panels (Cases 6–7) reached statistical convergence after 10 cycles of pitching within 480 h of simulation time. All simulations for Cases 1–5 and Cases 6–7 utilized a single computing node on Compute Canada Cedar and Beluga clusters with 48 and 40 processors, respectively. Each simulation used a total of 187.05 GB of RAM, and 300 GB of data storage.

3. Results and Discussion

We begin by looking at the wake of stationary panels (Cases 1–5) and that of the flow around pitching panels (Cases 6–7). Numerous experimental studies had provided insight into the characteristics concerning circulation and flow separation, which provides a standard dataset for validation. Herein, the spatial coordinates and length scales are normalized using the panel chord length (c), such that x + = x / c , y + = y / c , and z + = z / c .

3.1. Stationary Panel

In order to have an optimum size for the grid and to sufficiently resolve the flow characteristics, grid independence analysis was also completed for the angle of attack ( α ) of 30 . Four different grids were selected and the ratio of minimum grid sizes in the streamwise ( x ) direction was kept constant, i.e., δ x 1 / δ x 2 1.5 ( δ x 2 is the minimum grid size for a fine mesh, while δ x 1 is the minimum grid size for the coarse mesh). The thickness of the panel was not altered for any cases, in which all panels constitute a zero-thickness plate. The four grids correspond to Grid-1, Grid-2, Grid-3 and Grid-4. The number of grid elements and mesh spacing parameters are defined in Table 2, where relative error shows the discrepancy with respect to [23]. Δ C d ¯ is calculated with respect to C d ¯ for a coarse grid, and for its subsequent finer grid.
The mean drag coefficient ( C d ¯ ) from Grid-4 compares well with that obtained by Taira et al. [23]. The relative error was less than 2%. The relative difference between the mean drag for two subsequent studies is shown in Table 2. The difference is less than 1% for Grid-3 and Grid-4. Spatial convergence is also obtained with respect to the mean drag, when comparing results in Table 2.
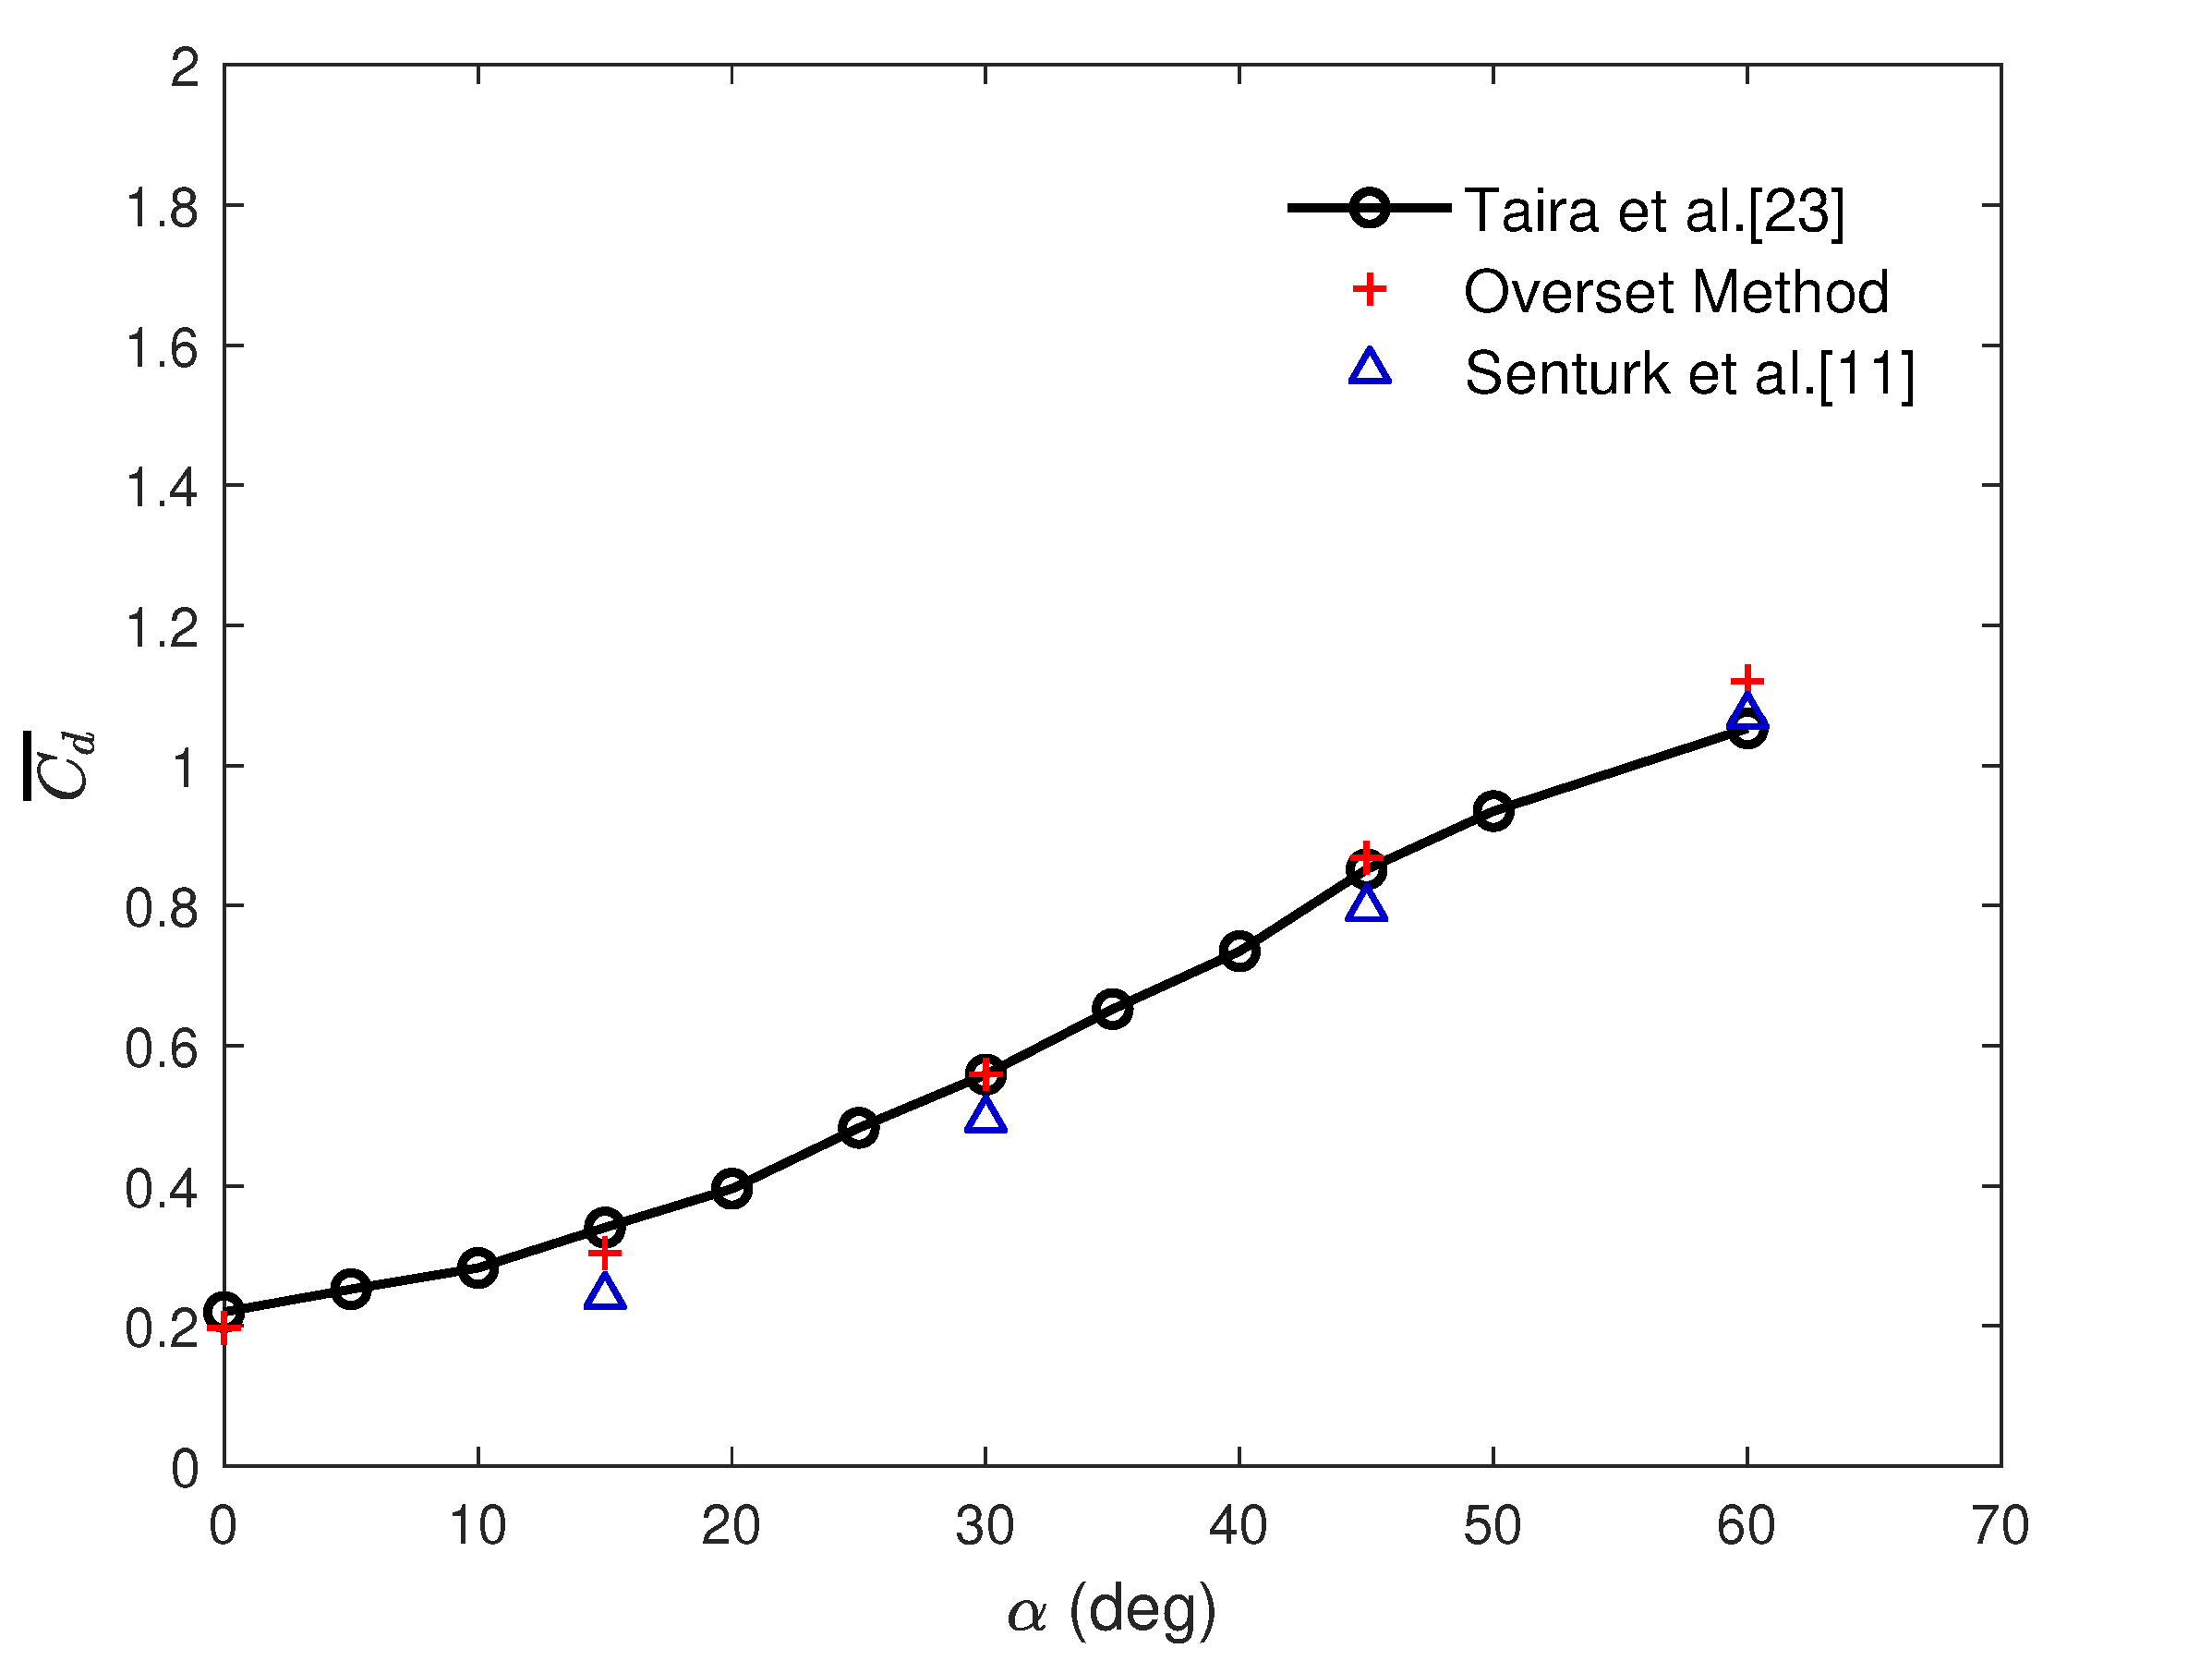
Therefore, the domain and overset mesh parameters of Grid-4 are sufficient for accurately simulating the wake. The results described here use the mesh from Grid-4. Figure 5 presents the mean coefficient of drag for stationary panel at different angles of attack. A good agreement was observed in C d ¯ for all angles of attack, compared to Taira et al. [23]. The maximum deviation was for the panel at α = 60 , although the value was within 6.5% error margin.
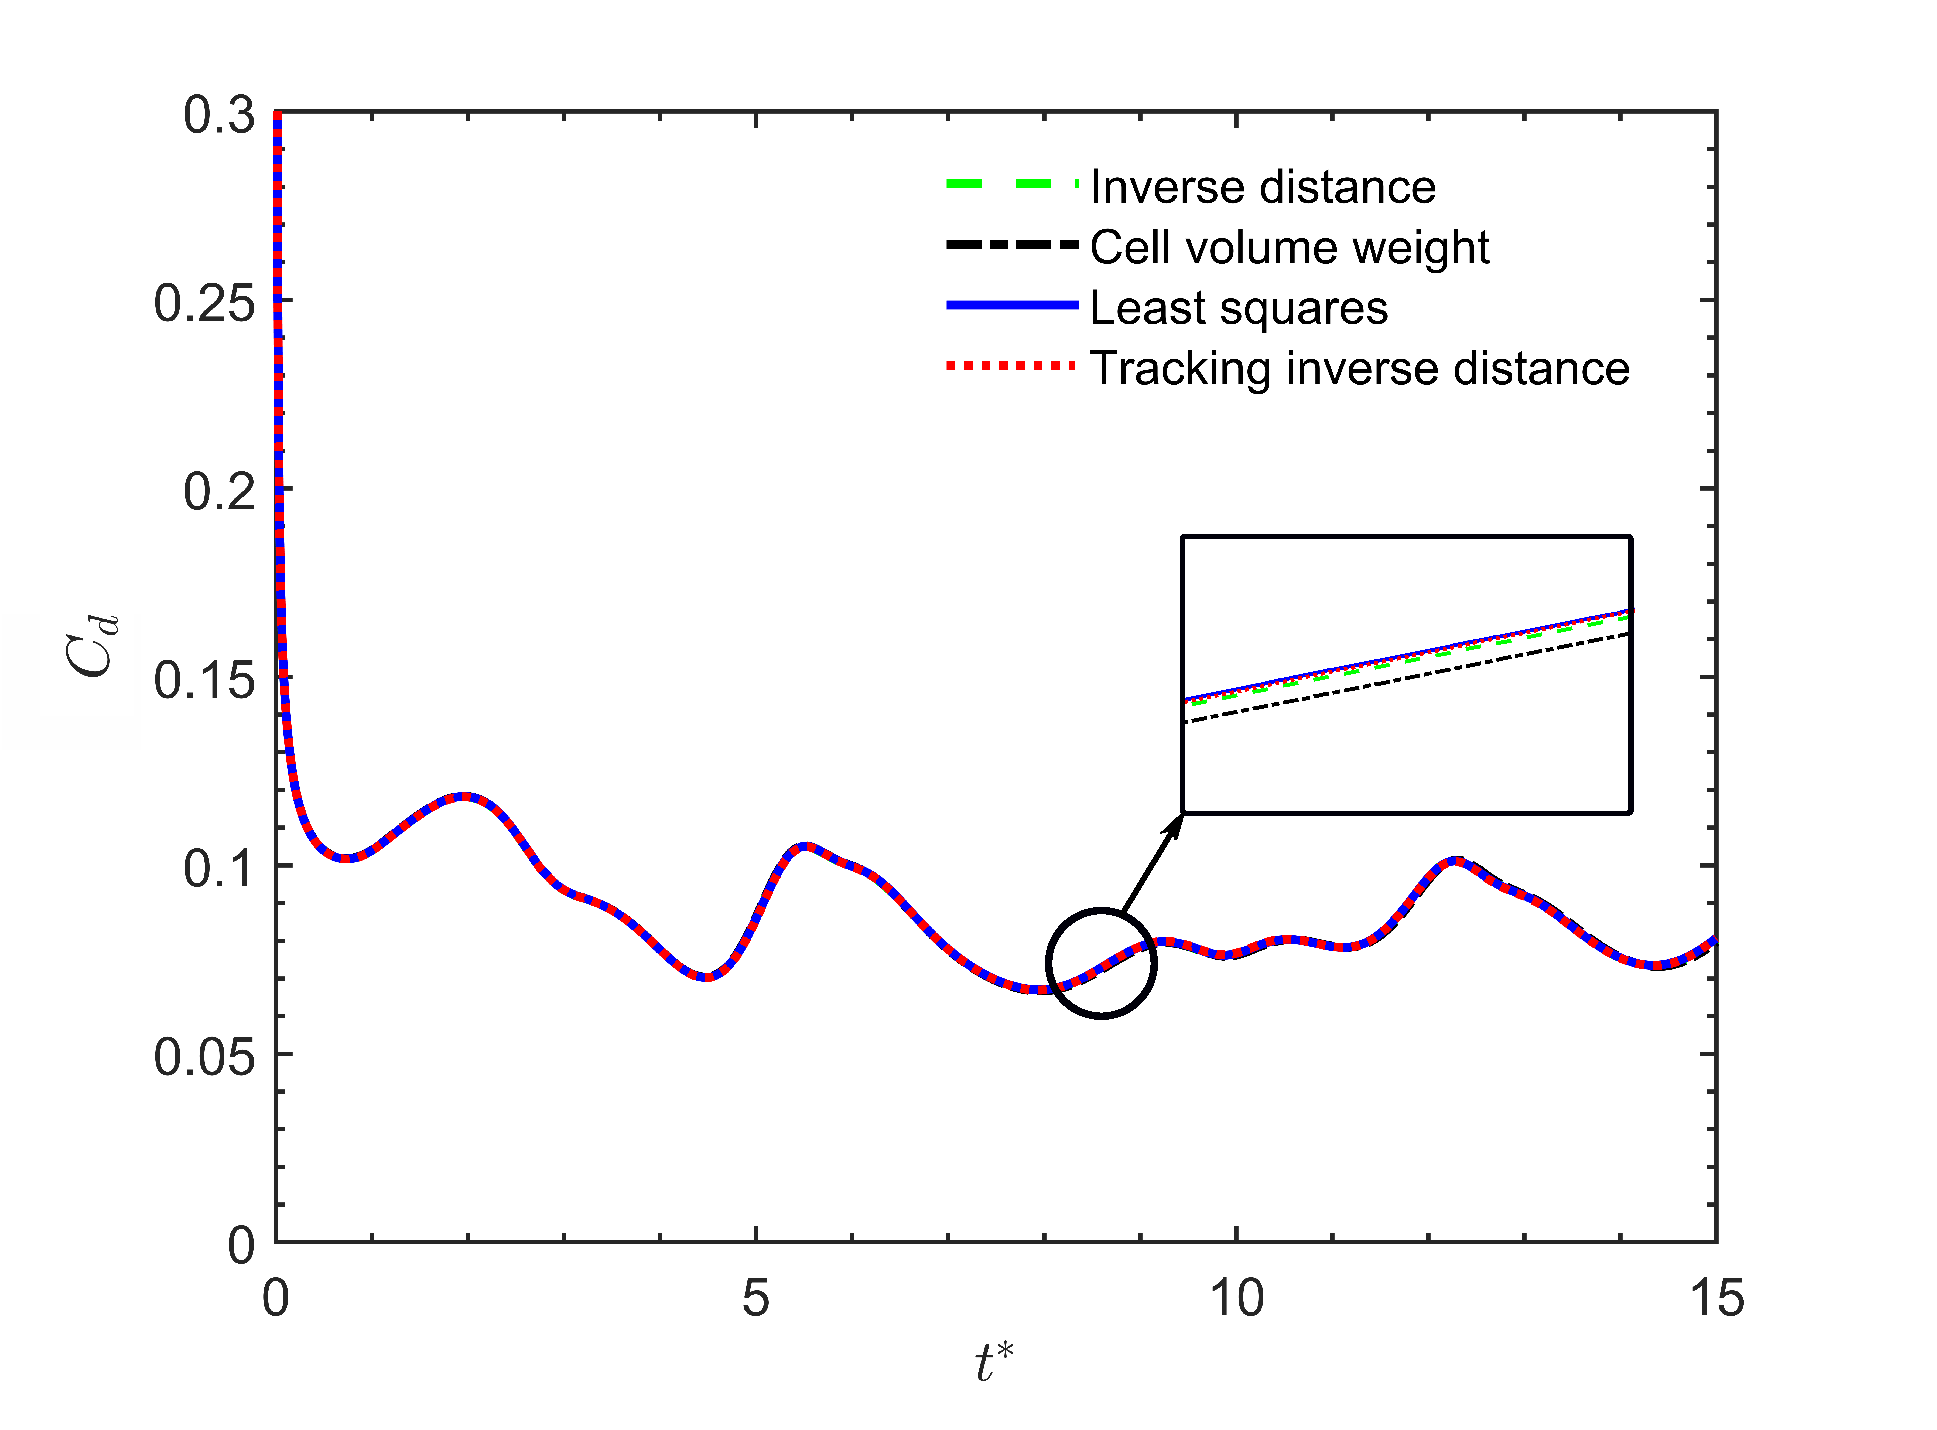
The accuracy of different overset interpolation schemes is studied using a two-dimensional inclined stationary panel (Case 3). Four main schemes are tested: Inverse-Distance, CellVolumeWeight, LeastSquares and trackingInverse-Distance. These were selected based on their total simulation time for completion and prediction accuracy. For simplicity, we compared the coefficients of drag ( C D ) estimated for a two-dimensional stationary panel at α = 30 (Case 3). The details for CPU time (s) required for each scheme is shown in Table 3, while the variation of C d with respect to non-dimensional time t * = t U / c is depicted in Figure 6.
The Inverse-Distance scheme incorporated the least amount of CPU time as observed in Table 3. Particularly, the CellVolumeWeight scheme, although conservative, required 72% more CPU time compared to Inverse-Distance. The CPU time required for LeastSquares and TrackingInverseDistance schemes was also longer by 26% and 10%, respectively. Despite the higher order of accuracy offered by LeastSquares, we suspected that the time requirement is even higher for three-dimensional cases with more refined grids. The estimated C d using different interpolation schemes was also within 0.01% (Figure 6), which suggested that using the Inverse-Distance scheme is appropriate for all the three-dimensional cases.
We also observed a good agreement between the current results for C d ¯ (Figure 5) and the data obtained by Senturk et al. [11] who used the IBM technique. This indicated that OGA implementation yields a similar accuracy in terms of modeling wake characteristics compared to other techniques. Aarnes et al. [22] further showed that for the study of two dimensional flow over a circular cylinder using IBM implementation, the domain requires an approximately 18.1 times more grid points than that used in the Overset method to achieve a similar accuracy [22]. The cost and time required for computation would therefore increase, as was observed in another study by Tay et al. [36] for flapping airfoil simulations. They showed that using the Overset grid conforming method [36], a reduction in the total number of cores (or processors) was possible, along with a reduction in computational time compared to IBM implementation [36].
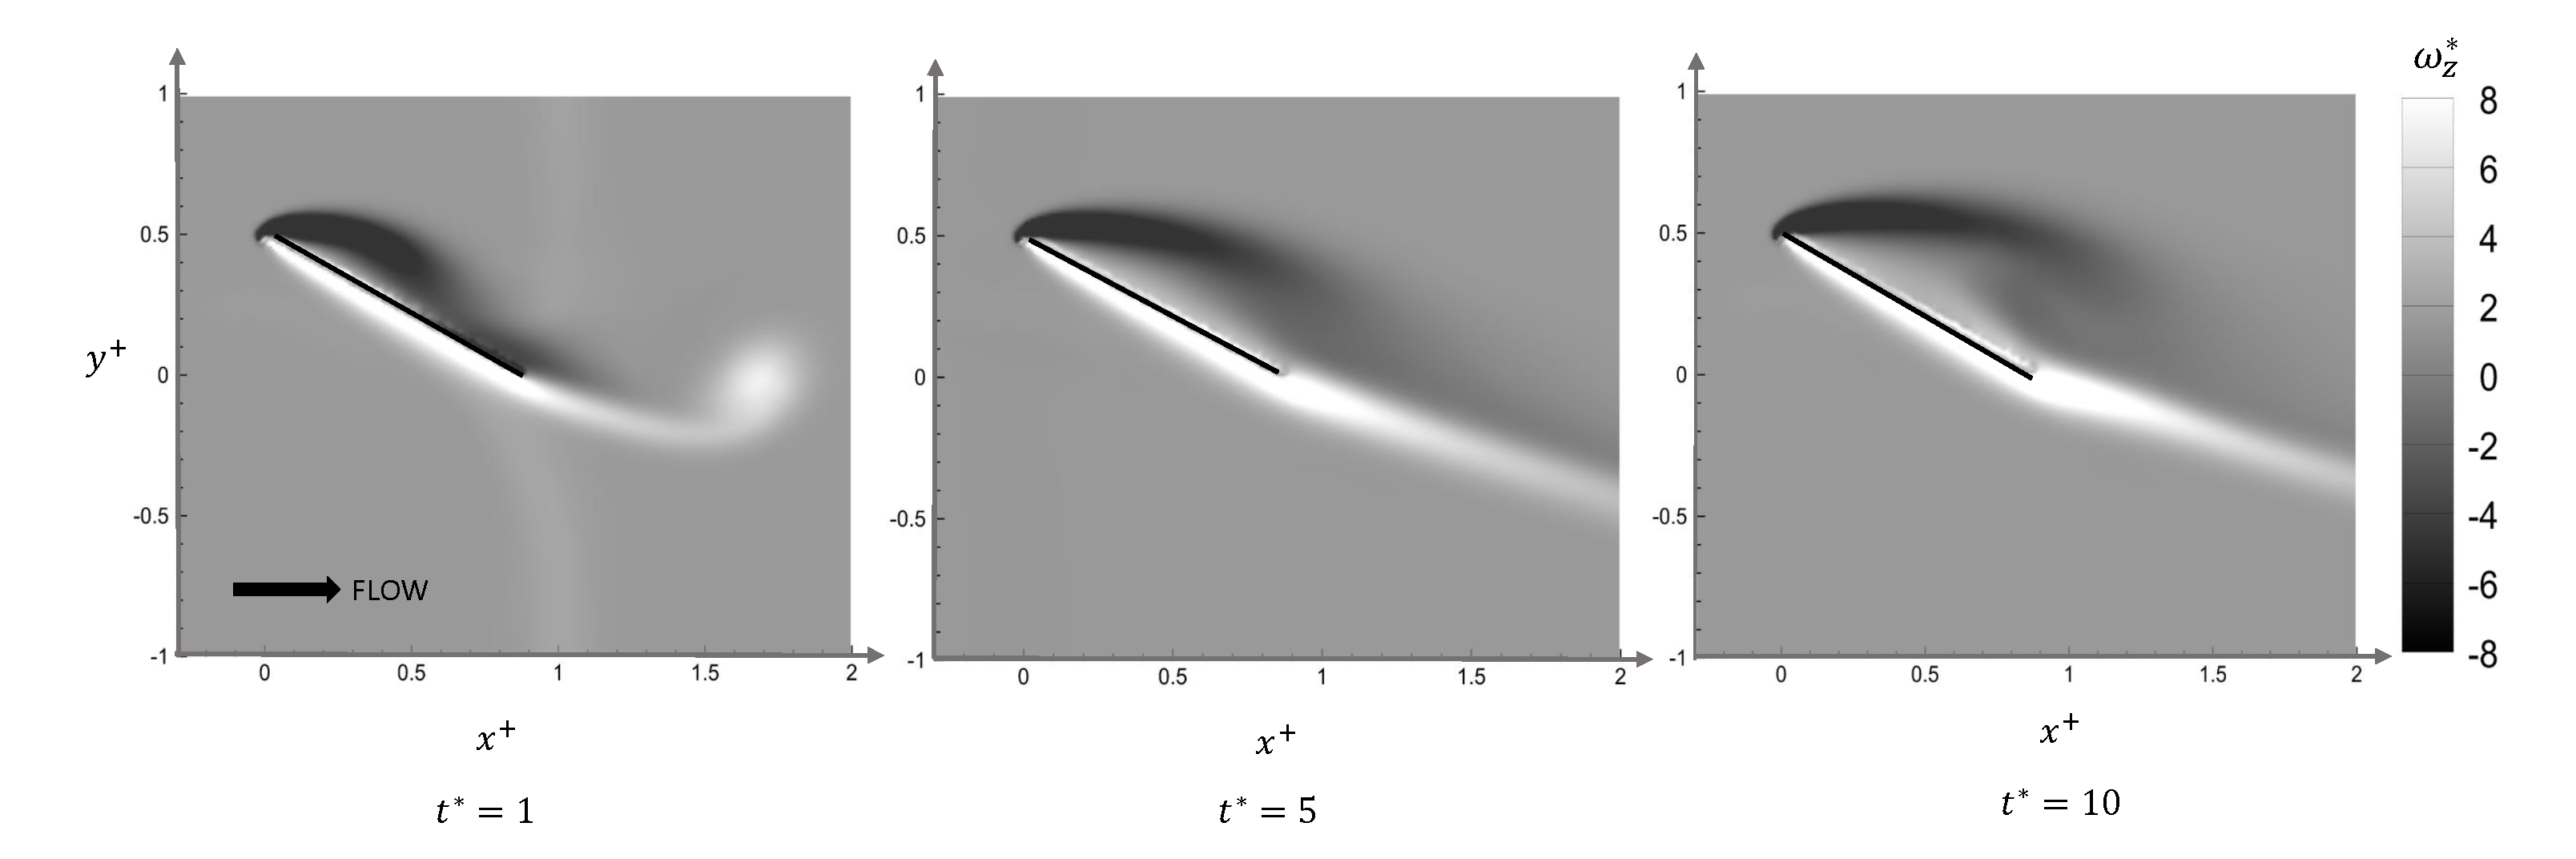
Wake visualizations further provide insight into the vortex features that may affect the drag characteristics of inclined stationary panels. Figure 7 presents contours of the spanwise component of vorticity ( ω z * ) for the panel at 30 (Case 3). Snapshots at t * = 1 , 5 and 10 are presented. At t * = 1 , the formation of trailing edge and leading edge vortices are clearly identifiable. The viscosity and shear effects are high at R e = 300. This leads to a smeared distribution at later times near the surface of the panel. This characteristic was also well captured by Taira et al. [23] for flow over a panel at the same R e . The plots at t * = 5 and 10 are similar, and the latter corresponds to flow after reaching statistical convergence.
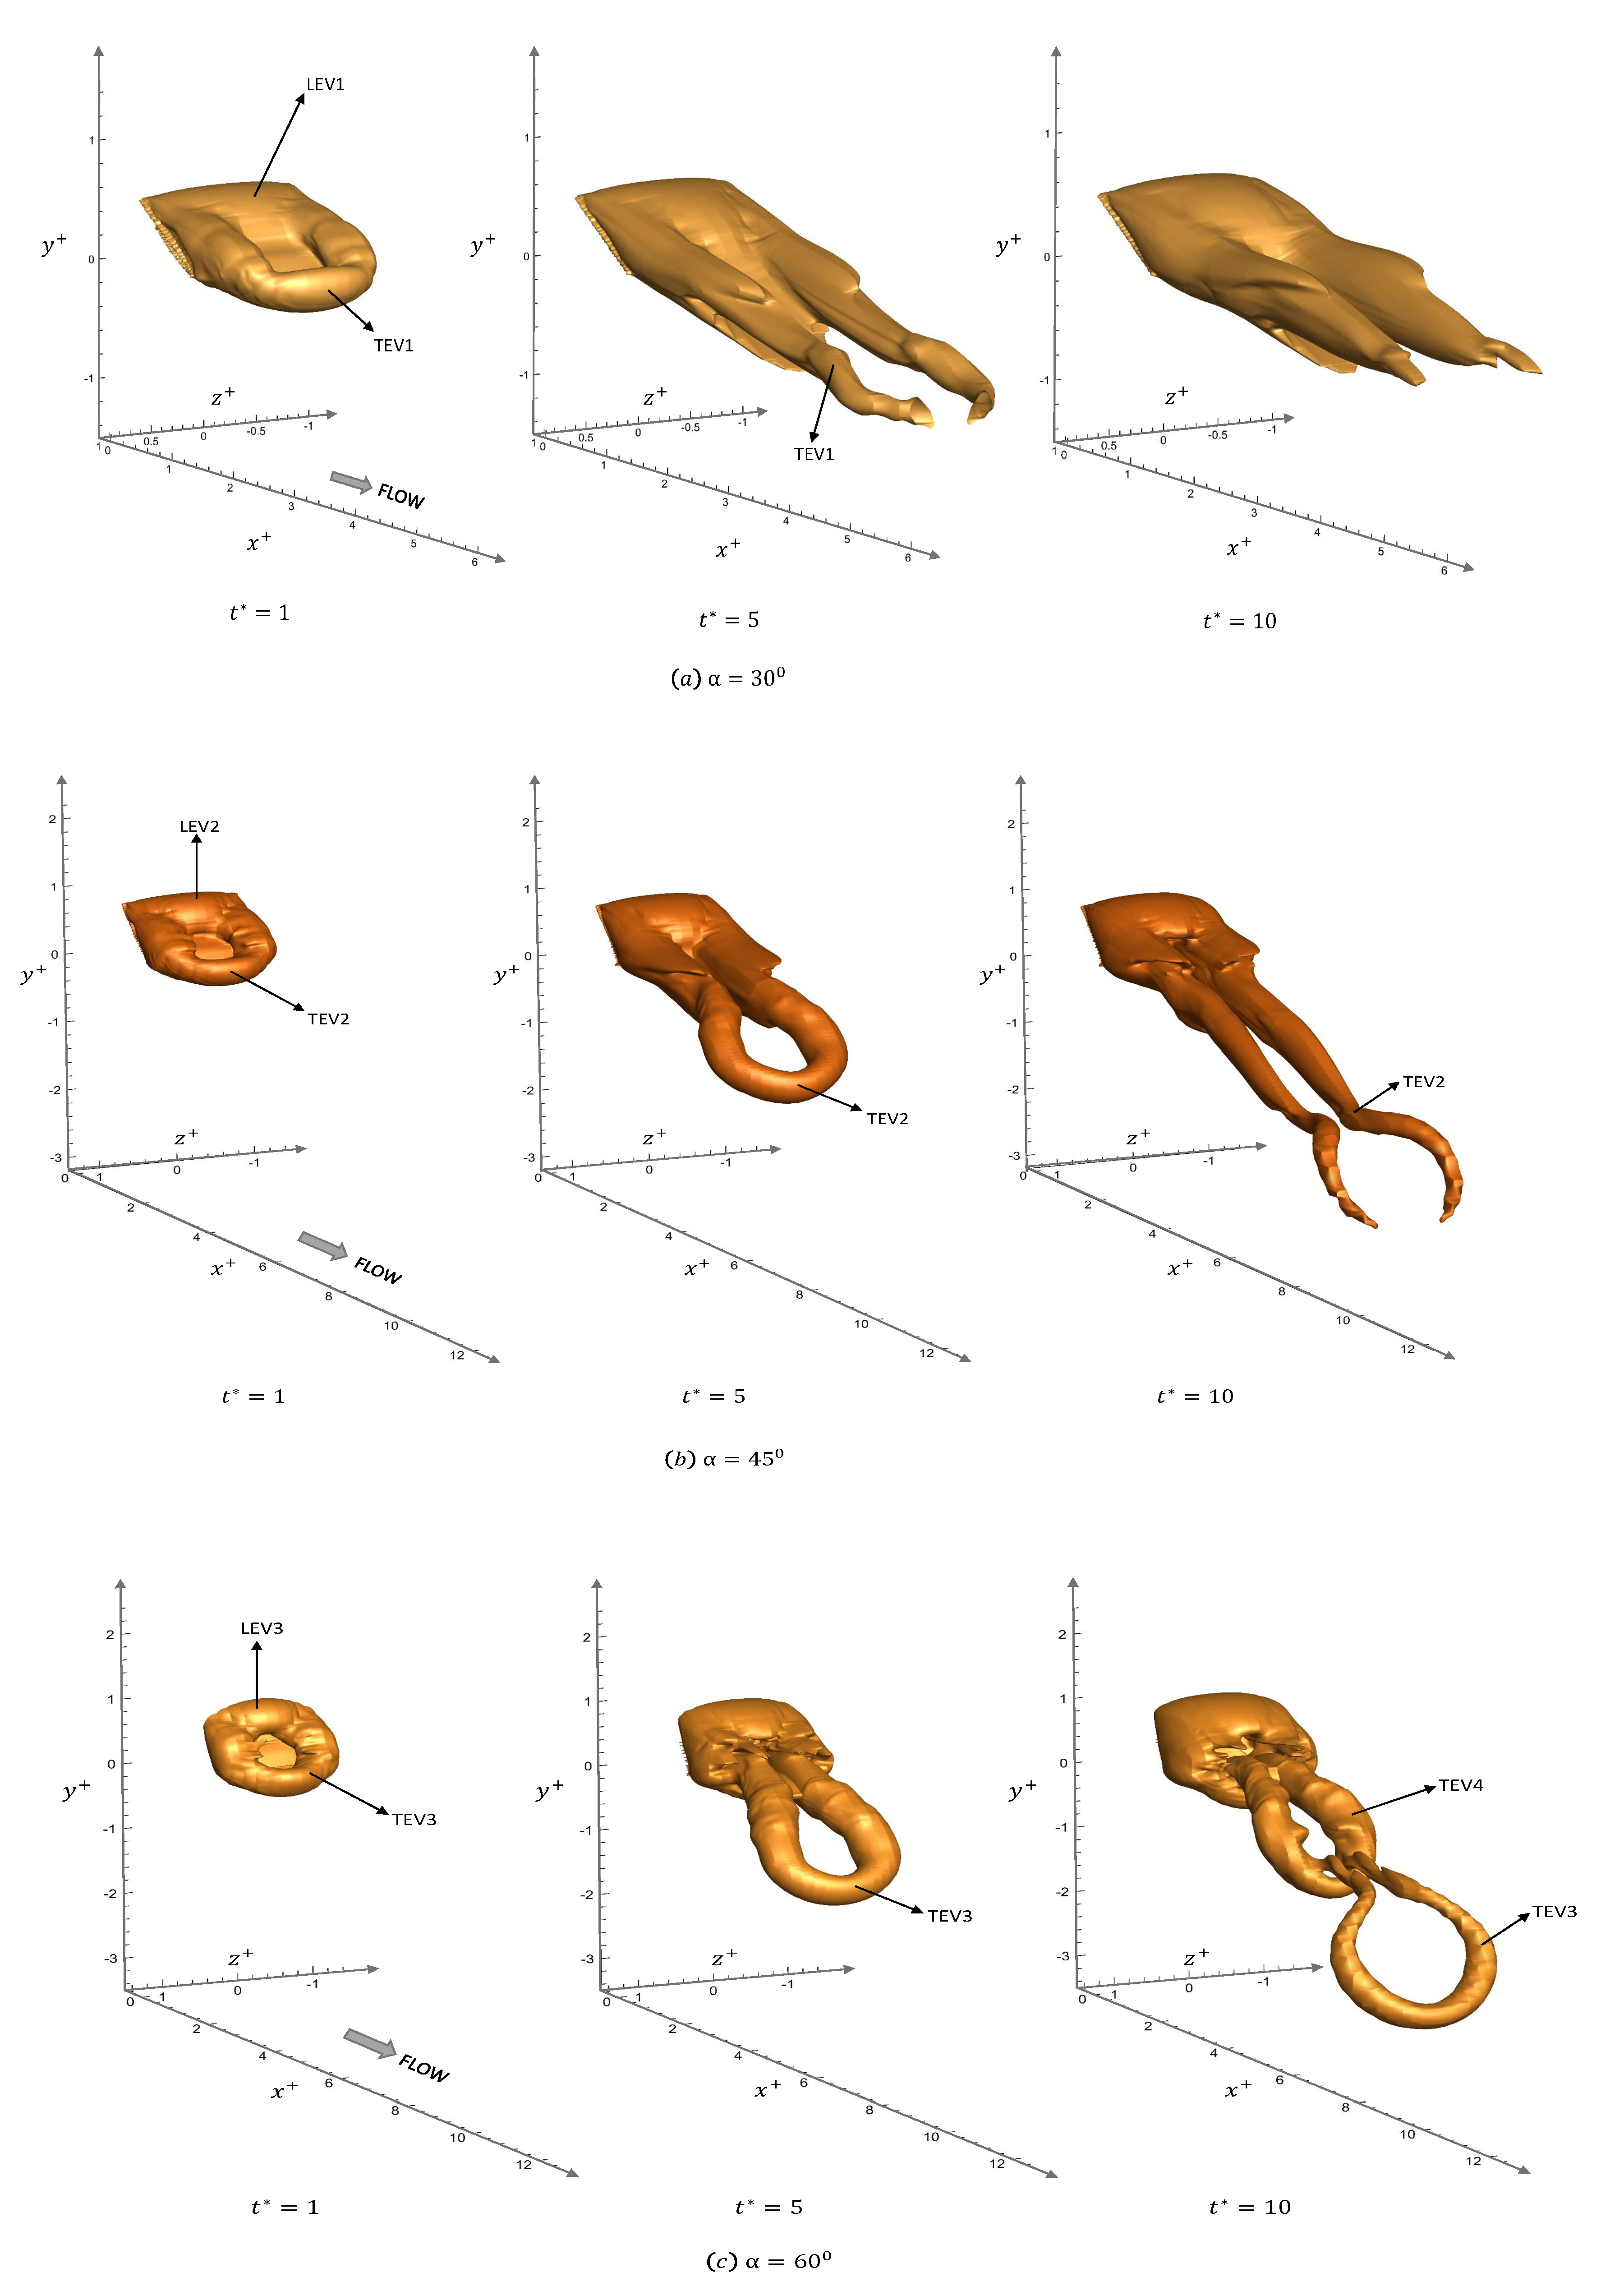
The generation and interaction of vortices are shown using iso-surfaces of vorticity magnitude in Figure 8. The results correspond to Cases 3, 4 and 5, where the stationary panel was fixed at α = 30 , 45 and 60 , respectively. The iso-surface of vorticity magnitude enables detection of a vortex sheet formed and separated from the panel surface [23]. The results were well captured at t * = 1, 5 and 10, respectively.
The iso-surfaces in Figure 8a ( α = 30 ) indicates that a leading edge vortex (LEV1) is first formed at t * = 1 . A similar vortex structure was also noted by Taira et al. [23]. Over time, the transient effects are overcome by viscosity and the entire visible span of the panel is dominated by a pair of tip vortices (TEV1). The tip vortices were counter rotating and appear to be very similar in structural configuration. The downward velocity induced by tip vortices retains the leading edge vortex sheet from detachment. Figure 8b depicts the formation of leading and trailing edge vortices, LEV2 and TEV2 respectively, for the panel at α = 45 . The TEV2 structure observed at t * = 1 is quite similar in configuration to TEV1 in Case 3. The difference is observed at t * = 5 , wherein TEV2 expands to form a horseshoe vortex, retaining its coherence close to the panel. At t * = 10 , the horseshoe vortex TEV2 breaks down to form two counter rotating tip vortices. The results for the panel at α = 60 are also presented in Figure 8c. At t * = 1 , the generation of a leading edge vortex LEV3 was similar to LEV2 of Case 4 (Figure 8b), although a difference in the wake features was observed with respect to the trailing edge vortices. The horseshoe vortex TEV3 at t * = 1 appear to be forming closer to the panel surface compared to TEV2 and TEV1, which emerged at α = 45 and 30 respectively, thereby leading to higher drag. With further advection of vorticity downstream, the newly formed TEV4 entrains the TEV3 at t * = 10, leading to an interconnected structure.
This interconnection is also attributed to the high shear effects experienced at low R e , due to which the vortices counteract breakage and separation, in localized regions (such as the trailing edge tips of the panel [7]).

3.2. Pitching Panels (Cases 6–7)

Three dimensional simulations of pitching panels were carried out using the OGA method, where the body has an oscillatory pitching motion. The centre of oscillation was 0.1c from the leading edge of the panel. Two cases corresponding to R e of 500 (Case 6), and 2000 (Case 7), were selected. Since higher R e are generally associated with an unstable shear layer, and therefore greater turbulence effects near the panel surface, we decided to proceed with a moderate R e = 2000. Senturk et al. [11] determined this R e to inhibit turbulence effects.
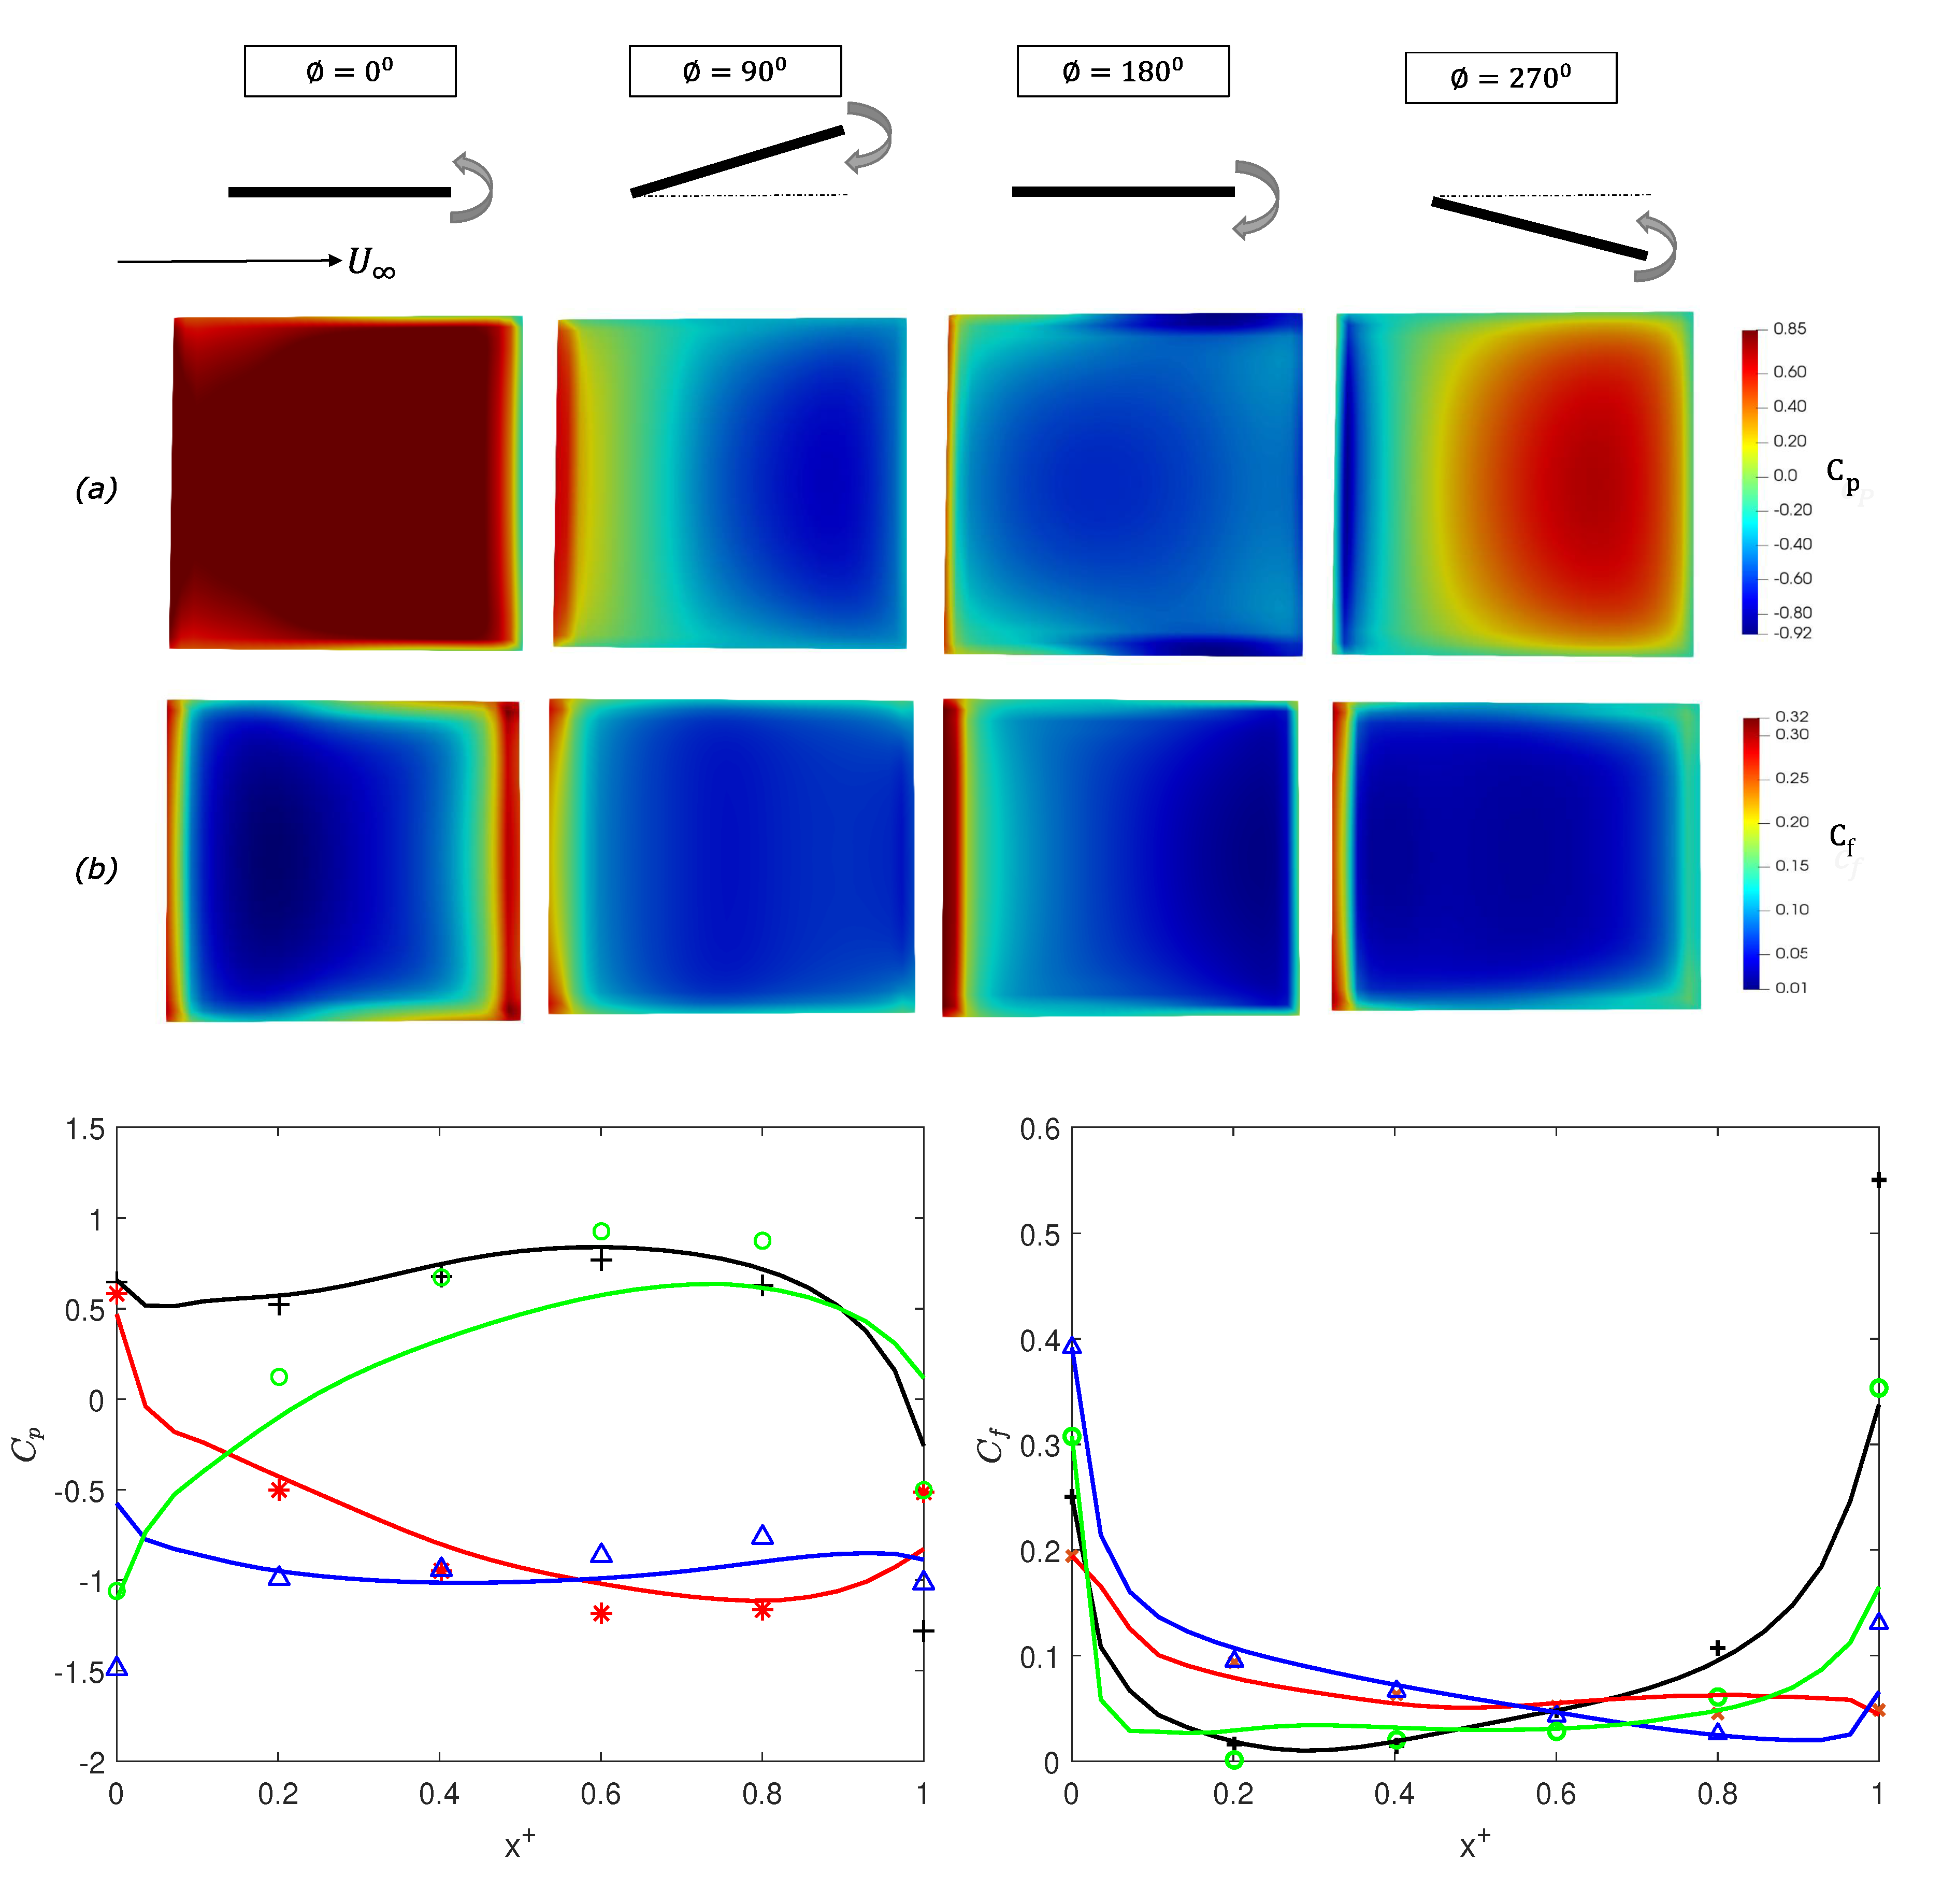
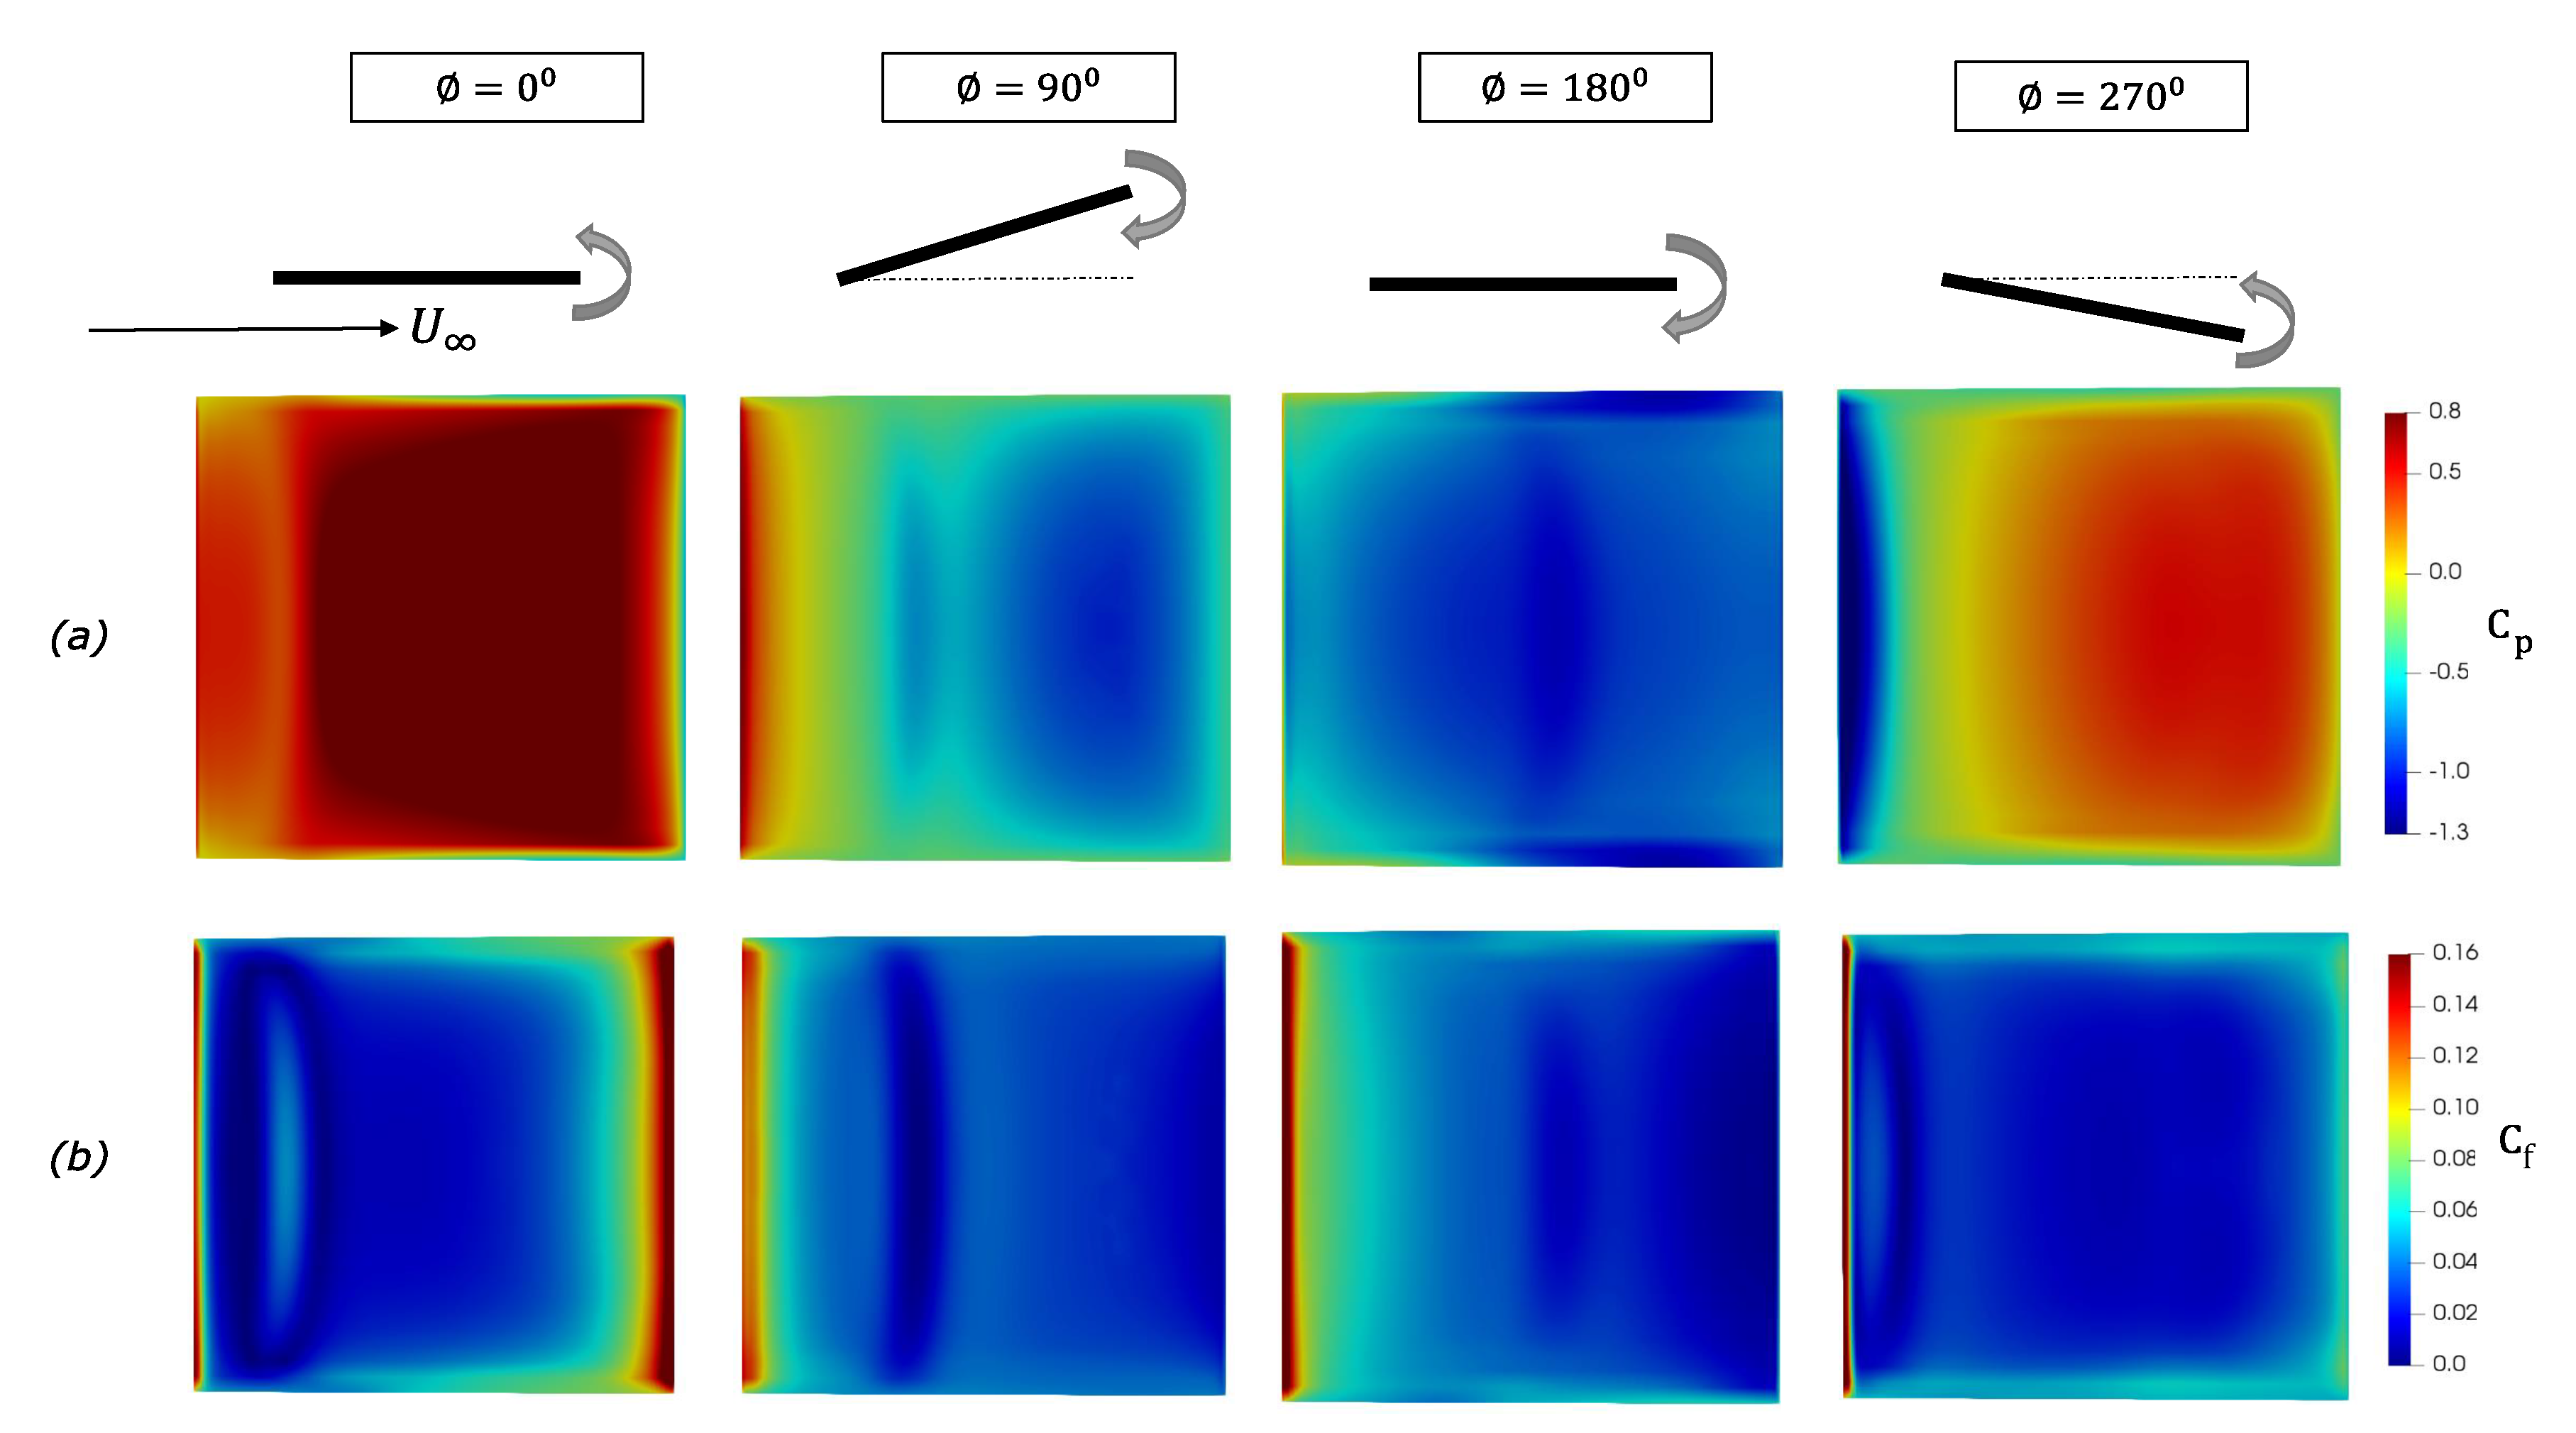
The net propulsive or Froude efficiency of the panel is calculated using η = C T ¯ / C P ¯ , where C P ¯ represents the coefficient of power. Since η depends on the force characteristics of the pitching panel, we first present the pressure and shear stress distribution on the top surface of the square panel, in Figure 9a,b and Figure 10, for R e = 500 and 2000, respectively. Four instances were selected based on the phase angle of the panel ( ϕ ) in its pitching cycle. The phases correspond to 0 , 90 , 180 , and 270 , respectively. The panel positions at these phases are also shown for clarity. The pressure coefficient, C p , and shear stress coefficient, C f , were calculated based on:
C p = p p r e f 1 2 ρ U 2
C f = τ w 1 2 ρ U 2
Here, p is the pressure on the surface of panel, p r e f is the reference pressure and τ w is the wall shear stress on the surface of the panel. C p distribution for ϕ = 0 , indicate a higher pressure at the top surface, except for the extremities of panel where the shear stress distribution was maximum. This trend compares well with the observation of Senturk et al. [12], who performed a similar parametric study at R e = 500. The regions of high pressure gradients were concentrated along the panel extremities, which is responsible for the thrust generation [12,37]. A difference in magnitudes of C f is noted in the cases corresponding to R e = 500 and 2000, respectively. Due to reduced viscous effects, the contribution of pressure to drag increases with increasing Re.
Figure 9 also shows a chordwise variation of C p and C f at midspan of the panel (Case 6). The leading and trailing edges had higher shear stress coefficient compared to mid chord regions, while pressure coefficient tend to drop at the leading and trailing edges. This is also consistent with the findings of Senturk et al. [12]. Differences in drag was also observed between different phases of the pitching cycle. A higher pressure is generated as the panel starts pitching upwards, thus confirming that a vortex core in the form of a leading edge vortex is forming at the top surface of the panel. As the panel reaches its peak amplitude (i.e., ϕ = 90 ), the vortex seperates from the panel leading edge and a low pressure region is formed on the surface. At ϕ = 180 , the pressure and shear stress are low, except at the leading edge where shear stress gradient is still high. As the panel reaches ϕ = 270 and moves upwards, the pressure increases similar to the start of the pitching cycle. The higher magnitudes of C p indicate that drag production (or in other cases, thrust production) is dominated by pressure effects.
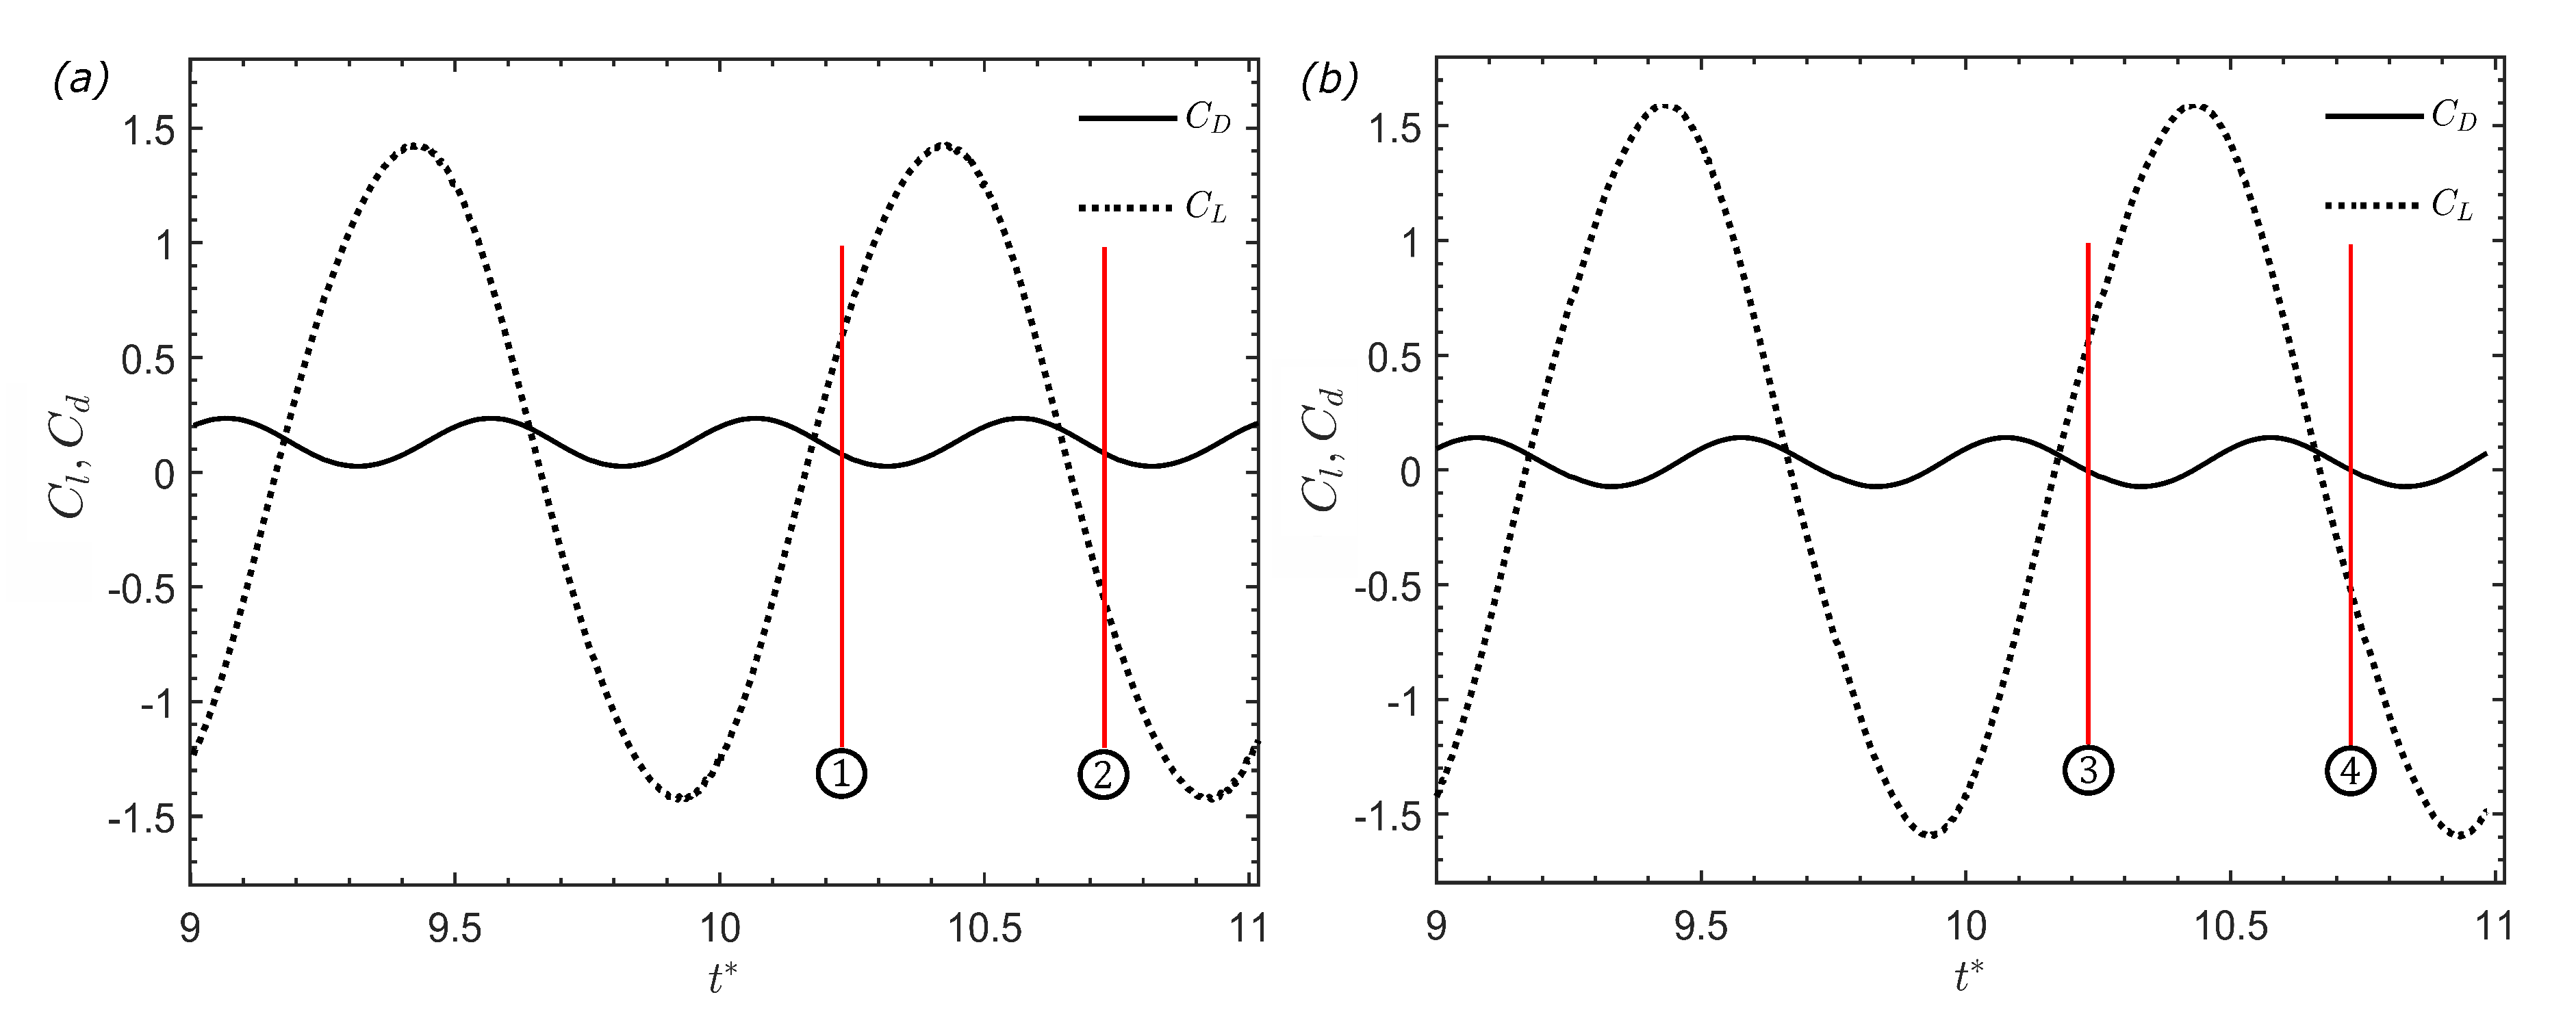
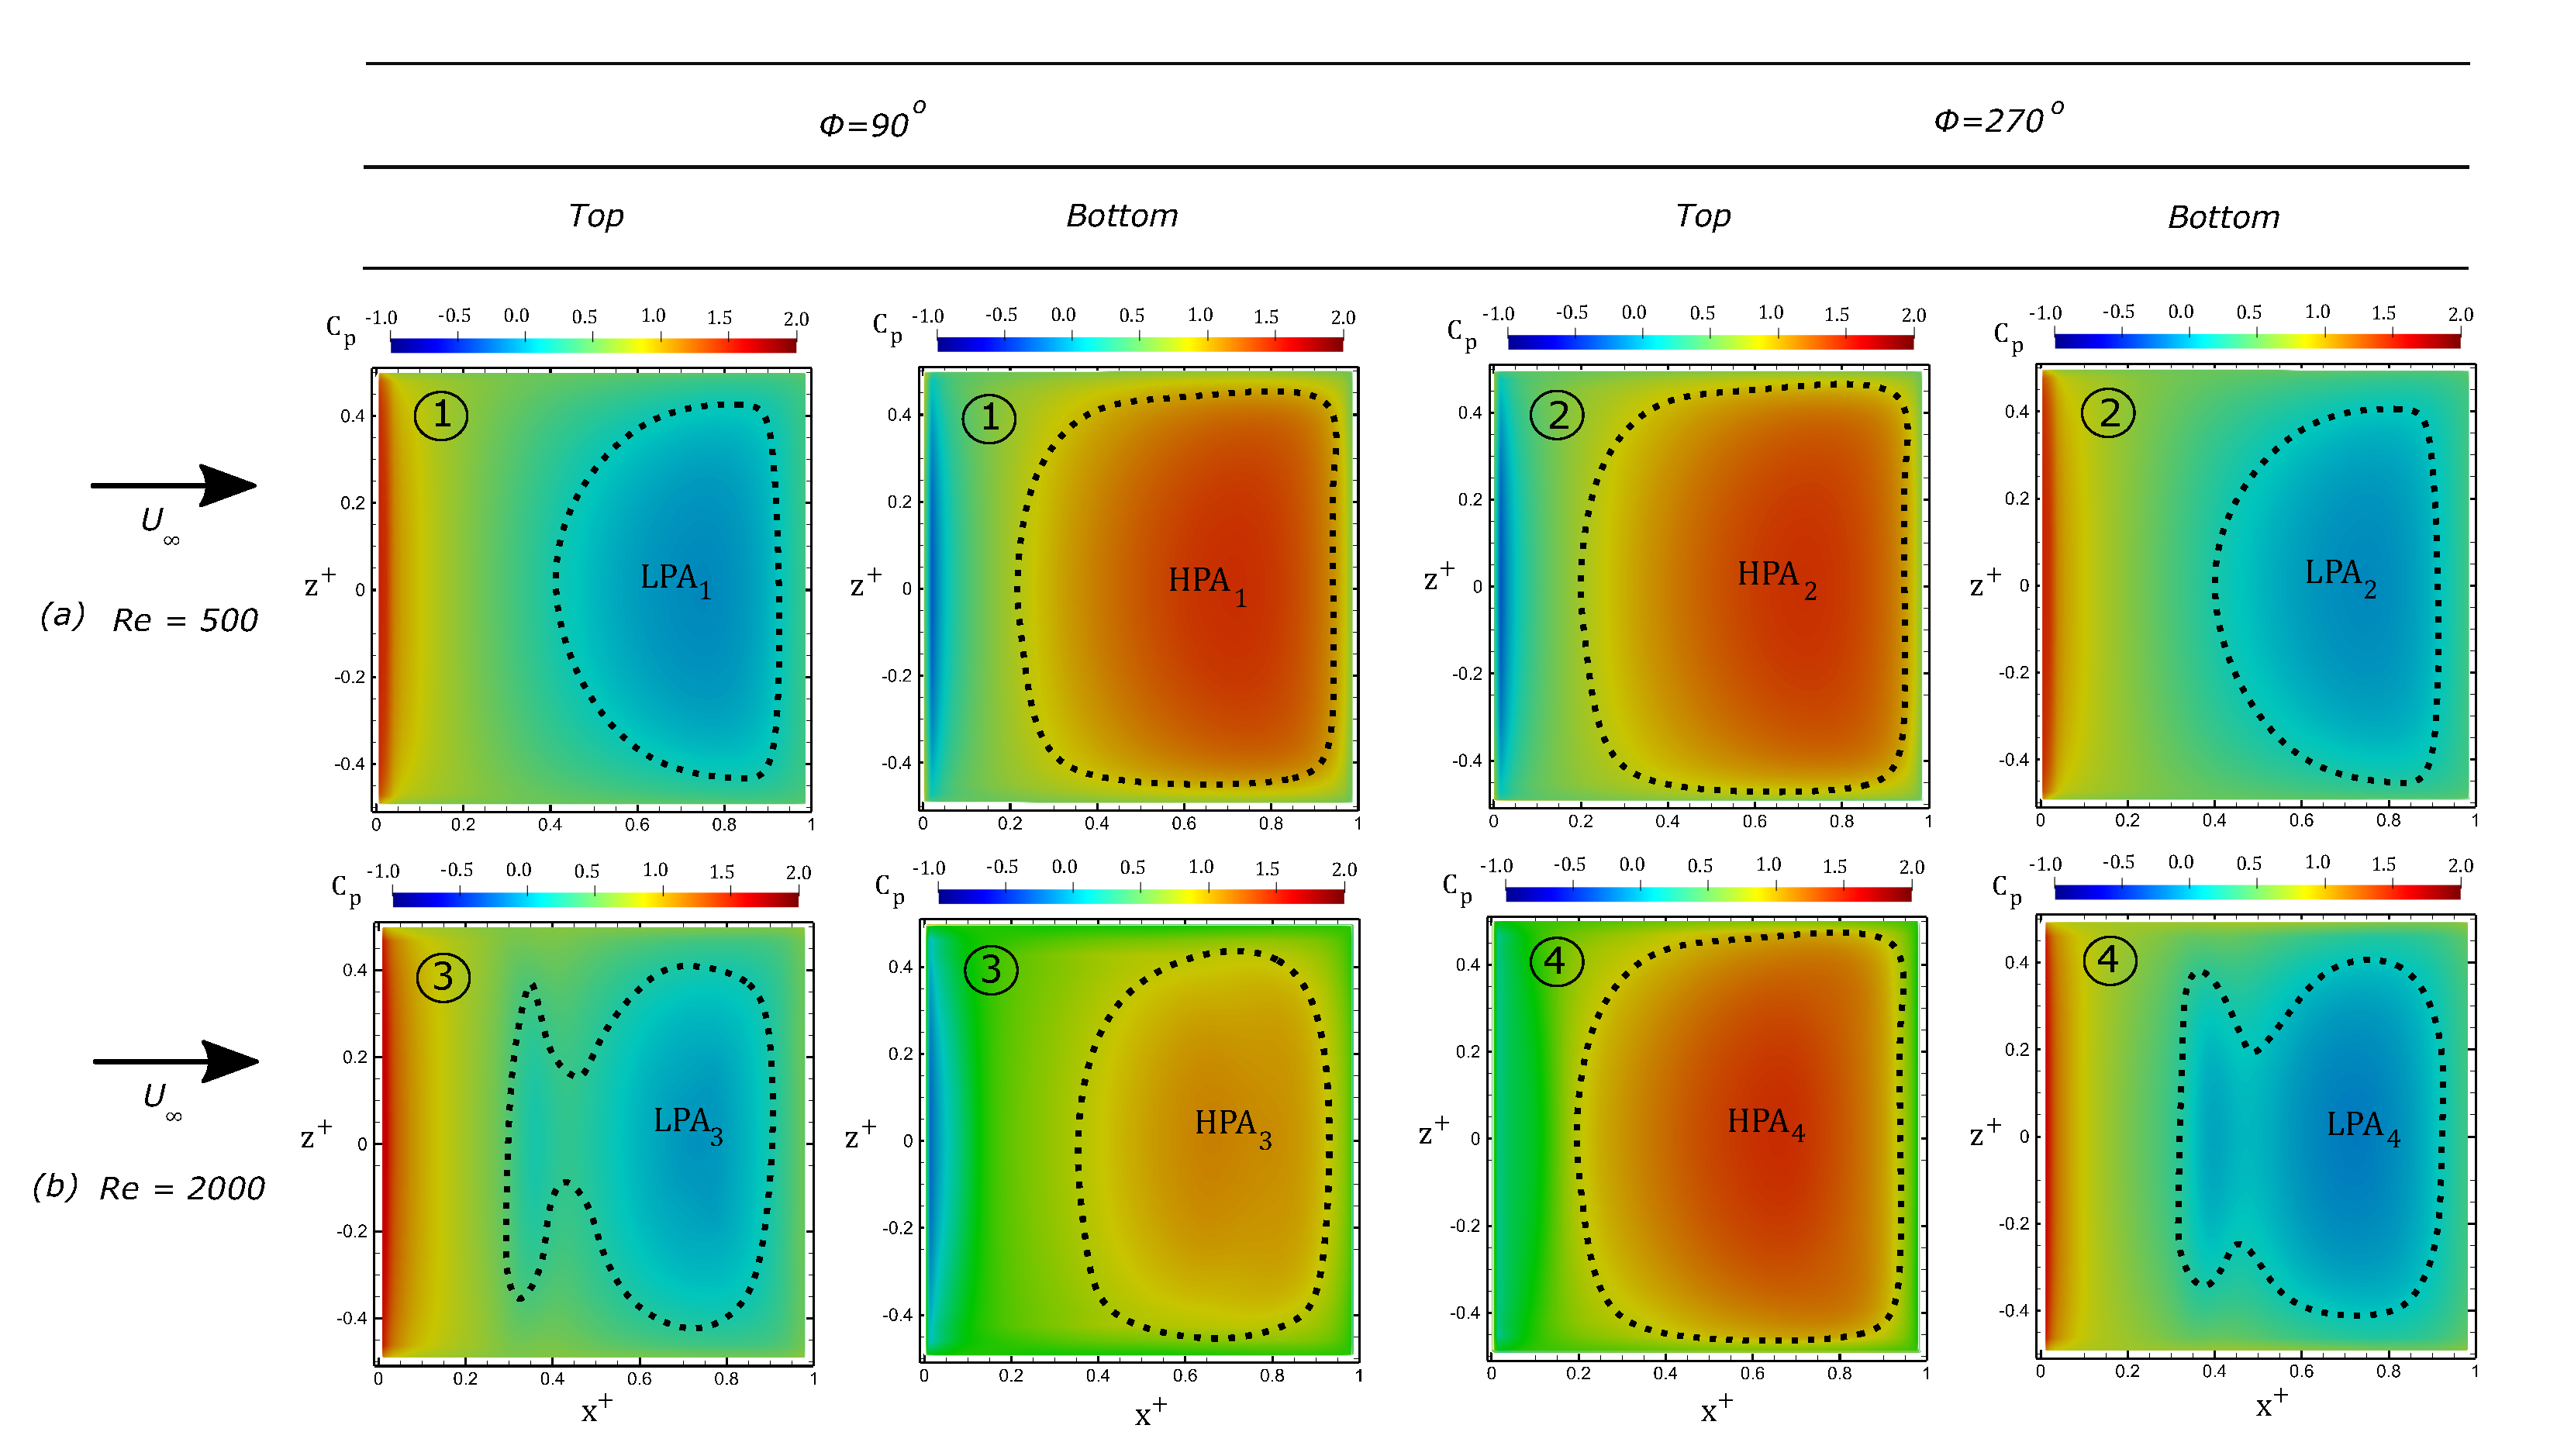
The low versus moderate Reynolds number effects on the production of drag at low S t is further analyzed by looking at the instantaneous C d and C l in Figure 11a,b. The normalization factor for time was assumed to be the oscillation period ( T o ) for the pitching cycle (i.e., t * = T / T o ) . The time-averaged drag coefficient for Case 7 ( R e = 2000 ) was ≈70% smaller than Case 6 at R e = 500 . The less significant viscous effects at high R e tend to decrease drag, and generally promote thrust generation [12]. The higher magnitudes of C f observed along the panel edges (Figure 9b) for Case 6 as compared to Case 7 (Figure 10b), verified the increased viscous contribution to drag at lower R e . Hemmati et al. [32] also explained the effects of surface pressure variation on the nature of thrust and side (lift) forces produced by pitching panels with different trailing edge shapes. For cases presented in our study, we investigated the differences in surface pressure distribution for Case 6 and Case 7, at peak trailing edge positions of oscillation cycle. These correspond to ϕ = 90 and 270 respectively. These specific phase positions are also depicted in Figure 11 as Instant “1” and Instant “2” for Case 6, and Instant “3” and Instant “4” for Case 7. At each of these instants, the distribution of pressure coefficient ( C p ) on top and bottom panel surfaces are depicted in Figure 12, separately. This further allowed evaluation of any potential similarities or differences in surface pressure distribution at the two R e s, and its corresponding effects on the nature of drag and lift force at specific phases of the pitching cycle.
The variation of drag produced by the panel does not appear to change as the panel reaches ϕ = 90 and 270 . However, the extrema of lift coefficient switched its sign from representing maxima, to a minima, ahead of instant “1” and instant “2” in Figure 11a,b, respectively. This trend was similar at the same ϕ for both Case 6 and Case 7, although the magnitudes of maxima and minima increased at higher R e . The change in the sign of the lift force extrema can be further linked to the surface pressure distributions at respective instances shown in Figure 12. This depends on the development and detachment of leading and trailing edge vortex structures [32]. At Instant “1” ( ϕ = 90 ) for Case 6, we observe that a low pressure region LPA1 exist on the top surface of the panel due to the detachment of a trailing edge vortex structure when the panel reaches its maximum pitch amplitude. The bottom surface however corresponds to a high pressure region HPA1, where a new trailing edge vortex is still under development. The existence of such large streamwise pressure gradient across the top and bottom surface of panel leads to the local extrema (maxima) in C l ahead of Instant “1” in Figure 11a. The corresponding detachment of the trailing edge vortex structures leads to transfer of momentum that was gained from downstream advection of trailing edge vortex structures to the pitching panel. Thus, there exists a minima for C d ahead of Instant “1”. At Instant “2” ( ϕ = 270 ), the region of higher C p gets switched from bottom to the top surface of the panel due to the change in the direction of pitching. However, the streamwise pressure gradients across the surface are quite comparable to Instant “1”. This again led to a local extrema (minima) in both C d and C l , after the detachment of the trailing edge vortex structures.
Case 7 had some noticeable differences from Case 6 in terms of surface pressure distribution (see Figure 12b). At Instant “3” ( ϕ = 90 ), we observed an increase in size of the low pressure area LPA3 on the top surface compared to LPA1 in Figure 12a for Case 6. This would increase the integrated streamwise pressure gradient, which existed across the top and bottom surfaces of panel. Thus, there is an increase in magnitude of C l maxima ahead of Instant “3” (Figure 11b) compared to Case 6. A similar observation was also made at Instant “4” ( ϕ = 270 ), where the areal size of LPA4 had increased in comparison to LPA2 in Figure 11a for Case 6. The only difference here was that the increase in streamwise pressure gradient across the panel surfaces promoted an increased negative minima for C l (ahead of Instant “4”) since the direction of pitching got reversed.
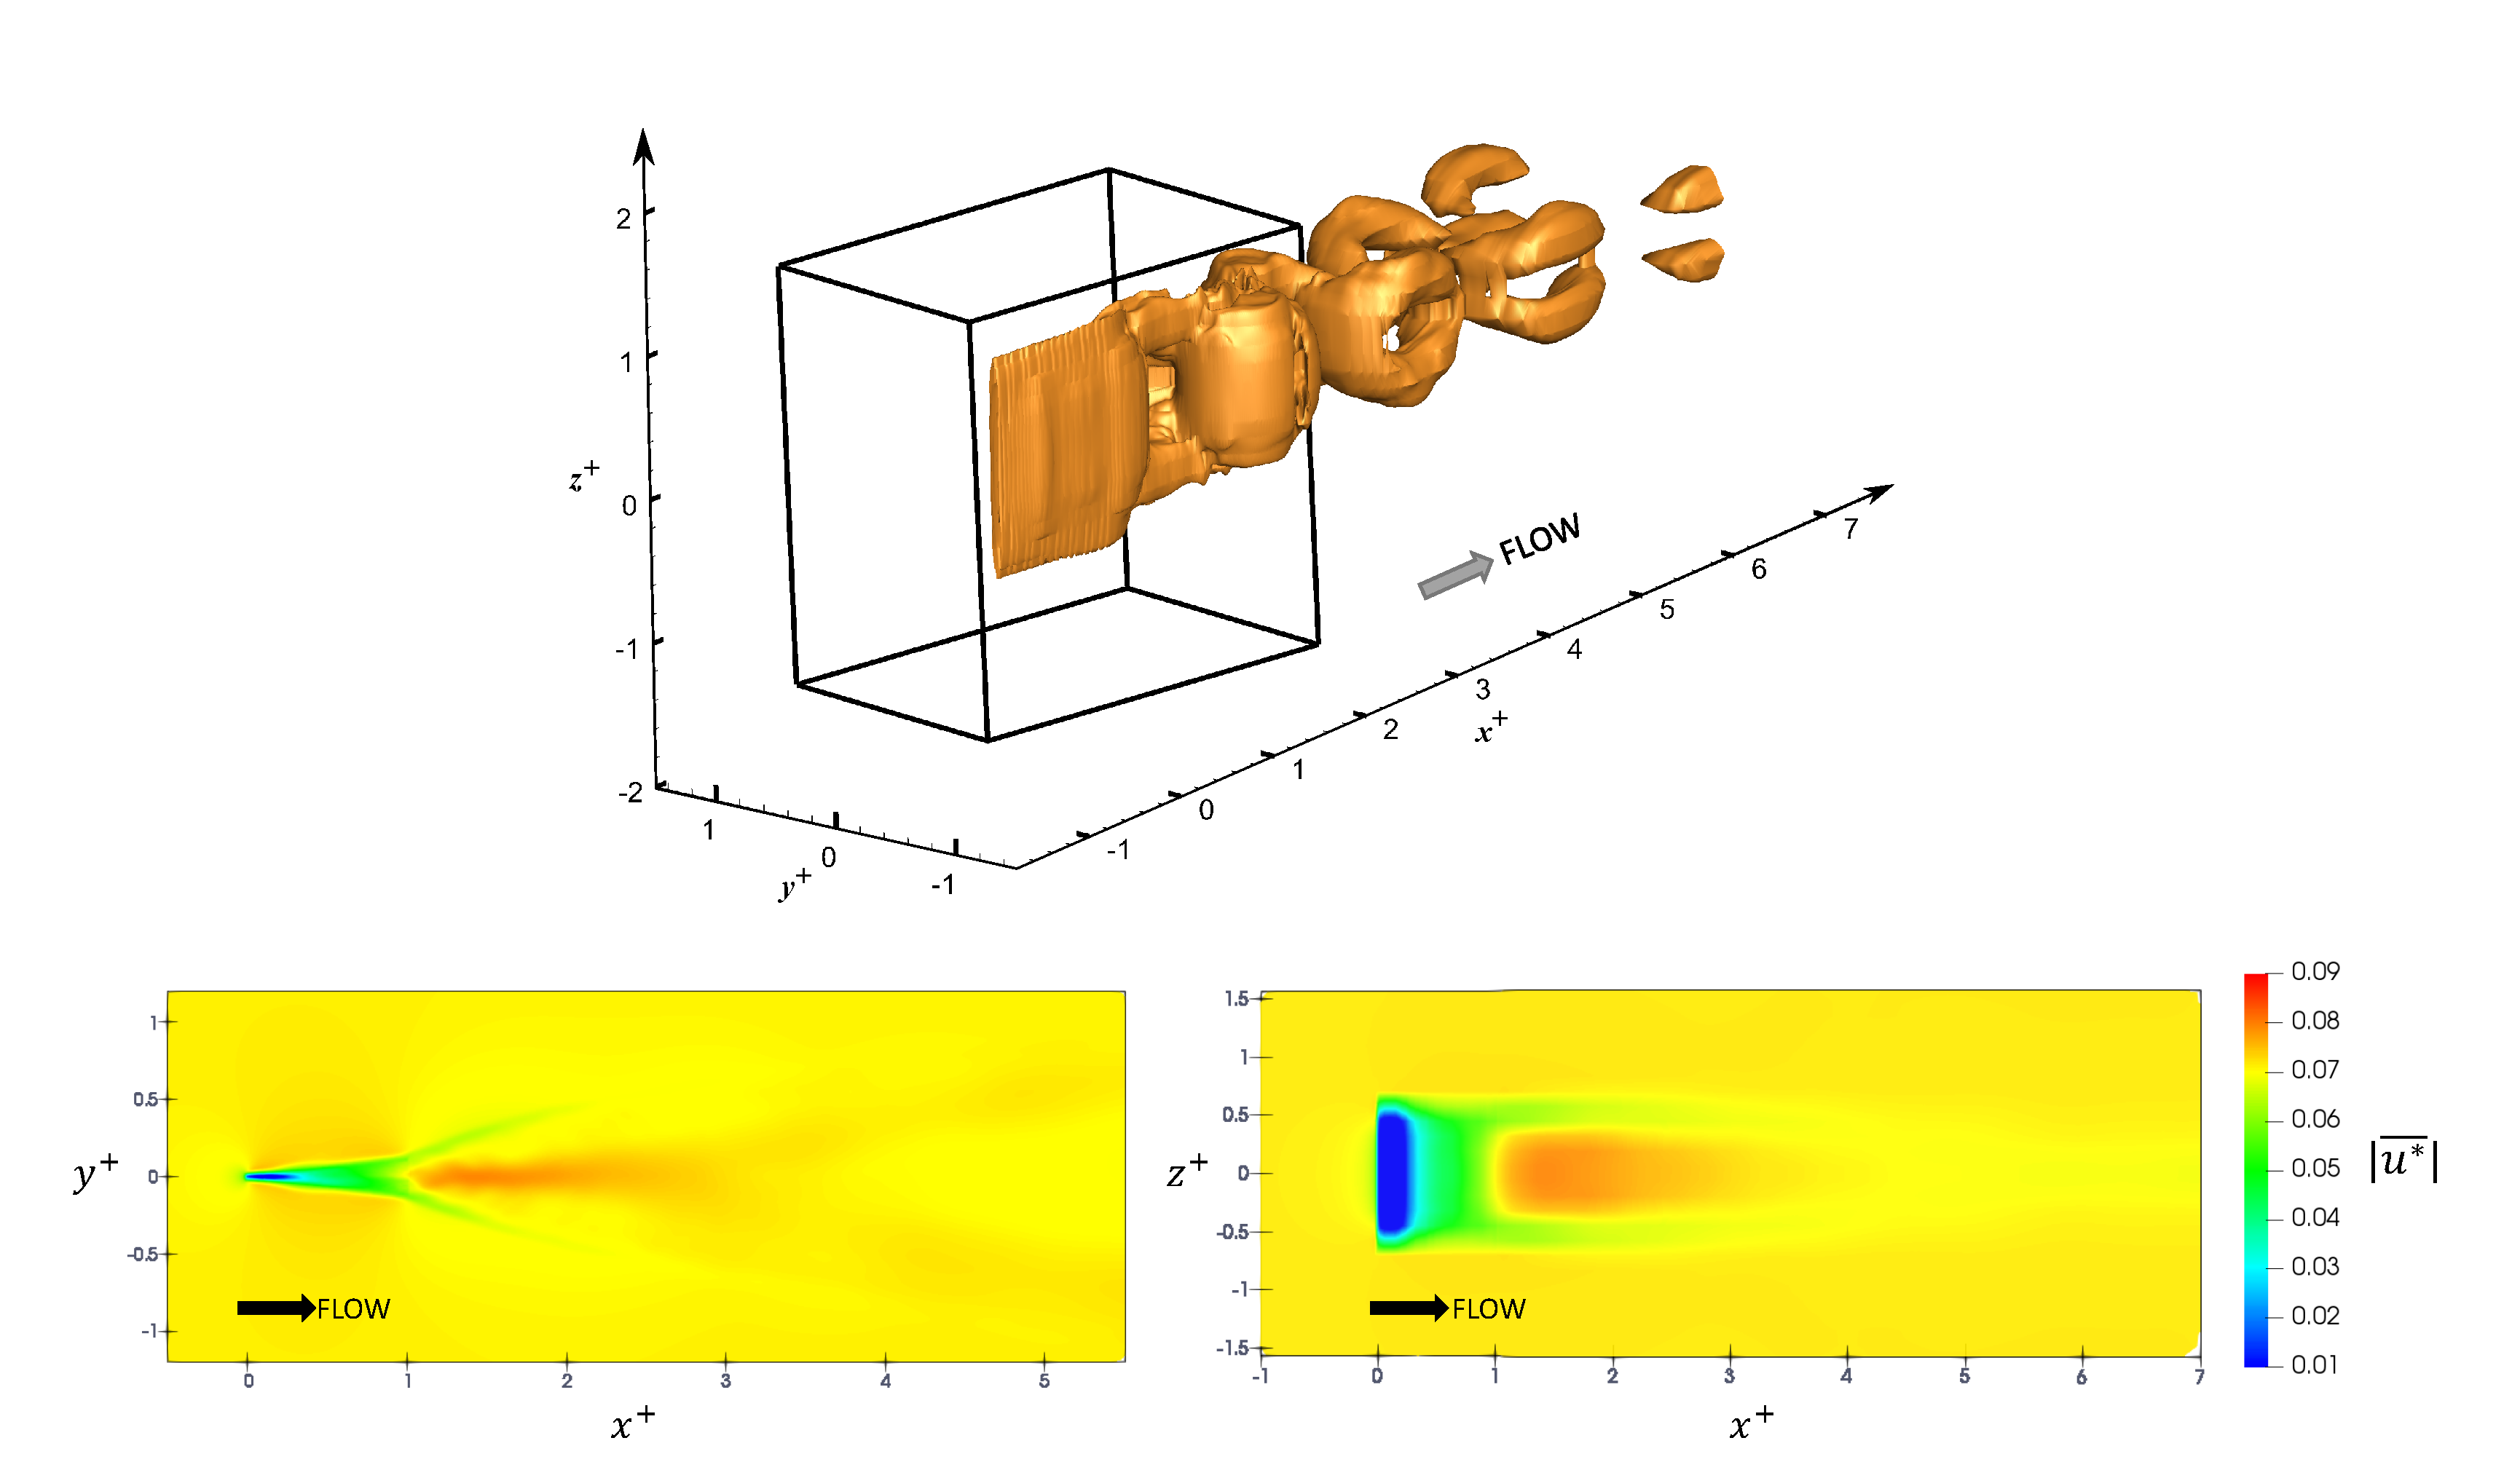
The wake structures are shown using iso-surfaces of vorticity magnitude in Figure 13. The chord length and freestream velocity were used to normalize the vorticity magnitude ( ω * ) . The iso-surfaces correspond to | ω * | = 1 . The vortical pattern appear to be in good agreement with the vortex skeleton model proposed by Buchholz et al. [7], and further verified by Senturk et al. [11,12] and Hemmati et al. [32]. The vortex street in Figure 13a resembles the von Kármán vortex street. The vortex loops are formed and shed from the trailing edge, which generates drag or thrust. However, at low St, the trailing edge vortices (TEVs) are merged with the side shear layers, which inhibits the transfer of momentum from TEVs to the panel. This process leads to production of drag rather than thrust. Interconnecting vortex rings are observed in the wake (Figure 14 top), which is consistent with findings of Buchholz et al. [7] at R e = 640. As the vortices travel downstream, the interactions weaken between the two vortices, leading to distortion of wake structures. This interaction is stronger for detaching vortices near the trailing edge.
The effect of separation and subsequent downstream movement of vortices are examined using contour of temporal mean velocity magnitude ( | u * ¯ | ). Figure 14 also shows the contour plots of | u * ¯ | on the streamwise and spanwise planes. The mean wake is symmetric in both planes and compares well with those of Senturk et al. [11].

3.3. Scalability Results

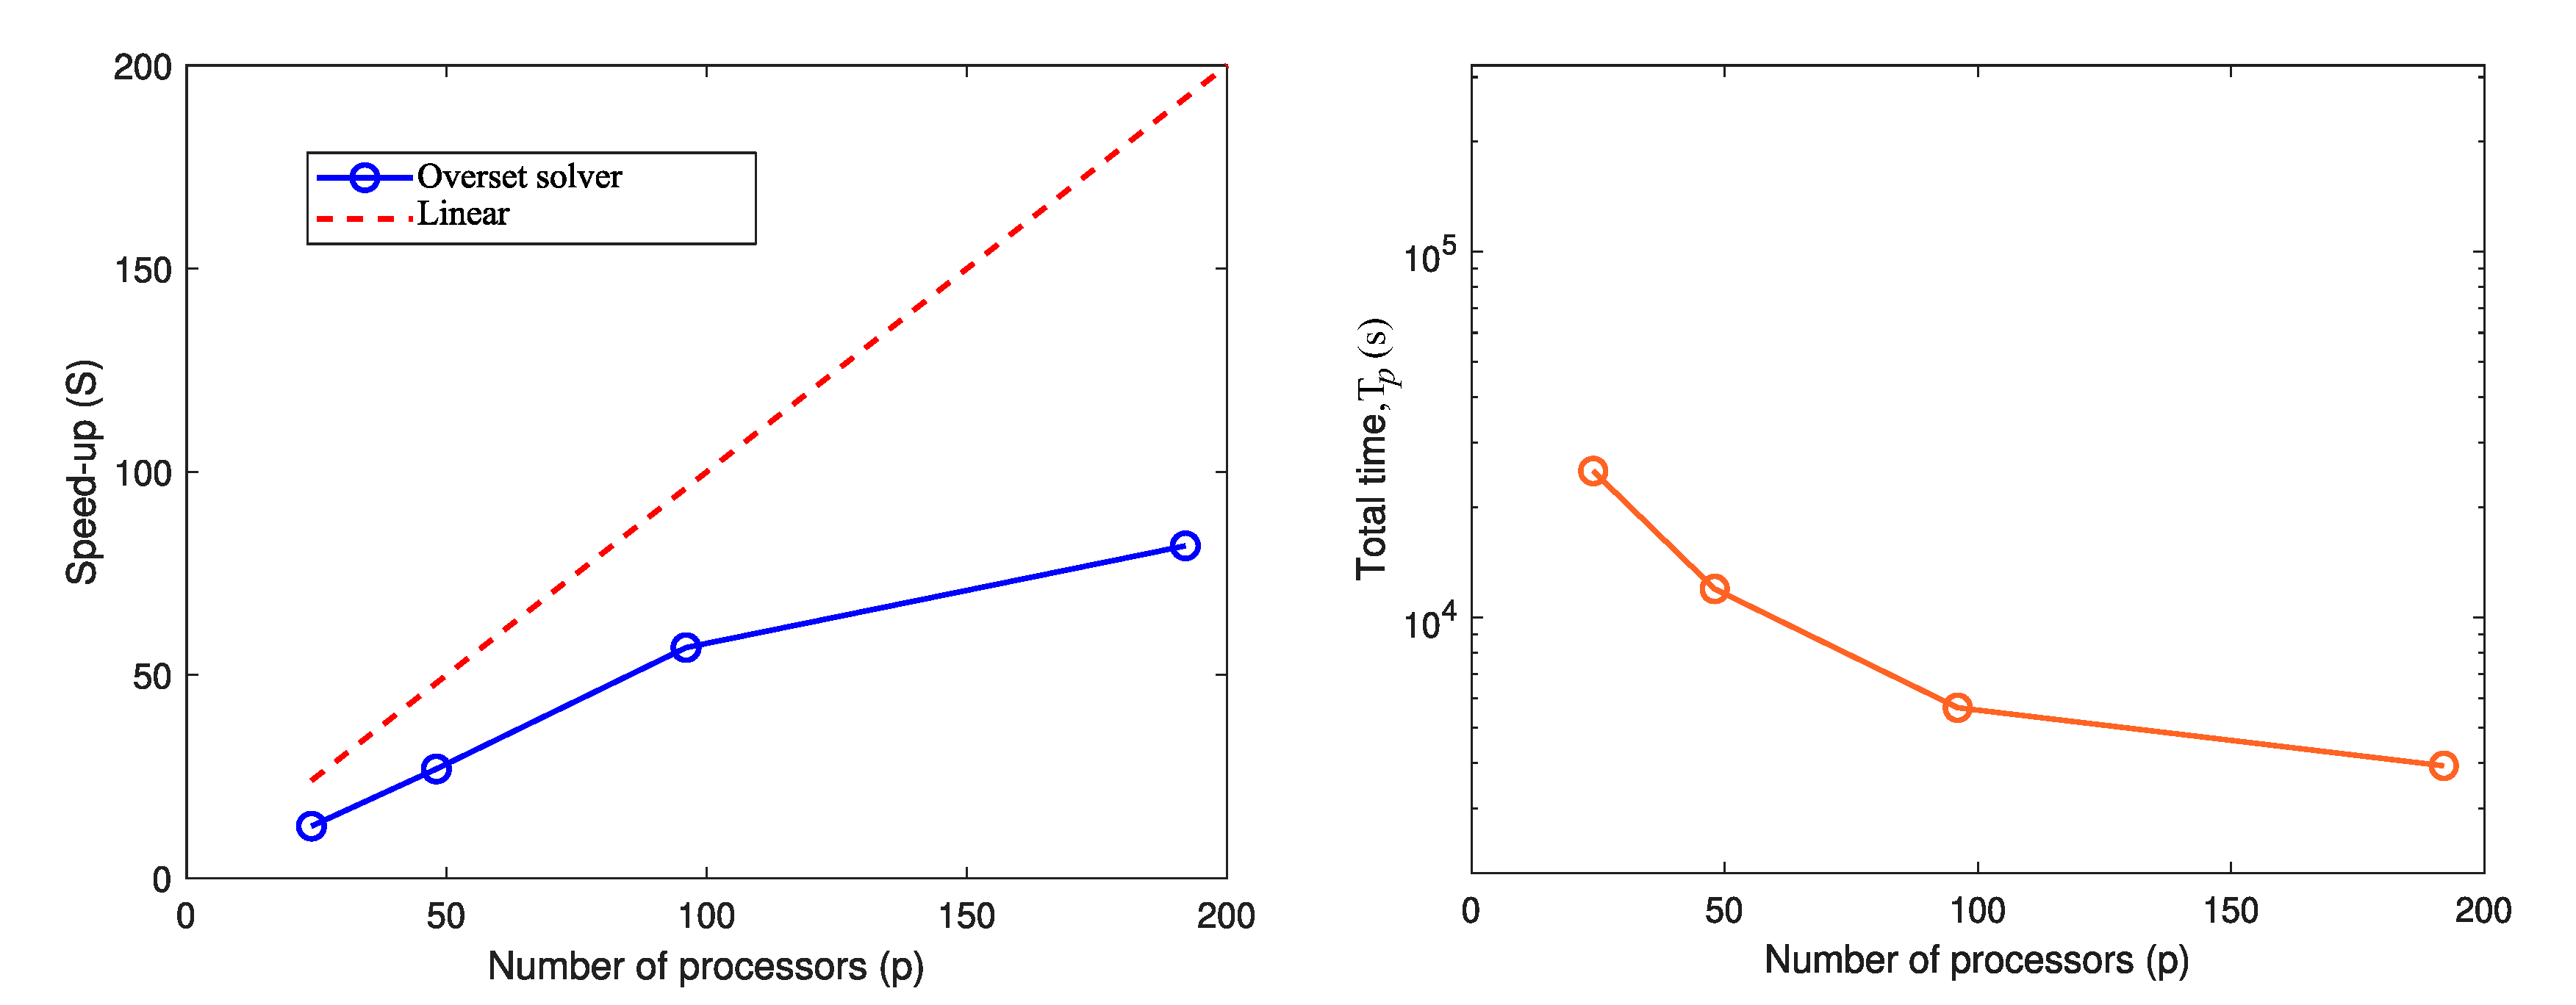
In order to assess the computational performance and parallel scalability of OGA implementation in OpenFOAM, three performance metrics were evaluated which are also useful in analyzing and comparing cost of different algorithms. These parameters included the parallel speed-up (S), total execution time ( T p ) for the complete simulation in seconds and efficiency ( η ) of parallel computations. These parameters are calculated as:
S = T s T p η = S p
where, T s and T p denote the total execution time for serial computation and parallel computations respectively. p represents the total number of processors used for parallel computation. The assessment was carried out by running a similar pitching panel case at R e = 2000, as discussed in the previous section, although a coarser grid was constructed for this analysis. Four computations were performed using 24, 48, 96 and 192 processors respectively. Figure 15 presents the results for Speed-up (S) and total execution time for parallel computations ( T p ) in seconds. Parallel scalability is observed using OGA as the speed-up increases with increasing p. The increase in the speed-up from p = 96 and 192 is only 44.15%, which implies that using processors beyond 192 would also require the problem to be scaled up in order to achieve a higher speed up. The reduction in total execution time with the increase in number of processors is also observed, where the curve approaches an asymptotic region after p = 96. The reduction in execution time for p = 96 and p = 192 is only 30.63%.
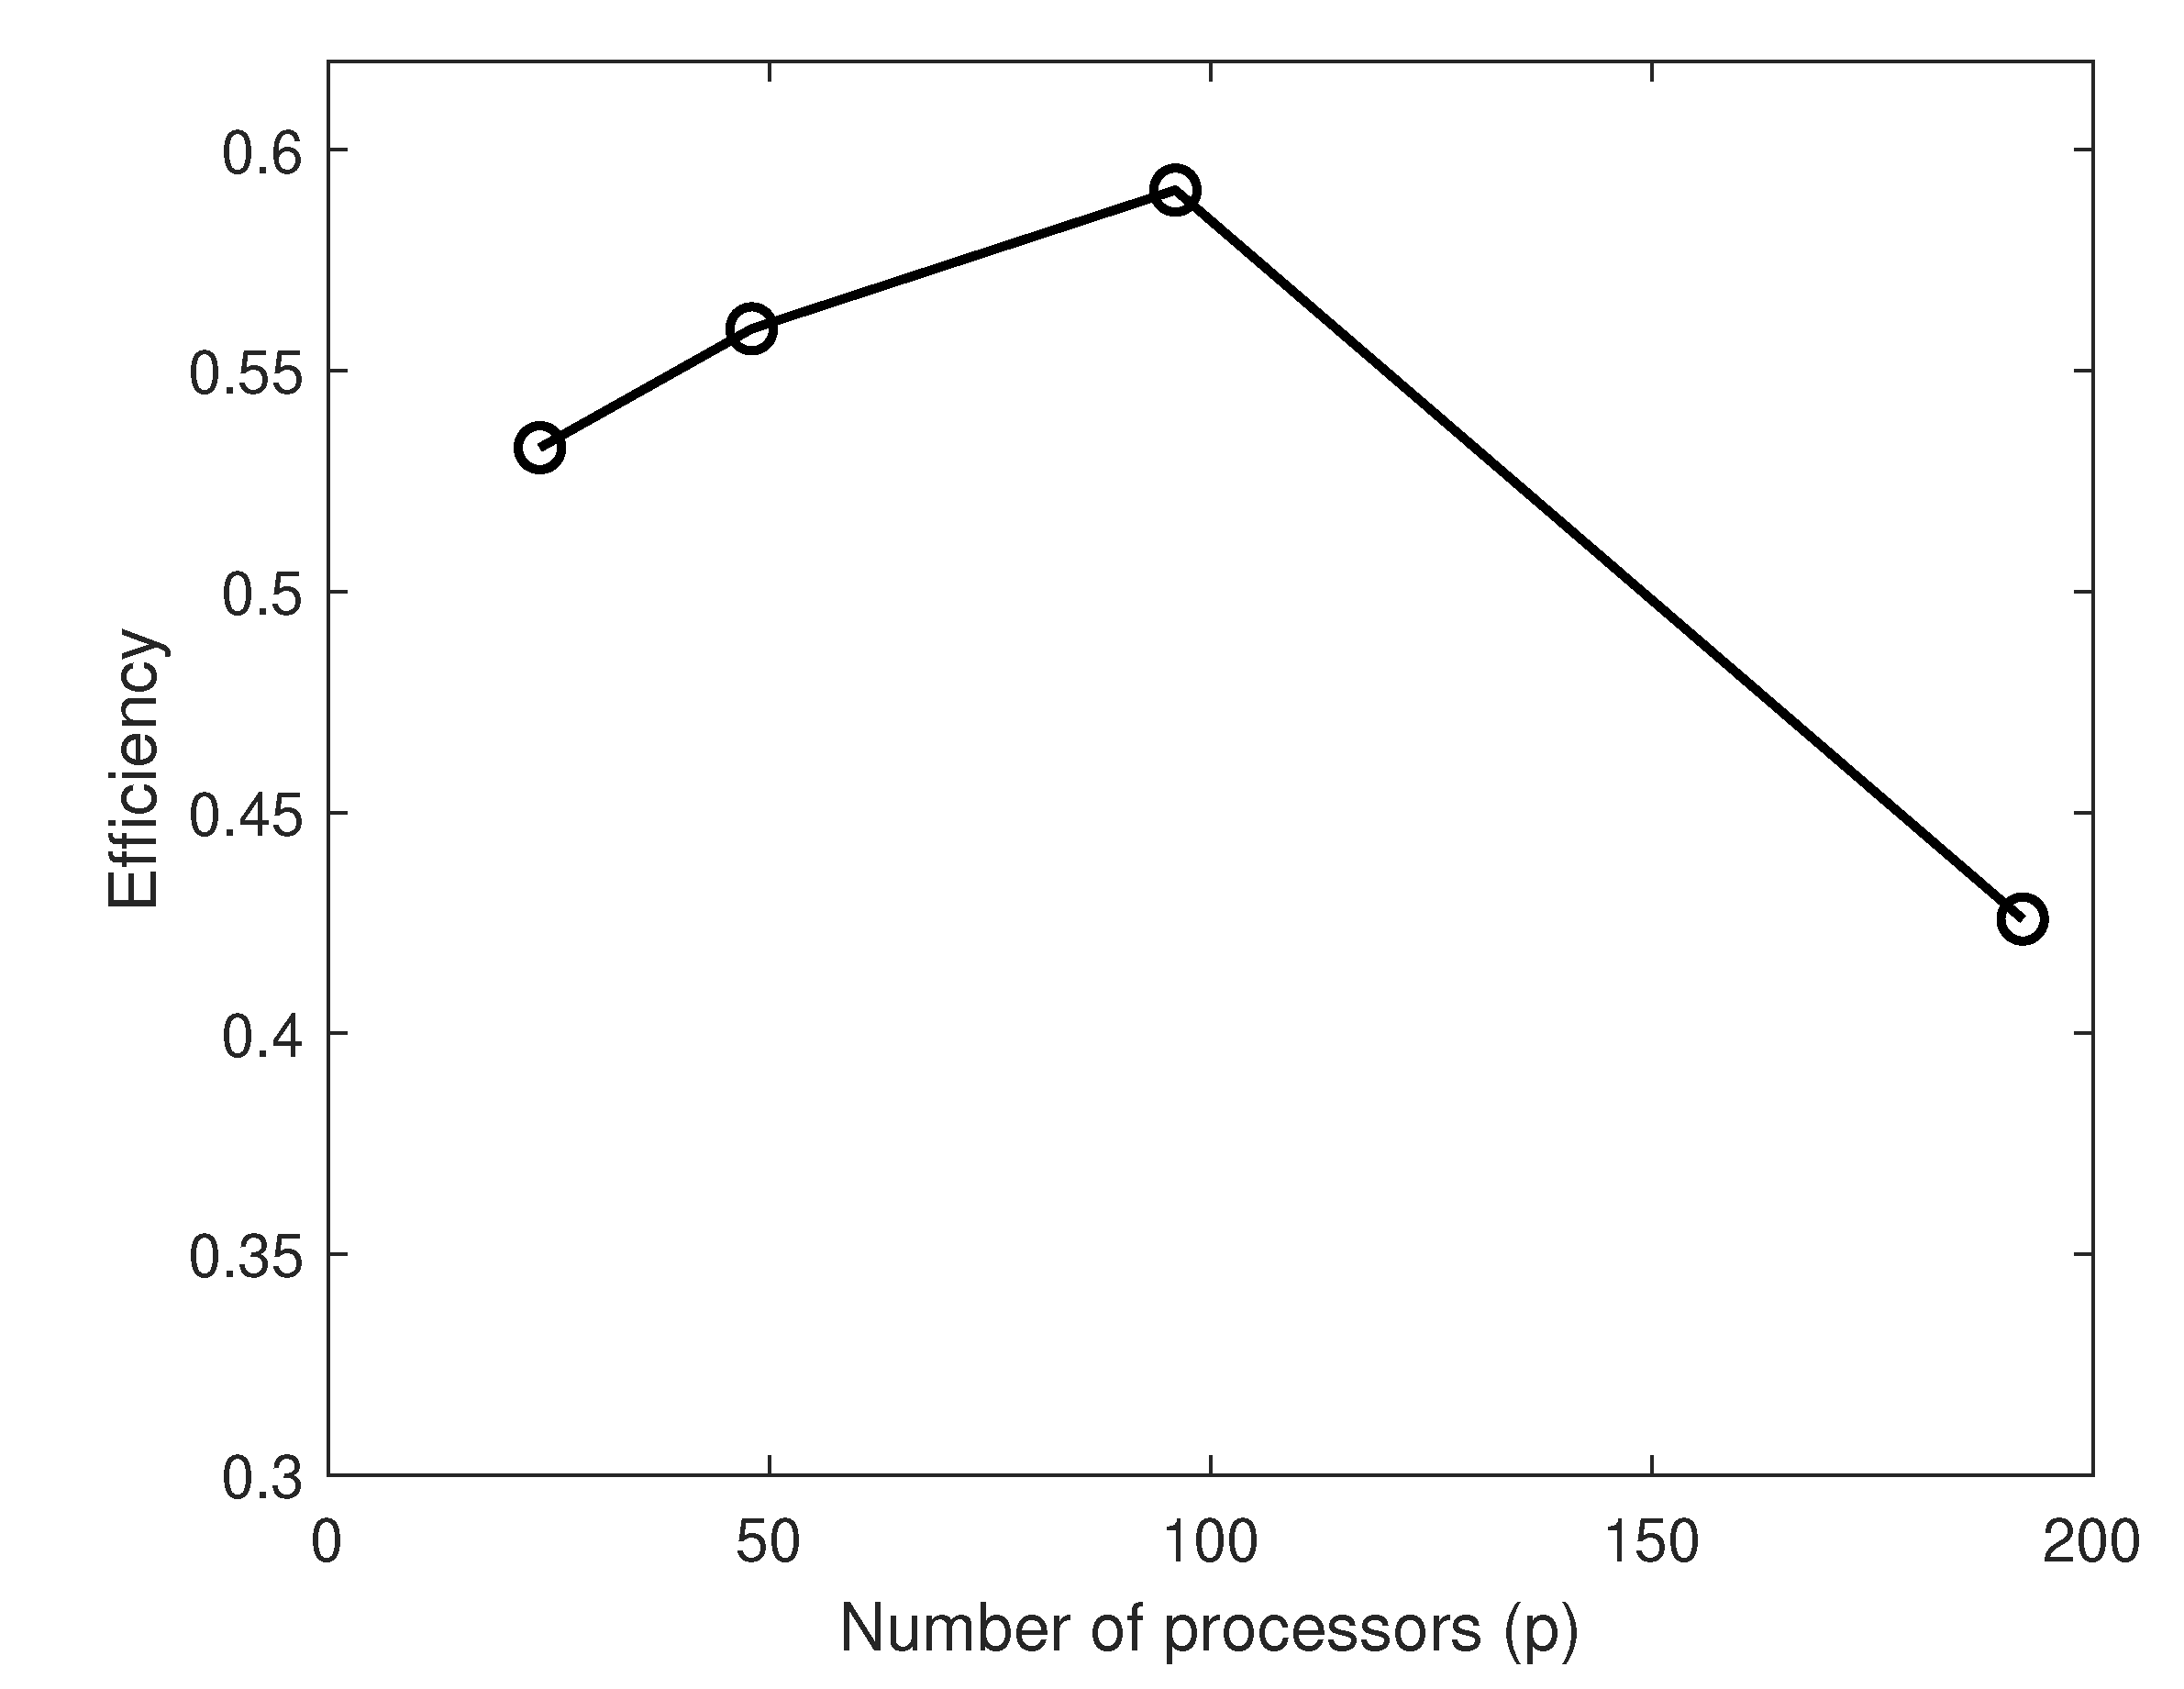
The efficiency for parallel computations is shown in Figure 16. An increase in efficiency is observed as p increases from 24 to 96, beyond which a reduction is observed for p = 192. Therefore in case of the problem size considered here, the maximum efficiency could be attained for p = 96. It is important to note that although the computational performance of the simulations increase if we use the newer versions of OpenFOAM, mainly v1912, the comparability of OGA with other numerical solvers, e.g., IBM, remains the same.

4. Conclusions

We presented a benchmark study of the Overset grid assembly (OGA) method in OpenFOAM to model the wake of stationary and pitching panels. The flow characteristics for stationary panels at different angles of attack were quantitatively evaluated. The average C d ¯ for the cases of α = 0 deg to 60 deg were in good agreement with previous studies [11,23]. The maximum difference was 6.36% and it was for the stationary square panel at α = 60 deg. This discrepancy may be overcome by using a higher order interpolation schemes for the overset solver in OpenFOAM [15] that also require a lesser CPU time for computation. The wake of a pitching square panel was numerically examined using OGA solver. The results were in good agreement with those of Senturk et al. [12]. The study of surface pressure variations on the panel indicated that there exists a higher streamwise pressure gradient across the top and bottom face of the panel at a high Reynolds number. This leads to increased extremum values for lift and drag. The wake structures and wake dynamics compared well with the experiments of Buchholz et al. [7]. Overall, the overset grid assembly method performed well in capturing the physics of the wake. In terms of parallelization, the efficient scalability of overset method was proven. The reduction in the computational time and increase in speed-up was achieved with increase in the number of processors. This presents an advantage over some other dynamic motion solvers such as the Immersed Boundary Method within OpenFOAM, wherein Senturk et al. [11,12] indicated that the development of parallelization is in early stages [11]. There was no information provided with regards to parallel scalability for IBM. The Overset method also avoids any remeshing process (at successive timesteps) that is usually noticed for body-fitted mesh approach thereby avoiding any grid quality issues, and saving computational time. Such beneficial features of Overset method highlights its faster applicability for flows wherein other possible solution techniques involve complexities and higher cost of computations.

Author Contributions

Conceptualization, methodology, formal analysis, investigation, writing–original draft preparation, S.V. and A.H.; resources, writing–review and editing, supervision, project administration, funding acquisition, A.H. All authors have read and agreed to the published version of the manuscript.

Funding

This study has received support from Future Energy Systems (through Canada First Research Excellence Fund) with project number T14-Q01.

Acknowledgments

Computational resources from Compute Canada were used for the simulations.

Conflicts of Interest

The authors declare no conflict of interest.

References

  1. Karman, T.V. On the mechanism of the drag a moving body experiences in a fluid. Prog. Aerosp. Sci. 2013, 59, 13–15. [Google Scholar] [CrossRef]
  2. Roshko, A. Experiments on flow past a circular cylinder at very high Reynolds number. J. Fluid Mech. 1961, 10, 345–356. [Google Scholar] [CrossRef] [Green Version]
  3. Roshko, A. On the Drag and Shedding Frequency of Two-Dimensional Bluff Bodies; National Advisory Committee for Aeronautics, Technical Note 3169; California Institute of Technology: Pasadena, CA, USA, 1954. [Google Scholar]
  4. Ellenrieder, K.D.V.; Parker, K.; Soria, J. Flow structures behind a heaving and pitching finite-span wing. J. Fluid Mech. 2003, 490, 129–138. [Google Scholar] [CrossRef]
  5. Guglielmini, L.; Blondeaux, P. Propulsive efficiency of oscillating foils. Eur. J. Mech. B/Fluids 2004, 23, 255–278. [Google Scholar] [CrossRef]
  6. Ohmi, K.; Coutanceauz, M.; Daube, O.; Loc, T.P. Further experiments on vortex formation around an oscillating and translating airfoil at large incidences. J. Fluid Mech. 1991, 225, 607–630. [Google Scholar] [CrossRef]
  7. Buchholz, J.H.J.; Smits, A.J. On the evolution of the wake structure produced by a low-aspect-ratio pitching panel. J. Fluid Mech. 2006, 546, 433–443. [Google Scholar] [CrossRef] [Green Version]
  8. Fage, A.; Johansen, F.C. On the flow of air behind an inclined flat plate of infinite span. Proc. R. Soc. Lond. Ser. Contain. Pap. Math. Phys. Character 1927, 116, 170–197. [Google Scholar]
  9. Von Ellenrieder, K.D.; Parker, K.; Soria, J. Visualization of a three dimensional heaving aerofoil flow. In Proceedings of the 14th Australasian Fluid Mechanics Conference, Adelaide, Australia, 10–14 December 2001. [Google Scholar]
  10. Blondeaux, P.; Fornarelli, F.; Guglielmini, L.; Triantafyllou, M.S.; Verzicco, R. Numerical experiments on flapping foils mimicking fish-like locomotion. Phys. Fluids 2005, 17, 113601. [Google Scholar] [CrossRef]
  11. Senturk, U.; Brunner, D.; Jasak, H.; Herzog, N.; Rowley, C.; Smits, A.J. Benchmark simulations of flow past rigid bodies using an open-source, sharp interface immersed boundary method. Prog. Comput. Fluid Dyn. 2019, 19, 205–219. [Google Scholar]
  12. Senturk, U.; Smits, A.J. Numerical simulations of the flow around a square pitching panel. J. Fluids Struct. 2018, 76, 454–468. [Google Scholar] [CrossRef]
  13. Lewin, G.C.; Haj-Hariri, H. Modelling thrust generation of a two-dimensional heaving airfoil in a viscous flow. J. Fluid Mech. 2003, 492, 339–362. [Google Scholar] [CrossRef]
  14. Panahi, R.; Shafieefar, M. Application of Overlapping Mesh in Numerical Hydrodynamics. Pol. Marit. Res. 2009, 16, 24–33. [Google Scholar] [CrossRef] [Green Version]
  15. Chandar, D. On overset interpolation strategies and conservation on unstructured grids in OpenFOAM. Comput. Phys. Commun. 2019, 239, 72–83. [Google Scholar] [CrossRef]
  16. Shenoy, R.; Smith, M.J.; Park, M.A. Unstructured Overset Mesh Adaptation with Turbulence Modeling for Unsteady Aerodynamic Interactions. J. Aircr. 2014, 51, 161–174. [Google Scholar] [CrossRef]
  17. Zhang, C.; Liu, X.; Fan, S.; Wan, D.; Wang, J. Implementation of Overset Grid in OpenFOAM and its validation to PMM model test of a container ship. In Proceedings of the 13th OpenFOAM Workshop (OFW13), Shanghai, China, 24–29 June 2018. [Google Scholar]
  18. Wang, J.; Wan, D. Wave effects on free running ship in standard zig-zag maneuver. In Proceedings of the 32th Workshop on Water Waves and Floating Bodies, Dalian, China, 23–26 April 2017. [Google Scholar]
  19. Chandar, D.; Gopalan, H. Comparative Analysis of the Arbitrary Mesh Interface(AMI) and Overset Methods for Dynamic Body Motions in OpenFOAM. In Proceedings of the 46th AIAA Fluid Dynamics Conference, Washington, DC, USA, 13–17 June 2016. [Google Scholar]
  20. Liu, J.; Akay, H.U.; Ecer, A.; Payli, R.U. Flows around moving bodies using a dynamic unstructured overset-grid method. Int. J. Comput. Fluid Dyn. 2010, 24, 187–200. [Google Scholar] [CrossRef]
  21. Morris, M.J.; Dutton, J.C.; Addy, A.L. Peak torque characteristics of butterfly valves. Proc. Forum Ind. Appl. Fluid Mech. 1987, 54, 63–66. [Google Scholar]
  22. Aarnes, J.R.; Jin, T.; Mao, C.; Haugen, N.E.; Luo, K.; Andersson, H.I. Treatment of solid objects in the Pencil Code using an immersed boundary method and overset grids. Geophys. Astrophys. Fluid Dyn. 2018. [Google Scholar] [CrossRef] [Green Version]
  23. Taira, K.; Colonius, T. Three-dimensional flows around low-aspect-ratio flat-plate wings at low Reynolds numbers. J. Fluid Mech. 2009, 623, 187–207. [Google Scholar] [CrossRef] [Green Version]
  24. Najjar, F.M.; Balachandar, S. Low frequency unsteadiness in the wake of normal flat plate. J. Fluid Mech. 1998, 370, 101–147. [Google Scholar] [CrossRef]
  25. Hemmati, A.; Wood, D.H.; Martinuzzi, R.J. Characteristics of distinct flow regimes in the wake of an infinite span normal thin flat plate. Int. J. Heat Fluid Flow 2016, 62, 423–436. [Google Scholar] [CrossRef]
  26. Dong, H.; Mittal, R.; Najjar, F.M. Wake topology and hydrodynamic performance of low-aspect-ratio flapping foils. J. Fluid Mech. 2006, 566, 309–343. [Google Scholar] [CrossRef] [Green Version]
  27. Deng, J.; Caulfield, C.P. Three-dimensional transition after wake deflection behind a flapping foil. Phys. Rev. E Stat. Nonlinear Soft Matter Phys. 2015, 91, 043017. [Google Scholar] [CrossRef]
  28. Deng, J.; Sun, L.; Shao, X. Dynamical features of the wake behind a pitching foil. Phys. Rev. E Stat. Nonlinear Soft Matter Phys. 2015, 92, 063013. [Google Scholar] [CrossRef]
  29. Narasimhamurthy, V.D.; Andersson, H.I. Numerical simulation of the turbulent wake behind a normal flat plate. Int. J. Heat Fluid Flow 2009, 30, 1037–1043. [Google Scholar] [CrossRef]
  30. Hemmati, A.; Wood, D.H.; Martinuzzi, R.J. On simulating the flow past a normal thin flat plate. J. Wind Eng. Ind. Aerodyn. 2017, 566, 170–187. [Google Scholar] [CrossRef]
  31. Hemmati, A.; Smits, A.J. The Effect of Pitching Frequency on the Hydrodynamics of Oscillating Foils. ASME J. Appl. Mech. 2019, 86, 101010. [Google Scholar] [CrossRef]
  32. Hemmati, A.; Buren, T.V.; Smits, A.J. Effects of trailing edge shape on vortex formation by pitching panels of small aspect ratio. Phys. Rev. Fluids 2019, 4, 033101. [Google Scholar] [CrossRef]
  33. Kim, Y.; Xie, Z.T. Modelling the effect of freestream turbulence on dynamic stall of wind turbine blades. Comput. Fluids 2016, 129, 53–66. [Google Scholar] [CrossRef] [Green Version]
  34. Petra, T. Description of the overset mesh approach in ESI version of OpenFOAM. In Proceedings of the CFD with OpenSource Software; Nilsson, H., Ed.; Chalmers University of Technology: Gothenburg, Sweden, 2019. [Google Scholar]
  35. Noack, R.; Boger, D.; Kunz, R.E.; Carrica, P. Sugar++: An improved general overset grid assembly capability. In Proceedings of the 19th AIAA Computational Fluid Dynamics Conference, San Antonio, TX, USA, 22–25 June 2009. [Google Scholar]
  36. Tay, W.B.; Bijl, H.; van Oudheusden, B.W. Biplane and Tail Effects in Flapping Flight. AIAA J. 2013, 51, 2133–2146. [Google Scholar] [CrossRef]
  37. Green, M.A.; Smits, A.J. Effects of three-dimensionality on thrust production by a pitching panel. J. Fluid Mech. 2008, 615, 211–220. [Google Scholar] [CrossRef] [Green Version]
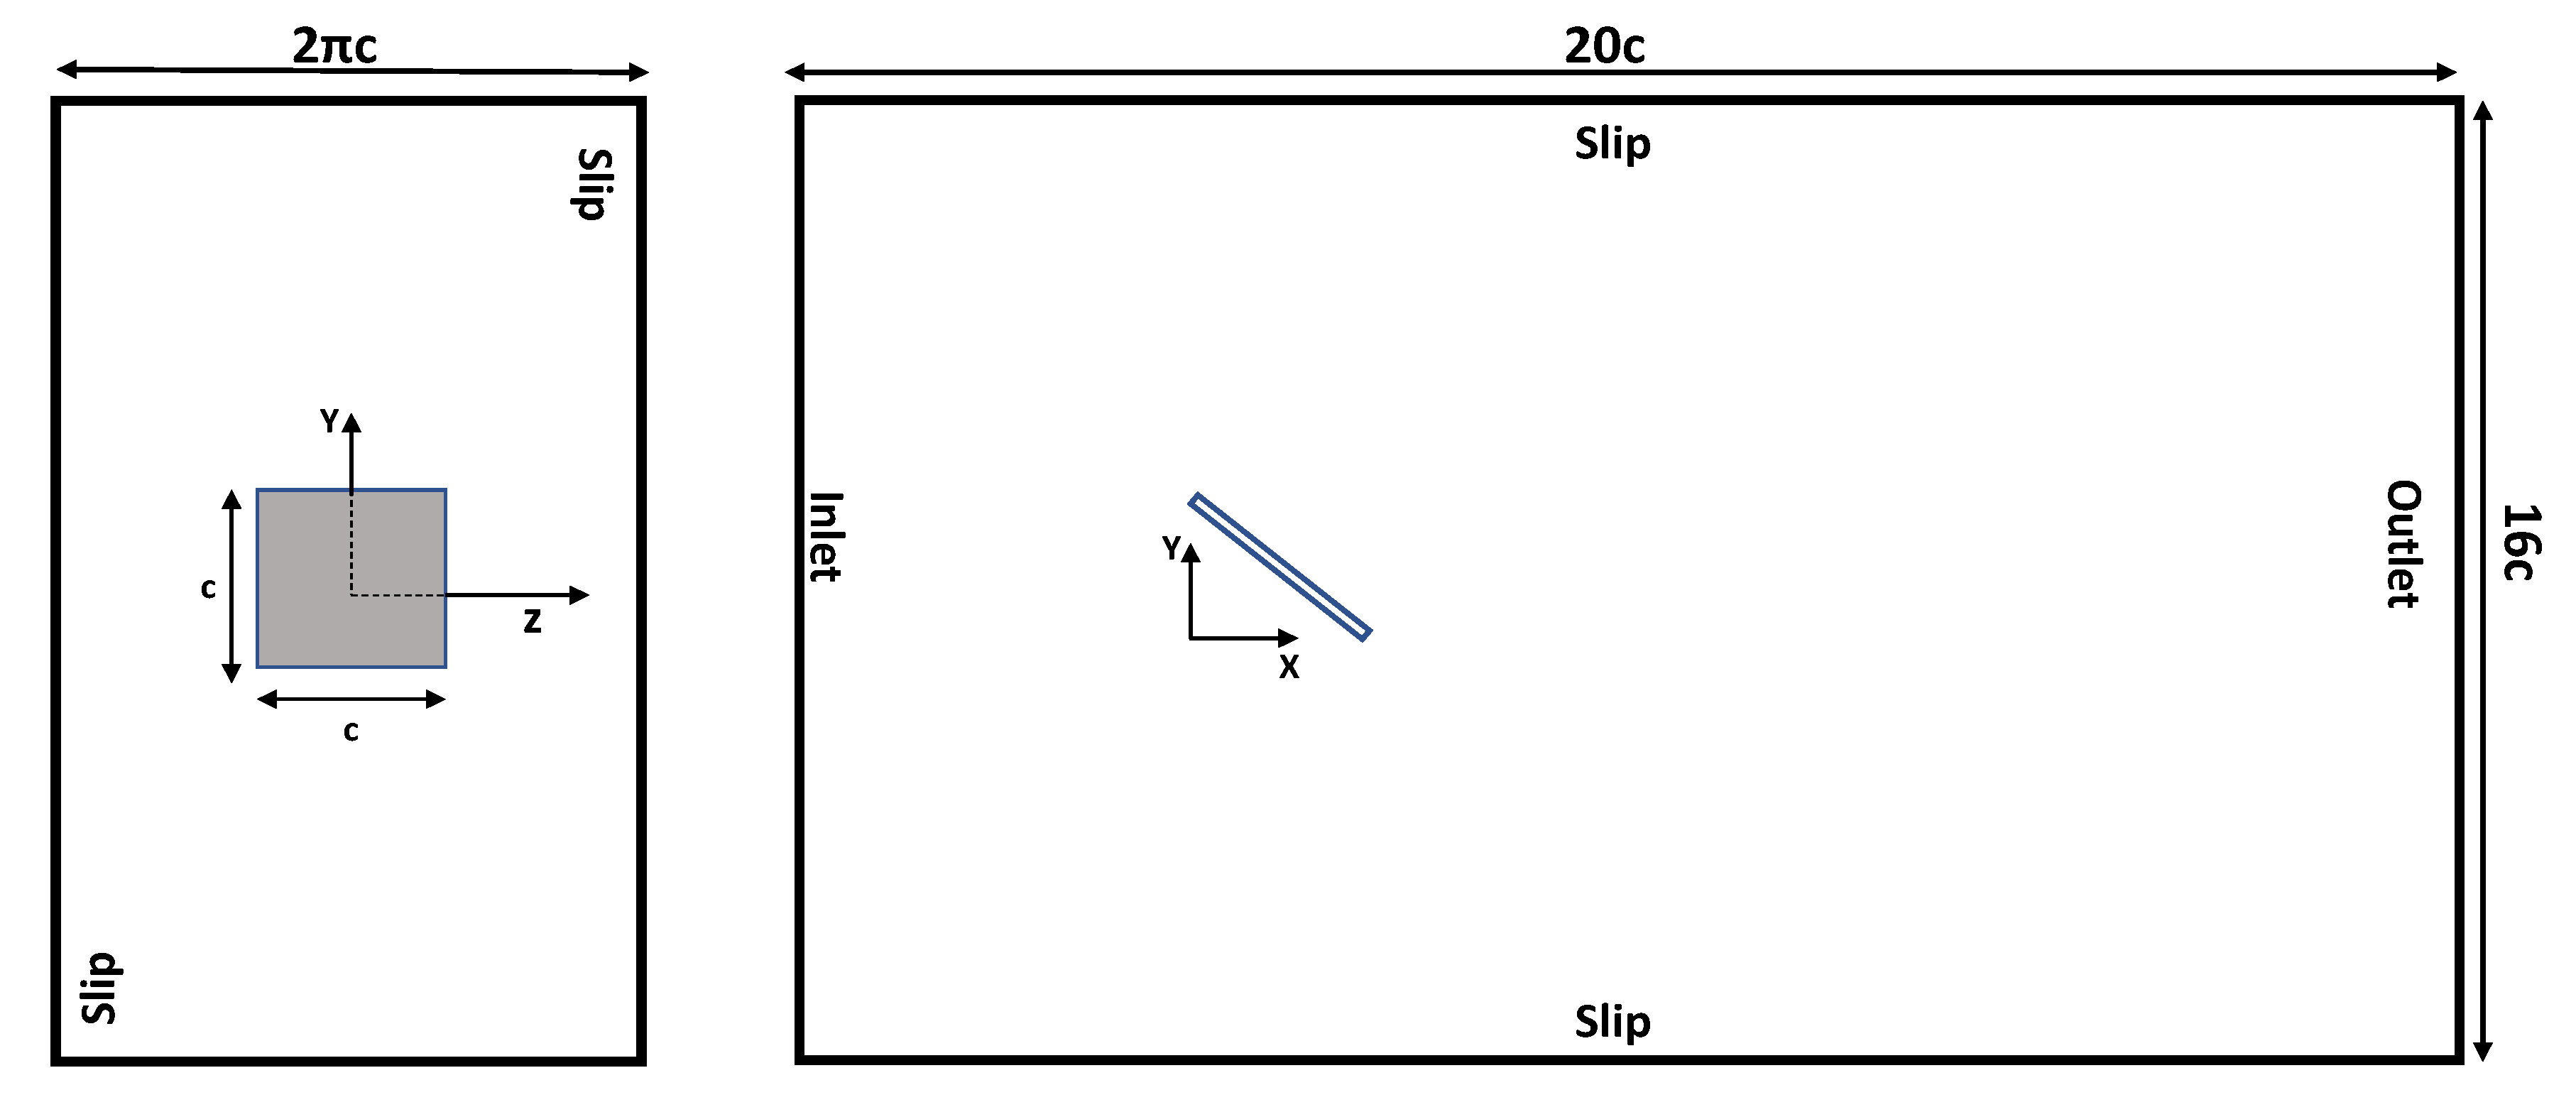
Figure 1. Schematic of the computational domain and boundary conditions.
Computation 08 00066 g001
Figure 2. (a) Merged background and overset grid for stationary panel at α = 30 (Case 3). (b) shows the Isometric view for the secondary or “Overset” grid, while (c) represents the chordwise view of the overset grid.
Computation 08 00066 g002
Figure 3. Parametric description of motion of pitching panel (Case 6–7).
Computation 08 00066 g003
Figure 4. Identification of cells by overset solver (a,b). The cell types depict how interpolation weights vary based on their distance from the hole points, as depicted in (b).
Computation 08 00066 g004
Figure 5. Variation of mean coefficient of drag ( C d ¯ ) with angle of attack ( α deg) for 3D stationary panel (Case 1–5).
Computation 08 00066 g005
Figure 6. Variation of C d with time for 2D stationary panel ( α = 30 deg), estimated using different overset interpolation techniques.
Computation 08 00066 g006
Figure 7. Contours of spanwise component of vorticity magnitude ( ω z * ) at x y -plane ( z = 0) for 3D stationary panel at α = 30 deg.
Computation 08 00066 g007
Figure 8. Iso-surfaces of vorticity magnitude ( | ω * | = 1.62 , 1.65 and 2.14 ), for cases of α = 30 deg, 45 deg and 60 deg respectively.
Computation 08 00066 g008
Figure 9. Contour plots for (a) C p and (b) C f variation across the top surface of pitching panel for ϕ = 0 , 90 , 180 and 270 , respectively. The Reynolds number is 500. The bottom plots show the variation of C p and C f across the midspan in chordwise direction. Black, red, blue and green correspond to the ϕ = 0 , 90 , 180 and 270 , respectively. Colored markers represent the data of Senturk et al. [12] at corresponding ϕ .
Computation 08 00066 g009
Figure 10. Contour plots for (a) C p and (b) C f variation across the top surface of pitching panel for ϕ = 0 , 90 , 180 and 270 , respectively. The Reynolds number is 2000.
Computation 08 00066 g010
Figure 11. Variation of Coefficients of lift ( C l ) and drag ( C d ) with normalized time t * , for (a) Case 6 and (b) Case 7, respectively.
Computation 08 00066 g011
Figure 12. Surface pressure contours of C p , plotted on top and bottom surface of square panel for (a) Case 6, and (b) Case 7, respectively, at positions of peak trailing edge amplitudes (i.e., ϕ = 90 and 270 ).
Computation 08 00066 g012
Figure 13. Iso-surfaces of vorticity magnitude ( | ω * | = 1 ) in chordwise (a) and spanwise direction (b) respectively. The Reynolds number is 2000.
Computation 08 00066 g013
Figure 14. Three dimensional isometric view of iso-surfaces corresponding to | ω * | = 1 (top). Black edges depict the overset grid boundaries. Bottom figures depict two-dimensional Iso-contours for time averaged velocity magnitude | u * ¯ | . The Reynolds number is 2000.
Computation 08 00066 g014
Figure 15. Variation of Speed-up (S) and total execution time (Tp) for simulation (in seconds), with increase in number of processors (p).
Computation 08 00066 g015
Figure 16. Variation of efficiency ( η ) with increase in number of processors (p).
Computation 08 00066 g016
Table 1. Case studies and relevant parameters for each case.
Case NumberMotion DescriptionAngle of Attack, α [deg]Maximum Amplitude, A [deg]Reynolds Number, Re Strouhal Number, St
1Stationary0-300-
2Stationary15-300-
3Stationary30-300-
4Stationary45-300-
5Stationary60-300-
6Pitching-85000.2
7Pitching-820000.2
Table 2. Grid sensitivity investigation.
StudyMethod N total , background N total , overset C d ¯ Relative Error Δ C d ¯ (Meshes)
Grid-1Direct 1.05 × 10 6 3.89 × 10 5 0.6129.50%-
Grid-2Direct 2.60 × 10 6 5.91 × 10 5 0.5895.40%3.7%
Grid-3Direct 5.85 × 10 6 2.09 × 10 6 0.5630.89%4.44%
Grid-4Direct 1.47 × 10 7 6.86 × 10 6 0.560.35%0.5%
Taira et al. [23]Direct 2.25 × 10 6 -0.558--
Table 3. CPU time requirement for different interpolation schemes employed for 2D stationary panel at α = 30 deg.
Sim. No.TechniqueCPU Time ( s )
1InverseDistance11,330.14
2CellVolumeWeight40,779.31
3LeastSquares15,361.44
4TrackingInverseDistance12,619.05