Article

Modified Equation of Shock Wave Parameters

Department of Architectural Engineering, Inha University, Incheon 22212, Korea
*
Author to whom correspondence should be addressed.
Computation 2017, 5(3), 41; https://doi.org/10.3390/computation5030041
Submission received: 11 August 2017 / Revised: 11 September 2017 / Accepted: 16 September 2017 / Published: 18 September 2017
(This article belongs to the Section Computational Engineering)

Abstract

:
Among the various blast load equations, the Kingery-Bulmash equation is applicable to both a free-air burst and a surface burst that enables calculations of the parameters of a pressure-time history curve. On the other hand, this equation is quite complicated. This paper proposes a modified equation that may replace the conventional Kingery-Bulmash equation. The proposed modified equation, which was constructed by performing curve-fitting of this equation, requires a brief calculation process with a simpler equation compared to the original equation. The modified equation is also applicable to both types of bursts and has the same calculable scaled distance range as the conventional equation. The calculation results obtained using the modified equation were similar to the results obtained from the original equation with a less than 1% difference.

1. Introduction

Owing to the increasing damage to structures and human life due to blasts, such as terrorist attacks and gas explosion accidents, social concerns regarding abnormal loads, such as impacts and bursts, is increasing. Accordingly, many studies have assessed the effects of abnormal loads worldwide [1,2,3]. In addition, the need for blast resistance design is increasing due to recent international terrorist attacks and their threat.
The blast load can be estimated using a blast load equation and numerical analysis. The former method employs an equation established based on the experimental data of various bursts [4]. The method using a blast load equation allows the easy and rapid calculation of a blast load, but it is applicable only to cases where a blast wave strikes an object directly. The latter method is used to analyze the behavior of a fluid after a burst and estimates the resulting pressure [5]. This method is applicable to various cases using a range of numerical analysis models, but requires a long time for the load calculation. The most extensively used numerical analysis method employs a blast load equation; these equations are used for explosion-proof design of structures and exterior materials [6,7,8].
Many studies have been conducted to establish blast load equations in the past. Because blast loading is challenging to deal with by a theoretical approach, empirical formulae based on experimental data have been suggested [9,10,11,12,13,14]. The Kingery-Bulmash equation, which is the most widely used equation, has been applied to UFC 3-340-02 [15], a manual published by the U.S. Department of Defense, and Conwep [16], a blast load estimation software developed by the U.S. Army Corps of Engineers. On the other hand, the Kingery-Bulmash equation includes complicated calculation processes, which makes a direct calculation of a blast load difficult. Swisdak proposed a simplified Kingery-Bulmash equation [17], but the application of the equation was limited to a surface burst. This paper briefly introduces the characteristics of blast loading and various equations for a blast load estimation, and proposes a modified equation.

2. Characteristics of Blast Load

Bursts can be classified as free-air bursts, and surface bursts according to the position of detonation. A free-air burst refers to a burst in the air at a position far away from the ground surface, as shown in Figure 1a. In the case of a free-air burst, the shock wave generated from the center of the burst position is propagated spherically and strikes a structure directly without amplification in the process of propagation. A surface burst refers to a burst that occurs on the ground surface, as shown in Figure 1b. In this case, the shock wave is amplified from the burst position by reflection on the ground surface [15].
A shock wave generated by a burst applies air pressure to a structure, and the load by the pressure may be represented by a pressure-time history curve, as shown in Figure 2.
The maximum pressure is found instantaneously at the moment when the shock wave reaches an object, and then the pressure is decreased rapidly (positive pressure phase). A negative pressure that is lower than atmospheric pressure is generated and then converges gradually to atmospheric pressure (negative pressure phase). On the other hand, only the positive pressure phase is considered in most burst analyses because the effect of the negative pressure phase is negligible compared to the positive pressure phase.
As shown in Figure 2, a pressure-time history curve of a blast load may be represented by several parameters. The following parameters were used to estimate the blast load:
  • P s : Maximum incident blast overpressure;
  • P r : Maximum reflected blast overpressure;
  • I s : Impulse by the incident blast overpressure;
  • I r : Impulse by the reflected blast overpressure;
  • T a : Arrival time of the shock wave;
  • T o : Duration of the positive pressure phase;
  • U : Velocity of the shock wave at arrival.
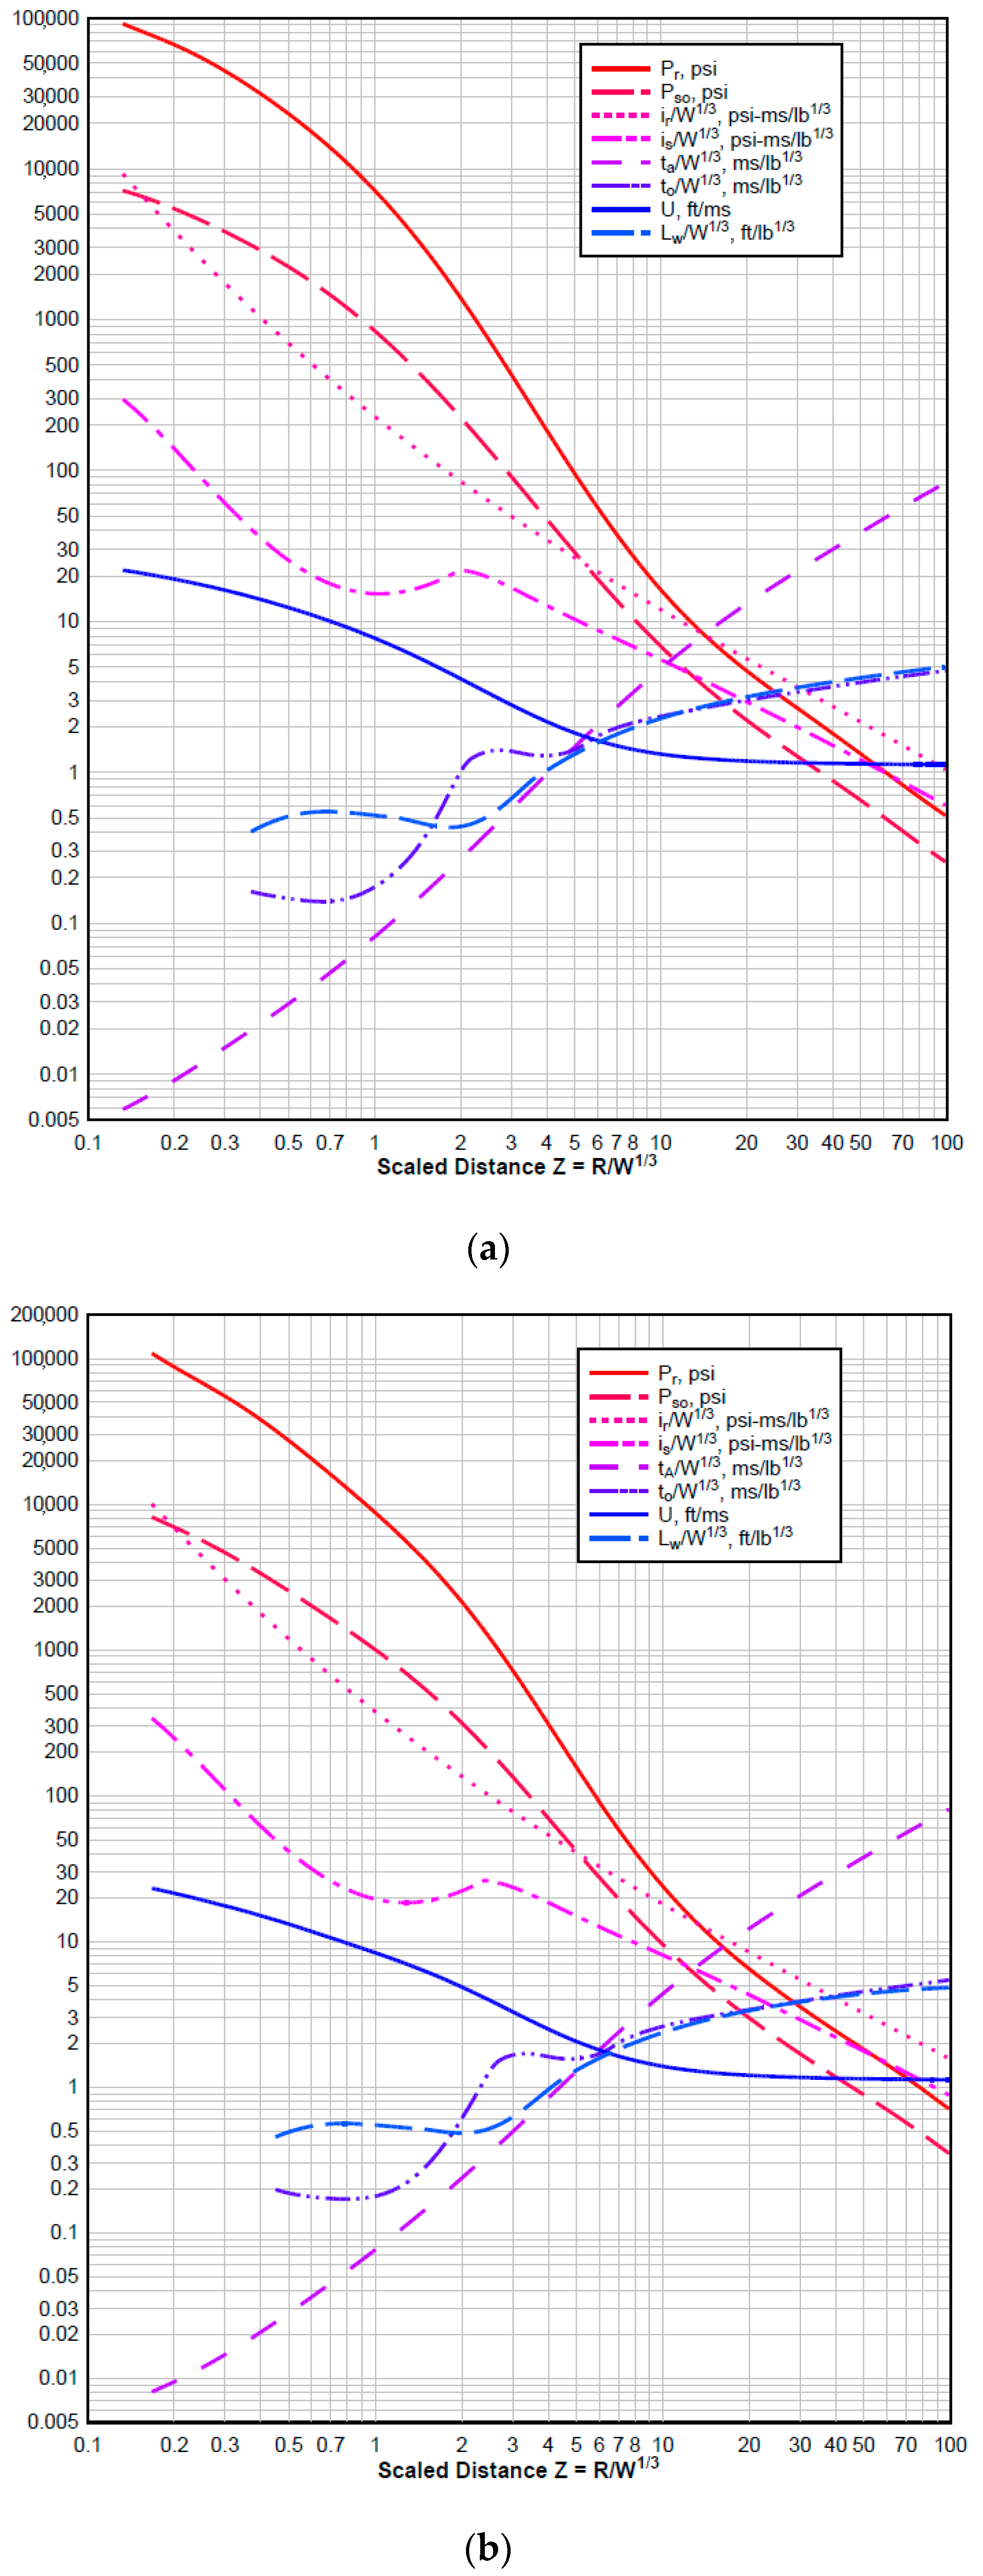
The UFC 3-340-02 provides diagrams of these parameters depending on the scaled distance for a free-air burst and a surface burst (Figure 3) [15].

3. Equations of a Blast Load

Various equations for estimating the blast loads have been suggested. These equations, which have various forms, are empirical equations built on experimental data, because the blast loads are difficult to deal with through a theoretical approach, such as the Sadovsky equation, the Brode equation, the Kingery-Bulmash equation, etc. [9,10,11,12,13,14]. Most equations commonly employ a scaled distance as a parameter, which is calculated using Equation (1):
Z = R / W 1 / 3
where, Z : Scaled distance; R : Distance to the burst position; W : TNT weight.
Kingery and Bulmash provided equations for calculating all the parameters together for a free-air burst or a surface burst in addition to the maximum incident blast overpressure, as shown in Equations (2a) and (2b) [14]:
U = K 0 + K 1 × log Z
Y = 10 ( C 0 + C 1 × U + C 2 × U 2 + + C N × U N )
where, Y : Shock wave parameters ( P s , P r , I s / W 1 / 3 , I r / W 1 / 3 , T a / W 1 / 3 , T o / W 1 / 3 , U ); K : Constants.
The Kingery-Bulmash equation enables calculations of the free-air burst parameters in a scaled distance range of 0.05 to 40 m / kg 1 / 3 (0.132 to 100 ft / lb 1 / 3 ) and the surface burst parameters in a scaled distance range of 0.06 to 40 m / kg 1 / 3 (0.167 to 100 ft / lb 1 / 3 ). The constants, K and C, are dependent on the type of burst, the range of scaled distance, and the parameters to be calculated. The number of the constant K is 2, while that of the constant C ranges from 4 to 15. For example, Table 1 lists the constants K and C used to calculate the maximum incident overpressure in a free-air burst.
In addition, the simplified Kingery equation for an air-blast calculation suggested by Swisdak (hereinafter called Swisdak equation) is expressed in Equation (3) [17]:
Y = e ( A + B × ln Z + C × ( ln Z ) 2 + + G × ( ln Z ) 6 )
This Swisdak equation, which built on the Kingery-Bulmash equation, includes two to seven constants. The error rate of the equation compared to the conventional equation is less than 1%, indicating that the Swisdak equation is considerably accurate. On the other hand, this equation is applicable only to a surface burst, and the range of scaled distances that can be calculated using this equation does not incorporate the range of conventional equations. For example, Table 2 lists the constants used to calculate the maximum incident overpressure.

4. Modified Equation of the Blast Load

As described above, the Kingery-Bulmash equation is applicable to both a free-air burst and a surface burst and enables calculations of all the parameters of the pressure-time history curve of a blast load. In addition, this equation is the most widely used as it has been applied to UFC 3-340-02, a manual published by the U.S. Department of Defense, and Conwep, blast load estimation software developed by the U.S. Army Corps of Engineers (commercial software programs used frequently for explosion analysis, including Abaqus [19], Autodyn [20], and LS-Dyna [21], are equipped with the Conwep model for a blast load estimation). On the other hand, the equation has a long calculation process including three stages. In addition, it is complicated and requires many constants for calculations. Therefore, the present article proposes a modified equation based on the Kingery-Bulmash equation.
The following conditions were established for the modified equation:
  • The modified equation should be based on the Kingery-Bulmash equation.
  • The modified equation should incorporate the entire range of scaled distances provided in the conventional equation. (The range of scaled distances is 0.05 to 40 m / kg 1 / 3 for a free-air burst and 0.06 to 40 m / kg 1 / 3 for a surface burst).
  • The calculation of the variable, U, included in the conventional equation should be omitted.
  • The basic form of the function should be an exponential function, and the exponent should be expressed as a polynomial using the common logarithm of scaled distance ( log Z ) as a variable.
  • The number of constants used for the modified equation should be less than or equal to five, and the constants should have five significant figures.
  • The error rate with the conventional equation should be less than or equal to 1% over the entire range of scaled distance.
According to the conditions described above, the calculation process of the modified equation was established as follows:
Step 1. Calculate the scaled distance, Z
Step 2. Calculate the parameters
Y = 10 ( C 0 + C 1 × log Z + C 2 × ( log Z ) 2 + C 3 × ( log Z ) 3 + C 4 × ( log Z ) 4 )
The curve fitting algorithm based on the values of the original equation was used to determine the constant, C, of the modified equation. The curve fitting algorithm was used by Levenberg-Marquardt, and it enables relatively stable and rapid convergence to the solution [22,23]. This method, which is a representative method of solving a nonlinear least square problem, combines the Gauss-Newton method and the gradient descent method. Table 3 and Table 4 present the constant, C, determined by curve fitting for a free-air burst and a surface burst, respectively.
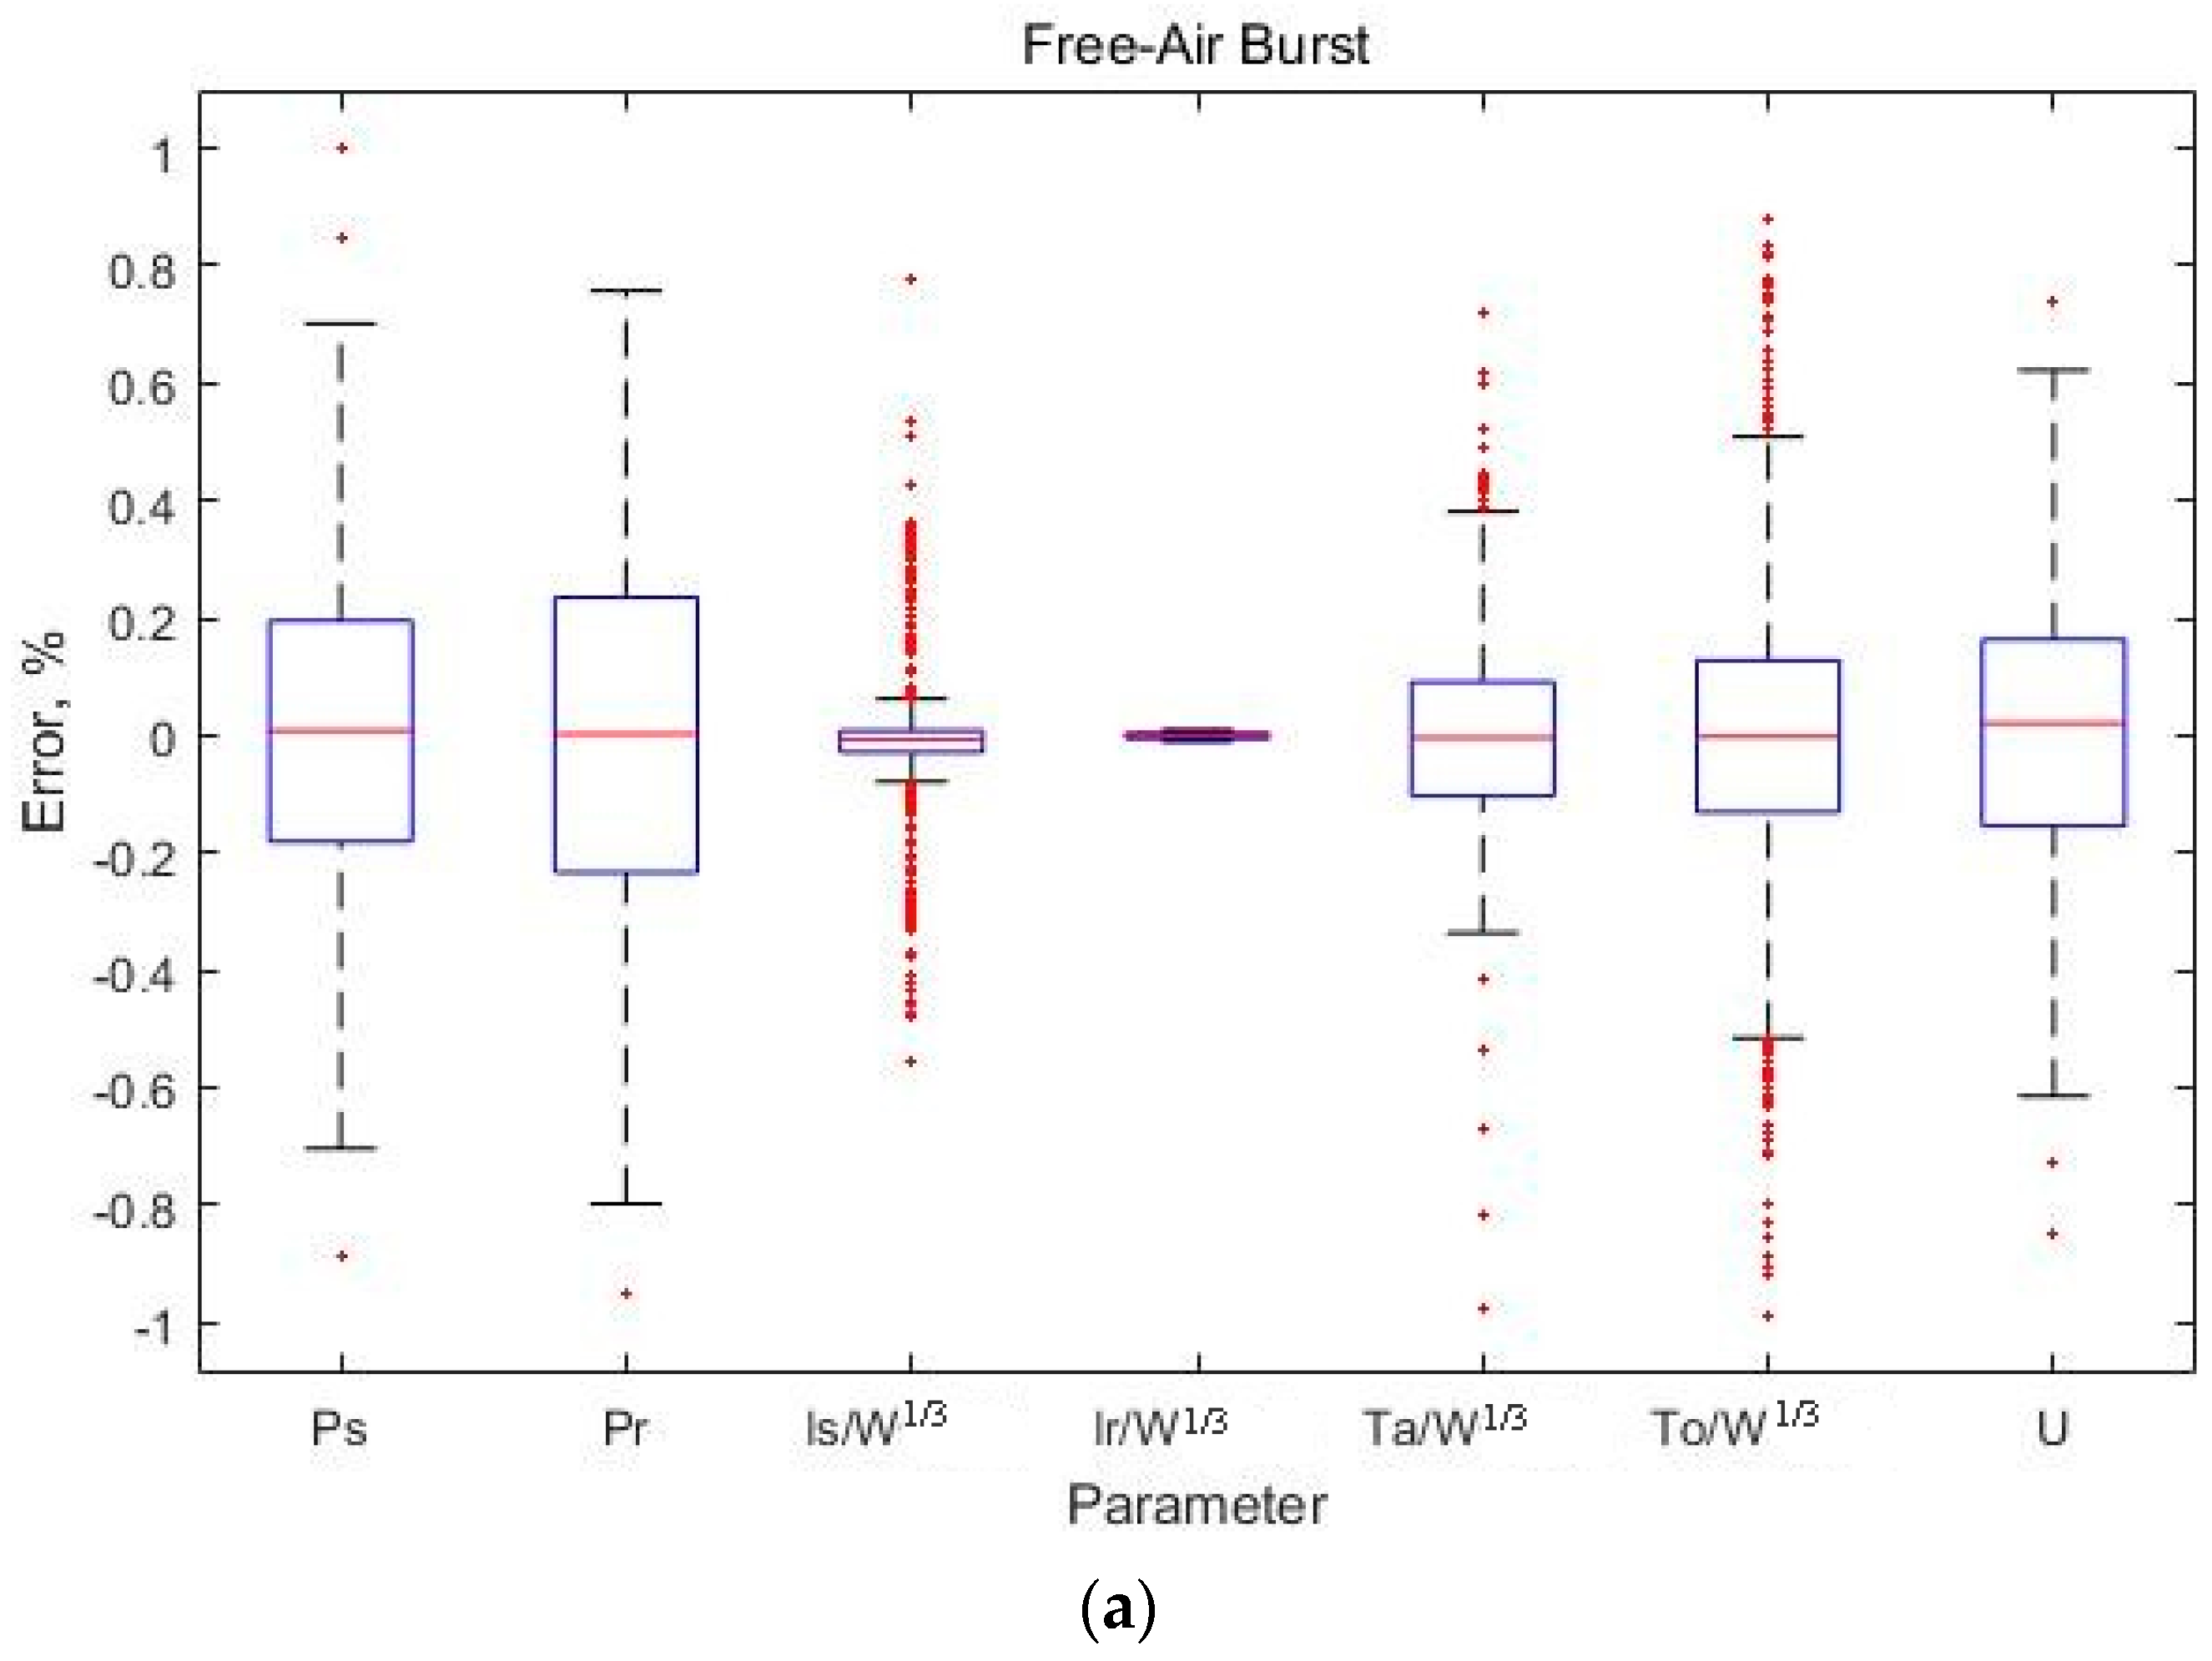
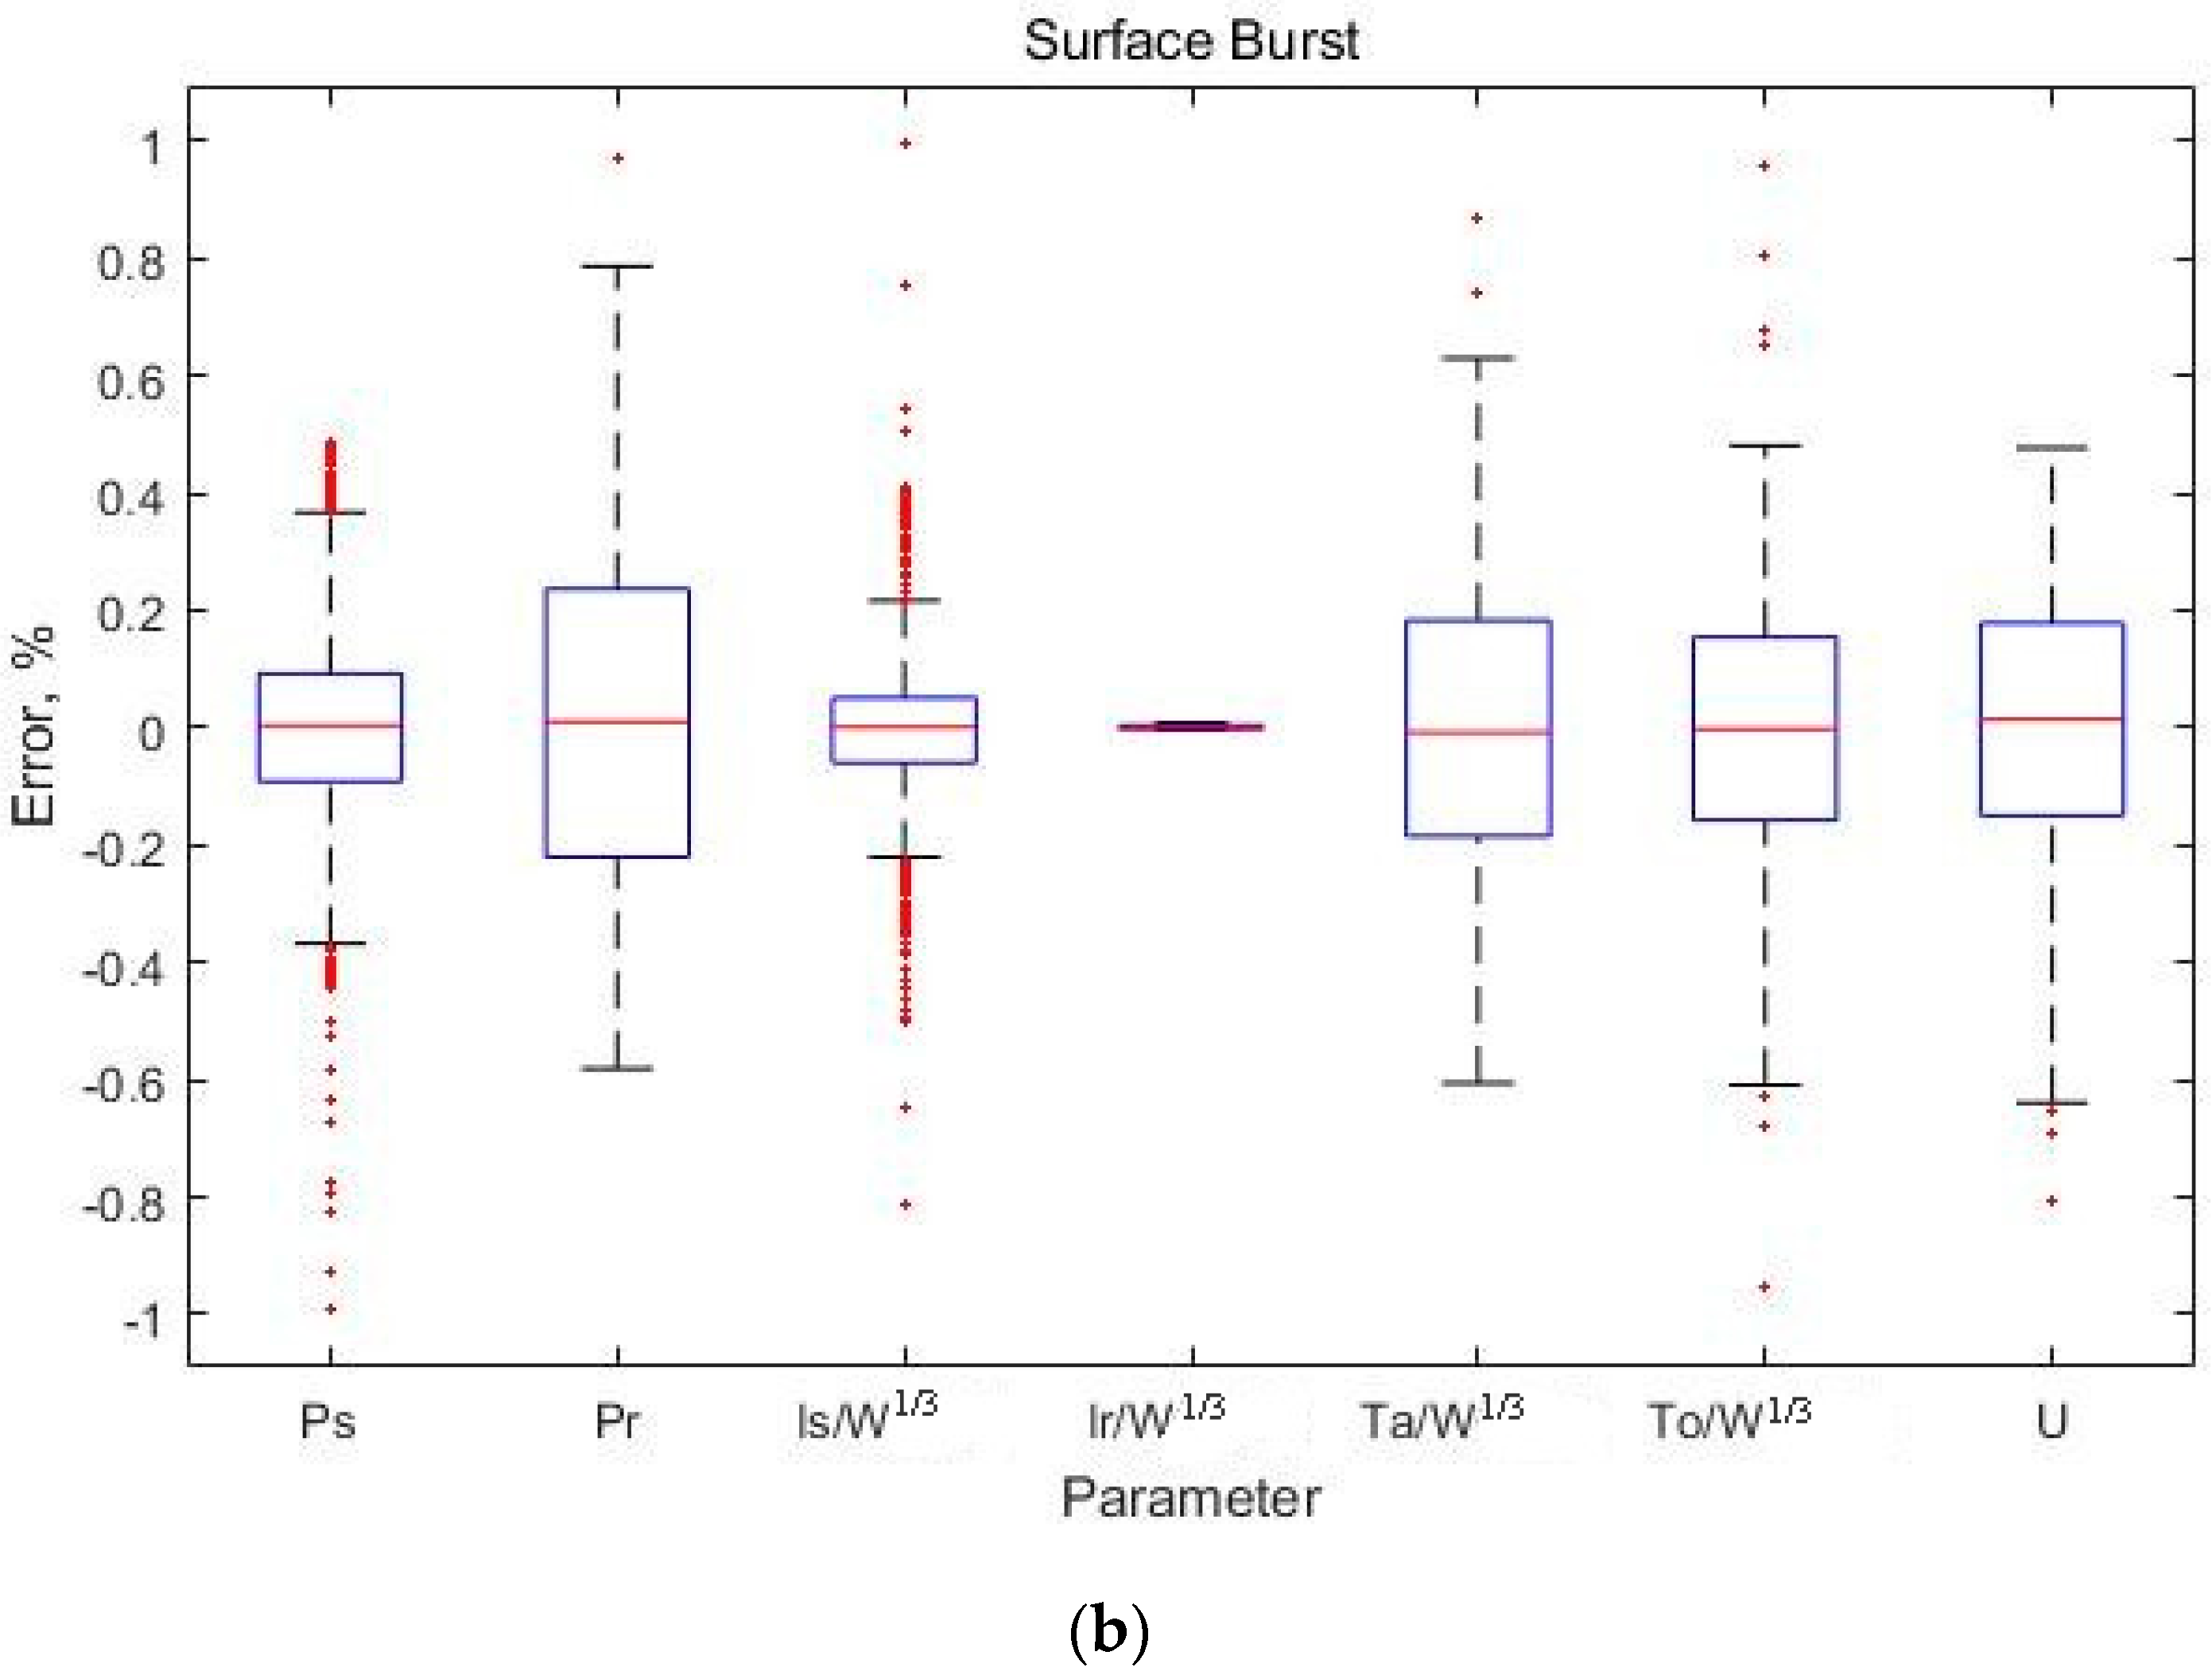
To compare the modified equation proposed in the present article and the conventional Kingery-Bulmash equation, the error between the two equations was calculated at 500 points with respect to the entire range of scaled distances (Table 5 and Table 6). The results showed that the maximum error rate is less than or equal to 1% and the mean error rate is less than or equal to 0.3%, indicating that the modified equation proposed in the present article is consistent with the conventional equation (Figure 4).

5. Verification of the Modified Equation

In order to verify the modified equation, two types of simple plate models with properties as shown in Table 7 were set up, and the residual displacements were compared by applying the Kingery-Bulmash equation and the modified equation.
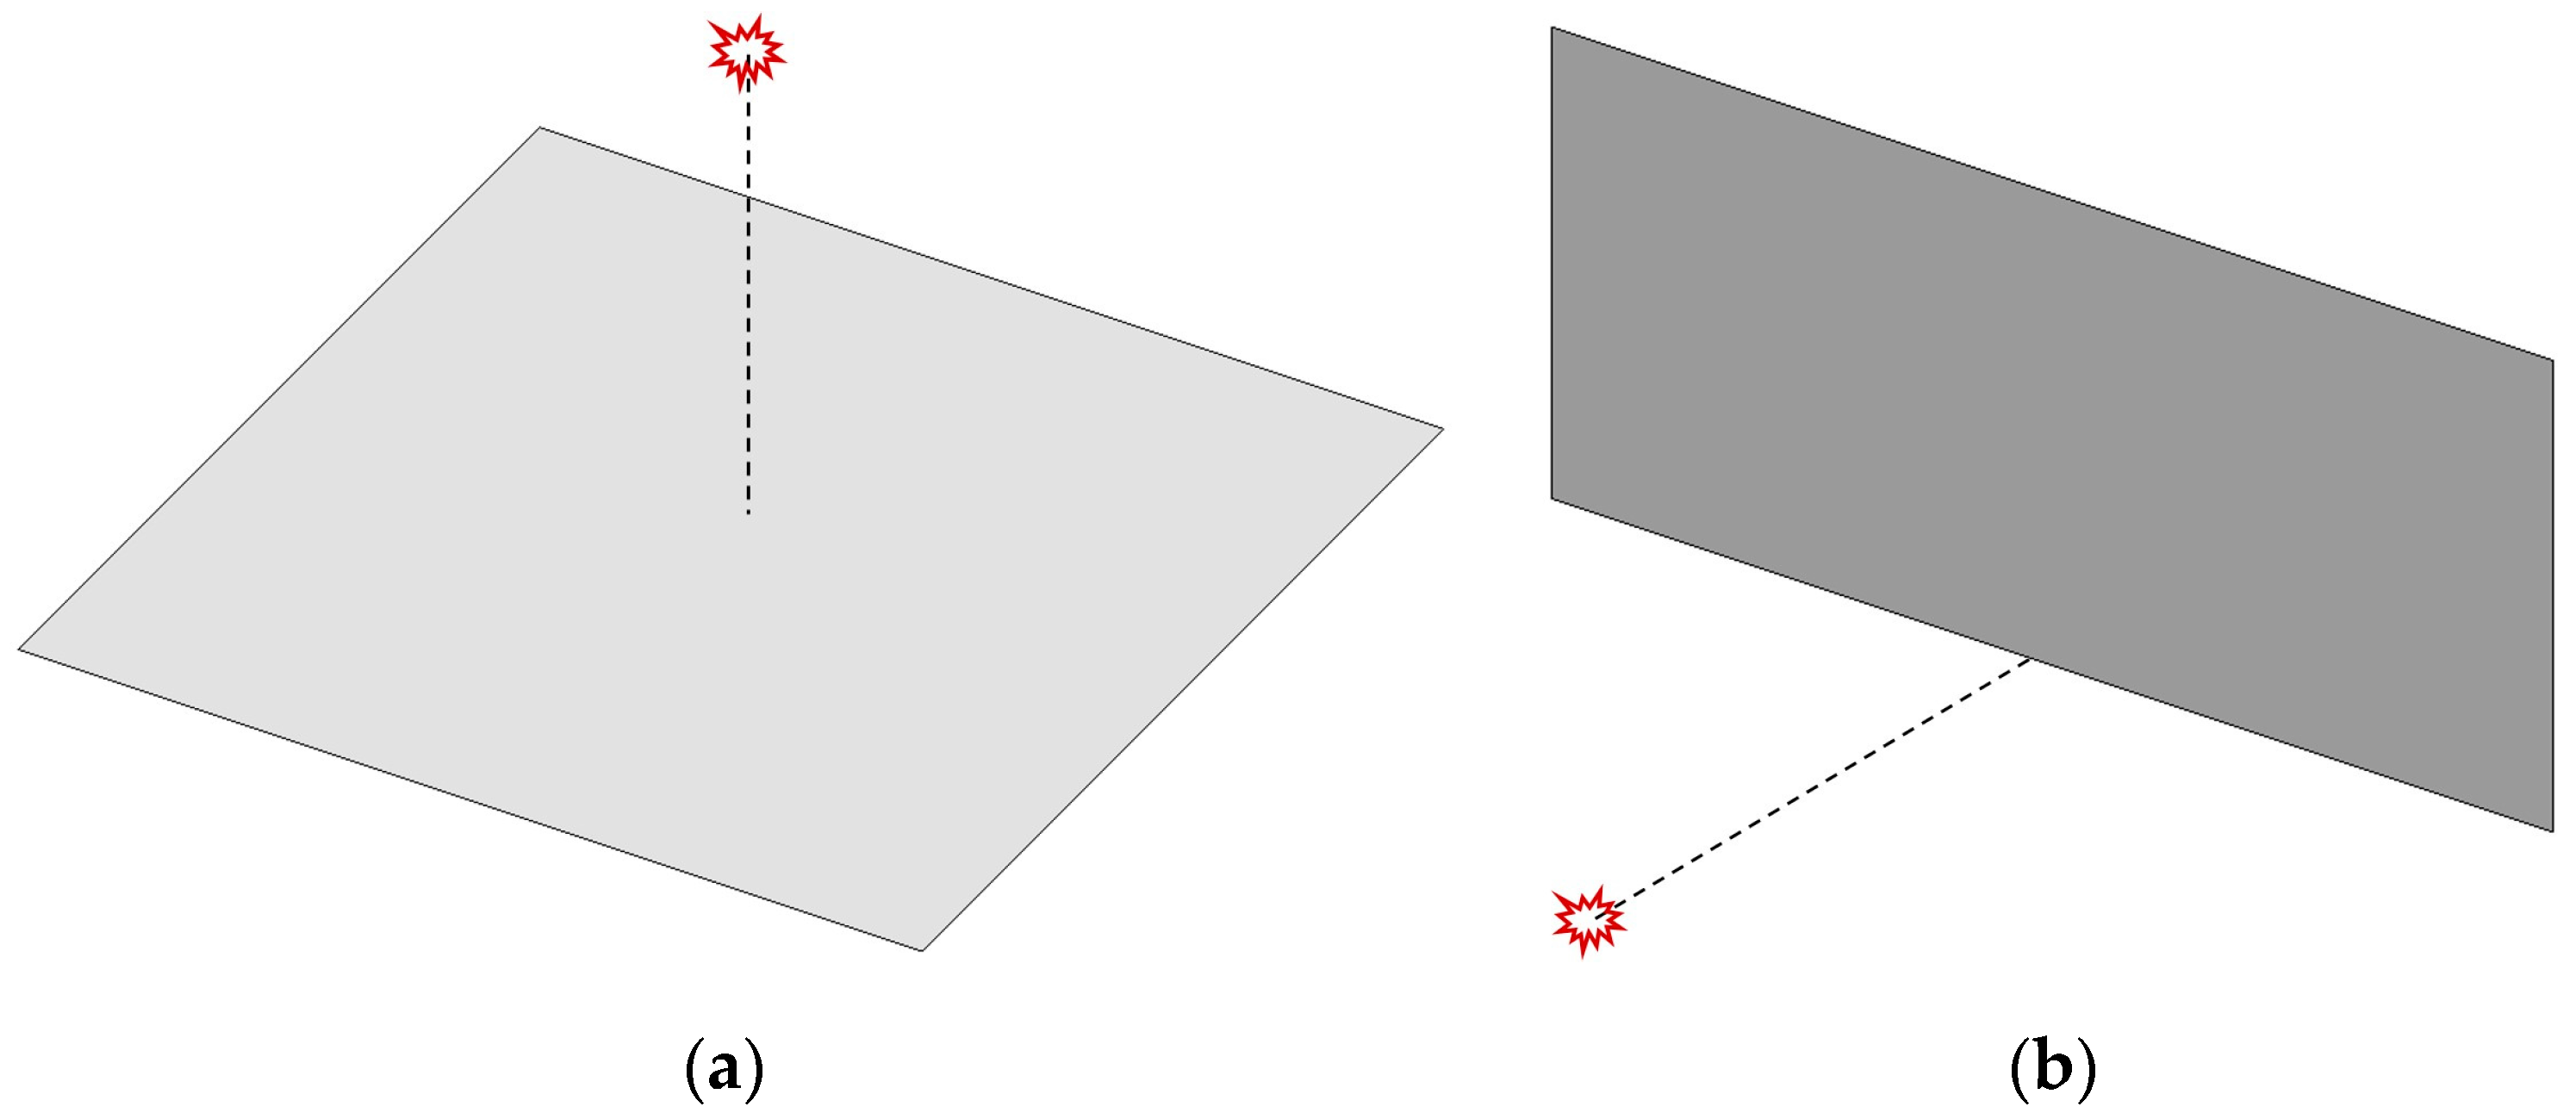
The location of the explosion is shown in Figure 5; both the free-air burst and the surface burst are located 5 m from the surface of the plate. The thickness ( t ) of the plate was set differently for each blast load case to compare the residual displacements after plastic deformation.
Table 8 presents the conditions of the blast load.
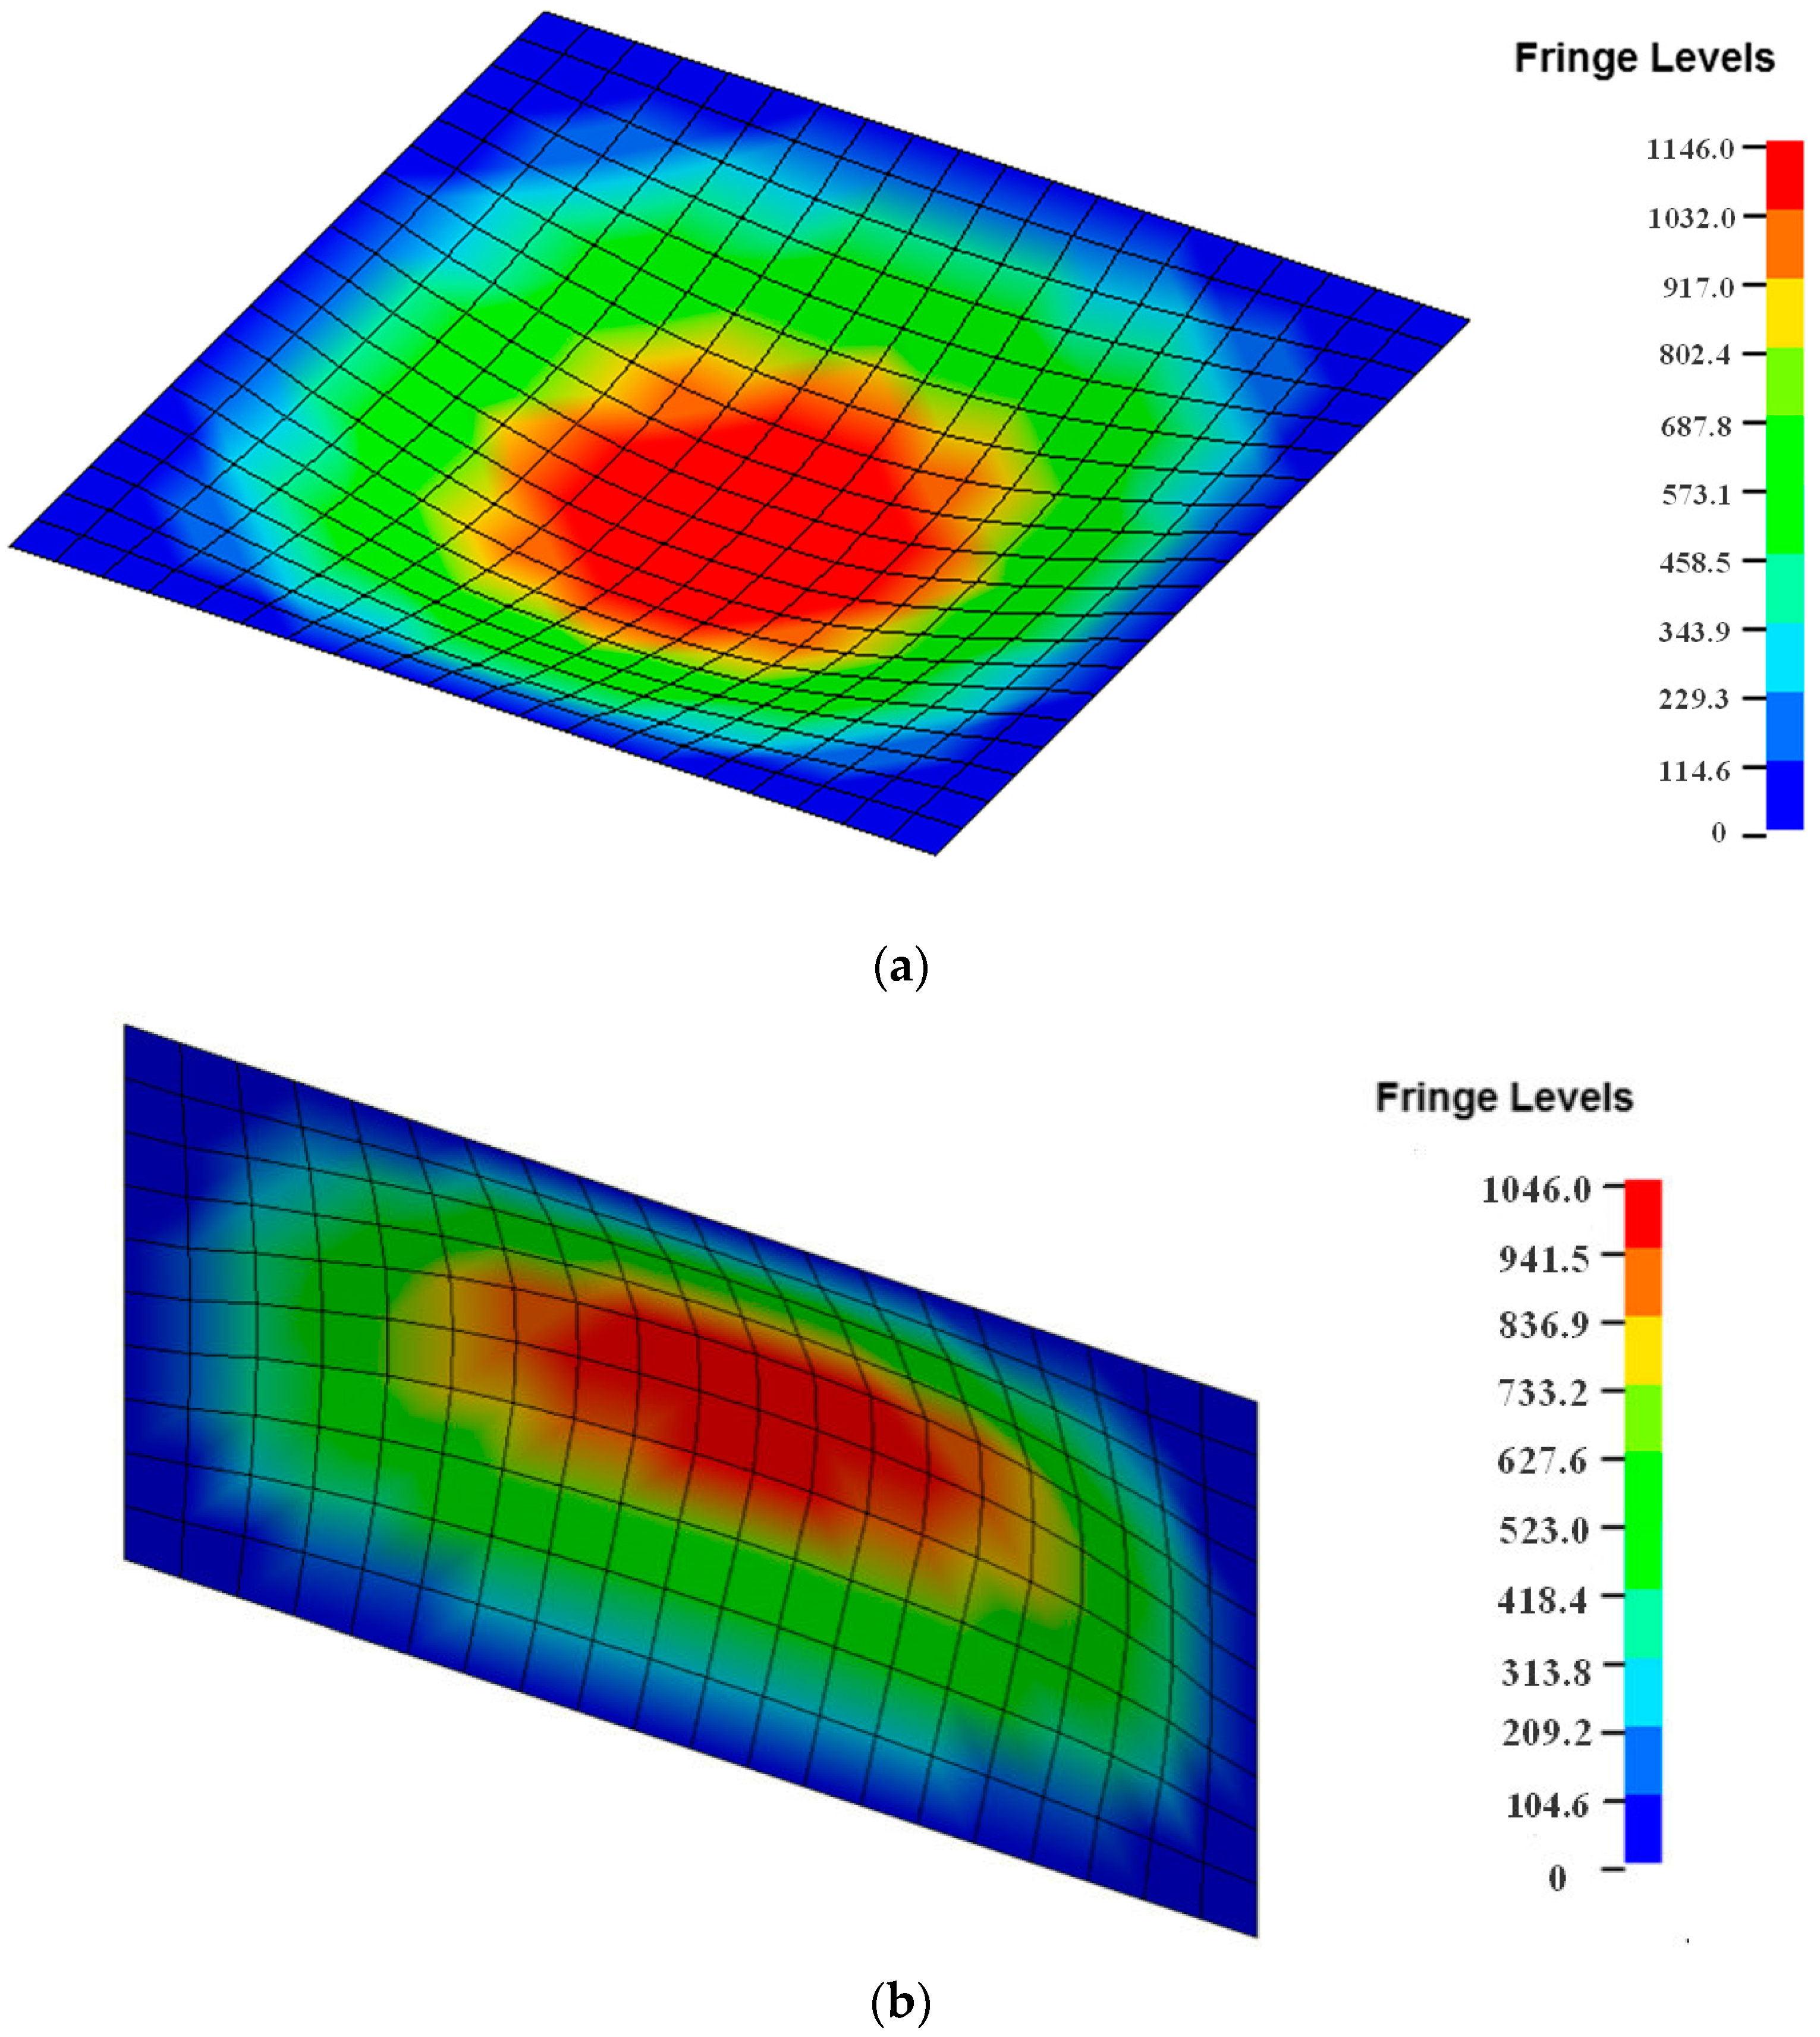
The simulations were conducted by LS-Dyna, which is a typical commercial software used for blast analysis (Figure 6). After the analysis, the residual displacements were measured at a point every 1 m from the center of the model for free-air burst simulations, and from a height of 0.5 m above the bottom of the plate for surface burst simulations.
Table 9 and Table 10 show the simulation results by two equations. They show that the results of the modified equation are very similar to those of the Kingery-Bulmash equation.

6. Conclusions

Among the various blast load equations, the Kingery-Bulmash equation is applicable to both a free-air burst and a surface burst and enables calculations of the parameters of a pressure-time history curve. In addition, this equation is the most widely used equation and is applied to the UFC 3-340-02 and the Conwep model. On the other hand, the calculation using the Kingery-Bulmash equation is complicated. To simplify the process, Swisdak proposed a simplified version of the equation but the Swisdak equation is applicable only to a surface burst. Moreover, the range of scaled distances that may be calculated by using the Swisdak equation does not incorporate the range of conventional equation. To solve these problems, the present article proposes a modified equation.
The modified equation proposed in this article is applicable to both types of bursts, as is the case of the Kingery-Bulmash equation. In addition, the range of scaled distance that may be calculated using the modified equation is the same as that of the original equation. The modified equation proposed in the present article has a shorter calculation process because the unnecessary calculation procedures included in the conventional equation are omitted. Moreover, the number of constants has been reduced to five or less to make the equation simpler. The error rate of the calculation was less than 1% compared to the results calculated from the conventional Kingery-Bulmash equation. Two types of plate models were simulated by applying the Kingery-Bulmash equation and the modified equation. As a result, the modified equation has a very similar effect to the Kingery-Bulmash equation.
On the other hand, the modified equation has two limitations. First, the derivation of the modified equation does not have sufficient theoretical background; this problem is shared by other empirical equations built on experimental data. Second, the data used to establish the modified equation are not experimental data but the values calculated using the conventional Kingery-Bulmash equation. The use of actual experimental data would be better for establishing an equation, but there is insufficient experimental data available. Because the purpose of the present study was not to derive a new equation but rather to develop an equation for simpler calculations that produce similar results to those of the Kingery-Bulmash equation, the calculation results obtained using the conventional equation may be used.
Therefore, the modified equation proposed in this article, which can provide the same calculation results through a simpler calculation process, may supplement or even replace the Kingery-Bulmash equation if used for appropriate situations with an understanding of the limitations described above.

Acknowledgments

This research was supported by a grant (17AUDP-B100343-03) from Architecture & Urban Development Research Program funded by Ministry of Land, Infrastructure and Transport of Korean government.

Author Contributions

This paper were done by D.J. under the supervision of S.H.; D.J. and S.H. established the equation; D.J. performed the simulations; K.K. analyzed the data.

Conflicts of Interest

The authors declare no conflict of interest.

References

  1. Astarlioglu, S.; Krauthammer, T.; Morency, D.; Tran, T.P. Behavior of reinforced concrete columns under combined effects of axial and blast-induced transverse loads. Eng. Struct. 2013, 55, 26–34. [Google Scholar] [CrossRef]
  2. Lee, K.; Kim, T.; Kim, J. Local response of W-shaped steel columns under blast loading. Struct. Eng. Mech. 2009, 31, 25–38. [Google Scholar] [CrossRef]
  3. Wu, C.; Oehlers, D.J.; Rebentrost, M.; Leach, J.; Whittaker, A.S. Blast testing of ultra-high performance fibre and FRP-retrofitted concrete slabs. Eng. Struct. 2009, 31, 2060–2069. [Google Scholar] [CrossRef]
  4. Nyström, U.; Gylltoft, K. Numerical studies of the combined effects of blast and fragment loading. Int. J. Impact Eng. 2009, 36, 995–1005. [Google Scholar] [CrossRef]
  5. Carriere, M.; Heffernan, P.J.; Wight, R.G.; Braimah, A. Behaviour of steel reinforced polymer (SRP) strengthened RC members under blast load. Can. J. Civ. Eng. 2009, 36, 1356–1365. [Google Scholar] [CrossRef]
  6. Larcher, M.; Arrigoni, M.; Bedon, C.; Van Doormaal, J.C.A.M.; Haberacker, C.; Hüsken, G.; Millon, O.; Saarenheimo, A.; Solomos, G.; Thamie, L.; et al. Design of blast-loaded glazing windows and facades: A review of essential requirements towards standardization. Adv. Civ. Eng. 2016, 2016, 2604232. [Google Scholar] [CrossRef]
  7. Jayasooriya, R.; Thambiratnam, D.P.; Perera, N.J. Blast response and safety evaluation of a composite column for use as key element in structural systems. Eng. Struct. 2014, 61, 31–43. [Google Scholar] [CrossRef]
  8. Yuen, S.C.K.; Langdon, G.S.; Nurick, G.N.; Pickering, E.G.; Balden, V.H. Response of V-shape plates to localised blast load: Experiments and numerical simulation. Int. J. Impact Eng. 2012, 46, 97–109. [Google Scholar] [CrossRef]
  9. Sadovskii, M.A. The Mechanical Effect of Blast Waves in Air with Respect to Data from Experimental Studies; Physics Explosions, Collection No. 1; Nauk SSSR: Moscow, Russia, 1952; pp. 20–111. [Google Scholar]
  10. Brode, H.L. Numerical solutions of spherical blast waves. J. Appl. Phys. 1955, 26, 766–775. [Google Scholar] [CrossRef]
  11. Gilbert, F.K.; Kenneth, J.G. Explosive Shocks in Air, 2nd ed.; Springer: New York, NY, USA, 1985. [Google Scholar]
  12. Newmark, N.M.; Hansen, R.J. Design of blast resistant structures. In Shock and Vibration Handbook; McGraw-Hill: New York, NY, USA, 1961; Volume 3. [Google Scholar]
  13. Mills, C.A. The design of concrete structure to resist explosions and weapon effects. In Proceedings of the 1st International Conference on Concrete for Hazard Protections, Edinburgh, UK, 27–30 September 1987; pp. 61–73. [Google Scholar]
  14. Kingery, C.N.; Bulmash, G. Air Blast Parameters from TNT Spherical Air Burst and Hemispherical Surface Burst; Ballistic Research Laboratories: Aberdeen, MD, USA, 1984. [Google Scholar]
  15. United States Department of Defense (U.S DoD). Structures to Resist the Effects of Accidental Explosions; Report to Army Armament Research and Development Command; United States Department of Defense: Arlington County, VA, USA, 2008; Volume 4.
  16. Hyde, D.W. Fundamentals of Protective Design for Conventional Weapons; CONWEP (Conventional Weapons Effects), TM 5-855, 1; United States Department of the Army: Washington, DC, USA, 1992.
  17. Swisdak, M.M., Jr. Simplified Kingery Airblast Calculations; NAVAL SURFACE WARFARE CENTER INDIAN HEAD DIV MD: Indian Head, MD, USA, 1994. [Google Scholar]
  18. International Ammunition Technical Guideline. Formulae for Ammunition Management 01.80. Available online: https://unoda-web.s3.amazonaws.com/wp-content/uploads/assets/convarms/Ammunition/IATG/docs/IATG01.80.pdf (accessed on 18 September 2017).
  19. ABAQUS. Abaqus Analysis User’s Manual; Dassault Systèmes Simulia Corporation: Providence, RI, USA, 2011. [Google Scholar]
  20. AUTODYN. Theory Manual Revision 4.3; Century Dynamics: Concord, CA, USA, 2005. [Google Scholar]
  21. LS-DYNA. Keyword User’s Manual; Livermore Software Technology Corporation: Troy, MI, USA, 2007. [Google Scholar]
  22. Levenberg, K. A method for the solution of certain non-linear problems in least squares. Q. Appl. Math. 1944, 2, 164–168. [Google Scholar] [CrossRef]
  23. Marquardt, D.W. An algorithm for least-squares estimation of nonlinear parameters. J. Soc. Ind. Appl. Math. 1963, 11, 431–441. [Google Scholar] [CrossRef]
Figure 1. Classification of burst according to the position of detonation [15]: (a) Free-air burst; (b) Surface burst.
Computation 05 00041 g001
Figure 2. Pressure-time curve of a blast load [15].
Computation 05 00041 g002
Figure 3. Positive phase shock wave parameters [15]: (a) Free-air burst; (b) Surface burst.
Computation 05 00041 g003
Figure 4. Error of modified equation (box plot): (a) Free-air burst; (b) Surface burst.
Computation 05 00041 g004aComputation 05 00041 g004b
Figure 5. Plate models for simulations: (a) Free-air burst; (b) Surface burst.
Computation 05 00041 g005
Figure 6. Residual displacement of plates (case 1): (a) Free-air burst; (b) Surface burst.
Computation 05 00041 g006
Table 1. Constants for the Incident Peak Overpressure (Kingery-Bulmash Equation for a Free-Air Burst) [14,18].
Incident Peak Overpressure, P s (Unit: kPa ( psi ))
Z K 0 K 1 K 2
0.05~40
(0.132~100)
(Unit: m / kg 1 / 3
( ft / lb 1 / 3 ))
−0.214362789151 (−0.756579301809)1.35034249993 (1.35034249993)
C 0 C 1 C 2
2.661368669 (1.77284970457)−1.69012801396 (−1.69012801396)0.00804973591951 (0.00804973591951)
C 3 C 4 C 5
0.336743114941 (0.336743114941)−0.00516226351334 (−0.00516226351334)−0.0809228619888 (−0.0809228619888)
C 6 C 7 C 8
−0.00478507266747 (−0.00478507266747)0.00793030472242 (0.00793030472242)0.0007684469735 (0.0007684469735)
Table 2. Constants for the Incident Peak Overpressure (Swisdak Equation) [17].
Incident Peak Overpressure, P s (Unit: kPa ( psi ))
Z A B C D E F G
0.2~2.9 (0.5~7.25)7.2106 (6.9137)−2.1069 (−1.4398)−0.3229 (−0.2815)0.1117 (−0.1416)0.0685 (0.0685)0 (0)0 (0)
2.9~23.8 (7.25~60)7.5938 (8.8035)−3.0523 (−3.7001)0.40977 (0.2709)0.0261 (0.0733)−0.01267 (−0.0127)0 (0)0 (0)
23.8~198.5 (60~500)6.0536 (5.4233)−1.4066 (−1.4066)0 (0)0 (0)0 (0)0 (0)0 (0)
Table 3. Constant of the Modified Equation for Free-Air Burst.
Units
Z P s , P r I s / W 1 / 3 , I r / W 1 / 3 T a / W 1 / 3 , T o / W 1 / 3 U
m / kg 1 / 3 ( ft / lb 1 / 3 ) MPa ( psi ) MPa · ms / kg 1 / 3 ( psi · ms / lb 1 / 3 ) ms / kg 1 / 3 ( ms / lb 1 / 3 ) m / ms ( ft / ms )
Peak Incident Overpressure, P s
Z C 0 C 1 C 2 C 3 C 4
0.05~0.67 (0.132~1.69)−6.6628 × 10⁻² (2.9274)−2.5691 (−1.6466)−1.4213 (−9.0652 × 10⁻¹)−5.0355 × 10⁻¹ (−3.5118 × 10⁻¹)−9.4865 × 10⁻² (−9.4865 × 10⁻²)
0.67~10 (1.69~25.21)−2.8310 × 10⁻² (2.8735)−2.2324 (−1.2134)−4.3379 × 10⁻¹ (−2.2395)1.1615 (1.8364)−4.2023 × 10⁻¹ (−4.2023 × 10⁻¹)
10~40 (25.21~100)−1.0569 × 10⁻¹ (1.1642)−4.1582 × 10⁻¹ (1.3928 × 10⁻¹)−6.1361 × 10⁻¹ (−7.6880 × 10⁻¹)1.2882 (1.2882)
Peak Reflected Overpressure, P r
Z C 0 C 1 C 2 C 3 C 4
0.05~1.05 (0.132~2.64)6.9758 × 10⁻¹ (3.8543)−2.9928 (−2.0054)−1.3840 (−1.0750)−2.5645 × 10⁻¹ (−2.5645 × 10⁻¹)
1.05~10 (2.64~25.21)6.9699 × 10⁻¹ (3.5885)−2.8246 (−1.9300 × 10⁻¹)−1.1613 (−5.7824)2.8654 (4.8069)−1.2088 (−1.2088)
10~40 (25.21~100)−2.4954 × 10⁻¹ (2.4663)−1.3806 (−1.3806)
Incident Impulse, I s / W 1 / 3
Z C 0 C 1 C 2 C 3 C 4
0.05~0.79 (0.132~1.99)−5.8967 × 10⁻¹ (1.1833)1.2467 (−7.9338 × 10⁻²)7.2584 × 10⁻¹ (2.2043)−2.1542 (−3.0039 × 10⁻¹)−1.1542 (−1.1542)
0.79~3.99 (1.99~10.07)−7.5978 × 10⁻¹ (1.0167)−7.4416 × 10⁻¹ (3.1232)−1.4680 (−9.1754)3.8777 (8.9187)−3.1385 (−3.1385)
3.99~40 (10.07~100)−7.7508 × 10⁻¹ (1.6001)−8.4083 × 10⁻¹ (−7.9357 × 10⁻¹)−5.8847 × 10⁻² (−5.8847 × 10⁻²)
Reflected Impulse, I r / W 1 / 3
Z C 0 C 1 C 2 C 3 C 4
0.05~40 (0.132~100)−2.5256 × 10⁻¹ (2.3590)−1.3067 (−1.5154)2.2166 × 10⁻¹ (2.9812 × 10⁻¹)−6.3474 × 10⁻² (−6.3474 × 10⁻²)
Arrival Time, T a / W 1 / 3
Z C 0 C 1 C 2 C 3 C 4
0.05~0.71 (0.132~1.79)−2.4704 × 10⁻¹ (−1.0917)2.1318 (1.5792)9.9500 × 10⁻¹ (4.4200 × 10⁻¹)6.1033 × 10⁻¹ (3.0779 × 10⁻¹)1.8836 × 10⁻¹ (1.8836 × 10⁻¹)
0.71~10 (1.79~25.21)−2.7471 × 10⁻¹ (−1.0583)1.8687 (1.3245)1.9437 × 10⁻¹ (1.2385)−6.7341 × 10⁻¹ (−1.0601)2.4074 × 10⁻¹ (2.4074 × 10⁻¹)
10~40 (25.21~100)6.9208 × 10⁻² (−6.1494 × 10⁻¹)1.3812 (1.4563)−9.3519 × 10⁻² (−9.3519 × 10⁻²)
Positive Phase Duration, T o / W 1 / 3
Z C 0 C 1 C 2 C 3 C 4
0.14~0.75 (0.37~1.89)6.6547 × 10⁻¹ (−7.6352 × 10⁻¹)6.0191 (1.1073)8.2785 (3.9538)3.5900 (3.5900)
0.75~1.15 (1.89~2.9)2.5418 × 10⁻¹ (−4.4026)2.4840 × 10⁻¹ (31.294)−5.3442 (−71.972)55.310 (55.310)
1.15~2.93 (2.9~7.4)2.3966 × 10⁻¹ (−6.2696)8.4271 × 10⁻¹ (44.413)−11.795 (−111.94)45.212 (121.06)−47.224 (−47.224)
2.93~40 (7.4~100)8.4367 × 10⁻² (−6.4031 × 10⁻¹)1.0610 (2.0744)−9.2091 × 10⁻¹ (−1.6381)5.0765 × 10⁻¹ (6.8306 × 10⁻¹)−1.0921 × 10⁻¹ (−1.0921 × 10⁻¹)
Shock Velocity, U
Z C 0 C 1 C 2 C 3 C 4
0.05~1.16 (0.132~2.94)5.2658 × 10⁻³ (8.8776 × 10⁻¹)−1.0266 (−7.8511 × 10⁻¹)−2.3754 × 10⁻¹ (−3.4040 × 10⁻¹)1.4415 × 10⁻¹ (2.6631 × 10⁻²)7.3166 × 10⁻² (7.3166 × 10⁻²)
1.16~10 (2.94~25.21)1.1060 × 10⁻² (1.0003)−1.0765 (−1.1540)5.0854 × 10⁻¹ (−4.3675 × 10⁻¹)4.8259 × 10⁻¹ (1.0868)−3.7621 × 10⁻¹ (−3.7621 × 10⁻¹)
10~40 (25.21~100)−4.2546 × 10⁻¹ (1.0090 × 10⁻¹)−2.5850 × 10⁻² (−2.5850 × 10⁻²)
Table 4. Constant of Modified Equation for a Surface Burst.
Peak Incident Overpressure, P s
Z C 0 C 1 C 2 C 3 C 4
0.06~1.13 (0.167~2.84)1.3295 × 10⁻¹ (3.0002)−2.1712 (−1.4636)−1.3878 (−4.9427 × 10⁻¹)−1.0401 (−4.4345 × 10⁻¹)−3.7148 × 10⁻¹ (−3.7148 × 10⁻¹)
1.13~10 (2.84~25.21)1.3067 × 10⁻¹ (2.7741)−2.0672 (1.1608 × 10⁻¹)−1.1750 (−4.5313)2.1159 (3.4564)−8.3460 × 10⁻¹ (−8.3460 × 10⁻¹)
10~40 (25.21~100)7.8363 × 10⁻¹ (5.2611)−4.5738 (−7.0786)2.6834 (3.5545)−7.2311 × 10⁻¹ (−7.2311 × 10⁻¹)
Peak Reflected Overpressure, P r
Z C 0 C 1 C 2 C 3 C 4
0.06~0.42 (0.167~1.05)1.3953 (3.9425)3.0058 × 10⁻¹ (−1.6500)4.8121 (5.4353 × 10⁻¹)4.7833 (2.3036)1.5439 (1.5439)
0.42~3.45 (1.05~8.70)9.0962 × 10⁻¹ (3.9373)−2.6898 (−1.6802)−1.2237 (−8.0819 × 10⁻¹)8.5625 × 10⁻¹ (−1.5461)1.4957 (1.4957)
3.45~40 (8.70~100)1.2511 (5.8327)−4.7950 (−7.3773)2.7741 (3.6569)−7.3282 × 10⁻¹ (−7.3282 × 10⁻¹)
Incident Impulse, I s / W 1 / 3
Z C 0 C 1 C 2 C 3 C 4
0.06~0.95 (0.167~2.40)−6.0247 × 10⁻¹ (1.2919)1.1143 (−4.6629 × 10⁻¹)1.3760 (2.2169)−1.5534 (1.5728 × 10⁻¹)−1.0651 (−1.0651)
0.95~5.97 (2.40~15.04)−6.3226 × 10⁻¹ (9.1008 × 10⁻¹)−4.1419 × 10⁻¹ (3.8403)−2.2475 (−9.0634)3.8761 (7.4402)−2.2190 (−2.2190)
5.97~40 (15.04~100)−6.0392 × 10⁻¹ (1.7753)−8.4947 × 10⁻¹ (−8.0503 × 10⁻¹)−5.5334 × 10⁻² (−5.5334 × 10⁻²)
Reflected Impulse, I r / W 1 / 3
Z C 0 C 1 C 2 C 3 C 4
0.06~40 (0.167~100)−5.3169 × 10⁻² (2.5759)−1.3466 (−1.5622)2.3258 × 10⁻¹ (3.0429 × 10⁻¹)−5.9534 × 10⁻² (−5.9534 × 10⁻²)
Arrival Time, T a / W 1 / 3
Z C 0 C 1 C 2 C 3 C 4
0.06~1.46 (0.167~3.68)−3.3217 × 10⁻¹ (−1.1143)1.8061 (1.5414)4.3653 × 10⁻¹ (2.7387 × 10⁻¹)2.6277 × 10⁻¹ (7.2986 × 10⁻³)1.5906 × 10⁻¹ (1.5906 × 10⁻¹)
1.46~10 (3.68~25.21)−3.5217 × 10⁻¹ (−1.2759)1.9914 (2.0109)−1.3049 × 10⁻¹ (8.1866 × 10⁻²)−1.7628 × 10⁻¹ (−1.7628 × 10⁻¹)
10~40 (25.21~100)−7.4315 × 10⁻² (−8.4388 × 10⁻¹)1.5680 (1.6950)−1.5812 × 10⁻¹ (−1.5812 × 10⁻¹)
Positive Phase Duration, T o / W 1 / 3
Z C 0 C 1 C 2 C 3 C 4
0.17~0.69 (0.45~1.73)4.3227 × 10⁻¹ (−7.4649 × 10⁻¹)6.1103 (4.6710 × 10⁻¹)12.418 (2.8829)11.021 (4.8098)3.8670 (3.8670)
0.69~1.00 (1.73~2.52)2.4242 × 10⁻¹ (−9.1900 × 10⁻¹)3.6673 (1.5475)2.6397 (2.6397)
1.00~2.88 (2.52~7.25)2.4255 × 10⁻¹ (−6.0473)2.1849 (37.322)−14.917 (−80.281)35.106 (73.416)−23.852 (−23.852)
2.88~10 (7.25~25.21)−3.2552 × 10⁻¹ (−2.0520)2.7174 (5.4865)−2.7949 (−4.1014)1.0846 (1.0846)
10~40 (25.21~100)2.7214 × 10⁻¹ (−4.9182 × 10⁻²)4.8449 × 10⁻¹ (5.4593 × 10⁻¹)−7.6501 × 10⁻² (−7.6501 × 10⁻²)
Shock Velocity, U
Z C 0 C 1 C 2 C 3 C 4
0.06~1.28 (0.167~3.23)7.9911 × 10⁻² (9.2426 × 10⁻¹)−9.7917 × 10⁻¹ (−7.0069 × 10⁻¹)−5.3612 × 10⁻¹ (−2.0469 × 10⁻¹)−3.9288 × 10⁻¹ (−1.5738 × 10⁻¹)−1.4662 × 10⁻¹ (−1.4662 × 10⁻¹)
1.28~10 (3.23~25.21)8.9984 × 10⁻² (1.0476)−1.1228 (−8.9939 × 10⁻¹)3.1104 × 10⁻¹ (−1.0146)7.3402 × 10⁻¹ (1.4670)−4.5634 × 10⁻¹ (−4.5634 × 10⁻¹)
10~40 (25.21~100)−4.1168 × 10⁻¹ (1.1798 × 10⁻¹)−3.4073 × 10⁻² (−3.4073 × 10⁻²)
Table 5. Error of Modified Equation for Free-Air Burst (Unit: %).
Z P s P r I s / W 1 / 3 I r / W 1 / 3 T a / W 1 / 3 T o / W 1 / 3 U
0.051.0000−0.6233−0.01730.0094−0.9737-0.7402
0.05070.8495−0.3839−0.01710.0094−0.8162-0.6219
0.05140.7015−0.1752−0.01700.0093−0.6707-0.5143
38.9426−0.5361−0.46360.3466−0.01000.3874−0.1778−0.4767
39.4678−0.7038−0.55530.4245−0.01000.4875−0.2451−0.5038
40−0.8895−0.65000.5116−0.01010.5976−0.3224−0.5274
Max1.00000.75700.77890.00940.72120.87970.7402
Min−0.8895−0.9505−0.5554−0.0101−0.9737−0.9885−0.8507
Average0.20100.28900.08170.00500.14540.22570.1750
Table 6. Error of Modified Equation for Surface Burst (Unit: %).
Z P s P r I s / W 1 / 3 I r / W 1 / 3 T a / W 1 / 3 T o / W 1 / 3 U
0.06−0.927080.0770−0.0113−0.00410.3295-−0.0534
0.0608−0.7746−0.0300−0.0110−0.00410.2186-−0.0583
0.0616−0.6314−0.1094−0.0108−0.00410.1214-−0.0653
38.9710−0.4031−0.23150.36660.00880.0459−0.3395−0.4721
39.4822−0.5827−0.37920.38850.00890.0522−0.4155−0.5101
40−0.7908−0.55750.40790.00890.0578−0.4982−0.5540
Max0.48940.96870.99540.00890.86580.95710.4769
Min−0.9904−0.5806−0.8132−0.0041−0.6057−0.9520−0.8051
Average0.17370.22790.12080.00330.18670.18720.1985
Table 7. Properties of Plate Models.
BurstPlate Model SizeYoung’s Modulus, E Yield Stress, F y
Free-air 10   m × 10   m × t   mm 200 , 000   MPa 400   MPa
Surface 10   m × 5   m × t   mm
Table 8. Blast Load Conditions for Simulations.
CaseDistance, R TNT Weight, W Scaled Distance, Z Plate Thickness, t
1 5   m 10 , 000   kg 0.2321   m / kg 1 / 3 100   mm
2 1000   kg 0.5   m / kg 1 / 3 20   mm
3 100   kg 1.0772   m / kg 1 / 3 4   mm
Table 9. Results of Free-Air Burst Simulations.
CaseEquationResidual Displacement at the Points ( mm )
Center1 m2 m3 m4 m
1Kingery-Bulmash1146.21115.9938.51675.26363.08
Modified1144.21115.9940.19677.3364.58
(Error,   % )(−0.1745)(0.0000)(0.1790)(0.3021)(0.4131)
2Kingery-Bulmash892.7861.37724.72518.21263.94
Modified872.18854.01722.17515.63267.59
(Error,   % )(−2.2986)(−0.8545)(−0.3519)(−0.4979)(1.3829)
3Kingery-Bulmash747.02726.7495.26295.32211.81
Modified748.09724.43491.51294.19215.09
(Error,   % )(0.1432)(−0.3124)(−0.7572)(−0.3826)(1.5486)
Table 10. Results of Surface Burst Simulations.
CaseEquationResidual Displacement at the Points ( mm )
0.5 m1.5 m2.5 m3.5 m4.5 m
1Kingery-Bulmash1146.21115.9938.51675.26363.08
Modified1144.21115.9940.19677.3364.58
(Error,   % )(−0.1745)(0.0000)(0.1790)(0.3021)(0.4131)
2Kingery-Bulmash892.7861.37724.72518.21263.94
Modified872.18854.01722.17515.63267.59
(Error,   % )(−2.2986)(−0.8545)(−0.3519)(−0.4979)(1.3829)
3Kingery-Bulmash747.02726.7495.26295.32211.81
Modified748.09724.43491.51294.19215.09
(Error,   % )(0.1432)(−0.3124)(−0.7572)(−0.3826)(1.5486)