Article

Heat Losses in the Exhaust Manifold of a 4-Stoke DI Diesel Engine Subjected to Pulsating Flow

by
Grigorios Spyrounakos
1 and
Georgios Mavropoulos
2,*
1
Mechanical Engineering Department, University of West Attica, Thivon & P. Ralli Ave. 250, 12241 Aigaleo, Greece
2
Internal Combustion Engines and Automotive Technology Laboratory, Department of Mechanical Engineering Educators, School of Pedagogical and Technological Education (ASPETE), 15122 Marousi, Greece
*
Author to whom correspondence should be addressed.
Computation 2025, 13(9), 223; https://doi.org/10.3390/computation13090223
Submission received: 24 August 2025 / Accepted: 10 September 2025 / Published: 15 September 2025

Abstract

This paper presents a study aiming to provide insight into the complex flow and heat transfer processes in the exhaust manifold of a four-stroke, compression ignition engine. An experimental system has been constructed capable of capturing temperature and heat flux high-frequency signals as they develop in the exhaust pipe wall during the engine cycle, under its steady-state operation. The values of the Heat Transfer Coefficient obtained by applying the classic convection relations have been correlated in the form of a Nusselt–Reynolds number relationship for local and spatially averaged steady-state heat transfer and compared with available experimental data obtained at the same position of the exhaust manifold. It has been shown that the use of conventional steady-state heat transfer relationships for fully developed steady-state turbulent flow in pipes underpredicts heat transfer rates when compared with those experimentally observed. Periodic flow of high frequency and geometrical effects at the exhaust entrance are expected to affect the validity of the application of the classic steady-state correlations for the exhaust manifold. To overcome this problem it is developed and presented a new correlation for the time-averaged heat transfer rates. To verify the heat transfer mechanism, the thermal field of the whole engine cylinder head, including the intake and exhaust manifolds, was analyzed using FEA (Finite Element Analysis), and the results are compared and verified with available experimental data.

1. Introduction

Over the years, there has been significant interest in understanding the heat transfer process within the manifold of an internal combustion engine. This interest stems from various factors, including the intricate nature of flow and wall geometries, the influence of entrance effects on fluid flow and heat transfer, the presence of high-temperature exhaust gases characterized by fluctuations in temperature, pressure, and velocity, as well as the relatively high levels of turbulence within the flow. Gaining a comprehensive understanding of the distribution of heat transfer would be beneficial in optimizing the utilization of pressure pulses during exhaust manifold tuning. Recent advancements in modeling techniques and access to detailed experimental data have facilitated several developments in the gas exchange subsystem. However, due to the inherent complexities involved, there have been relatively limited studies investigating heat transfer within the engine manifold.
Daniel [1] measured the temperatures of various car components, including the exhaust manifolds, takedown pipes, and post-converter parts, while the cars were in equilibrium on a chassis dynamometer. The exhaust manifolds, which were made of cast and fabricated materials, were equipped with instruments, as were both single-wall and double-wall takedown pipes. Some of his findings were that the interior Reynolds number was related to how heat losses were distributed among different exhaust components. At low Reynolds numbers, half of the heat loss occurred in the manifold, while at high Reynolds numbers, half of the heat loss occurred in the tailpipe section. The study also found that the average component-interior CAF (the term Convective Augmentation Factor CAF, is considered as a correction factor to the heat transfer due to exhaust pulsation effects) for steady-state operation was approximately 2.3 in the manifold, 3.0 in the takedown pipe, and 1.6 in the tailpipe section. For medium to high Reynolds numbers, the component CAF values remained relatively constant.
Malchow et al. [2] used an experimental system capable of measuring heat transfer rates within the straight section of an internal combustion engine’s exhaust port. Specifically, they measured time-averaged heat transfer rates for a four-stroke, 325 cc air-cooled, two-cylinder spark ignition engine. Their findings revealed that geometrical factors can significantly affect heat transfer rates. By analyzing time-averaged and spatially averaged heat transfer rates, they established a Nusselt–Reynolds number relationship for steady-state heat transfer.
Farrugia et al. [3] performed experiments to investigate cycle-averaged, local surface heat transfer from exhaust gases to a straight pipe extension connected to the exhaust port of a four-cylinder spark-ignition (SI) engine. The study covered a wide range of engine operating conditions, ranging from 1000 rpm at light load to 4000 rpm at full load. The researchers observed that the local steady-state heat flux could be effectively correlated using a Nusselt–Reynolds number relationship that took into account entrance effects. These entrance effects were identified as the primary contributors to local heat transfer enhancement. They found that as the Reynolds number and axial distance from the entrance of the test section increased, the Convective Augmentation Factor (CAF) decreased.
Heller et al. [4] conducted a study focusing on meeting stringent emission regulations set by SULEV (Super Ultra Low Emission Vehicle) and EURO-V standards, which require catalytic converters to reach the light-off temperature within the first 20 s after a cold engine start. They found that thermal losses in the exhaust manifold, resulting from the heat transfer of pulsating and turbulent exhaust flow, significantly affect the catalyst’s warm-up time. The researchers proposed a heat transfer model for turbulent pulsating exhaust flow that demonstrated improved accuracy in predicting gas-side heat flux along the exhaust pipe during the engine cycle.
Kar et al. [5] have proposed a method that can be applied to measure the instantaneous exhaust gas temperature. Their studies have shown that the signal bandwidth has to be restricted, since noise will be amplified in the temperature reconstruction. The proposed technique has been successfully applied to several engine exhaust measurements and produced several quite interesting results.
Depcik and Assanis [6] have performed a comparative evaluation of several available correlations proposed in the literature for the gas-side heat transfer in the intake and exhaust system of a spark-ignition internal combustion engine. They have discovered that these correlations often have a common form of expression between Nu and Re numbers, and they are only different in the values used in their empirically fitted constants. Based on a scaling approach using microscales of turbulence, they have proposed a fixed exponential factor on the Reynolds number and thus reduced the number of adjustable coefficients to just one.
Ranganathan et al. [7] have developed a system-level, data-driven model capable of predicting gas temperature in the exhaust manifolds of naturally aspirated spark-ignited engines. Their proposed model is empirical by nature; however, due to the diversity of data used in its creation and the use of dimensionless groups, it was capable of predicting with success the gas temperature in a variety of cars and trucks.
Balzan et al. [8] have conducted an experimental procedure on a straight pipe extension of an exhaust port of a multi-cylinder, spark ignition engine. Their work was aiming to investigate the axial variation in the steady-state surface heat transfer. They have performed steady-state, surface heat flux measurements at five different stations on the test section. Their results emphasized the strong influence of entrance effects on the observed heat transfer augmentation in the engine exhaust system.
Haehndel et al. [9] have proposed a new method for achieving higher accuracy exhaust surface temperature predictions. Their idea was to integrate a 1-dimensional fluid stream within a 3-dimensional exhaust surface piping network. Several exhaust configurations were simulated using an in-house-created heat transfer prediction tool. They have found that both exhaust configurations examined in their study achieved a good trend in comparison to experimentally derived data.
Zhien et al. [10] have presented an unsteady coupled heat transfer model by using a serial coupling method between CFD (Computational Fluid Dynamics) and FEA (Finite Element Analysis) numerical simulations. They have also introduced a convenient and rapid method for solving the static thermal stress field. The thermal fatigue life of the exhaust manifold was estimated by the application of the Manson–Coffin formula.
Mavropoulos et al. [11,12] have performed an extensive research campaign aiming to investigate the basic parameters of heat transfer as well as the thermal loading of combustion chamber components as they appear under certain operating conditions in diesel engines. Especially concerning the engine exhaust process, they have presented a combination of experimental and theoretical analysis in order to investigate the main phenomena as they appear during the different phases of the exhaust stroke. The analysis demonstrated that the two phases of the exhaust stroke, namely blowdown and displacement, are easily discernible in the experimental instantaneous temperature and heat flux results; their duration is altered but can be predicted for any engine operating point.
The above discussion indicates that despite the research conducted up until now regarding heat transfer processes in combustion engine exhaust, there is still a large number of issues regarding the exhaust manifold flow that remain essentially unknown. To address this gap, the present study aims to conduct a thorough investigation concerning the special characteristics of the heat transfer process in the internal side of the exhaust manifold, which is subjected to pulsating flow. The investigation includes measuring gas and wall temperatures and assessing the instantaneous surface heat flux at the exhaust manifold downstream of the exhaust valve. Additionally, a comprehensive computational analysis was carried out using commercially available FEA engine simulation software. The primary objective of the study is to explore whether the special characteristics of gas flow and heat transfer processes in an exhaust manifold allow an acceptable calculation using the “conventional” heat transfer correlations for fully developed turbulent flow. The detailed experimental data available in the present investigation are expected to provide a solid basis for answering this important question.

2. Heat Transfer Analysis in the Engine Exhaust

2.1. Phases of Engine Exhaust

The exhaust stroke comprises a special process of the total engine operating cycle in both the 4-stroke and 2-stroke cases of a reciprocating combustion engine. The main purpose of this stroke is to remove the remaining combustion gases from the previous engine cycle within a limited amount of time, and, in this way, prepare the cylinder for the upcoming inlet stroke, which marks the start of the next engine cycle. This task is usually separated into two distinct phases. The first phase is called the exhaust “blowdown”, and the second one the exhaust “displacement”. As a result, a pulsating flow is created inside the engine exhaust manifold [4,12].
The characteristics of the pulse (amplitude, duration of each phase) are varied and depend on the engine operating point. Details are provided in [12]. It is evident that the operation of the reciprocating engine causes mass flow waves or pulses inside the exhaust manifold (Figure 1a,b). The corresponding pressure waves travel inside the pipe with the local speed of sound, and they are reflected in junctions and pipe openings, resulting in a backflow towards the engine exhaust valve.

2.2. Time Periodic Heat Conduction

Heat flux at any location of the combustion chamber and exhaust manifold wall is considered one-dimensional. It is calculated using the time-periodic (unsteady) heat conduction model. The necessary boundary conditions are derived from experimental temperature measurements. With the additional assumption that material properties remain constant, the corresponding expression is as follows:
T t = α 2 T x 2
where x is, in this case, the distance from the wall surface, α = kwwcw is the wall thermal diffusivity, with ρw the density and cw the specific heat capacity. A detailed analysis of the problem is presented in [11,12]. Following this procedure and using Fourier’s law, the instantaneous heat flux on the combustion chamber surfaces is calculated with respect to x at position x = 0, as follows:
q w ( t ) = k w T x | x = 0 = k w δ ( T m T δ ) + + k w n = 1 N φ n [ ( A n + B n ) cos ( n ω t ) + ( B n A n ) sin ( n ω t ) ]
where δ is the distance from the wall surface of the in-depth thermocouple, which provides constant temperature readings. In addition, Tm is the time-averaged value of wall surface temperature Tw, An and Bn are the Fourier coefficients, n is the harmonic number, N is the total number of harmonics, and ω (in rad/s) is the angular frequency of temperature variation, which for a four-stroke engine is half the engine angular speed.

2.3. Instantaneous and Mean Temperature and Heat Transfer Coefficient

To investigate the Heat Transfer Coefficient distribution in the internal combustion chamber surfaces, it has to be taken into account both the spatial distribution as well as the time variation in the instantaneous heat flux. As a result, the instantaneous heat flux equation takes the form [11]:
q w ( t , F ) = h g ( t , F ) [ T g ( t , F ) T w ( t , F ) ]
so that it also allows for the spatial distribution of all variables inside the combustion chamber surfaces (F). Details of this procedure and the model developed and applied for the calculation are provided in [11].
Next, the variations in the mean gas temperature and Heat Transfer Coefficient during the 720 deg CA (Crank Angle) of the four-stroke engine cycle in a specific location inside the combustion chamber or exhaust manifold are given from the following relations:
h m g = 1 4 π 0 4 π h g d ϕ , T m g = 1 4 π h m g 0 4 π T g h g d ϕ
These values are used as basic inputs for the boundary conditions of the FEA simulation model for every combustion chamber component in contact with combustion gases (exhaust manifold in the present case) under any specific engine steady-state operating condition considered [11].

2.4. “Conventional” Heat Transfer Coefficient Estimation in the Engine Exhaust

For a “conventional” estimation of heat transfer losses in the engine exhaust manifold, two well-known relations for the estimation of the Nu number and the Heat Transfer Coefficient for the fully developed turbulent flow were applied in the exhaust (and the inlet) engine manifolds.
Sieder and Tate:
N u = 0.027 ( Re ) 0.8 Pr 1 / 3 ( μ b μ s ) 0.14
Petukhov:
N u = ( f / 8 ) Re Pr 1.07 + 12.7 ( f / 8 ) 0.5 ( Pr 2 / 3 1 )
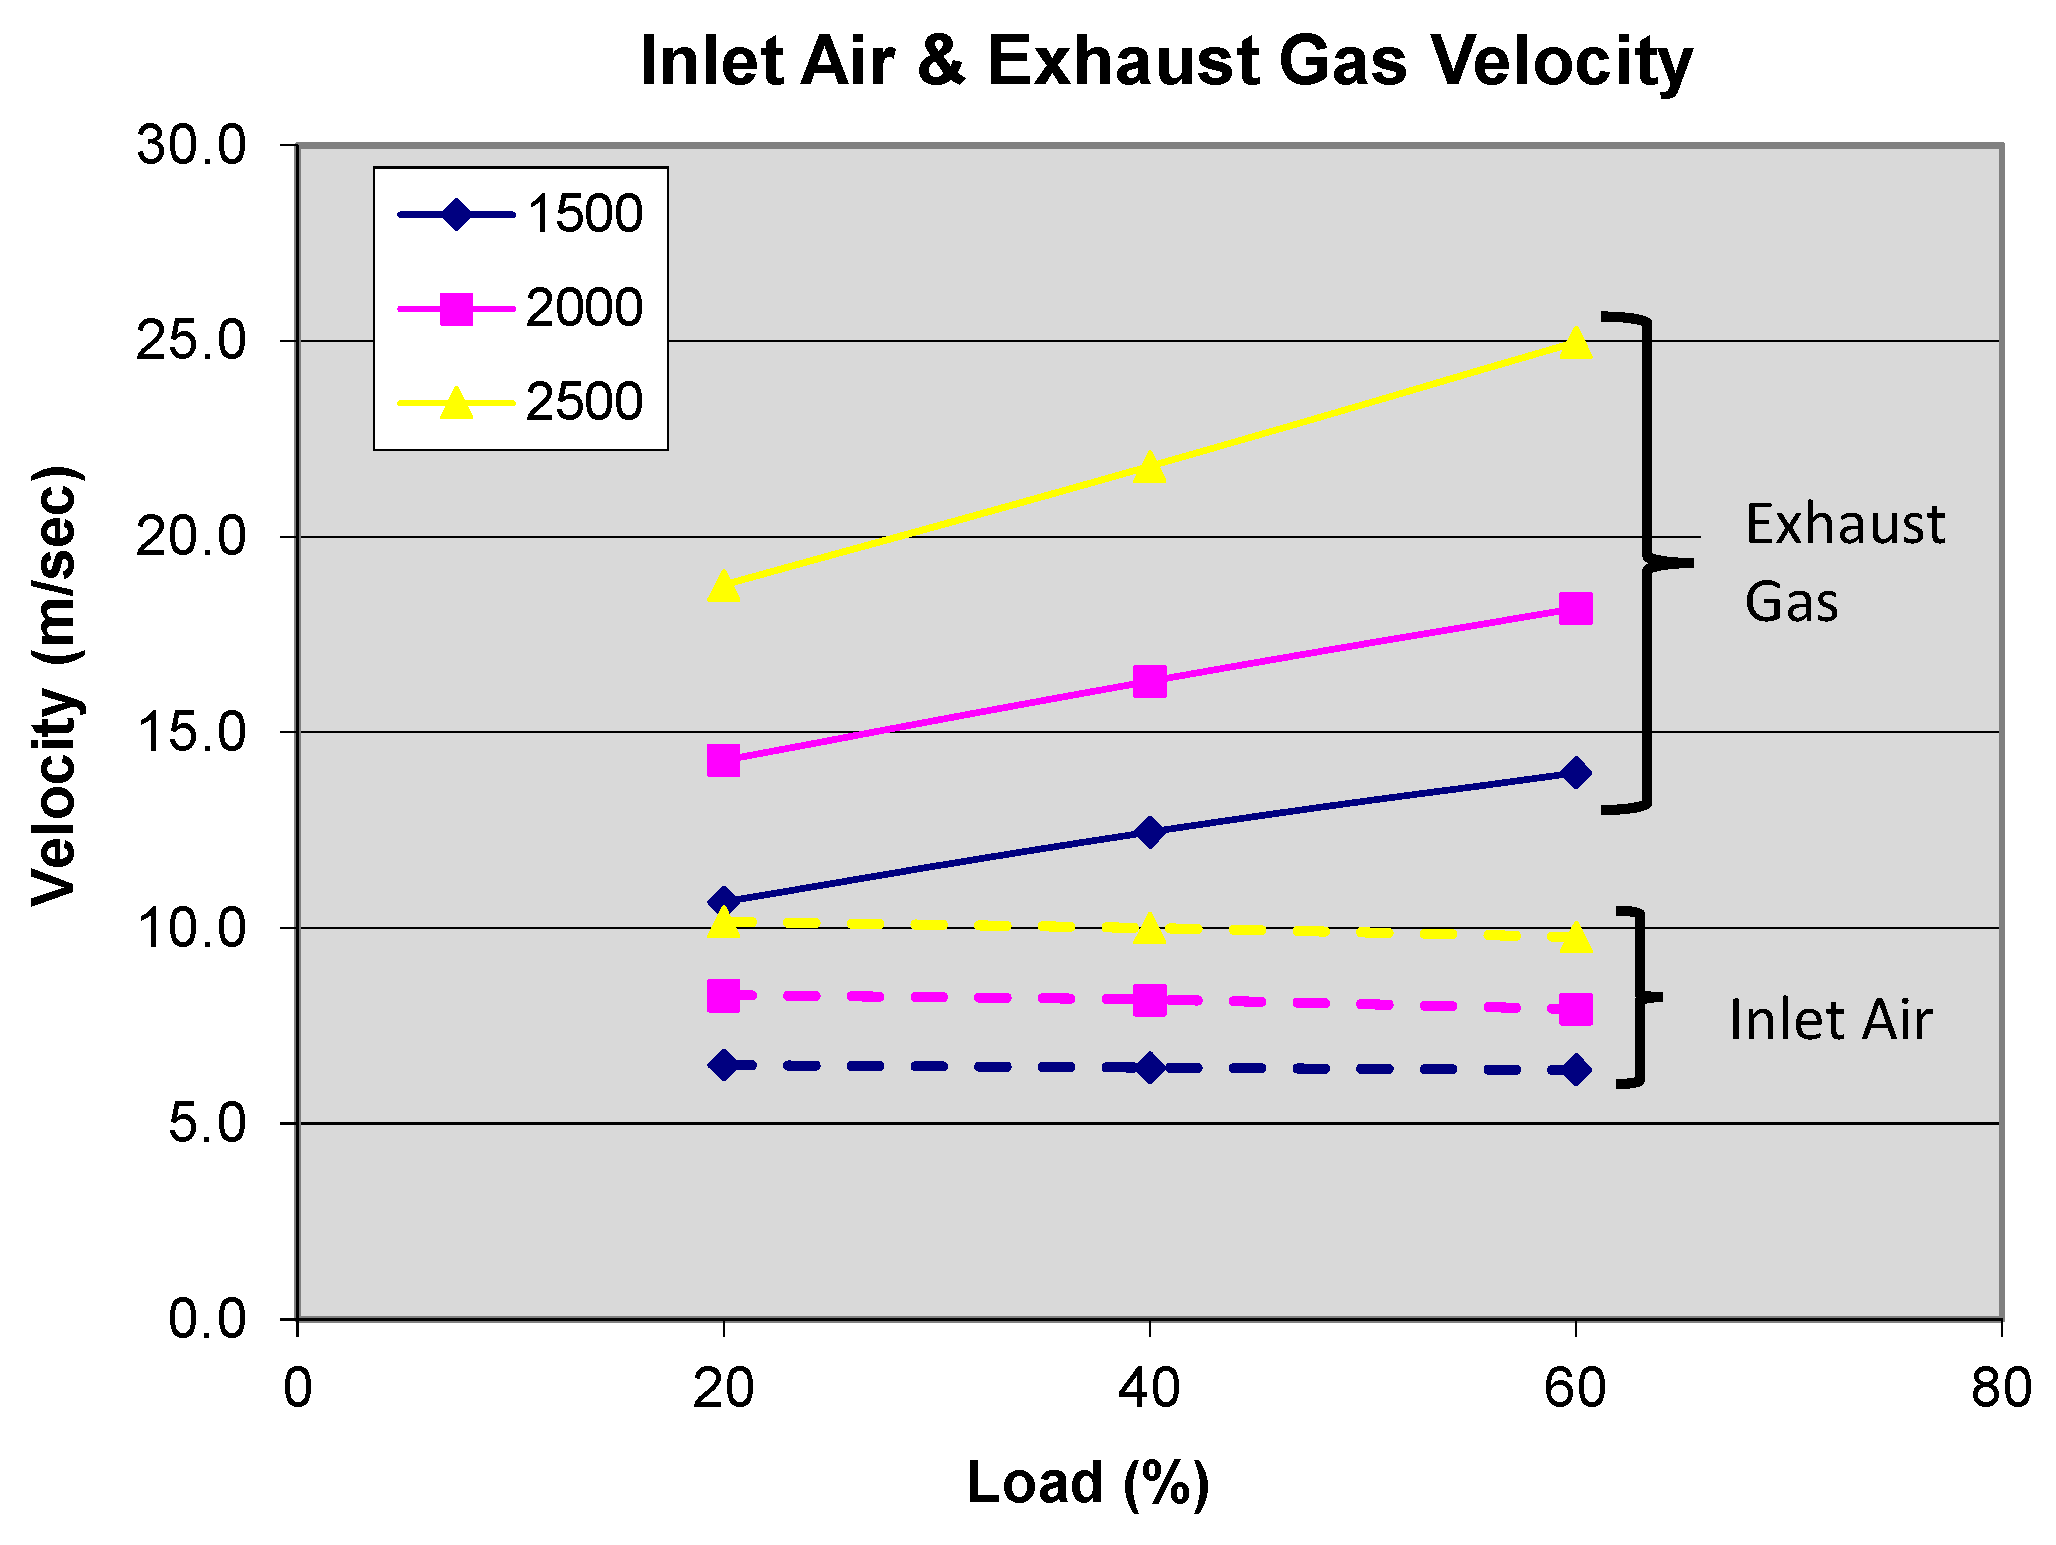
The physical quantities necessary for the calculation of HTC (Heat Transfer Coefficient) according to (5) and (6) were adopted from experimental data available as mentioned next. For example, Figure 2 presents the mean velocity of air and combustion gas inside the engine inlet and exhaust manifold, respectively, for the different experimental conditions explored during the investigation.
The volumetric airflow at the engine intake was measured during the experimental procedure using a Roots volumetric gas flowmeter. In addition, the mean intake and exhaust gas temperatures were measured using common thermocouples placed in the appropriate manifold positions. Therefore, the intake air and exhaust gas densities can be calculated with a satisfactory degree of accuracy, together with the respective mass flow rate at engine intake and exhaust. Having also calculated with sufficient accuracy the mean diameter of intake and exhaust manifolds at the positions of temperature measurement, the continuity equation can be used for the calculation of air and exhaust gas velocities. Their values are presented in Figure 2 for the combinations of engine speed and load values considered in the present investigation. It is also noted that the mass flow rate of combustion gas is calculated at every engine operating point as the sum of the intake air mass flow rate and the fuel mass flow rate.

3. Simulation of Thermal Field in Engine Cylinder Head and Exhaust Manifold

3.1. The Use of the FEA Method in Engine Thermal Field Simulation

A theoretical model for the simulation of the thermal field created in the engine cylinder head and exhaust manifold during their operation was developed using the Finite Element Analysis (FEA) method. The method was chosen as the most suitable for solving the thermal field when applying the appropriate set of boundary conditions. Details for these conditions were presented in Section 2.3 and Section 2.4 and also in [11].
The quality of the developed solid model of the engine cylinder head was checked and confirmed by creating an initial Finite Element mesh in the ANSYS R19.2 mesher routine. It was found that the triangular mesh in different resolutions (coarse, fine) was developed without any problems and with very good quality indicators. This result was also checked by several tests carried out with virtual boundary conditions in a typical strength problem of the solid cylinder head, where the excellent functioning and quality of the created solid model were confirmed.
The parameterized solid model was then introduced into the ANSYS thermal simulation software in order to solve the thermal field using FEA with the appropriate boundary conditions applied to each surface. The application covered the entire operating range of the engine. The model validation was performed with a comparison of the theoretical results with experimental measurements of cylinder head temperatures available for the whole engine operating field.

3.2. Mesh Development and Application of Boundary Conditions

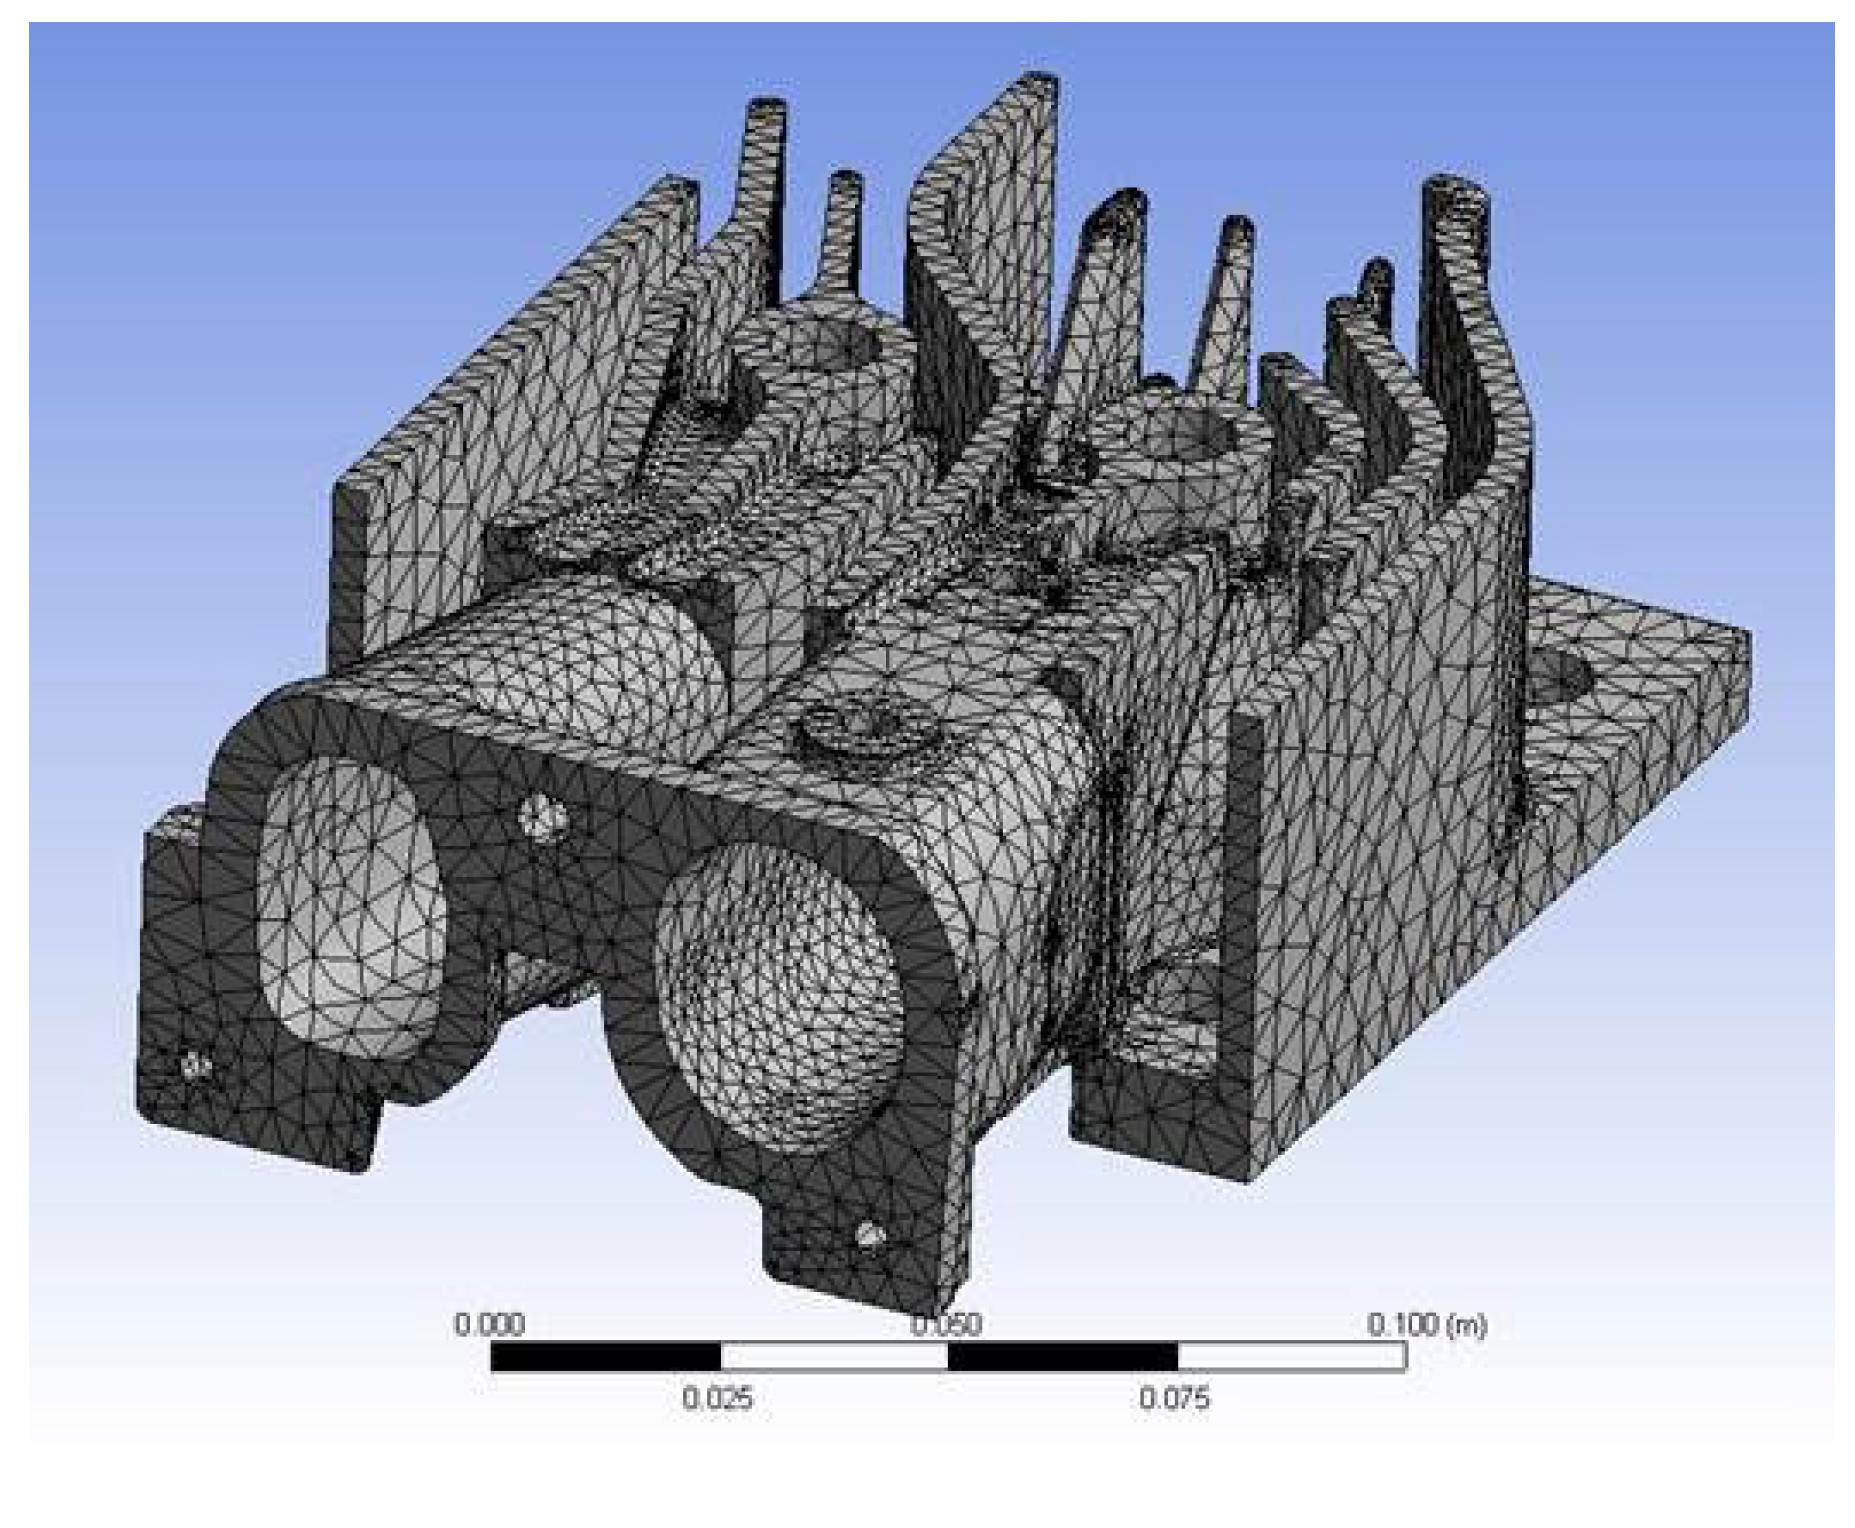
The development of the Finite Element mesh utilized tetrahedral elements (four nodes on each one). The mesh that was created was successfully tested for its quality. To verify the mesh independence of a solution, trial runs were initially performed with three different mesh resolutions (coarse, medium, and fine). A minimum difference was observed in the final solution between the three cases, a fact that confirms mesh independence. For the final solution, the medium-resolution mesh was used, which consisted of 173,354 nodes and 105,270 tetrahedral Finite Elements.
The boundary conditions applied are convection conditions on all surfaces except the upper horizontal head surface. In that area, a contact boundary condition with the upper part of the cylinder head was applied. Nine (9) different convection boundary conditions were applied in total. For the application of the conditions, the whole surface of the cylinder head was divided into 552 sections so that a separate application of the corresponding condition was carried out in each of them. In this way, there is the possibility of modifying the applied boundary condition locally if this is required by the results obtained during the preliminary test during the trial period of the application. Further details concerning the application of boundary conditions can be found in [13].

3.3. Development of the Thermal Field for Steady-State Engine Operation

The trial application period of the developed simulation model lasted for approximately two months, during which it was necessary to check the functionality of the model and the correctness of the application of the boundary conditions in order to make adaptations where necessary. The final model was applied to the entire operating range of the engine (3 loads × 3 rotation speeds). The relevant data have been presented in previous publications [11,13].
Figure 3 presents a view of the mesh that was developed and used for the engine head during the final simulation campaign. We observe that due to the adaptive nature of the mesh, its density differs significantly between the various areas of the head in order to accurately capture its geometry. It is noted that the head model has been created and used without any simplifications or other interventions that would potentially alter its geometry at certain points. This resulted in an increase in the time required to create the final mesh; however, the time to solve each case of the problem changed only a little and remained in the order of a few seconds for the steady-state operating conditions examined in the present study. In addition, areas of particular interest were accurately simulated, such as the interior of the intake and exhaust manifolds and, in particular, the geometry in their valve area, which was developed, especially that of the intake, in a way that helped to increase swirl movement of the incoming air stream as it enters the cylinder.

4. Test Engine and Experimental Installation

Details of the test engine and the experimental installation that was used in the present investigation were provided in previous publications [11,12]. The investigation was conducted on a single-cylinder, Lister LV1, direct-injection, diesel engine. It is a naturally aspirated, air-cooled, four-stroke engine with a bowl-in-piston combustion chamber. All the main combustion chamber components (lower part of the head, piston) are made from aluminum. The normal operating speed is 1000–3000 rpm. The engine is coupled to a Heenan & Froude hydraulic dynamometer.
The measuring installation was developed in the ICEL (Internal Combustion Engines) Laboratory of NTUA several years ago. It was designed especially for the study of internal combustion engine unsteady heat transfer phenomena. In order to accomplish this task successfully, the installation was configured in a way that separates the acquired engine signals into two categories:
  • Long-term response: the signals in this category present a non-periodic variation (or remain steady) over a large number of engine cycles. Therefore, the total period of acquisition is on the order of several minutes.
  • Short-term response: the signals in this category vary within a period of one engine cycle (of the 2- or 4-stroke engine). Therefore, the total period of their acquisition is raised in several seconds (for the case of steady-state engine operation).
The applied signal separation in the two above categories ensured the accuracy of measurements. The output signals of the two categories were recorded separately via two independent data acquisition systems, appropriately configured for each one of them. For the application in the unsteady engine heat transfer measurements, the two systems were appropriately synchronized on a common time reference.

4.1. Long-Term Response Installation

The long-term response installation [11,12] includes ‘OMEGA’ J- and K-type fine thermocouples (14 in total). These were located at various positions of the cylinder head and liner in an effort to provide an adequate overview of the thermal field developed in these components of the combustion chamber. Nine of those thermocouples were installed at various positions and in different depths inside the metal volume on the cylinder head and exhaust manifold, and they are denoted as “TH#j” (j = 1, …, 9) in Figure 4a,b. Similar thermocouples were also used for measuring the mean temperatures of the exhaust gas, cooling air inlet, and engine lubricating oil.
A data acquisition system was used for recording and storing thermocouple signals accompanied by an appropriate software code.

4.2. Short-Term Response Installation

The short-term response installation is responsible for capturing the periodic thermal variations occurring over the period of one operating engine cycle. Therefore, it becomes obvious that the recording of such low-level signals at the same frequency as pressure or indicator sensors is, in general, quite challenging. The main components of the short-term installation are summarized as follows:

4.2.1. Transducers and Heat Flux Probes

  • “Tektronix” magnetic pick-up acting as TDC (Top Dead Center) marker
  • Engine speed (rpm) counter and indicator (Tektronix, Beaverton, OR, USA).
  • “Kistler” 6001 miniature piezoelectric transducer (Kistler Group, Winterthur, Switzerland) for measuring the cylinder pressure. The sensor was carefully mounted on the cylinder head surface. Its output is connected to a “Kistler” 5007 charge amplifier (Kistler Group, Winterthur, Switzerland).
  • Heat flux probes (four), especially created to be used in the engine cylinder head and the exhaust manifold of the engine. The location of each of those probes (HT#1 to 4) and of the piezoelectric transducer (PR#1) is shown in the layout graph of Figure 4a and also in the image of Figure 4b.
The heat flux sensors were developed and manufactured at the ICEL (Internal Combustion Engines) Laboratory of NTUA. Their construction was based on a prototype design developed by the second author. Additional details and technical data about them can be found in [11,12]. They are customized especially for this application, as shown in Figure 5. Two alternative types of fast-response temperature and heat flux sensors were used in the present experimental procedure. The choice was mainly based on space availability at the desired position:
  • The heat flux sensors HT#1–3 in Figure 4a were installed on the cylinder head. Each of the sensors was based on a fast-response, K-type, flat-ribbon, ‘eroding’ thermocouple, which was custom-designed and manufactured for the needs of the present experimental installation [11]. This thermocouple was afterwards combined with a common K-type, in-depth thermocouple. The resulting heat flux sensor was finally fixed inside a compression fitting. The in-depth thermocouple was placed at a distance of 6 mm behind the fast-response one, inside the metal volume. The final result is shown in Figure 4.
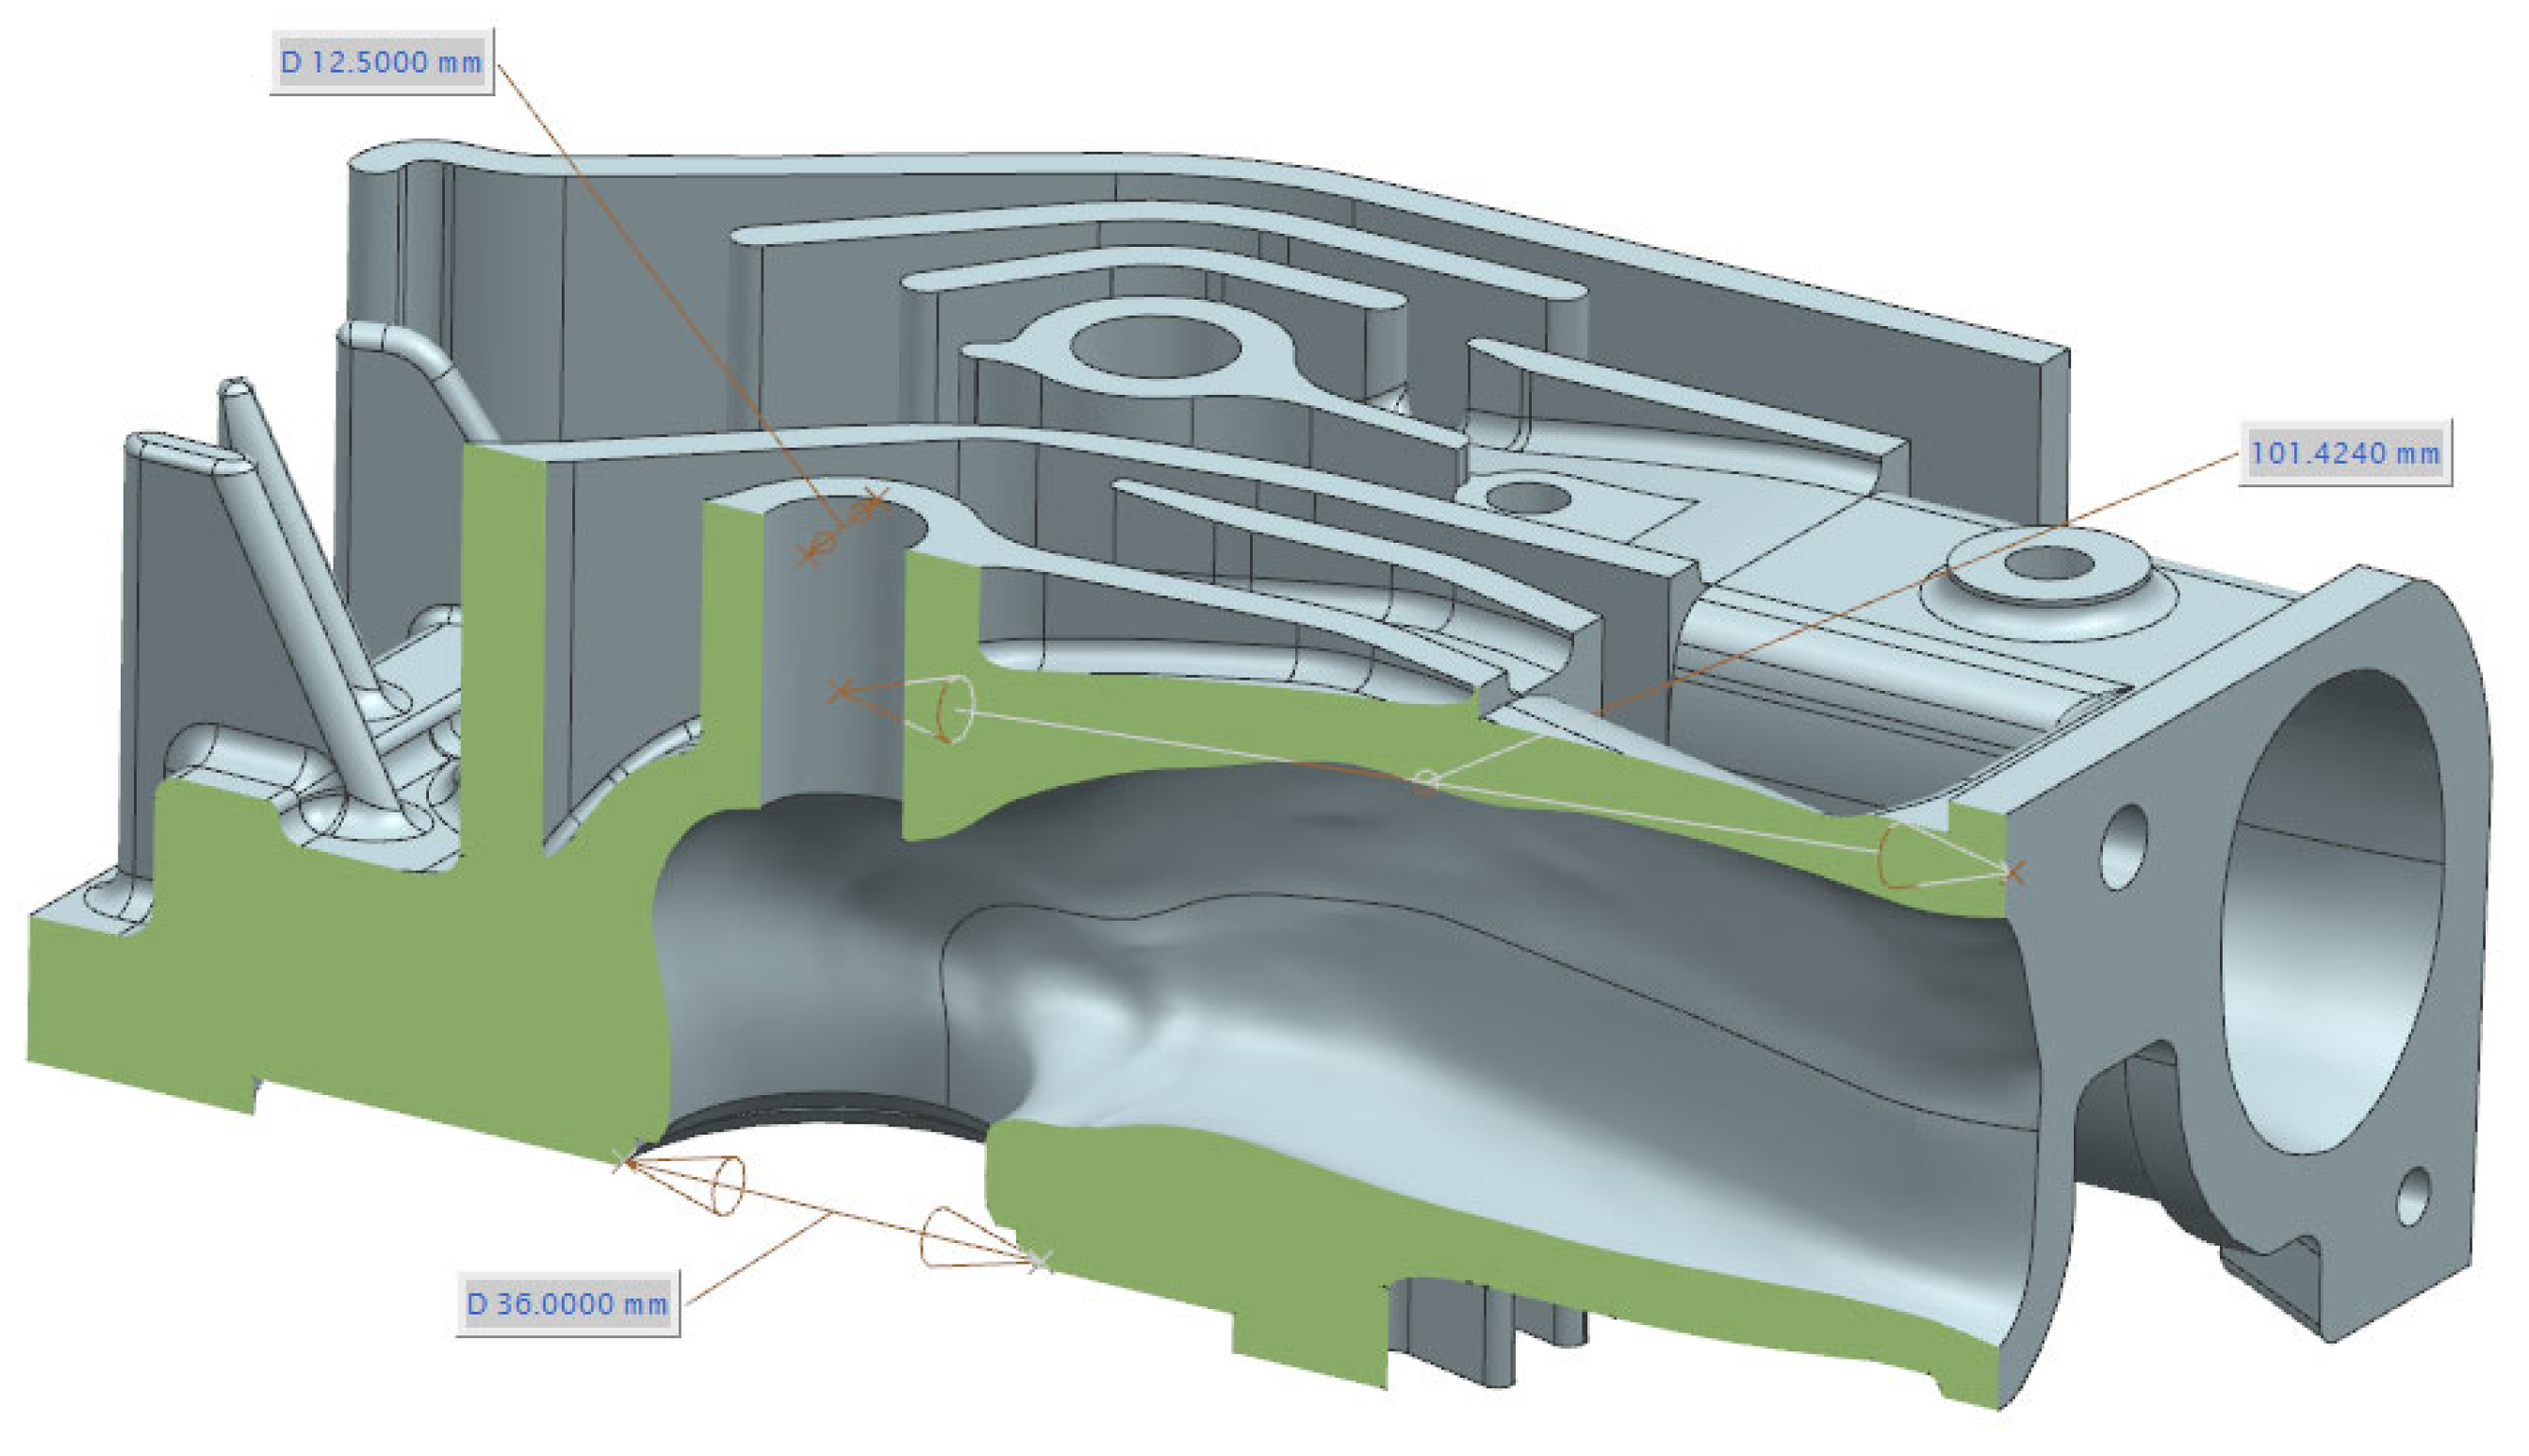
  • The heat flux sensor installed in the exhaust manifold (HT#4 in Figure 4a) was based on a fast response, J-type, ‘coaxial’ thermocouple. This was accompanied by a common J-type, in-depth thermocouple to form the corresponding heat flux sensor. The in-depth thermocouple was located inside the compression fitting at a distance of 6 mm behind the fast-response one. The sensor was flush-mounted on the exhaust manifold at a distance of 100 mm (when considered in a straight line) from the exhaust valve (Figure 6).
A special effort was made in order for the heat flux sensors to obtain a satisfactory level of reliability and durability necessary for their application in internal combustion engine measurements. Special care was given to keep the distortion of the thermal field in each position caused by the interference of the sensor at a minimum level. Before their use, all heat flux sensors were extensively tested and calibrated through a long series of experiments conducted in different engines, under motoring and firing operating conditions.
Figure 4b presents an image of the engine cylinder head and exhaust manifold instrumented with the surface heat flux sensors, the piezoelectric pressure transducer, and the “long-” and “short-term” response thermocouples at the selected locations.

4.2.2. Signal Pre-Amplification and Data Acquisition System

One of the most characteristic challenges when acquiring fast response temperature and heat flux data is the signal quality. This is emanating from the fact that, in contrast with other common sensors (pressure transducers, magnetic pickups, etc.), the thermocouple and heat flux sensor primary signal outputs are in the level of the μV range. This is an extremely low level (LL) voltage signal, and when it is necessary to be recorded at a quite high frequency (in the 10 ksample/s scale, for example), the process becomes highly unstable and uncertain.
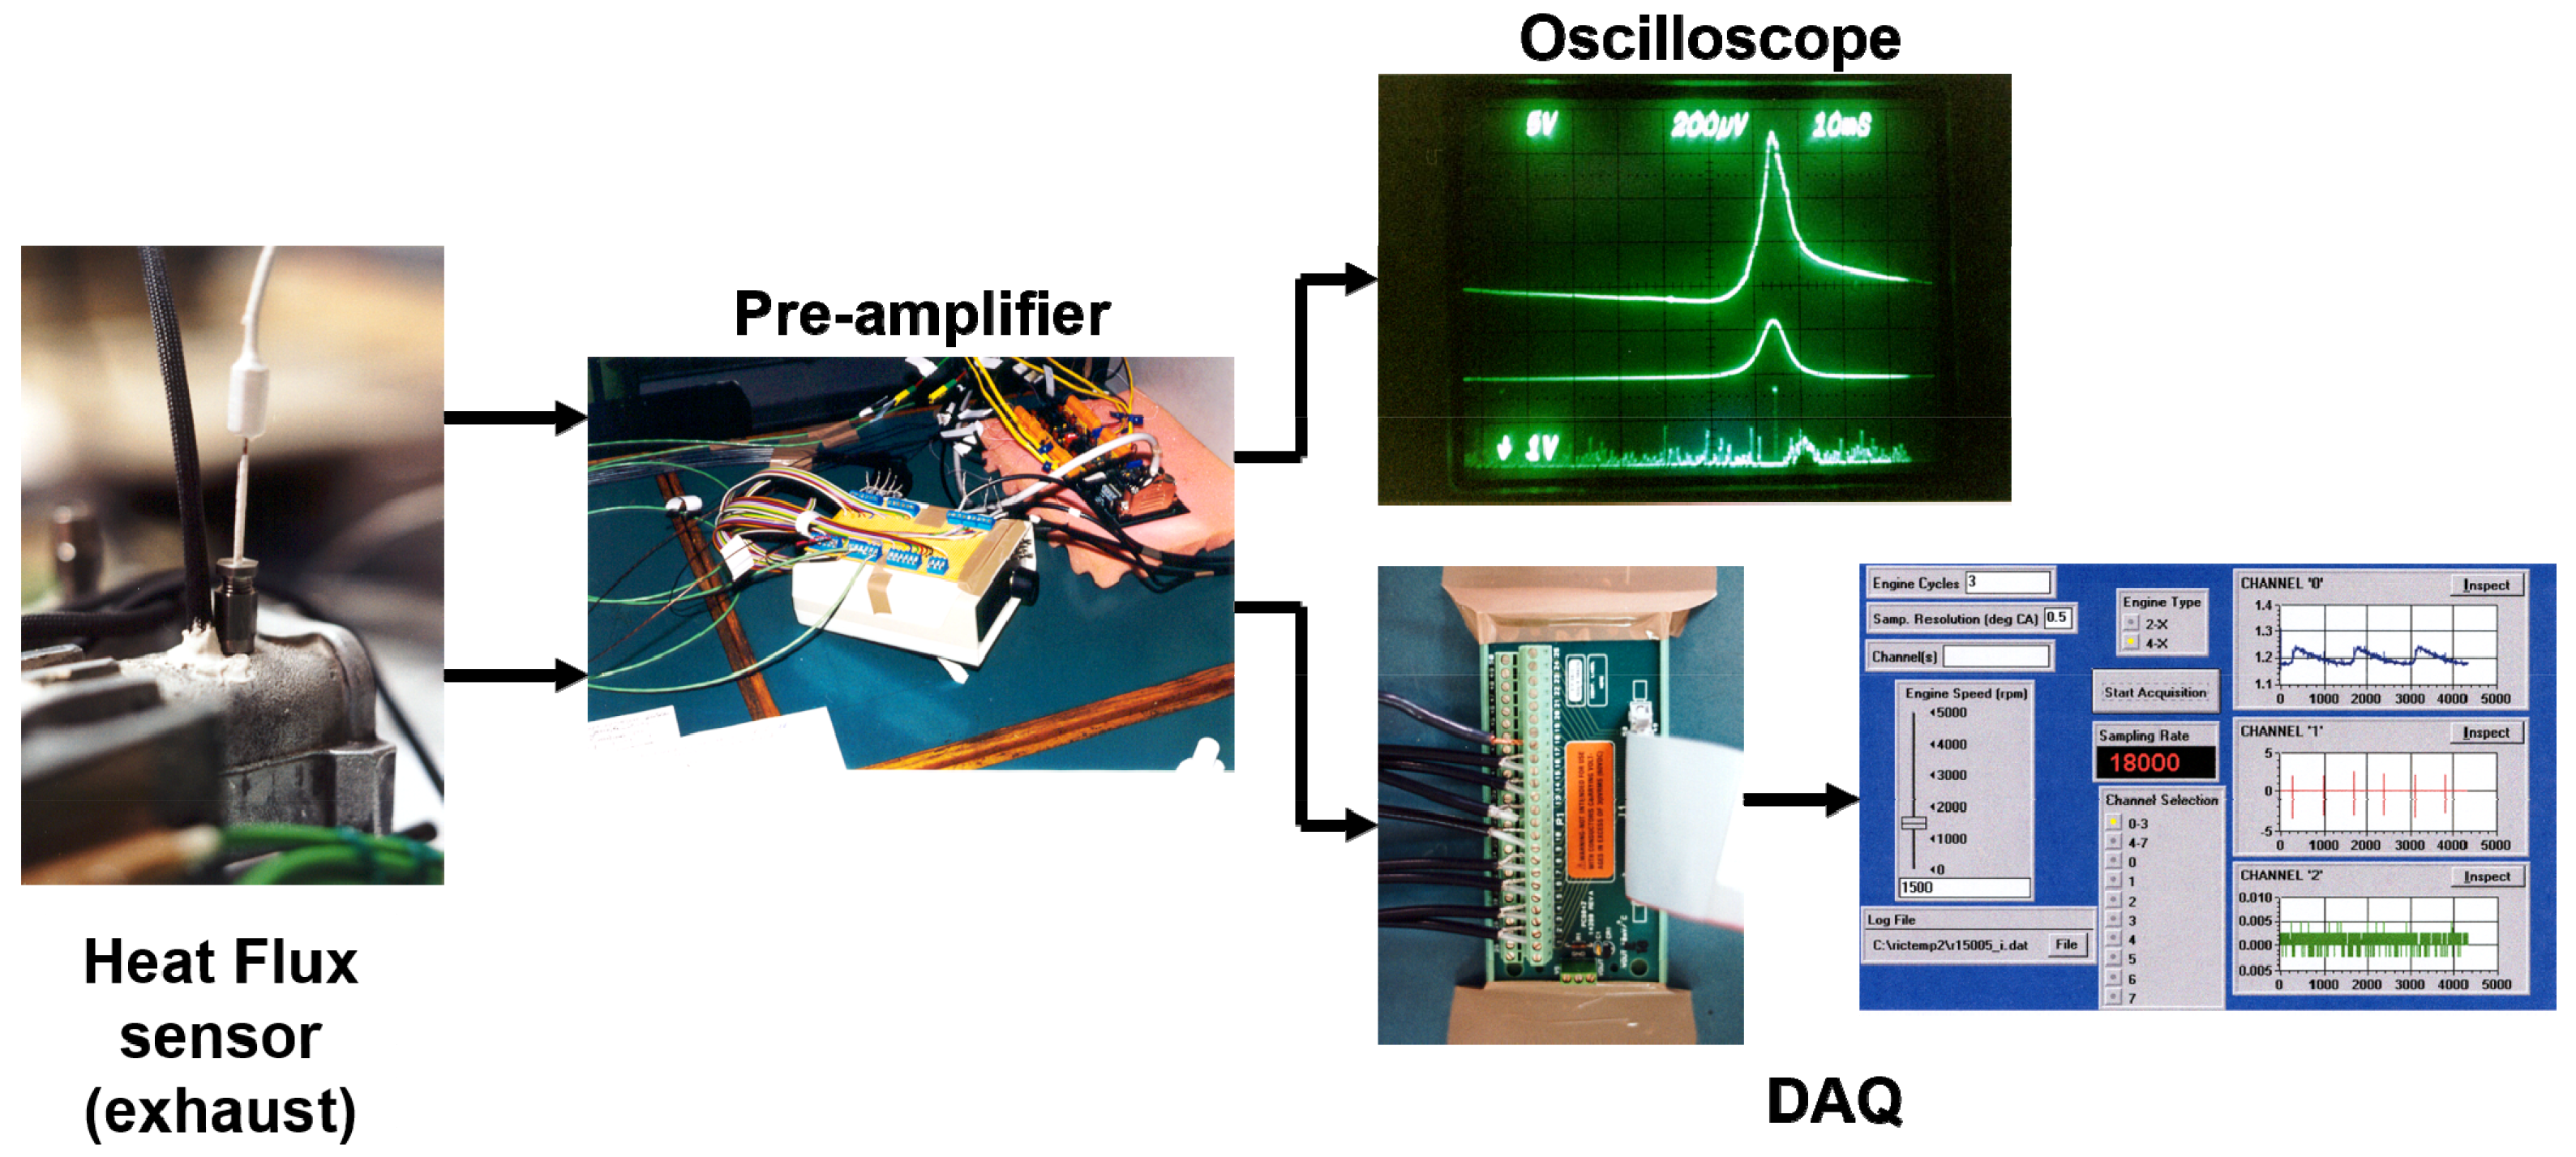
In an effort to overcome these problems with temperature and heat flux signals, in the present experimental campaign, the concept of the initial pre-amplification stage (Figure 5) was introduced. In this signal modulation technique, an initial independent pre-amplification device is applied to the temperature and heat flux sensor signals before the latter enter the main data acquisition system. The introduction of the pre-amplification solves the signal stability problems mentioned previously, with only a small contribution to their noise.
For recording the fast response signals during the steady-state engine operation, the highest frequency used was in the range of 48 ksamples/s/channel for the case of a 2000 rpm engine speed, which resulted in a corresponding signal resolution of 0.25 deg CA (Crank Angle). This frequency is obviously much higher when compared to that used with a common thermocouple signal [12].
The output signals from the thermocouple pre-amplifier unit, together with the magnetic TDC pick-up and piezoelectric transducer signals, are connected to the input of a high-speed data acquisition board for recording. The A/D board used can acquire input data at a total throughput rate of 312.5 ksamples/s from up to eight differential analog inputs by utilizing dual-channel Direct Memory Access (DMA) operation. Using this board, a high signal resolution was obtained, which corresponds to much less than 1.0 deg CA in all steady-state cases of engine operation.

5. Results and Discussion on Heat Losses in the Exhaust Manifold

5.1. Instantaneous and Mean Heat Transfer on the Engine Exhaust

The experimental measurements covered a combination of three engine speeds, namely 1500, 2000, and 2500 rpm, and three different engine load values, that is, 20%, 40%, and 60% of full engine load. During each measurement, a total of twenty-five consecutive engine cycles was recorded. These were afterwards processed in order to reach a corresponding “mean” operating cycle for the specific engine condition and compensate for the cycle-by-cycle variation in the signals introduced by engine operation. The sampling interval for all cases was kept at 0.25 deg CA, except for the 2500 rpm measurement cases, where the corresponding interval was 0.5 deg CA.
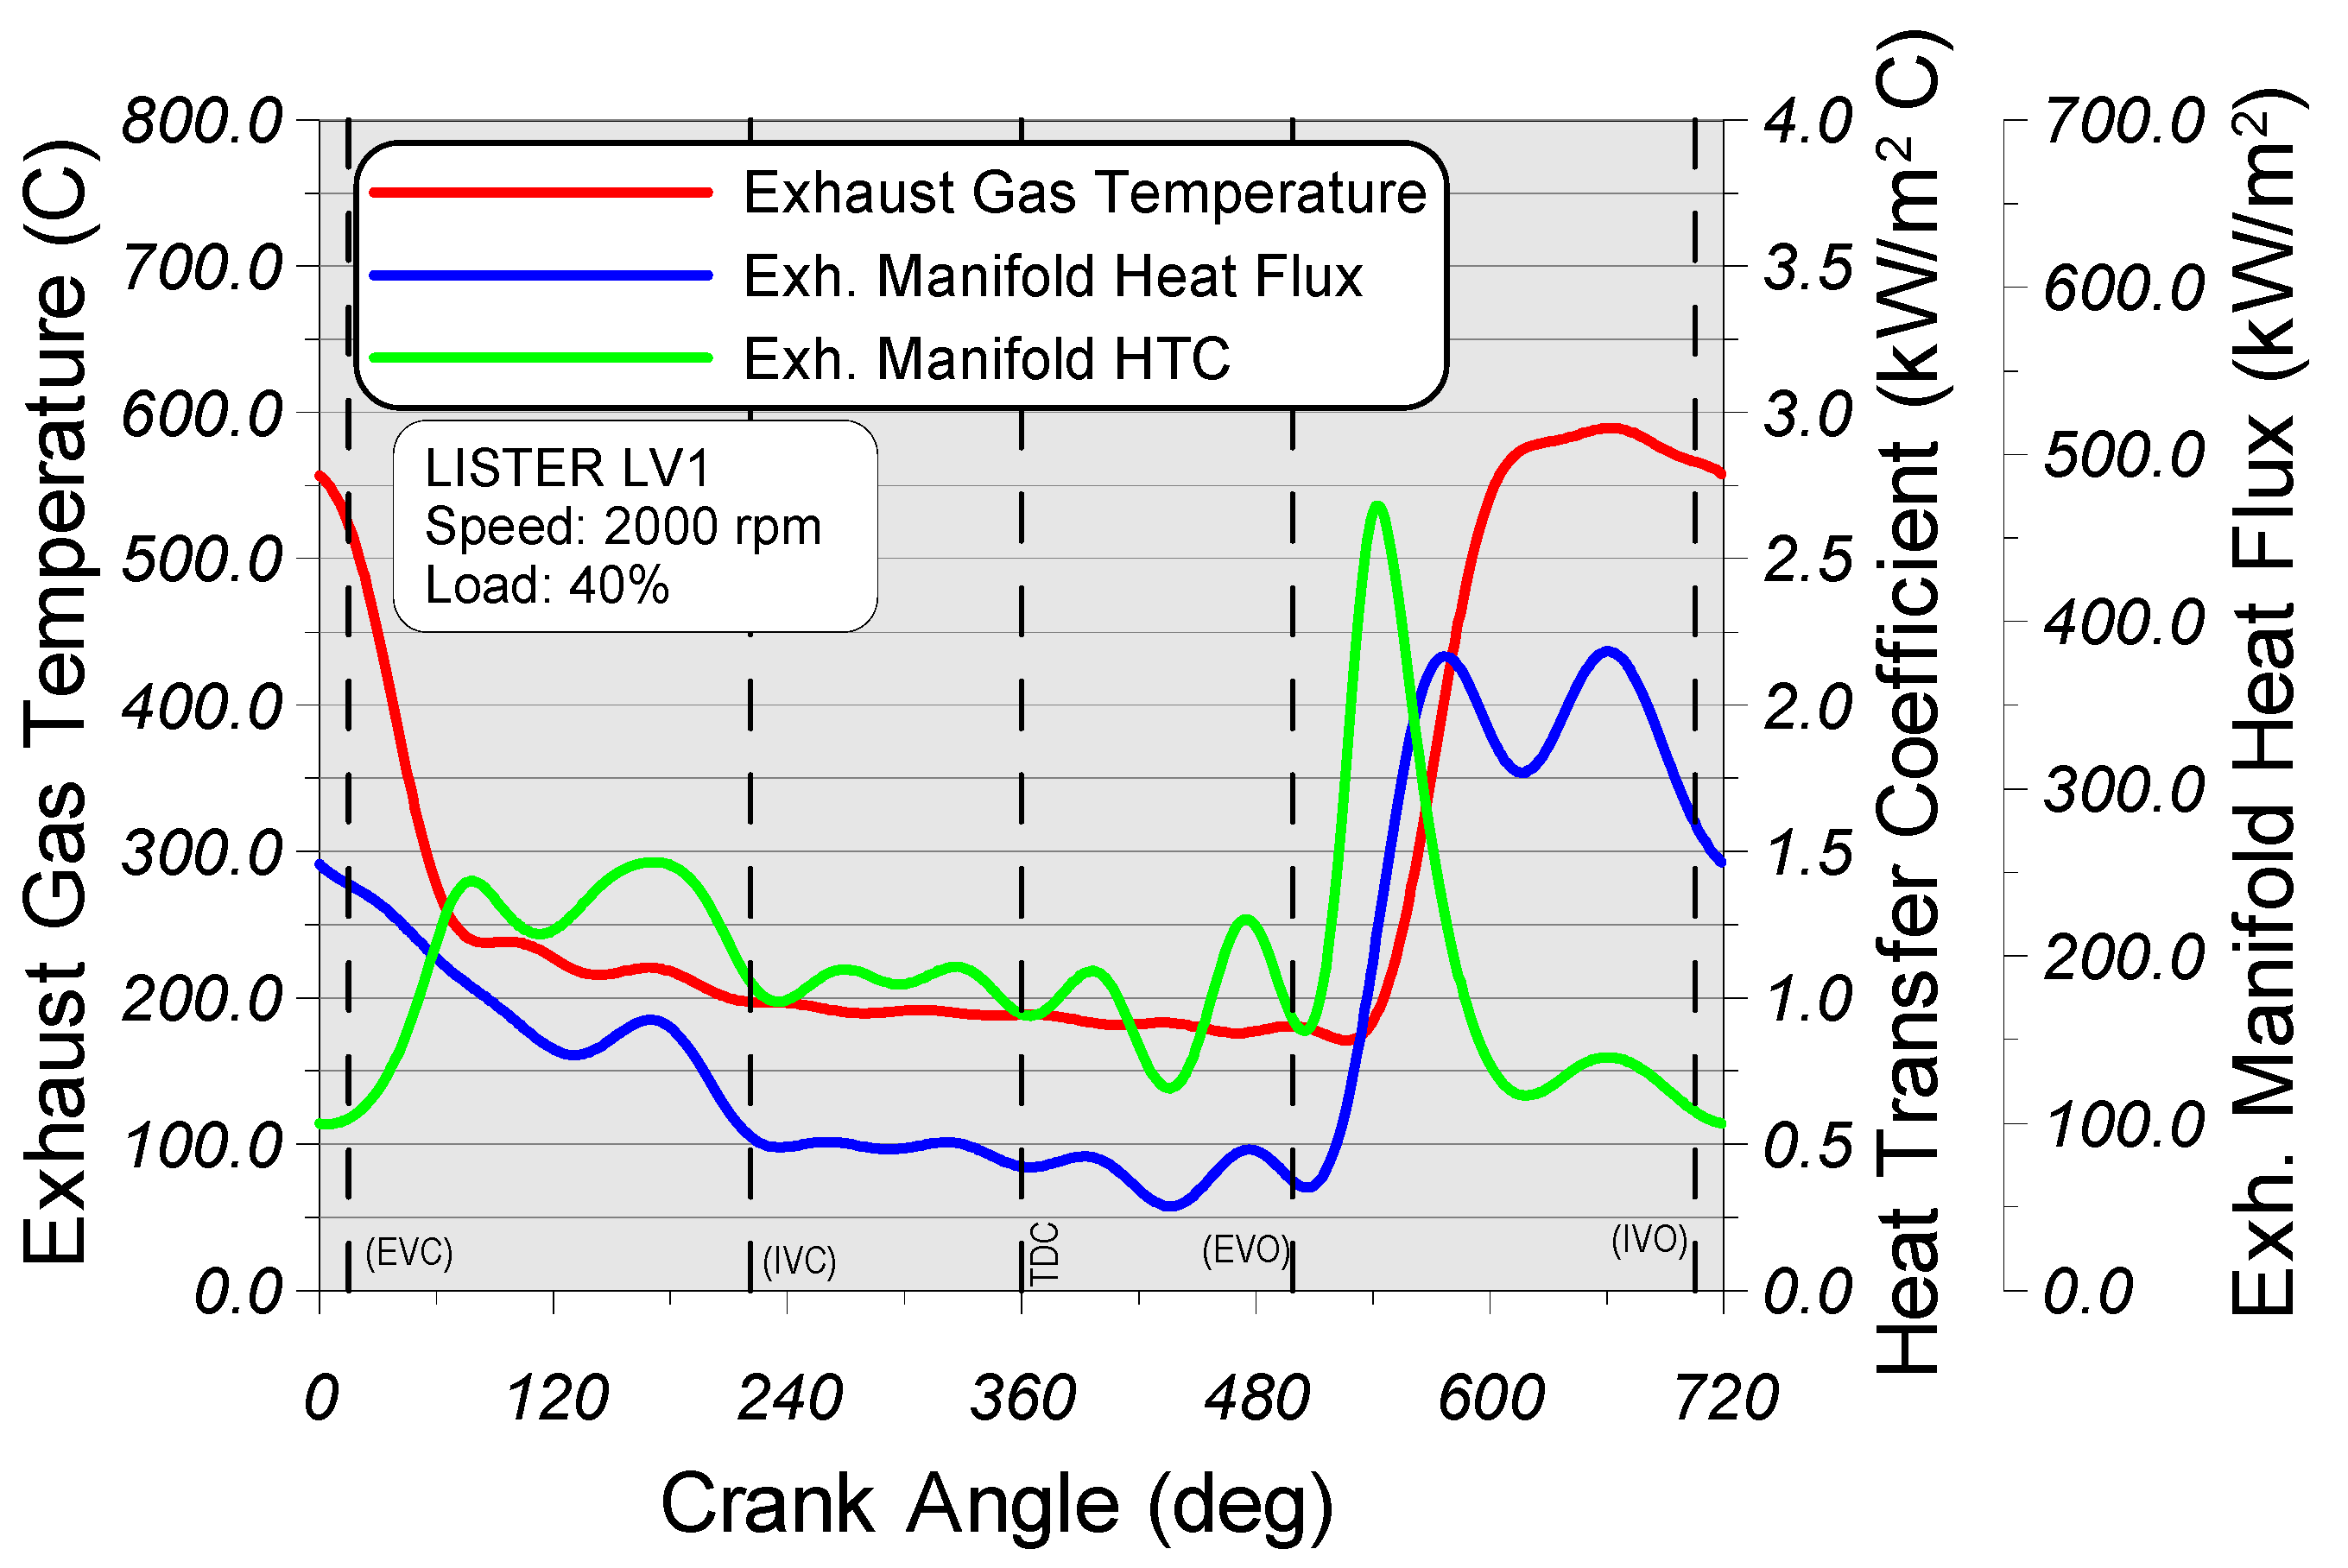
After processing the experimental measurements based on the methodology described in Section 2, the instantaneous variations and the mean values of the main heat transfer variables are calculated. As an example, in Figure 7, the heat flux, the gas temperature, and the Heat Transfer Coefficient variations are presented at the point of measurement located at the internal manifold surface for a 2000 rpm speed and 40% engine load.
As the engine exhaust valve is gradually opened, a pressure wave inside the exhaust manifold is created. In the case of multi-cylinder engines, the pressure waves created from different cylinders propagate inside the exhaust manifold at the local speed of sound, whereas the actual gas flow velocity is significantly lower. As a result, a sudden increase in local manifold pressure is created (not measured in the present experiments), followed by a respective increase in local gas velocity that is advanced ahead of the main hot exhaust gas wave. Finally, the respective local Heat Transfer Coefficient is also increased as a result of the increase in local gas velocity. The peak of local gas temperature and heat flux variations are the last ones to appear since they are the result of the passage of hot exhaust gas mass from the location of measurement, which, as explained before, travels with a much lower speed in comparison with gas pressure and velocity. This result is displayed clearly in Figure 7, and it is also confirmed by other relevant heat transfer studies [1,2], claiming that the largest heat transfer amount in the exhaust manifold occurs during the blowdown period. As expected, the phase difference between the peak Heat Transfer Coefficient and the rest of the variations is increased as the distance of the measuring point from the exhaust valve increases. The phase differences (measured in deg CA) between the peak values of the different variations are clearly presented in the experimental results of Figure 7. During the displacement phase, the gas velocity is highly reduced in comparison with the blowdown, and the Heat Transfer Coefficient follows, adopting the same pattern.
It should be emphasized at this point that the heat transfer characteristics described here for the exhaust port of the engine are valid for the small-sized, high-speed engines, such as the one used in the present investigation. The same phases of exhaust are expected to appear in large-sized two-stroke, low-speed, crosshead engines; however, in this last case, the relevant phases of exhaust are expected to present different intensity and heat transfer characteristics.
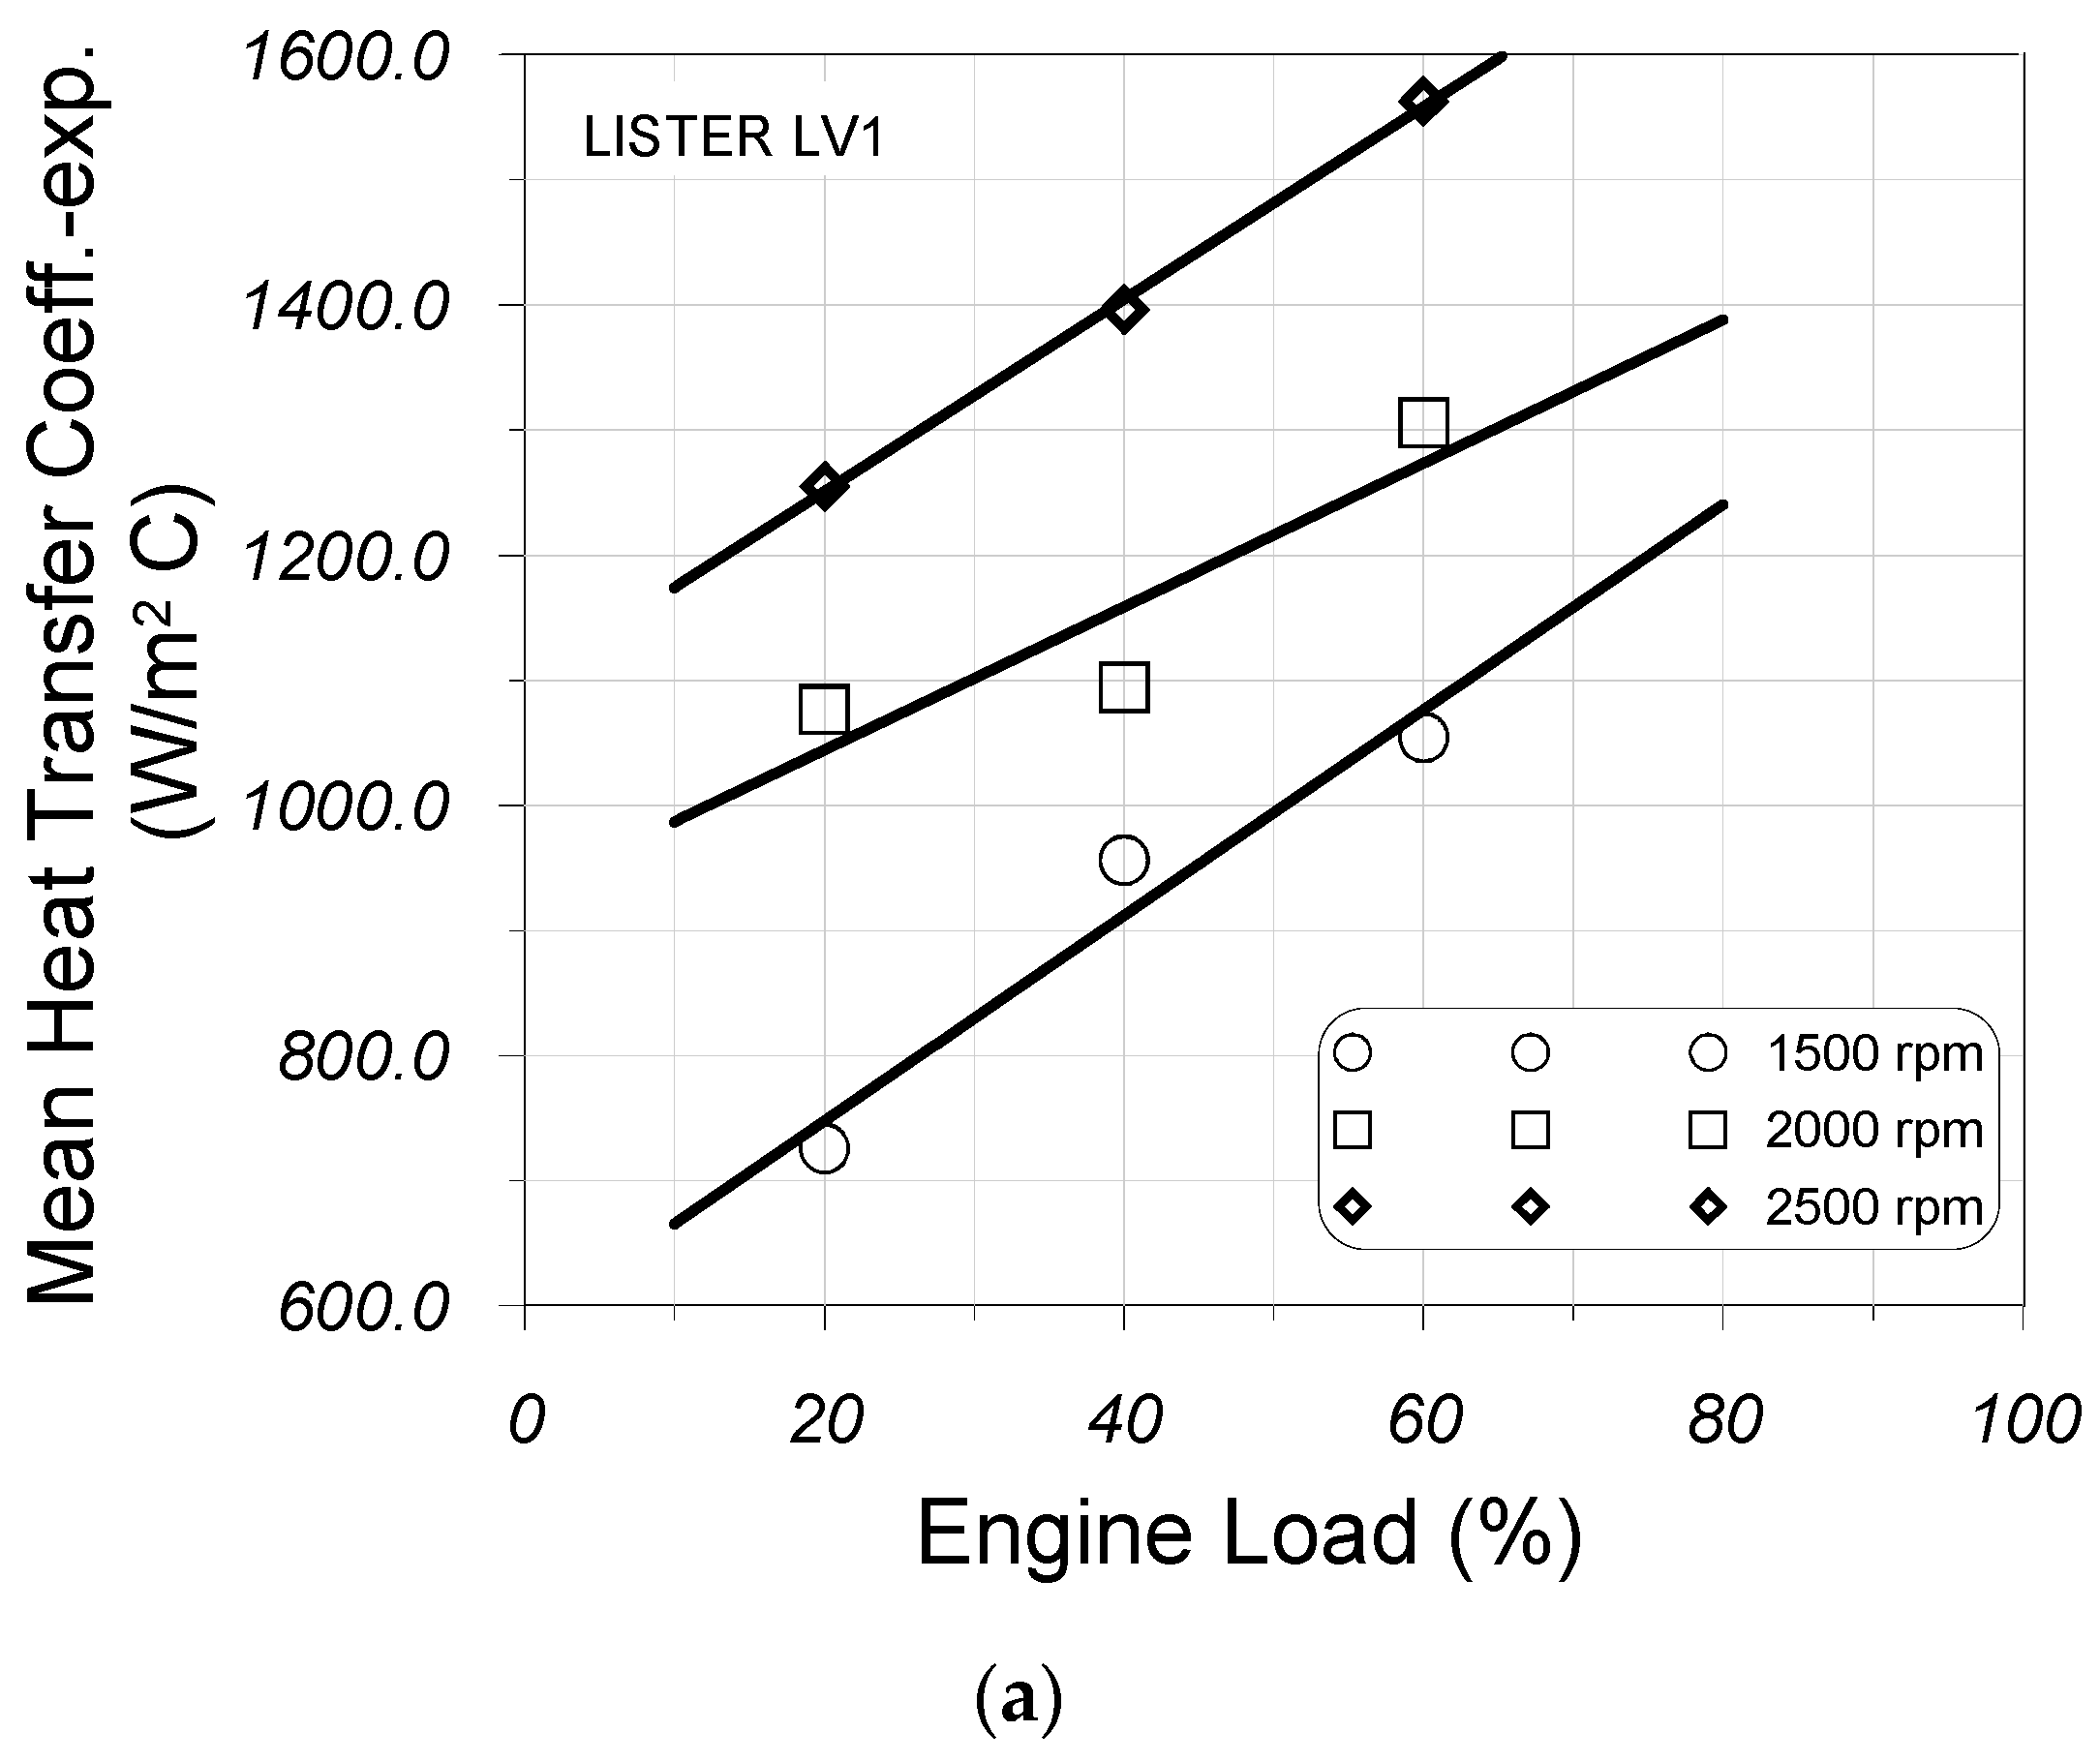
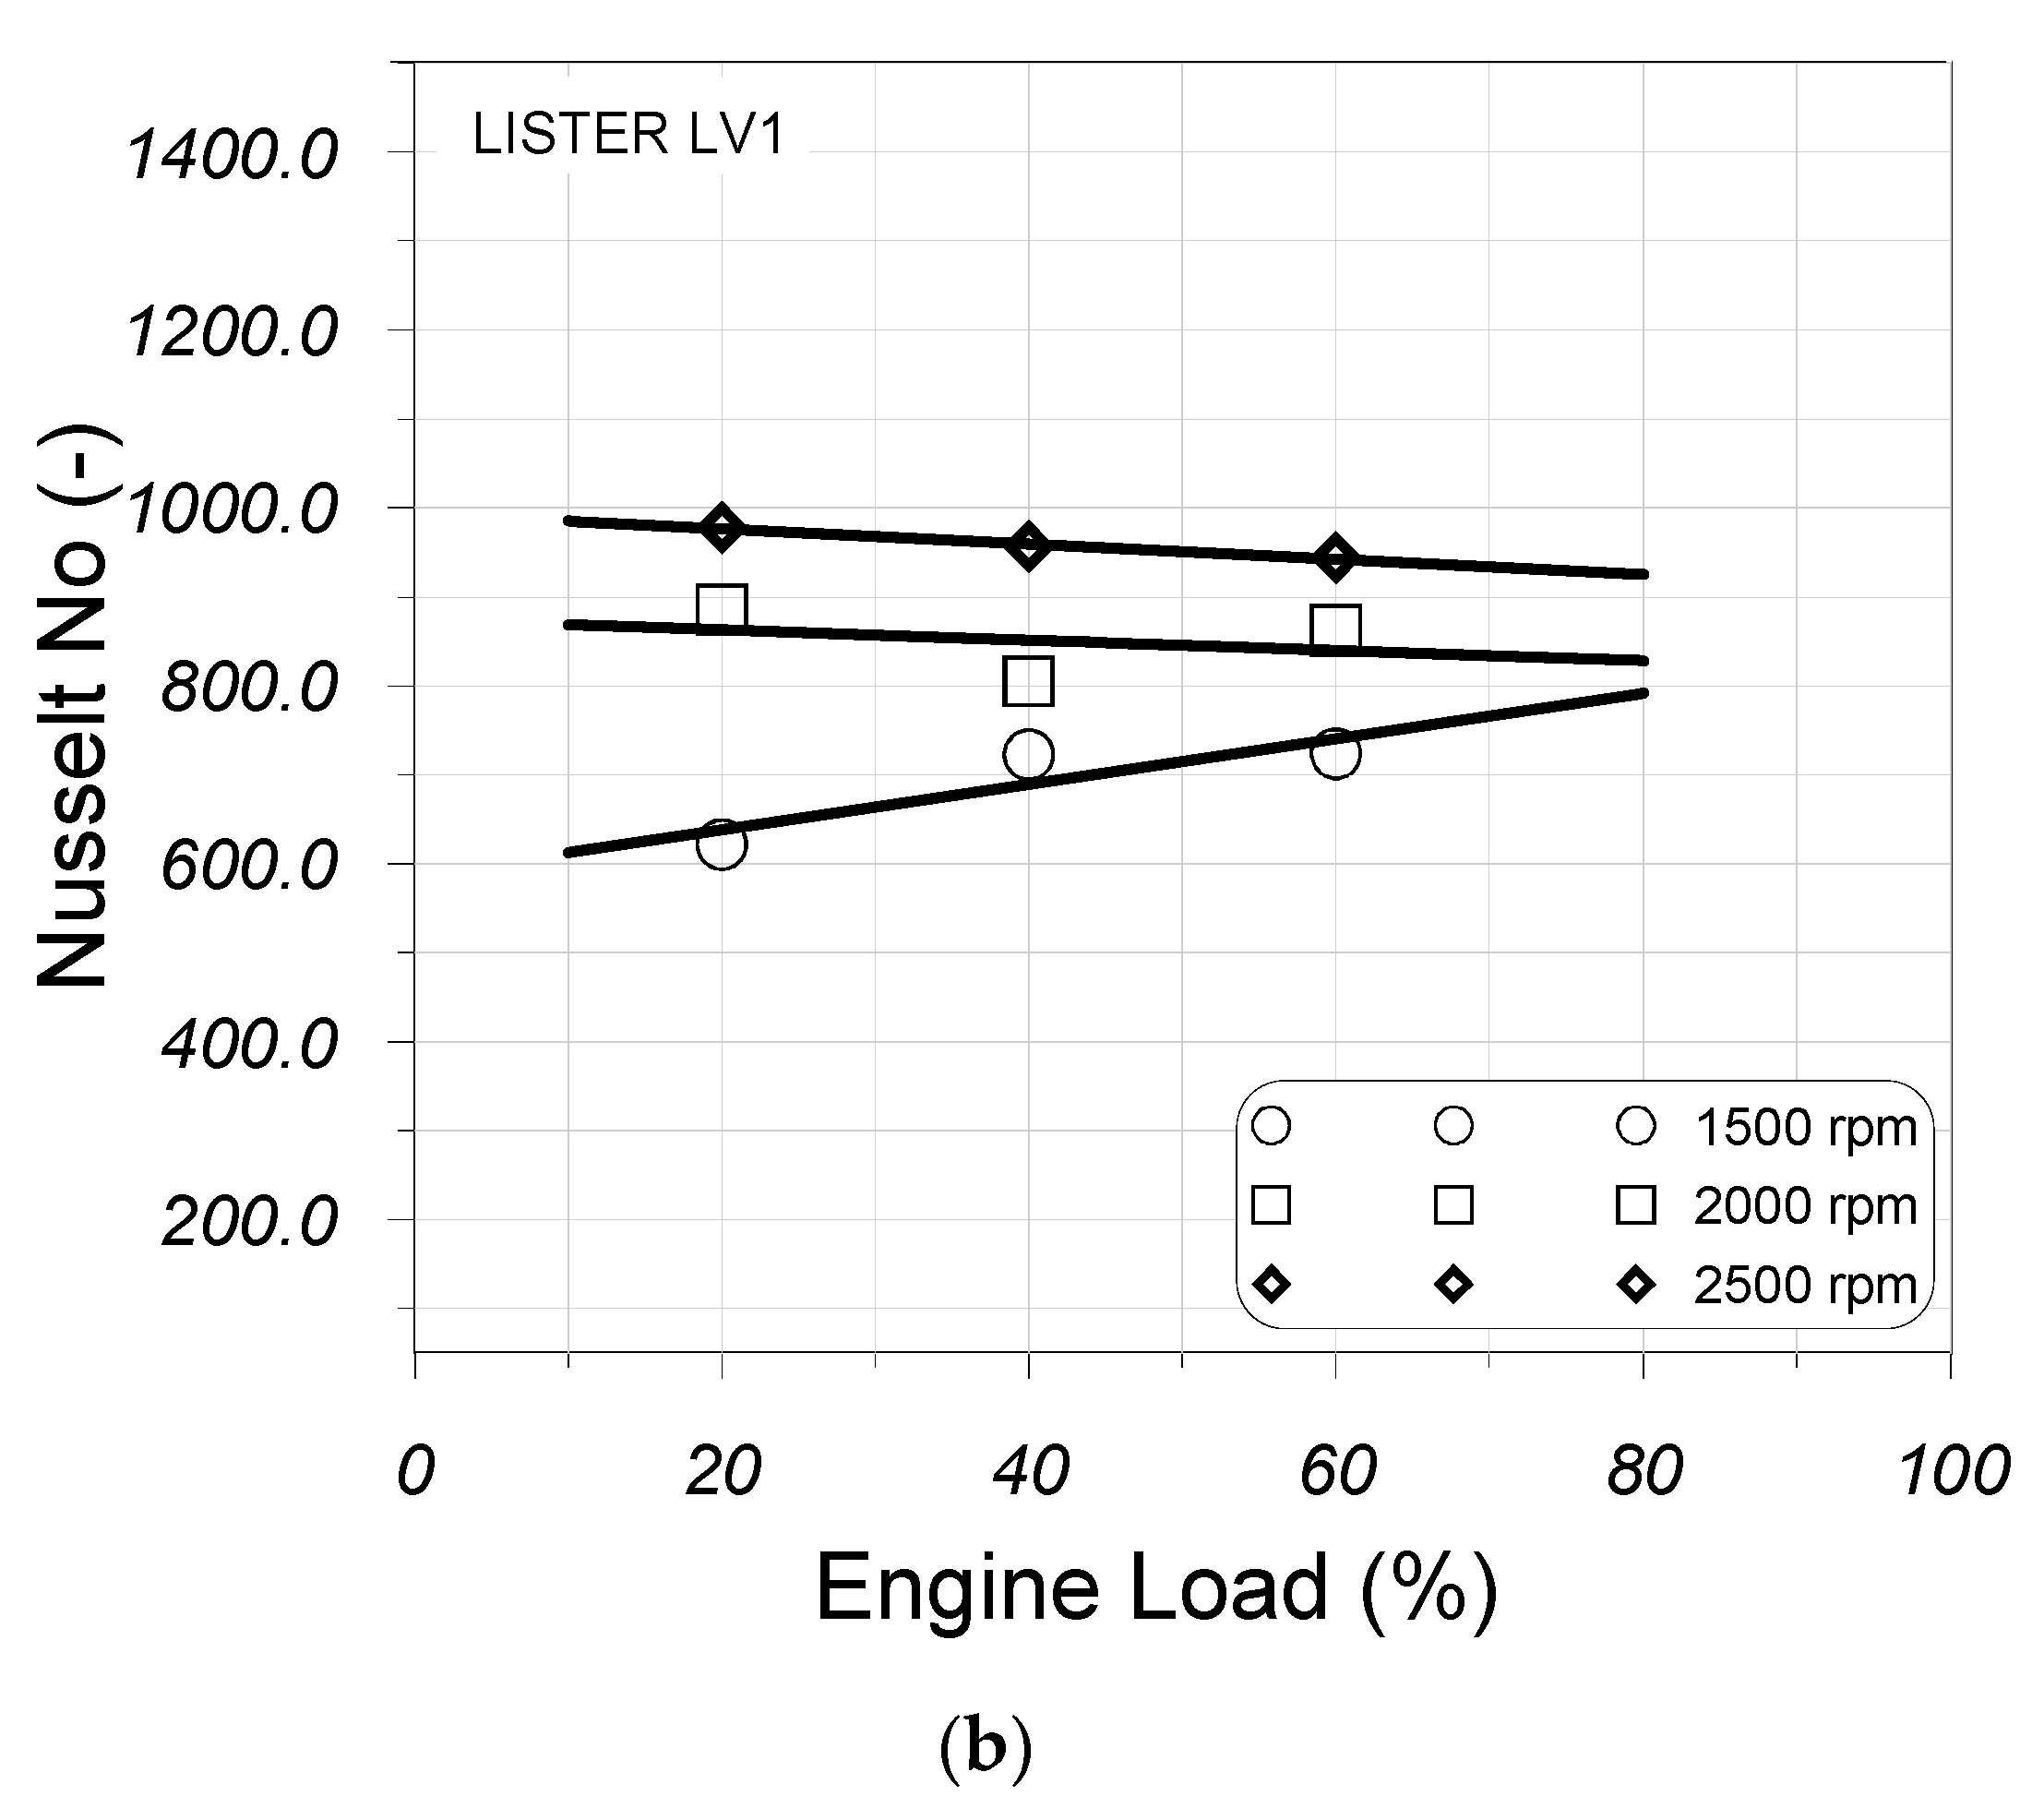
The experimental results for the instantaneous quantities (gas temperature, heat flux, etc.), an indicative part of which is presented in Figure 7, are integrated during one operating cycle of the 4-stroke engine in order to obtain their corresponding average values during an engine cycle. In the following Figure 8a,b are presented the average experimental values of the Heat Transfer Coefficient and the Nu number for the whole engine operation field. It is found that in the case of the Heat Transfer Coefficient, there is a significant increase in its values with the increase in both the engine load and speed, as expected. On the contrary, in the case of the Nu number, there is a significant increase in its value as the speed increases. The increase in load, on the contrary, leads to the highest values of rotational speed and to a marginal reduction in the Nu number, the change in which is dominated by the increase in the values of the thermal conductivity of the hot gases, which ultimately outweighs the effect of the exhaust gas speed at the higher levels of engine speed.
From the previous results, it becomes evident that the main factor determining the mean value of the Heat Transfer Coefficient inside the exhaust manifold is the average flow rate of the exhaust gases.
The overall picture of the results for the average value of the heat transfer in the exhaust manifold over the entire operation field of the engine is shown in Figure 9a, where the variation in the Nu number as a function of the Reynolds number in a logarithmic scale for all operating points measured during the experimental process is provided. The results clearly confirm what was expected from experience: the experimental values of the Heat Transfer Coefficient at the exhaust port are significantly higher (about 20 to 30 times) compared to those calculated using the “classical” heat transfer correlations for the fully developed turbulent flow. On the logarithmic scale, both the “experimental” and “theoretical” results follow an almost linear distribution with increasing values of the Nu number as the values of the Re number are increased.
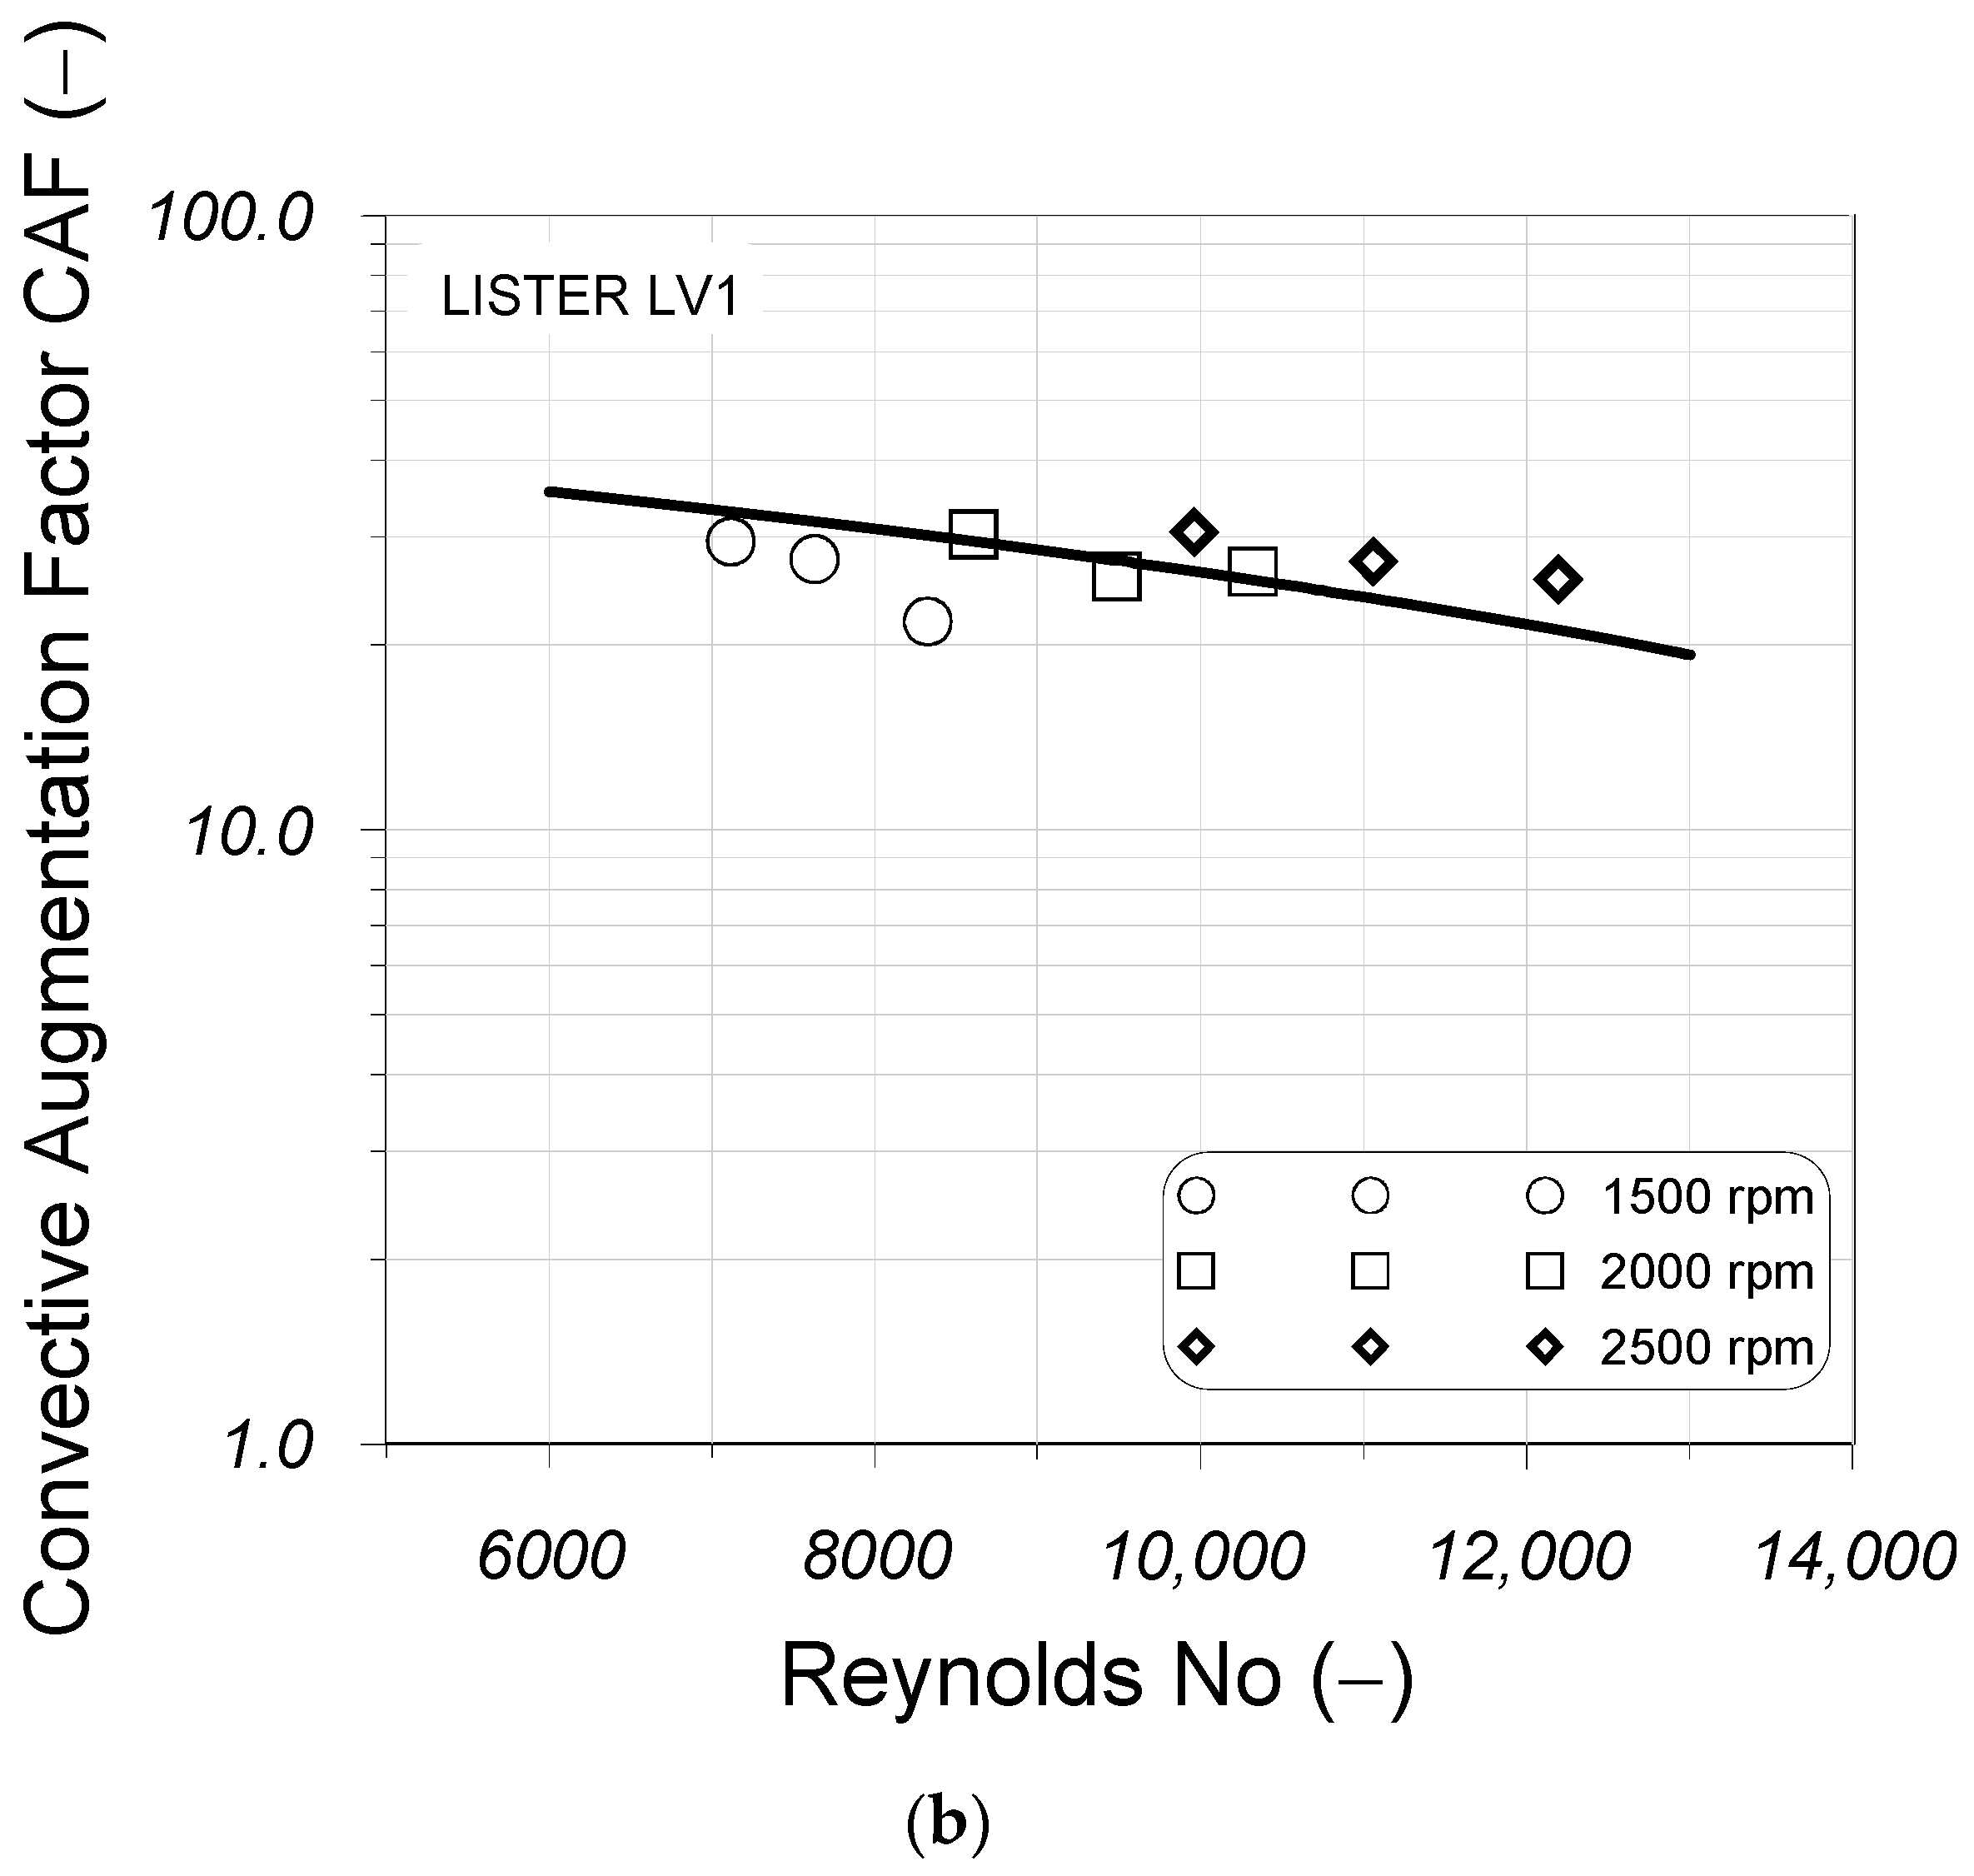
The Convective Augmentation Factor (CAF), Figure 9b, which is the ratio between experimental and “theoretical” Nu number, obtains values between 20 and 30 for the whole engine field of operation. These values are distributed in a linear sequence in the logarithmic scale as the Re number is increased, which is in agreement with similar results from the literature [1,3]. The CAF values are actually higher compared with other results in the literature [1,3] since, in the present case, the HTC measurements are performed at a distance of 100 mm downstream of the exhaust valve, whereas almost all the literature results refer to points near the exhaust tailpipe and the catalytic converter. In the last case, the effect of pulses in exhaust HTC is expected to be moderate, and CAF values fall in most cases below the value of 10. Of course, the type of engine (CI or SI) is an additional factor for HTC and CAF values.
The discrepancies observed between the experimental values of Heat Transfer Coefficient and the results from the application of the basic heat transfer relations are due to the special characteristics of the flow profile inside the exhaust (and intake) manifold. Specifically, the flow is “pulsatile” with high velocities around the exhaust valve (exceeding Mach 1 in the initial opening phase of the valve), and, in combination with the curvature of the initial section of the manifold (exhaust port), results in a significant disturbance of the smooth development of the thermal boundary layer. In addition, an increase in the turbulence intensity of the exhaust gas is observed during its flow around the valve. The previous phenomena are expected to lead to a significant increase in the heat flux compared to the result normally expected from the calculations when applying the basic heat transfer relations.

5.2. Development of a New Correlation for the Prediction of Heat Losses Inside the Engine Exhaust Manifold

From what was mentioned in the previous section, it becomes apparent that the traditional heat transfer correlations for fully developed turbulent flow fail to predict the heat transfer within an acceptable level of accuracy, especially in the initial part of the exhaust duct immediately after the corresponding valve (exhaust port). This result is confirmed by similar research works in the literature [1,3] and led the present researchers towards an effort to formulate a new heat transfer relationship that could take into account the particular phenomena in this region and be able to provide a more successful prediction of the expected average values of transport quantities.
In the present research work for the entrance region and up to 100 mm downstream of the exhaust valve, after long and detailed processing of the relevant experimental quantities for heat transfer (average experimental values of gas temperature, wall heat flux, and temperature at the inner side of the exhaust manifold), the following correlation for the Nu number is suggested:
N u = 0.023 Re 4.16 ( 1 Pr ) 1.7 ( 1 G z ) 3.5 2.6 S t 0.62
with the following conditions:
  • Application up to 100 mm downstream the exhaust valve;
  • Engine speed: 1000 rpm < n < 3000 rpm.
The formulation of Equation (7) is initiated from the Colburn analogy, as this is generalized with the Dittus-Boelter equation. In the “classical” correlations of turbulent heat transfer, the Nu number is correlated to the Pr number and the average value of the flow velocity as expressed by Re. Often, when modeling problems related to heat transfer in the ICE engines, the Pr number is omitted, as for the combustion gases, its value stands close to unity. In the present investigation, it was considered more beneficial to keep Pr as its values obtained for the flow conditions in the initial part of the exhaust manifold were estimated in the range between 0.7 and 0.8.
In Equation (7), the Graetz number has been introduced as follows:
Gz = Re Pr d L
where in Equation (8), d is the diameter of the exhaust pipe at the examined location, and L is the distance of this location from the exhaust valve. The introduction of the Graetz number in Colburn’s analogy was used to express the gradual growth of the thermal boundary layer. The development of the latter in the considered area is particularly unstable due to the intense swirl of the gases as they exit the cylinder, and is further enhanced due to the roughness of the exhaust wall.
In Equation (7), the Strouhal number has also been introduced as follows:
St = f L u
where in Equation (9), f is the frequency of flow pulses inside the exhaust manifold, which is identical to the working frequency of the exhaust valve (single cylinder engine), and u is the mean flow velocity of the combustion gas in the considered location of the manifold. The number St is introduced in order to express the significant effect of the dynamic nature of the flow inside the manifold, which is characterized by pressure pulses of frequency f (pulsating flow).
The correlation of the proposed new equation with the experimental data is presented in Figure 9a and is particularly satisfactory, achieving a value of R2 equal to 0.915.

5.3. Comparison of Theoretical Results with Experimental Measurements

Figure 10a,b present the results of the FEA simulation of the engine cylinder head for temperature and heat flux distributions. The engine operating point considered is 2000 rpm and 40% load. The boundary conditions for temperatures and HTC applied to each surface were derived based on the experimental measurements.
Comparison of FEA results with the experimental wall temperatures measured at various locations of cylinder head and exhaust manifold at 2000 rpm speed and 40% load presented in Figure 10c is in very good agreement, a fact that confirms the validity of the numerical calculations and the application of boundary conditions including the HTC values for the exhaust port as derived from the proposed correlation (6).

6. Conclusions

The detailed experimental data available for instantaneous and mean temperatures and heat fluxes in the cylinder head and exhaust manifold of a four-stroke DI diesel engine confirm that the classic heat transfer correlations for the calculation of HTC in fully developed turbulent flow underestimate its magnitude significantly. This is mainly due to the pulsating flow inside the engine exhaust, which generates a complex flow field with waves traveling towards both sides of the exhaust manifold at the same time.
The evaluation of experimental measurements also revealed that the main factor determining the mean value of the Heat Transfer Coefficient inside the exhaust manifold is the average flow rate of the exhaust gases. On the other hand, the increase in engine load leads to the highest values of rotational speed and to a marginal reduction in the Nu number, the change in which is dominated by the increase in the values of the thermal conductivity of the hot combustion gases.
The previous result is confirmed from the values of the Convective Augmentation Factor (CAF), which is the ratio between the experimental and “theoretical” Nu number, which, in the present case of the exhaust port, obtains values between 20 and 30 for the whole engine field of operation.
To compensate for this effect, in the present paper, a new heat transfer correlation for the estimation of heat losses inside the exhaust manifold at the entrance region and up to 100 mm downstream of the exhaust valve is proposed. The proposed semi-empirical correlation manages to predict the heat losses in the internal side of the exhaust port with reasonable accuracy, which is proven by the comparison between FEA predictions and measured values at a number of locations distributed around the surfaces of the engine cylinder head. The proposed correlation can be applied in similar diesel engine configurations for the estimation of heat losses during their design stage. In addition, it can be used to predict heat losses from the engine exhaust port of existing diesel engines; therefore, it contributes to the successful turbocharger (T/C) matching and Waste Heat Recovery (WHR) from the exhaust gas.
Based on the results of the present work, a few basic directions are proposed, which could be applied for future investigation of the transport phenomena that occur in the exhaust and intake manifolds of an internal combustion engine:
  • Perform a separation of the exhaust stroke into two different phases, namely the “blowdown” and the “displacement”. Due to the significant differences in the average velocity of the gases and the level of turbulence inside the exhaust port during these two phases, it is expected that eventually there will be two distinct expressions for the Heat Transfer Coefficient. These should then be connected to a common final heat loss evaluation model.
  • Estimate the Heat Transfer Coefficient on the basis of operational variables and geometric parameters of the engine. Such variables are the gas mass flow rate, the curvature of the duct in the valve area, the “active” velocity of the pulsating flow, the pressure inside the cylinder at the point of the Exhaust Valve Opening, etc.
  • The previous estimations could eventually be combined with a Computational Fluid Dynamics (CFD) model to lead to an interconnected model (Conjugate Heat Transfer, CHT), which will allow a more accurate calculation of the heat losses and the thermal exchange between the solid wall and the mass of hot gases inside the exhaust manifold.

Author Contributions

Conceptualization, G.M.; methodology, G.M.; software, G.M.; validation, G.M. and G.S.; formal analysis, G.M.; investigation, G.S.; resources, G.M.; data curation, G.S.; writing—original draft preparation, G.S.; writing—review and editing, G.M.; visualization, G.S.; supervision, G.M.; project administration, G.M.; funding acquisition, G.M. All authors have read and agreed to the published version of the manuscript.

Funding

This research received no external funding.

Data Availability Statement

All data generated or analyzed during this study are included in this published article.

Conflicts of Interest

The authors declare no conflicts of interest.

References

  1. Wendland, D.W. Automobile Exhaust-System Steady-State Heat Transfer. In 1993 Vehicle Thermal Management Systems Conference Proceedings (VTMS1); SAE: Columbus, OH, USA, 1993; SAE Paper 931085. [Google Scholar] [CrossRef]
  2. Malchow, G.L.; Sorenson, S.C.; Buckius, R.O. Heat Transfer in the Straight Section of an Exhaust Port of a Spark Ignition Engine. In Proceedings of the SAE Automotive Engineering Congress and Exposition, Detroit, MI, USA, 26 February–2 March 1979. SAE Paper 790309. [Google Scholar] [CrossRef]
  3. Farrugia, M.; Alkidas, A.C.; Sangeorzan, B.P. Cycle-averaged heat flux measurements in a straight-pipe extension of the exhaust port of a SI engine. SAE Trans. J. Engines 2006, 115, 565–575, SAE Paper 2006-01-1033. [Google Scholar] [CrossRef]
  4. Heller, S.; Wachtmeister, G. Analysis and Modeling of Heat Transfer in the SI Engine Exhaust System During Warm-Up. SAE Trans. J. Engines 2007, 116, 673–686, SAE Paper 2007-01-1092. [Google Scholar] [CrossRef]
  5. Kar, K.; Roberts, S.; Stone, R.; Oldfield, M.; French, B. Instantaneous Exhaust Temperature Measurements Using Thermocouple Compensation Techniques. SAE Trans. J. Fuels Lubr.-V113-4 2004, 113, 652–673, SAE Paper 2004-01-1418. [Google Scholar] [CrossRef]
  6. Depcik, C.; Assanis, D. A Universal Heat Transfer Correlation for Intake and Exhaust Flows in an Spark-Ignition Internal Combustion Engine. SAE Trans. J. Engines 2002, 111, 734–740, SAE Paper 2002-01-0372. [Google Scholar] [CrossRef]
  7. Ranganathan, R.P.; Turner, D.W.; Franchett, M.E. Exhaust Manifold Gas Temperature Predictions using System Level Data Driven Modelling. In Proceedings of the SAE 2005 World Congress & Exhibition, Detroit, MI, USA, 11–14 April 2005. SAE Paper 2005-01-0698, 2005. [Google Scholar] [CrossRef]
  8. Balzan, N.; Sangeorzan, B.P.; Alkidas, A.C. Steady-State Local Heat Flux Measurements in a Straight Pipe Extension of an Exhaust Port of a Spark Ignition Engine. SAE Trans. J. Engines 2007, 116, 1154–1163, SAE Paper 2007-01-3990, 2007. [Google Scholar] [CrossRef]
  9. Haehndel, K.; Frank, T.; Christel, F.; Spengler, C.; Suck, G.; Abanteriba, S. The Development of Exhaust Surface Temperature Models for 3D CFD Vehicle Thermal Management Simulations Part 1-General Exhaust Configurations. SAE Int. J. Passeng. Cars-Mech. Syst. 2013, 6, 847–858. [Google Scholar] [CrossRef]
  10. Zhien, L.; Wang, X.; Yan, Z.; Li, X. Study on the Unsteady Heat Transfer of Engine Exhaust Manifold Based on the Analysis Method of Serial. SAE Int. J. Engines 2014, 7, 1547–1554. [Google Scholar] [CrossRef]
  11. Mavropoulos, G.C.; Rakopoulos, C.D.; Hountalas, D.T. Experimental Assessment of Instantaneous Heat Transfer in the Combustion Chamber and Exhaust Manifold Walls of Air-Cooled Direct Injection Diesel Engine. SAE Int. J. Engines 2008, 1, 888–912. [Google Scholar] [CrossRef]
  12. Mavropoulos, G.C.; Hountalas, D.T. Exhaust Phases in a DI Diesel Engine Based on Instantaneous Cyclic Heat Transfer Experimental Data. In Proceedings of the SAE 2013 World Congress & Exhibition, Detroit, MI, USA, 16–18 April 2013. SAE Paper 2013-01-1646. [Google Scholar] [CrossRef]
  13. Rakopoulos, C.D.; Mavropoulos, G.C.; Hountalas, D.T. Modeling the Structural Thermal Response of an Air-Cooled Diesel Engine under Transient Operation Including a Detailed Thermodynamic Description of Boundary Conditions. In Proceedings of the SAE 1998 International Congress and Exposition, Detroit, MI, USA, 23–26 February 1998. SAE Paper 981024. [Google Scholar] [CrossRef]
Figure 1. Instantaneous wall temperature variation at the internal surface of the exhaust manifold during four consecutive engine cycles. Engine speed: 1500 rpm, engine load: 20%, 40% and 60% (a) and details for its different phases (b) for the 60% load case.
Computation 13 00223 g001
Figure 2. Inlet air and Exhaust gas velocity vs. engine load for three different engine speed values.
Computation 13 00223 g002
Figure 3. Tetrahedral Finite Element mesh as used in the simulation of the thermal field developed in the engine head.
Computation 13 00223 g003
Figure 4. Layout (a), and image (b), of the upper surface of the engine cylinder head instrumented with the piezoelectric pressure transducer and the “long-“ and “short-term” response thermocouples and heat flux sensors at selected locations.
Computation 13 00223 g004
Figure 5. Layout of measurement system used for the cylinder head and exhaust manifold, instantaneous heat flux, and temperature measurements.
Computation 13 00223 g005
Figure 6. A 3D model of the cylinder head with a section on the exhaust manifold, where several characteristic dimensions are approximately presented.
Computation 13 00223 g006
Figure 7. Exhaust gas temperature, local exhaust manifold heat flux, and local Heat Transfer Coefficient variations for 2000 rpm speed and engine load 40%.
Computation 13 00223 g007
Figure 8. Mean values of Heat Transfer Coefficient (a) and Nusselt number (b) inside the exhaust manifold at a distance 100 mm downstream the exhaust valve as a function of engine speed and load.
Computation 13 00223 g008aComputation 13 00223 g008b
Figure 9. Variation in mean logarithmic Nu vs. Re number for the present experimental results and for “conventional” heat transfer correlation results for turbulent flow (a) and the respective variation in Convective Augmentation Factor (b).
Computation 13 00223 g009aComputation 13 00223 g009b
Figure 10. Results of FEA simulation of the engine cylinder head for temperature (a) and heat flux (b) distribution at 2000 rpm speed and 40% engine load, and experimental temperature measurements (c) at the whole engine field of operation.
Computation 13 00223 g010
Disclaimer/Publisher’s Note: The statements, opinions and data contained in all publications are solely those of the individual author(s) and contributor(s) and not of MDPI and/or the editor(s). MDPI and/or the editor(s) disclaim responsibility for any injury to people or property resulting from any ideas, methods, instructions or products referred to in the content.