Abstract
Aiming at the problems of high labor cost, low detection efficiency, and insufficient detection accuracy of traditional pipe gallery disease detection methods, this paper proposes a pipe gallery disease segmentation model, PipeU-NetX, based on deep learning technology. By introducing the innovative down-sampling module MD-U, up-sampling module SC-U, and feature fusion module FFM, the model optimizes the feature extraction and fusion process, reduces the loss of feature information, and realizes the accurate segmentation of the pipe gallery disease image. In comparison with U-Net, FCN, and Deeplabv3+ models, PipeU-NetX achieved the best PA, MPA, FWIoU, and MIoU, which were 99.15%, 92.66%, 98.34%, and 87.63%, respectively. Compared with the benchmark model U-Net, the MIoU and MPA of the PipeU-NetX model increased by 4.64% and 3.92%, respectively, and the number of parameters decreased by 23.71%. The detection speed increased by 22.1%. The PipeU-NetX model proposed in this paper shows the powerful ability of multi-scale feature extraction and defect area adaptive recognition and provides an effective solution for the intelligent monitoring of the pipe gallery environment and accurate disease segmentation.
1. Introduction
As an integrated infrastructure, the comprehensive pipe gallery integrates the pipeline systems of water supply, power supply, gas, heat, and other fields, showing significant advantages in the efficient use of space, centralized management, convenient maintenance, and safety guarantee [1]. Many cities are actively promoting the large-scale construction of comprehensive pipe galleries and strive to build a more advanced and coordinated urban underground pipe gallery network system. However, under the influence of various external factors, the comprehensive pipe gallery system will produce disease risks, such as uneven settlement, structural cracks, structural leakage, box torsion, concrete damage, and bottom plate cracking, causing heavy casualties and economic losses [2]. The traditional pipe gallery inspection method is highly dependent on manual work, which is not only inefficient but also makes it difficult to ensure the safety of inspection workers.
Currently, non-contact inspection technology for pipe gallery is used to improve the safety of inspection work. The visual inspection technology proposed by Wang et al. [3] uses remote video to inspect pipe corridors, which significantly improves the safety of inspection. However, this technology still relies on manual vision and faces the challenges of low detection efficiency and insufficient accuracy in practical applications. Duran et al. [4] proposed ray laser detection, which detects cracks on the surface, near the surface, and inside the pipe corridor by emitting and receiving strong physical media. However, this method poses a certain challenge to the safety of chemical industrial parks, and the corresponding detection equipment is usually more complex and expensive. Wu et al. [5] proposed structural detection technology, which can identify whether the structure is abnormal by analyzing the signals collected by pre-set sensors, but it is still unsatisfactory in detecting internal cracks and identifying the precise location of cracks.
With the rapid development of deep learning technology, the feasibility of pipe gallery defect anomaly detection based on vision is greatly improved. The combination of data-trained convolutional neural network models and image data enhancement technology can realize automatic defect detection, which can not only solve the problem of the high labor intensity of manual detection but also greatly improve the speed and accuracy of detection.
Shang L et al. [6] proposed a two-step method to detect rail defects. First, the rail image was cropped through traditional image processing and then input into CNN for feature extraction and classification, which improved the detection accuracy of rail defects. Cheng et al. [7] designed a detection technology based on a fully convolutional neural network (FCNN), which can realize real-time detection and recognition of the workpiece surface. Moreover, compared with manual detection, the recognition speed was significantly improved by 5 times. Baris et al. [8] used a sequential convolutional neural network with fully connected layers to extract and derive image features to achieve high-precision detection tasks. GU et al. [9] established a detection and recognition model for surface defects of cold-rolled steel plates based on the target detection algorithm Faster RCNN. For different cold-rolled galvanized defects, the detection accuracy reached 93%.
Faced with the complex environment of pipe galleries, accurately identifying and locating various diseases have become key challenges in maintaining their safe operation. Existing non-contact inspection technologies and video surveillance methods for pipe corridors face difficulty in meeting the dual requirements of real-time and accuracy [10,11]. To address this problem, we proposed a pipe corridor disease segmentation network, PipeU-NetX, based on deep learning technology. The network is based on the U-Net model, improves the model feature extraction mechanism, and introduces a jump connection enhancement mechanism to reduce the loss of feature information during the sampling process, effectively improving the segmentation accuracy of pipe gallery diseases while reducing the computational complexity of large-scale pipe gallery disease segmentation. Compared with the benchmark model U-Net, the PipeU-NetX model achieved an increase of 4.64% in the Miou index and 3.92% in the MPA index. At the same time, the number of model parameters was reduced by 23.71%, and the detection speed was accelerated by 22.1%. The main contributions of this paper are as follows:
- (1)
- In the pipe gallery diseases segmentation network PipeU-NetX, the sampling mechanism was optimized, and a sampling module combining the pooling layer and the convolution layer was constructed. An improved MD-U down-sampling module and SC-U up-sampling module were proposed to enhance the feature extraction capability of the neural network and improve the feature fidelity in the sampling process.
- (2)
- In the PipeU-NetX network model, dynamic convolution was used instead of standard convolution. Dynamic convolution adapts to different input characteristics by adjusting the weight of the convolution kernel, which can enhance the adaptability of the model to dynamic changes (such as lighting changes and internal activities of the pipe gallery) in the pipe gallery monitoring scene and reduce the calculation cost of the model.
- (3)
- In order to balance the requirements of lightweight design and high recognition performance, the FFM feature fusion module was introduced to improve the jump connection part of the model, which reduced the difference between the high-level and low-level feature maps in the training process and solved the semantic fault caused by the jump connection part of the traditional model.
2. Proposed Model
The overall framework of PipeU-NetX for the pipe gallery disease detection network is shown in Figure 1. The MD-U down-sampling module was designed in the model, which combined the maxpooling layer with the convolution layer to effectively realize the spatial dimension reduction and information aggregation of features. At the same time, the SC-U up-sampling module was designed. By combining the up-sampling layer and convolution layer, the fine recovery and detail enhancement of the feature map were realized. The dynamic convolution technology was introduced into the subsampling module SC-U, which not only enhanced the feature extraction ability of the network model but also significantly reduced the computational cost. The embedding of the convolution layer effectively made up for the loss of feature information that may be caused by the lack of trainability of the traditional maxpooling layer and up-sampling layer so as to improve the feature fidelity in the sampling process and significantly improve the segmentation accuracy of pipe gallery diseases [12,13]. Finally, the hopping connection part of the decoder was improved, the hopping connection enhancement mechanism was adopted, and the FFM feature fusion module was introduced to enhance the attention of the model to the characteristics of pipe gallery disease in different feature maps, optimize the efficiency and accuracy of feature fusion, and improve the accuracy and efficiency of the reconstructed image of the decoder.
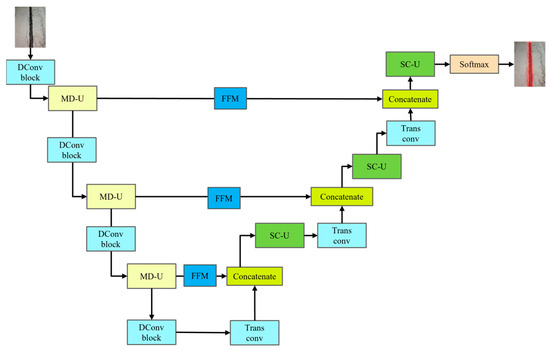
Figure 1.
Overall model structure of PipeU-NetX.
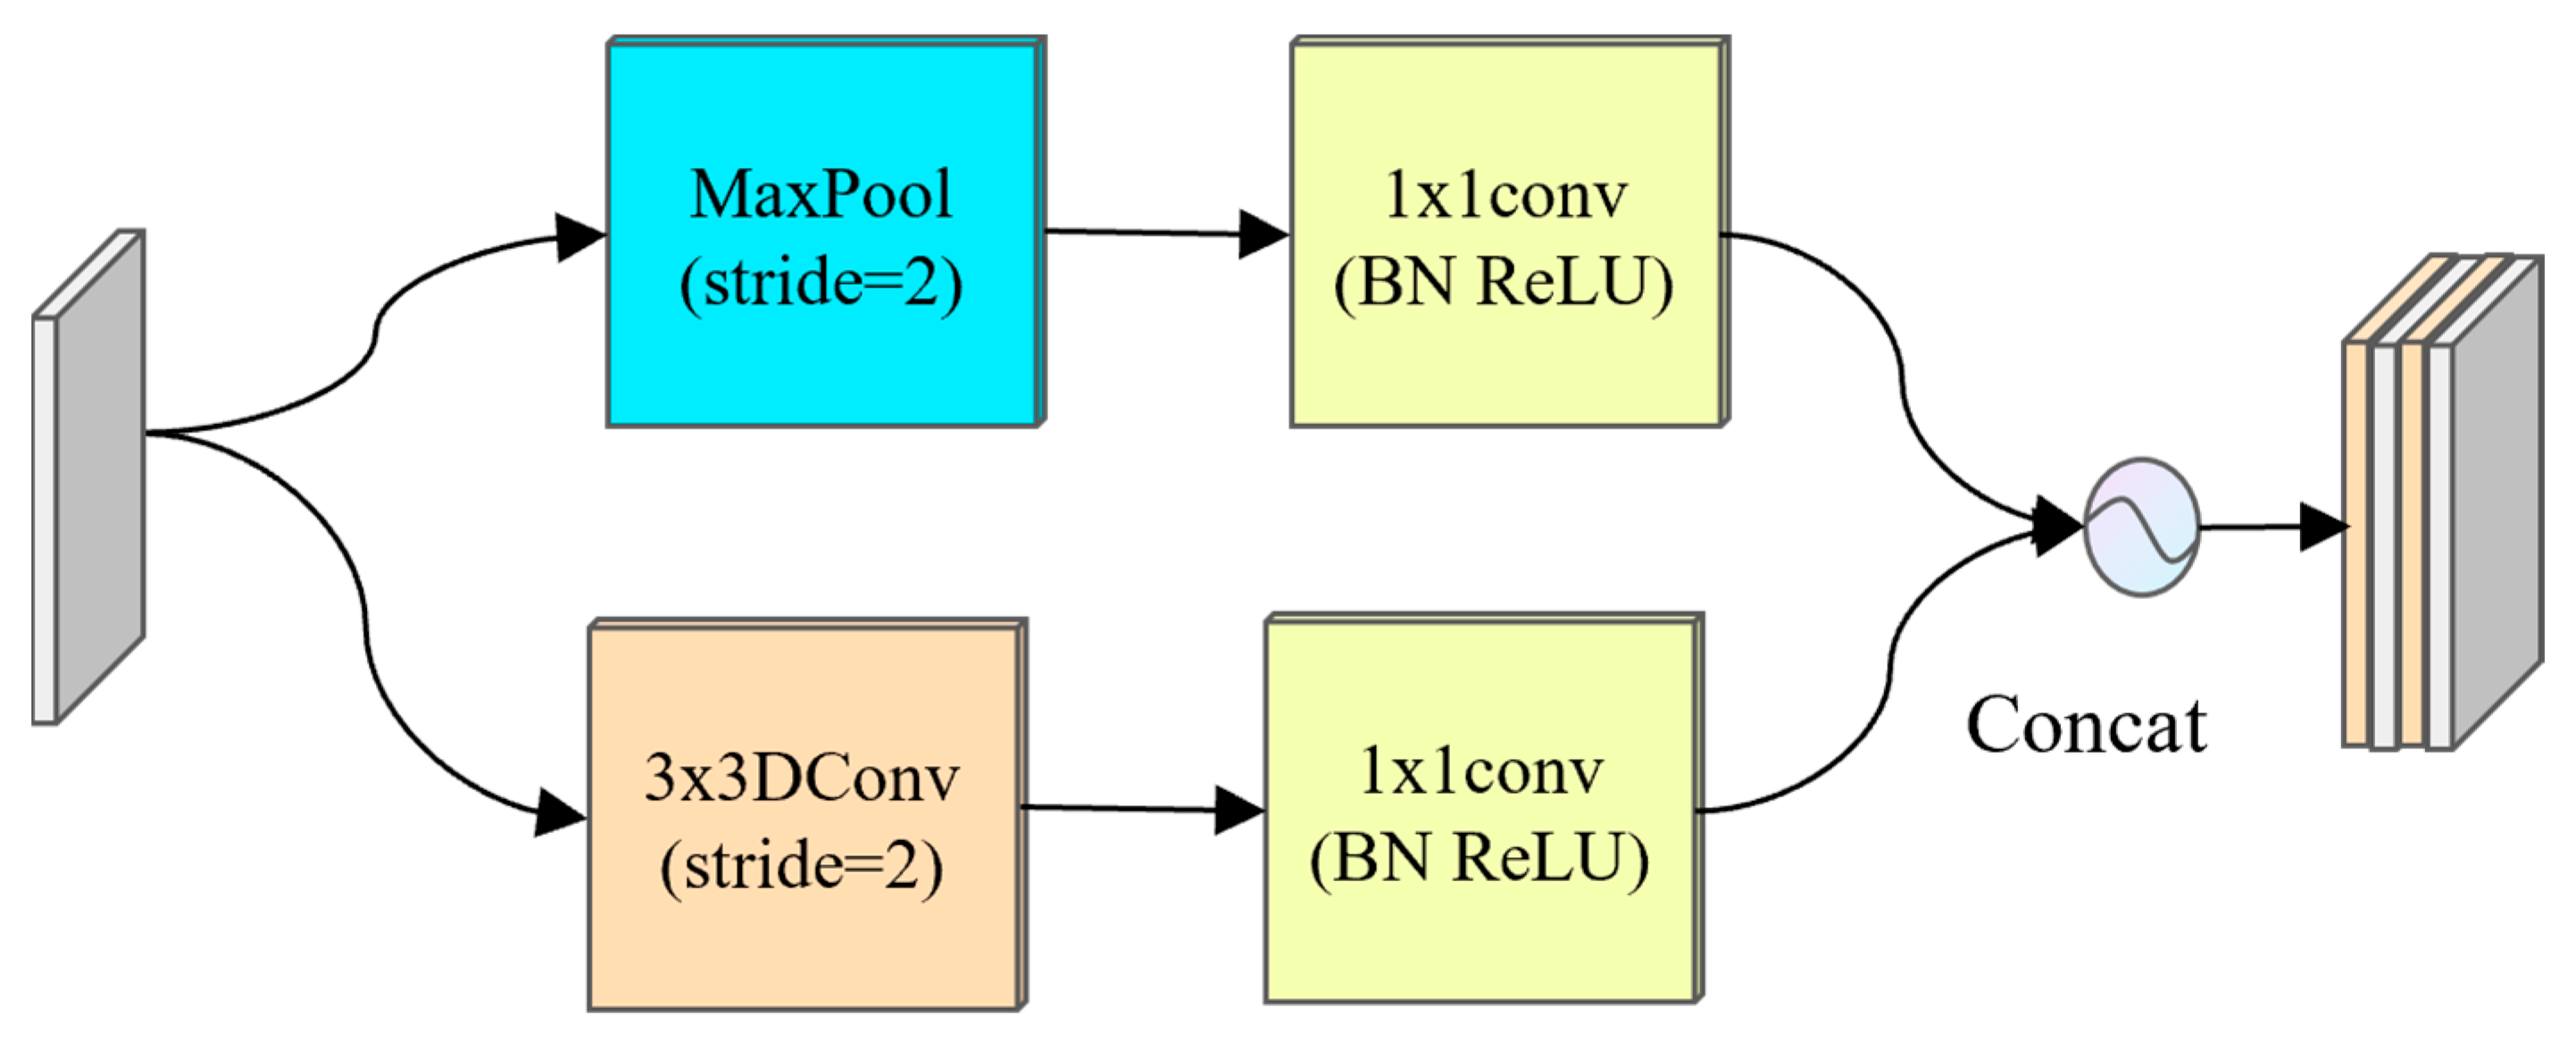
2.1. MD-U Down-Sampling Module
The down-sampling mechanism of the traditional U-Net network depends on the maxpooling operation [14]. Although this process can effectively reduce the size of the feature map, it will inevitably lose rich semantic information and affect the accurate segmentation of micro-pipe gallery diseases [15]. According to the characteristics of different shapes and areas of disease in the pipe gallery disease image, the PipeU-NetX model innovatively designed the MD-U down-sampling module, which combined the advantages of maxpooling and dynamic convolution so that the down-sampling process could be learned. As shown in Figure 2, the input characteristic graph first passed through the maxpooling layer and the dynamic convolution layer in parallel. The latter effectively reduced the training complexity by reducing the model parameters and helped to prevent the model from overfitting. Then, 1 × 1 convolution was applied to the feature map after the pooling and convolution operation to realize the integration and interaction of cross-channel information. At the same time, nonlinear transformation was introduced to enhance the ability of feature expression. Finally, the processed feature map was spliced along the channel dimension and passed to the subsequent convolution layer to realize the deep fusion of information and improve the overall representation ability of the network. The whole down-sampling process can be expressed by the following formula:
where and respectively represent output characteristics and input characteristics, MP represents the maxpooling operation, DC represents the dynamic convolution, represents the convolution operation with a convolution kernel of 1 × 1, represents the ReLU activation function, and “” represents channel splicing.
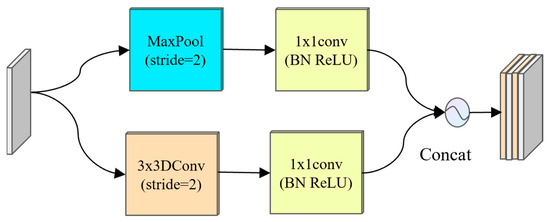
Figure 2.
MD-U lower sampling module. BN: batch normalization.
The dynamic convolution DConv in the MD-U module is shown in Figure 3. Dconv dynamically generated convolution kernel weights and biased attention coefficients closely related to input features by integrating global average pooling, the full connection layer, and the Softmax activation function [16]. This process not only realized the intelligent aggregation of multiple convolution kernels but also skillfully introduced the attention mechanism, which significantly enhanced the feature representation ability and learning efficiency of the model without increasing the depth and width of the network. Finally, these finely adjusted convolution kernels were applied to the input features, which promoted more efficient and richer nonlinear feature learning and further improved the overall performance of the model. The overall model of dynamic convolution is shown as follows:
where , , and are the weight, bias, and activation functions, respectively.
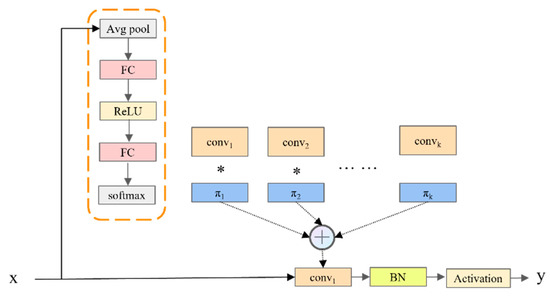
Figure 3.
Structure diagram of the DConv convolution module. BN: batch normalization; FC: fully connected layer.
In the DConv module, the weight selection mechanism was the core element, which directly determined the adaptability of the model to the input features and the quality of the feature representation ability. Instead of the fixed weight coefficient strategy used in traditional convolution, we dynamically generated the weight and deviation of the convolution kernel by weighted sum. In this process, the global average pooling operation was used to capture the global information of the input characteristics, and the nonlinear transformation was carried out through the full connection layer. Finally, the Softmax activation function was used to convert these transformation results into weight coefficients. This design enabled the weight coefficient to be adjusted adaptively according to the changes in the input data, thus significantly enhancing the feature expression ability of the model. The specific calculation is shown in Formulas (3) and (4):
In order to ensure the effectiveness of the above coefficients, we also introduced Formula (5) for constraint:
2.2. SC-U Up-Sampling Module
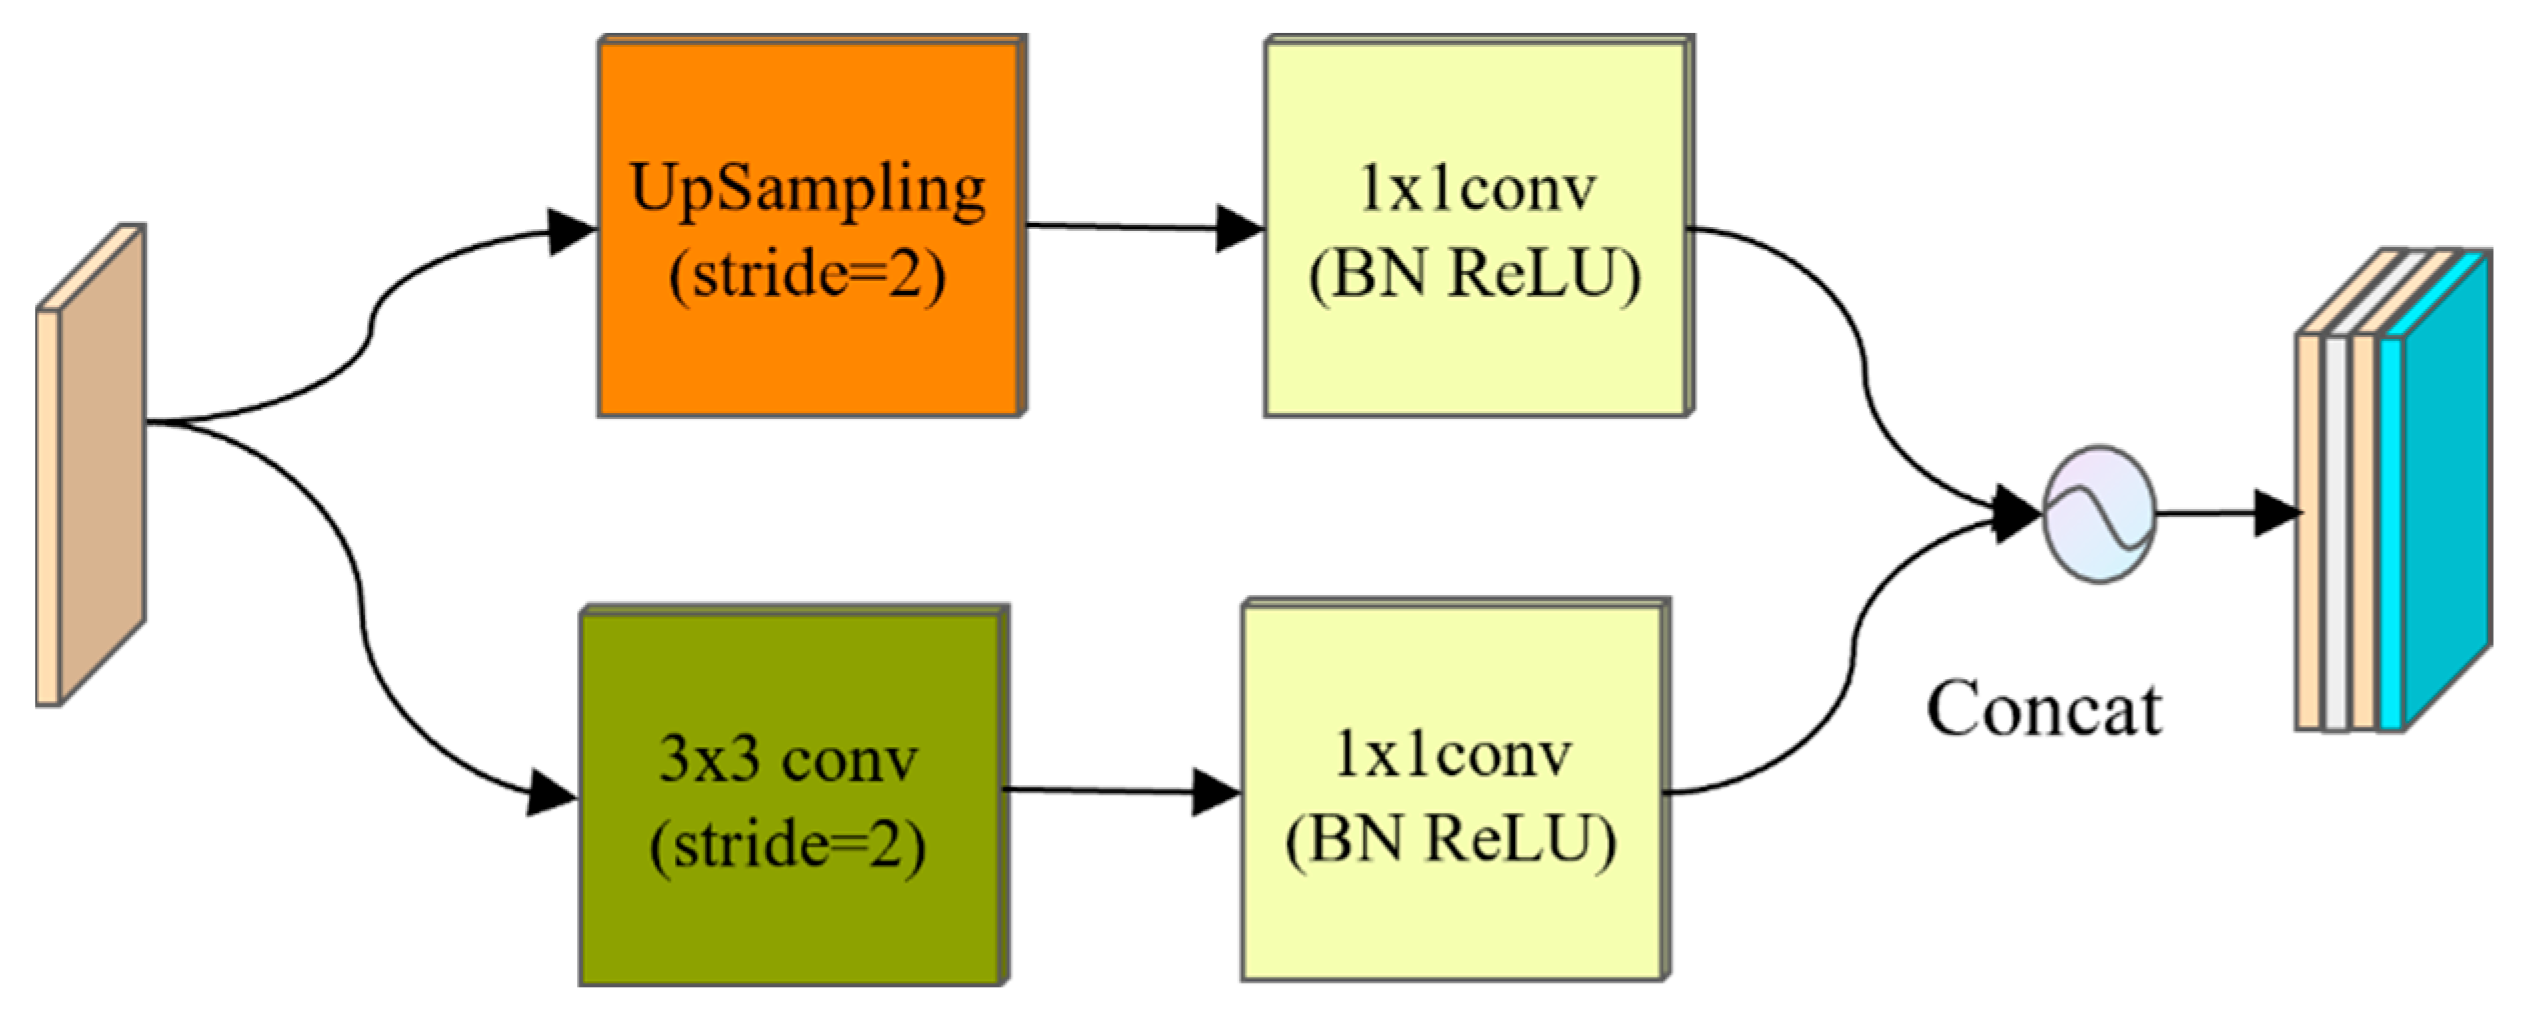
In the PipeU-NetX network, in order to further improve the performance of the network in the image segmentation task, the SC-U up-sampling module was designed, as shown in Figure 4. Compared with the traditional up-sampling method, the SC-U up-sampling module can more effectively restore image details and enhance the ability of feature expression by combining the recovery of spatial resolution and the integration of channel information. Specifically, the up-sampling layer, as the reverse process of the pooling operation, initially improved the spatial resolution of the feature image and helped to gradually restore the spatial details of the image [17]. The following transposed convolution layer not only further increased the spatial size of the feature map but also captured more complex spatial patterns through the nonlinear transformation of the feature map, effectively integrated the information between channels, and generated richer and more expressive features.
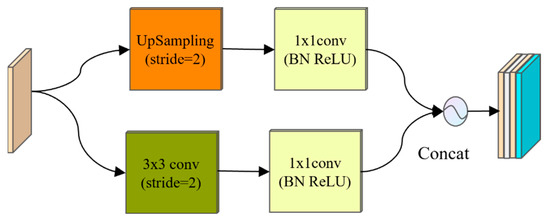
Figure 4.
Structure diagram of the SC-U up-sampling module. BN: batch normalization.
In addition, two independent 1 × 1 convolution operations were introduced into the SC-U up-sampling module to process the output of the up-sampling and transposing convolution, respectively. Without changing the spatial resolution of the feature map, the dimension of the feature was reduced, and the number of channels was adjusted, reducing the amount of calculation and avoiding overfitting. The two feature maps were then spliced along the channel dimension, realizing the fusion of spatial information and channel information and enhancing the diversity of the features. This design promoted the effective flow and fusion of information between the encoder and decoder and enabled the decoder to make full use of the multi-scale features extracted by the encoder to better restore the details and edge information in the image. Therefore, the SC-U up-sampling module not only enhanced the ability of the network to recover image details but also improved the ability of feature expression and the generalization ability of the model on unprecedented test data.
The up-sampling process on SC-U is as follows:
where and represent output characteristics and input characteristics, respectively; indicates the up-sampling operation; and indicates the transposed convolution.
The specific calculation process of is as follows:
2.3. Feature Fusion Module FFM
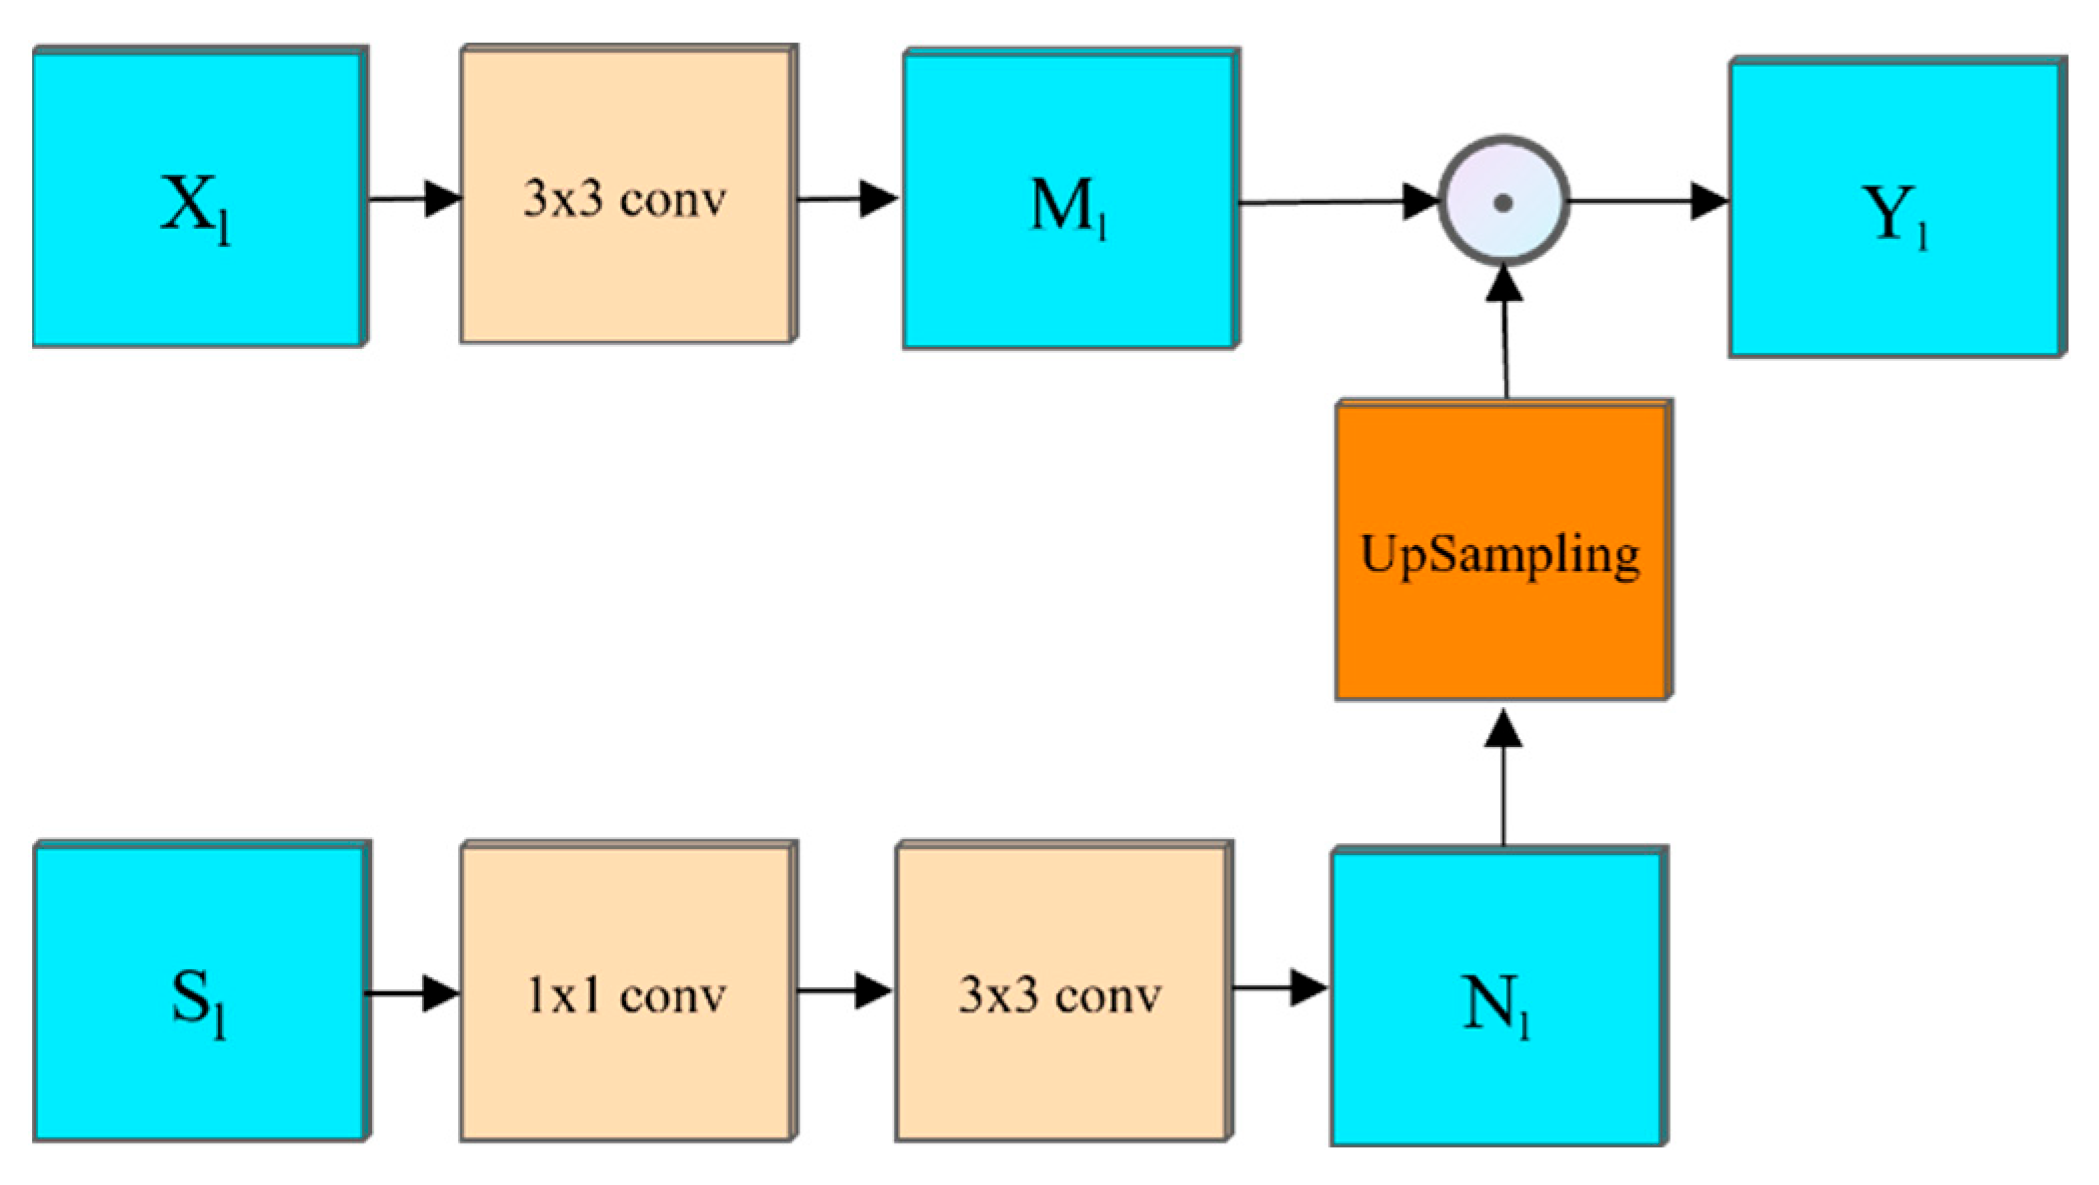
In order to supplement the local details lost in the process of contraction, the PipeU-NetX model adopted the jump connection enhancement mechanism. This mechanism introduced the feature fusion module FFM into the traditional jump connection mechanism, which avoided the blocking of information flow and semantic fault caused by the traditional jump connection mechanism simply splicing tensors together [18,19]. Through the FFM module, the high-level features were injected into the low-level tensors so that the low-level tensors can contain more high-level semantic information, thus reducing the difference between the high-level and low-level feature maps. FFM was composed of fusion module FM and up-sampling module UM.
The FM module was used to integrate high-level semantics into low-level features to strengthen global dependency [20,21]. As shown in Figure 5, the module was divided into two channels for operation for the upper branch, and XL was input into a 3 × 3 convolution for feature extraction to obtain a low-dimensional tensor. Its formula is:
where represents the convolution operation, is the input characteristic graph, and is the convolution kernel size.

Figure 5.
FM module structure.
For the lower branch input , it passed through a 1 × 1 convolution and a 3 × 3 convolution in turn. These two convolutions played the roles of dimensionality reduction and global information extraction to obtain the high-latitude characteristic tensor. Its formula is:
The above two results were fused, and the branch result was removed for bilinear interpolation up-sampling, which was multiplied by the upper result , pixel by pixel, to obtain the output characteristic image. Its formula is:
where is point multiplication. is the feature tensor containing more semantic information, which replaced the original feature graph as the final output of the coding end of this layer.
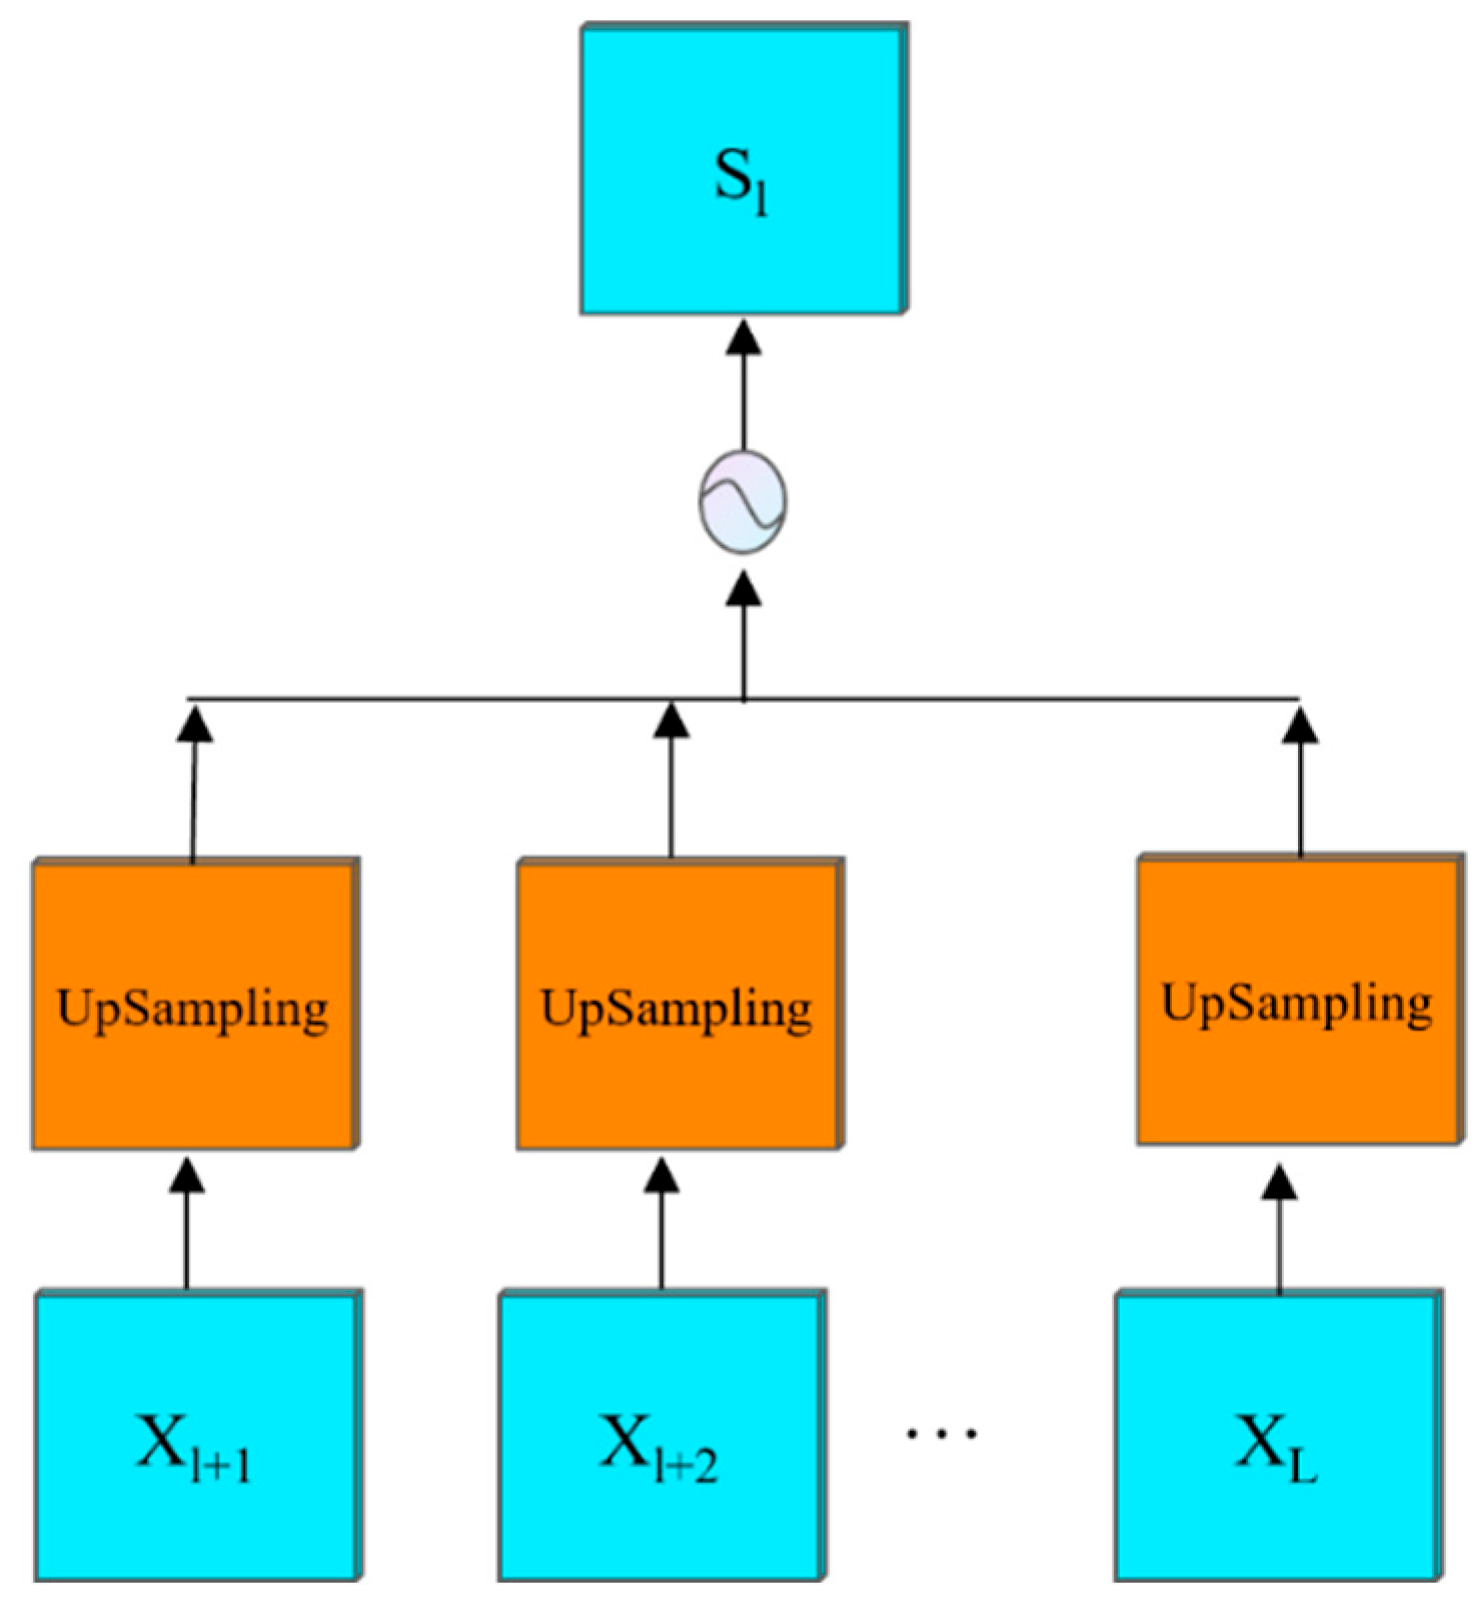
The UM module was used to aggregate high-level semantic information, as shown in Figure 6. For the first layer feature map, the l + 1-~Llevel feature map was sampled and spliced in the channel dimension to obtain the intermediate semantic information. Its formula is:
where represents the up-sampling operation of bilinear interpolation, and is the tensor splicing.

Figure 6.
UM module structure.
3. Experiments and Discussion
In this section, the performance of the proposed model was evaluated by comparison and ablation experiments. The experiment used a 768 × 768-pixel image as the network input, and the backbone network used the pre-training results on the ImageNet dataset as the initialization weight. The maximum number of iterations of training was 300, the batch size was set to 4, and the initial learning rate was set to 0.0001. The training process used the cosine annealing strategy to update the learning rate, and the preheating stage was 3 epochs. The optimizer selected the Adam algorithm, set the weight attenuation of other parameters, except bias, to 10-6, and used the pixel level cross-entropy loss function as the loss function. In all experiments, the early stop strategy was used to prevent overfitting, and the training was stopped when the loss function did not decline for 15 consecutive epochs [22,23,24].
This experiment was implemented on a workstation with Intel (R) core i9-10900k CPU and two NVIDIA 3090 24G GPU graphics cards. The operating system of the workstation was Ubuntu 18.04, the CUDA version was 11.4, Pytorch 1.8.0 was used as the deep learning framework, and python 3.9.5 was the programming language. The specific configuration parameters are shown in Table 1 below.

Table 1.
Experimental platform parameter settings.
3.1. Construction of Experimental Samples
In order to improve the performance of the pipe gallery disease segmentation model, this study first collected an initial dataset containing 1000 pipe gallery disease images. However, considering that the deep learning model usually needs a large amount of training data to optimize its performance, especially in the face of a complex pipe gallery environment, the richness and diversity of data are crucial to the learning accuracy and generalization ability of the model [25,26].
Therefore, in order to improve the adaptability and generalization ability of the model to the internal environment of the pipe gallery, we adopted the following data enhancement methods:
- (1)
- Image flipping: In order to simulate the robot inspection route in different directions inside the pipe gallery, the image was randomly flipped horizontally. This operation not only increased the diversity of datasets but also helped the model learn the characteristics of the gallery pipe disease from different perspectives.
- (2)
- Brightness adjustment: Since the lighting conditions inside the pipe gallery may change due to various factors, this change was simulated by adjusting the brightness of the image. This data enhancement of brightness change can enhance the adaptability of the model to different lighting conditions and make it more robust in practical applications.
- (3)
- Contrast enhancement: Due to the difference in contrast, the severity of tunnel diseases may vary. In order to simulate this difference, the image was histogram-equalized, and the image contrast was finely adjusted. At the significance level (p < 0.05), by controlling the histogram equalization parameters and the contrast adjustment amplitude, simulated images with different contrast characteristics were generated so that the model could more accurately learn the mapping relationship between the severity of the disease and the image features, thereby improving the recognition accuracy.
- (4)
- Add noise: By adding noise to the image, interference factors in the real world can be simulated. It can smooth the data, reduce the influence of outliers or outliers on model training, and improve the robustness of the model.
The specific enhancement effect and dataset changes are shown in Figure 7. After data enhancement, the enhanced gallery pipe disease dataset was divided into the training dataset and the validation dataset according to a ratio of 8:2. The training dataset was used to train the model, while the validation dataset was used to evaluate the performance of the model for parameter adjustment and model optimization in the training process.
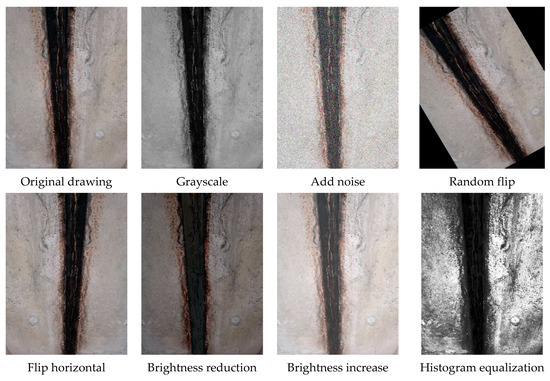
Figure 7.
Enhanced comparison of pipe gallery disease data.
3.2. Segmentation Ablation Experiment of Pipe Gallery Disease Area
In order to illustrate the performance of the proposed model PipeU-NetX and quantify the segmentation results, pixel accuracy (PA), mean pixel accuracy (MPA), mean intersection over Union (MIoU), and frequency weighted intersection over Union (FWIoU), commonly used in semantic segmentation, were selected as evaluation indexes [27].
MIoU is the ratio of the intersection and union of the predicted value and the real value, and the result averages all types to evaluate and measure the segmentation accuracy as the main performance index. The calculation formula is:
FWIoU represents the frequency of occurrence of each type, and the weighted sum of IOU values of each type is calculated as:
PA represents the proportion of correctly labeled pixels in the total pixels. The calculation formula is:
MPA is the result of averaging the ratio of the number of pixels with correct classification in each category to the number of pixels of that category. The calculation formula is:
In the above formula, k represents the number of types of defects, and the specific meanings of , , , and are shown in Table 2:
Table 2.
Confusion matrix.
In the ablation experiment, the effectiveness of different improved modules was studied, and six groups of experiments were designed for comparison. The results are shown in Table 3. In the first group, the model did not use the improved module for training, which was the control group. The group 2, group 3, and group 4 experiments verified the effectiveness of the proposed MD-U down-sampling module, SC-U up-sampling module, and FFM feature fusion module, respectively. When the MD-U down-sampling module was enabled alone, MPA increased by 1.32%, and Miou increased by 1.21%. When the SC-U up-sampling module was enabled alone, MPA increases by 2.27%, and MIoU increases by 1.61%. After the MD-U down-sampling module and SC-U up-sampling module were enabled at the same time, the multiple performances of the model were significantly improved. The average pixel accuracy MPA was improved by 3.93%, and the average intersection and combination was improved by 4.50%, compared with MIoU. The results showed that the optimized encoder (MD-U module) and decoder (SC-U module) can not only effectively retain and extract more abundant image features but also significantly enhance the ability of the model to understand and use the complex context information of the pipe gallery environment, thus showing a better performance in the pipe gallery disease region segmentation task. Based on the MD-U down-sampling module and SC-U up-sampling module, the FFM module was further introduced, and the performance of the model was significantly improved again. MIoU increased by 4.64%, and MPA increased by 3.92%. This result fully demonstrates the effectiveness of the FFM feature fusion module in optimizing jump connection and enhancing the efficiency and accuracy of feature fusion, which makes the model more accurately identify and segment the disease area in the pipe gallery disease image segmentation task, improving the integrity and robustness of the system.
Table 3.
Comparison of ablation experiment segmentation indexes under different module combinations.
The thermal distribution map of pipe gallery disease training is shown in Figure 8. The more concentrated the red area in the thermal map, the greater the weight information of the model there. After the MD-U, SC-U, and FFM modules were enabled, the model could more completely locate the weight information of the pipe gallery disease end face and realize the efficient and accurate positioning of the disease area. Secondly, only MD-U and SC-U modules were enabled, and the weight information of the pipe gallery disease end face was divergent. The ability of the model in focusing and accurately locating the disease characteristics was insufficient. The model without any module could not be well positioned to the end face of the pipe gallery, which was prone to the false and missed detection of the model, affecting the overall detection accuracy.
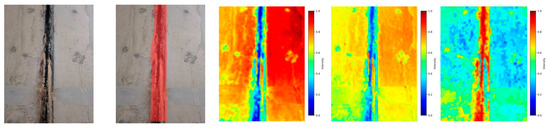
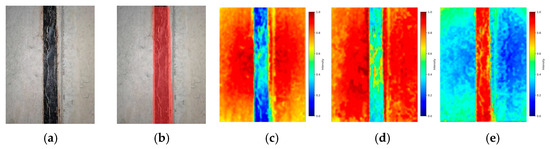
Figure 8.
Thermal diagram of the different, improved modules. (a) Original drawing; (b) mask image; (c) none; (d) MD-U + SC-U; (e) MD-U + SC-U + FFM.
3.3. Comparative Experiment of Pipe Gallery Disease Region Segmentation
In order to further verify the effectiveness and robustness of the proposed improved model, comparative experiments were carried out on the proposed PipeU-NetX model. The comparison models were U-Net, FCN, and Deeplabv3+. Firstly, the image format was transformed, and the binary label was input into the segmentation network as the training target. Through five subsampling operations, the spatial resolution of the image gradually decreased, while the number of feature channels increased exponentially. In this process, the network feature map gradually deepened from the initial shallow features, such as contour and shape, to more refined features, such as texture and disease location. PA, MPA, FWIoU, and MIoU were used as accuracy indexes in the experiment, and the model parameters and detection speed were used as the measurement basis of detection efficiency. The results are shown in Table 4. The results showed that the proposed method achieved the optimal results on PA, MPA, FWIoU, and MIoU, which were 99.15%, 92.66%, 98.34%, and 87.63%, respectively. Among them, PA and MPA were more than 90%, indicating that most pixels can be correctly segmented. In terms of detection efficiency, FCN had the best performance among all methods, although its model parameters and detection speed were 19.12 MB and 32.35 FPS, respectively, but due to its rough up-sampling structure, the segmentation accuracy was lower than other methods. Compared with the benchmark method U-Net, the parameters of this method were reduced by 23.71%, the detection speed FPS was increased by 22.18%, and the MIoU was increased by 4.64 percentage points, which shows that this method can significantly improve the problems of sampling imprecision and semantic gap on U-Net, improve the detection efficiency, and reduce the calculation cost. Compared with the Deeplbav3+ model, the MPA and MIoU of the proposed method increased by 3.09% and 3.67%, respectively. It was proved that the multi-scale feature extraction and defect region adaptive recognition ability of this method was superior to the comparison method in the task of pipe gallery disease detection and segmentation.
Table 4.
Comparative experimental results of different models.
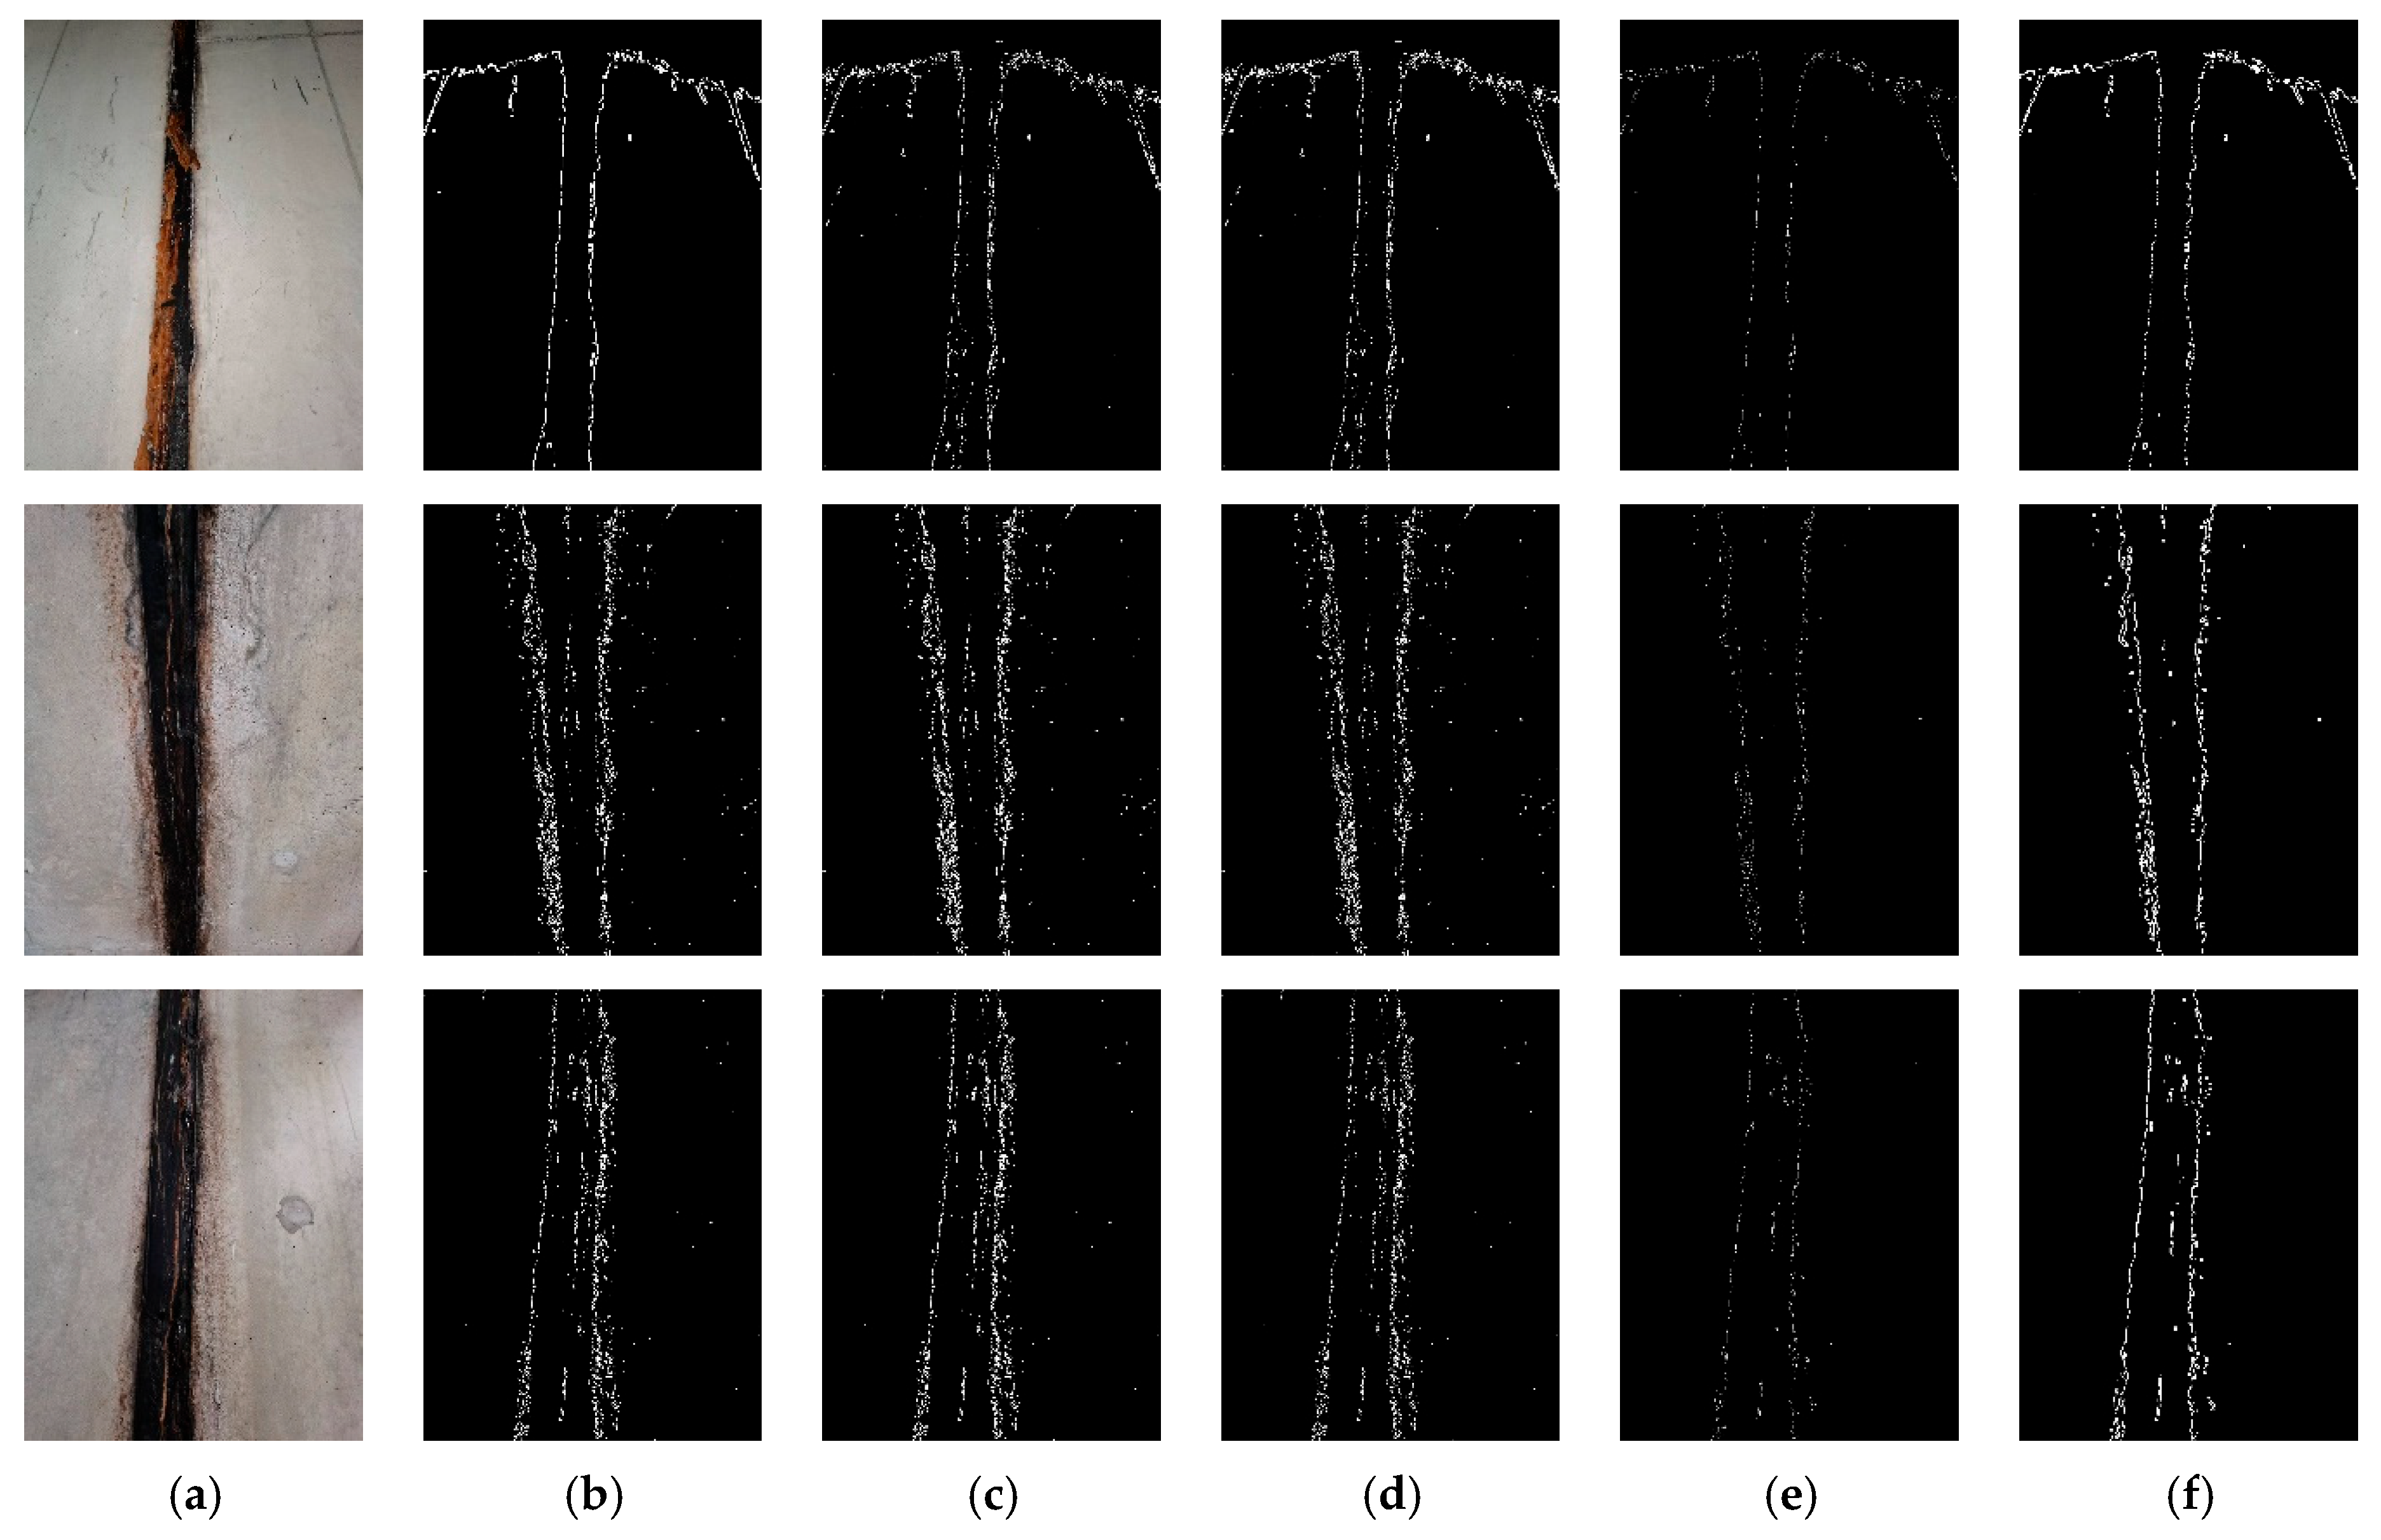
The specific segmentation performance of the model in the comparative experiment is shown in Figure 9. The traditional U-Net model had a lot of noise in the segmentation of pipeline defect images, which affected the clarity and accuracy of the segmentation results. Although the FCN model improved its feature fusion ability through structural enhancement, it still appeared blurry when dealing with complex disease edges, resulting in rough segmentation results and failing to fully capture the fine features of the disease. The Deeplabv3+ model had insufficient feature extraction ability when dealing with highly detailed pipe gallery defects, specifically manifested as unnecessary smoothing of some detail information, which affected the continuity of lines and the accuracy of segmentation. In contrast, PipeU-NetX could more accurately outline the boundaries of crack defects, effectively reducing false positives and false negatives, and had higher segmentation integrity.

Figure 9.
Comparison of the segmentation of pipe gallery disease areas: (a) original drawing; (b) mask image; (c) U-Net; (d) FCN; (e) Deeplabv3+; (f) PipeU-NetX.
Through comparative experiments, the improved model PipeU-NetX proposed in this paper not only improved MPA and MIoU indicators but also significantly reduced the number of model parameters and improved the detection speed. The results show that the improved model can realize the effective interaction between the important characteristic information of the local disease and the global disease information of the pipe gallery so as to realize the efficient and accurate segmentation of the pipe gallery disease.
4. Conclusions
This study proposed a deep learning model, PipeU-NetX, that can achieve high-precision segmentation of pipe gallery diseases. The network designed the MD-U down-sampling module and the SC-U up-sampling module, which combined the pooling layer and convolution layer to effectively reduce the loss of feature information and improve the fidelity of features. At the same time, the dynamic convolution DConv was introduced to enable the model to dynamically adjust the convolution kernel weight according to the input characteristics, which enhanced the adaptability of the model to the dynamic changes in the pipe gallery monitoring scene. The FFM feature fusion module solved the semantic fault problem in the traditional model by optimizing the jump connection part and improved the overall performance of the model.
In the ablation experiments of different improved modules, the improved model PipeU-NetX, based on the U-Net network framework, achieved an average intersection and union improvement of 4.64% and an average pixel accuracy MPA improvement of 3.92%, compared with MIoU. Experiments showed that PipeU-NetX can significantly enhance the efficiency of feature fusion and realize more accurate identification and segmentation of disease areas in the pipe gallery disease image segmentation task. In the comparison experiment with other segmentation models, the proposed method achieved the best performance in PA, MPA, FWIoU, and MIoU, which were 99.15%, 92.66%, 98.34%, and 87.63%, respectively. This result proves that the PipeU-NetX model has a strong multi-scale feature extraction ability and defect region adaptive recognition ability in the task of pipe gallery disease detection and segmentation and can realize the effective interaction between the important feature information of local disease and the global disease information of the pipe gallery so as to ensure the accurate segmentation of pipe gallery disease.
Author Contributions
Conceptualization, W.S.; methodology, W.S.; software, W.S.; validation, W.S.; formal analysis, W.S.; investigation, H.W.; resources, C.P.; data curation, C.P.; writing—original draft preparation, W.S.; writing—review and editing, H.W.; visualization, W.S.; supervision, W.S.; project administration, W.S.; funding acquisition, W.S. All authors have read and agreed to the published version of the manuscript.
Funding
This research received no funding.
Data Availability Statement
The data presented in this study are available upon request from the corresponding author.
Conflicts of Interest
The authors declare no conflicts of interest. The founding sponsors had no role in the design of the study; in the collection, analyses, or interpretation of data; in the writing of the manuscript; or in the decision to publish the results.
References
- Liu, X.; Xu, Z.D.; Sun, B.; Liu, X.; Xu, D. Spatiotemporal state assessment for the underground pipe gallery: Physical model and experimental verification. Tunn. Undergr. Space Technol. 2023, 143, 105474. [Google Scholar] [CrossRef]
- Sun, B.; Hu, Z.; Guo, T. A multi-GA-BPNN fusion algorithm and full-scale experimental verification for fire warning in the underground pipe gallery. Fire Saf. J. 2024, 144, 104103. [Google Scholar] [CrossRef]
- Wang, M.; Kumar, S.S.; Cheng, J.C. Automated sewer pipe defect tracking in CCTV videos based on defect detection and metric learning. Autom Constr, Autom. Constr. 2021, 121, 103438. [Google Scholar] [CrossRef]
- Duran, O.; Althoefer, K.; Seneviratne, L.D. Experiments using a laser-based transducer and automated analysis techniques for pipe inspection. In Proceedings of the 2003 IEEE International Conference on Robotics and Automation (Cat. No. 03CH37422), Taipei, Taiwan, 14–19 September 2003; Volume 2, pp. 2561–2566. [Google Scholar]
- Zhishen, W.U.; Zhang, J. Advanced technology and theory of structural health monitoring. Sci. Press 2015, 1–404. [Google Scholar]
- Shang, L.; Yang, Q.; Wang, J. Detection of rail surfacedefects based on CNN image recognition and classification. Inst. Electr. Electron. Eng. 2018, 45–51. [Google Scholar]
- Chen, Q. Research on workpiece surface detection based on full convolution neural network. Intern. Combust. Engines Accessories 2019, 16, 197–199. [Google Scholar]
- Kayalibay, B.; Jensen, G. CNN-based Segmentation of Medical Imaging Data. arXiv 2017, arXiv:1701.03056. [Google Scholar] [CrossRef]
- Jiachen, G.; Gao, L. Application of object detection algorithm based on deep learning in cold rolling surface defect detection Application. Metall. Autom. 2019, 43, 1922. [Google Scholar]
- Zunair, H.; Hamza, A.B. Sharp U-Net: Depthwise convolutional network for biomedical image segmentation. Comput. Biol. Med. 2021, 136, 104699. [Google Scholar] [CrossRef]
- Li, C.; Lan, H.-Q.; Sun, Y.-N.; Wang, J.-Q. Detection algorithm of defects on polyethylene gas pipe using image recognition. Int. J. Press. Vessel. Pip. 2021, 191, 104381. [Google Scholar] [CrossRef]
- Flores, E.; Zortea, M.; Scharcanski, J. Dictionaries of deep features for land-use scene classification of very high spatial resolution images. Pattern Recognit. 2019, 89, 32–44. [Google Scholar] [CrossRef]
- Qian, H.; Li, Y.; Yang, J.; Xie, L.; Tan, K.H. Image-based microstructure classification of mortar and paste using convolutional neural networks and transfer learning. Cem. Concr. Compos. 2022, 129, 104496. [Google Scholar] [CrossRef]
- Liu, F.; Wang, L. UNet-based model for crack detection integrating visual explanations. Constr. Build. Mater. 2022, 322, 126265. [Google Scholar] [CrossRef]
- Adam, J.M.; Liu, W.; Zang, Y.; Afzal, M.K.; Bello, S.A.; Muhammad, A.U.; Wang, C.; Li, J. Deep learning-based semantic segmentation of urban-scale 3D meshes in remote sensing: A survey. Int. J. Appl. Earth Obs. Geoinf. 2023, 121, 103365. [Google Scholar] [CrossRef]
- Rao, X. Navigation path recognition between crop ridges based on semantic segmentation. Trans. Chin. Soc. Agric. Eng. 2021, 37, 179–186. [Google Scholar] [CrossRef]
- Ge, R.; Cai, H.; Yuan, X.; Qin, F.; Huang, Y.; Wang, P.; Lyu, L. MD-UNET: Multi-input dilated U-shape neural network for segmentation of bladder cancer. Comput. Biol. Chem. 2021, 93, 107510. [Google Scholar] [CrossRef]
- Changjia, X.; Jianbing, Y.I.; Feng, C.; Wangsheng, F. Colorectal polyp segmentation algorithm using DoubleUNet network. Opt. Precis. Eng. 2022, 30, 970–983. [Google Scholar]
- Hu, J.; Shen, L.; Sun, G. Squeeze-and-Excitation Networks. In Proceedings of the IEEE Computer Society Conference on Computer Vision and Pattern Recognition, Salt Lake City, UT, USA, 18–23 June 2018; IEEE Computer Society: Piscataway, NJ, USA; pp. 7132–7141. [Google Scholar] [CrossRef]
- Woo, S.; Park, J.; Lee, J.Y.; Kweon, I.S. CBAM: Convolutional Block Attention Module. arXiv 2018, arXiv:1807.06521. [Google Scholar] [CrossRef]
- Deng, B.; Zheng, X.; Shen, C.; Fu, Y. Study on dynamic response characteristics of shallow buried pipe gallery structure under vehicle vibration load. Soil Dyn. Earthq. Eng. 2024, 181, 108597. [Google Scholar] [CrossRef]
- Li, Z.; Deng, X.; Lan, Y.; Liu, C.; Qing, J. Fruit tree canopy segmentation from UAV orthophoto maps based on a lightweight improved U-Net. Comput. Electron. Agric. 2023, 217, 108538. [Google Scholar] [CrossRef]
- Li, P.; Zhao, W.; Fu, C.; Pan, T.; Ji, X. Segmentation of backscattered electron images of cement-based materials using lightweight U-Net with attention mechanism (LWAU-Net). J. Build. Eng. 2023, 77, 120578. [Google Scholar] [CrossRef]
- Ding, Z.; Zhang, Y.; Zhu, C.; Zhang, G.; Li, X.; Jiang, N.; Que, Y.; Peng, Y.; Guan, X. CAT-Unet: An enhanced U-Net architecture with coordinate attention and skip-neighborhood attention transformer for medical image segmentation. Inf. Sci. 2024, 670, 120578. [Google Scholar] [CrossRef]
- Kalinaki, K.; Malik, O.A.; Lai, D.T.C. FCD-AttResU-Net: An improved forest change detection in Sentinel-2 satellite images using attention residual U-Net. Int. J. Appl. Earth Obs. Geoinf. 2023, 122, 106138. [Google Scholar] [CrossRef]
- Huang, B.; Huang, T.; Xu, J.; Min, J.; Hu, C.; Zhang, Z. RCNU-Net: Reparameterized convolutional network with convolutional block attention module for improved polyp image segmentation. Biomed. Signal Process. Control. 2024, 93, 106138. [Google Scholar] [CrossRef]
- Mahmood, T.; Wahid, A.; Hong, J.S.; Kim, S.G.; Park, K.R. A novel convolution transformer-based network for histopathology-image classification using adaptive convolution and dynamic attention. Eng. Appl. Artif. Intell. 2024, 135, 108824. [Google Scholar] [CrossRef]


Disclaimer/Publisher’s Note: The statements, opinions and data contained in all publications are solely those of the individual author(s) and contributor(s) and not of MDPI and/or the editor(s). MDPI and/or the editor(s) disclaim responsibility for any injury to people or property resulting from any ideas, methods, instructions or products referred to in the content. |
© 2025 by the authors. Licensee MDPI, Basel, Switzerland. This article is an open access article distributed under the terms and conditions of the Creative Commons Attribution (CC BY) license (https://creativecommons.org/licenses/by/4.0/).