Article

Design of Periodic Neural Networks for Computational Investigations of Nonlinear Hepatitis C Virus Model Under Boozing

1
Abdus Salam School of Mathematical Sciences, Government College University, Lahore 54600, Pakistan
2
Department of Mathematics and Statistics, Binghamton University—State University of New York, Binghamton, NY 13902, USA
*
Authors to whom correspondence should be addressed.
Computation 2025, 13(3), 66; https://doi.org/10.3390/computation13030066
Submission received: 20 January 2025 / Revised: 2 March 2025 / Accepted: 4 March 2025 / Published: 6 March 2025

Abstract

:
The computational investigation of nonlinear mathematical models presents significant challenges due to their complex dynamics. This paper presents a computational study of a nonlinear hepatitis C virus model that accounts for the influence of alcohol consumption on disease progression. We employ periodic neural networks, optimized using a hybrid genetic algorithm and the interior-point algorithm, to solve a system of six coupled nonlinear differential equations representing hepatitis C virus dynamics. This model has not previously been solved using the proposed technique, marking a novel approach. The proposed method’s performance is evaluated by comparing the numerical solutions with those obtained from traditional numerical methods. Statistical measures such as mean absolute error, root mean square error, and Theil’s inequality coefficient are used to assess the accuracy and reliability of the proposed approach. The weight vector distributions illustrate how the network adapts to capture the complex nonlinear behavior of the disease. A comparative analysis with established numerical methods is provided, where performance metrics are illustrated using a range of graphical tools, including box plots, histograms, and loss curves. The absolute error values, ranging approximately from 10 6 to 10 10 , demonstrate the precision, convergence, and robustness of the proposed approach, highlighting its potential applicability to other nonlinear epidemiological models.

1. Introduction

The hepatitis C virus (HCV) infection presents a serious challenge to global health, since many of those infected with the virus go on to acquire serious chronic liver diseases [1]. Human immunodeficiency virus (HIV) infections and the hepatitis C virus are two significant global public health concerns with similar transmission routes [2]. According to World Health Organization (WHO) estimates, 58 million individuals have chronic HCV infection, and 1.5 million new cases are reported each year [3,4]. In comparison to developed countries in Europe and North America, the disease is more common in poorer developing countries in Asia and Africa. Additionally, there is a higher rate of chronic illness in countries like Egypt, China, and Pakistan [5,6]. Alcohol drinking significantly affects how quickly liver disease spreads in those who have HCV infections. There is an eleven percent increase in the risk of cirrhosis for every alcoholic drink consumed daily. HCV and alcohol misuse often coexist in the same patient. Between 16 % and 40 % of alcoholic individuals, both with and without liver disease, have been shown to have HCV infection [7,8,9]. Comparing chronic alcoholic individuals with HCV infection to HCV infection in people who do not drink has revealed significant histologic liver damage in the form of higher incidences of fibrosis advancement and cirrhosis development [10,11,12,13,14]. However, the impact of alcohol consumption in any form on the effectiveness of antiviral therapy is less certain. Research indicates that the results of antiviral treatments are negatively impacted by lifetime cumulative alcohol consumption. Ohnishi et al. suggested in one of these investigations that long-term alcohol abstinence enhances the effectiveness of interferon treatment [15]. Loguercio et al.’s Italian study demonstrated that, when alcohol consumption rose, the sustained virologic response (SVR) declined [16].
The development of numerical solvers has been explored in various studies, each providing solutions for linear and nonlinear differential models while highlighting their applicability, stability, and significance [17,18,19,20,21]. Deterministic solvers offer both advantages and limitations, whereas stochastic solvers, such as artificial neural networks (ANNs), have demonstrated effectiveness in capturing infection dynamics due to their consistency, accuracy, and capability in solving optimization models across diverse applications [22,23,24,25]. Recent advancements in stochastic solvers include their applications in solving second-order functional singular systems [26], third-order nonlinear multi-singular Emden–Fowler equations [27], and modeling the Coronavirus disease 2019 (COVID-19) epidemic [28]. Additionally, these solvers have been applied to dengue fever SIR nonlinear models [29], nonlinear fourth-order Emden-Fowler equations [30], Maxwell nanofluids in the Buongiorno model [31], novel singular third-order perturbed delay differential models [32], monkeypox transmission systems [33], nonlinear singular heat conduction models [34], summer precipitation prediction [35], fractional water pollution models [36], and Marburg virus transmission dynamics [37]. Furthermore, recent research has addressed the Van der Pol–Mathieu–Duffing oscillator model using a Morlet wavelet neural network [38]. These advancements highlight the increasing role of artificial intelligence in solving complex mathematical models across scientific disciplines. The integration of neural network-based approaches has enhanced the accuracy and efficiency of computational solvers, enabling them to tackle highly nonlinear and stiff systems. As research progresses, these methods are expected to be further refined and applied to emerging challenges in epidemiology, engineering, and environmental science.
The objective of this paper is to numerically investigate the nonlinear hepatitis C virus model as given in Equation (1) by utilizing a stochastic structure known as periodic neural networks (PNNs), combined with optimization techniques based on global/local search strategies, specifically the genetic algorithm (GA) and the interior-point approach (IPA), i.e., PNNs-GA-IPA. This PNNs-GA-IPA approach has not been previously applied to solve the nonlinear hepatitis C virus model set, shown in Equation (1). While PNNs-GA-IPA is a known technique, our study demonstrates its effectiveness at solving a complex nonlinear HCV model with enhanced accuracy. The significant reduction in absolute error and improved convergence rates distinguish this approach from currently existing methods. The current contributions and innovative insights, in terms of the key features of the PNNs-GA-IPA, are outlined as follows:
  • Computational investigations of the nonlinear mathematical model of HCV are effectively presented using a novel implementation of the integrated computing approach combining PNNs, GA, and IPA.
  • The overlapping of the results from the designed PNNs-GA-IPA with the reference solutions from the RK-4 numerical solver for the nonlinear HCV model demonstrates its value through high accuracy and strong convergence indices.
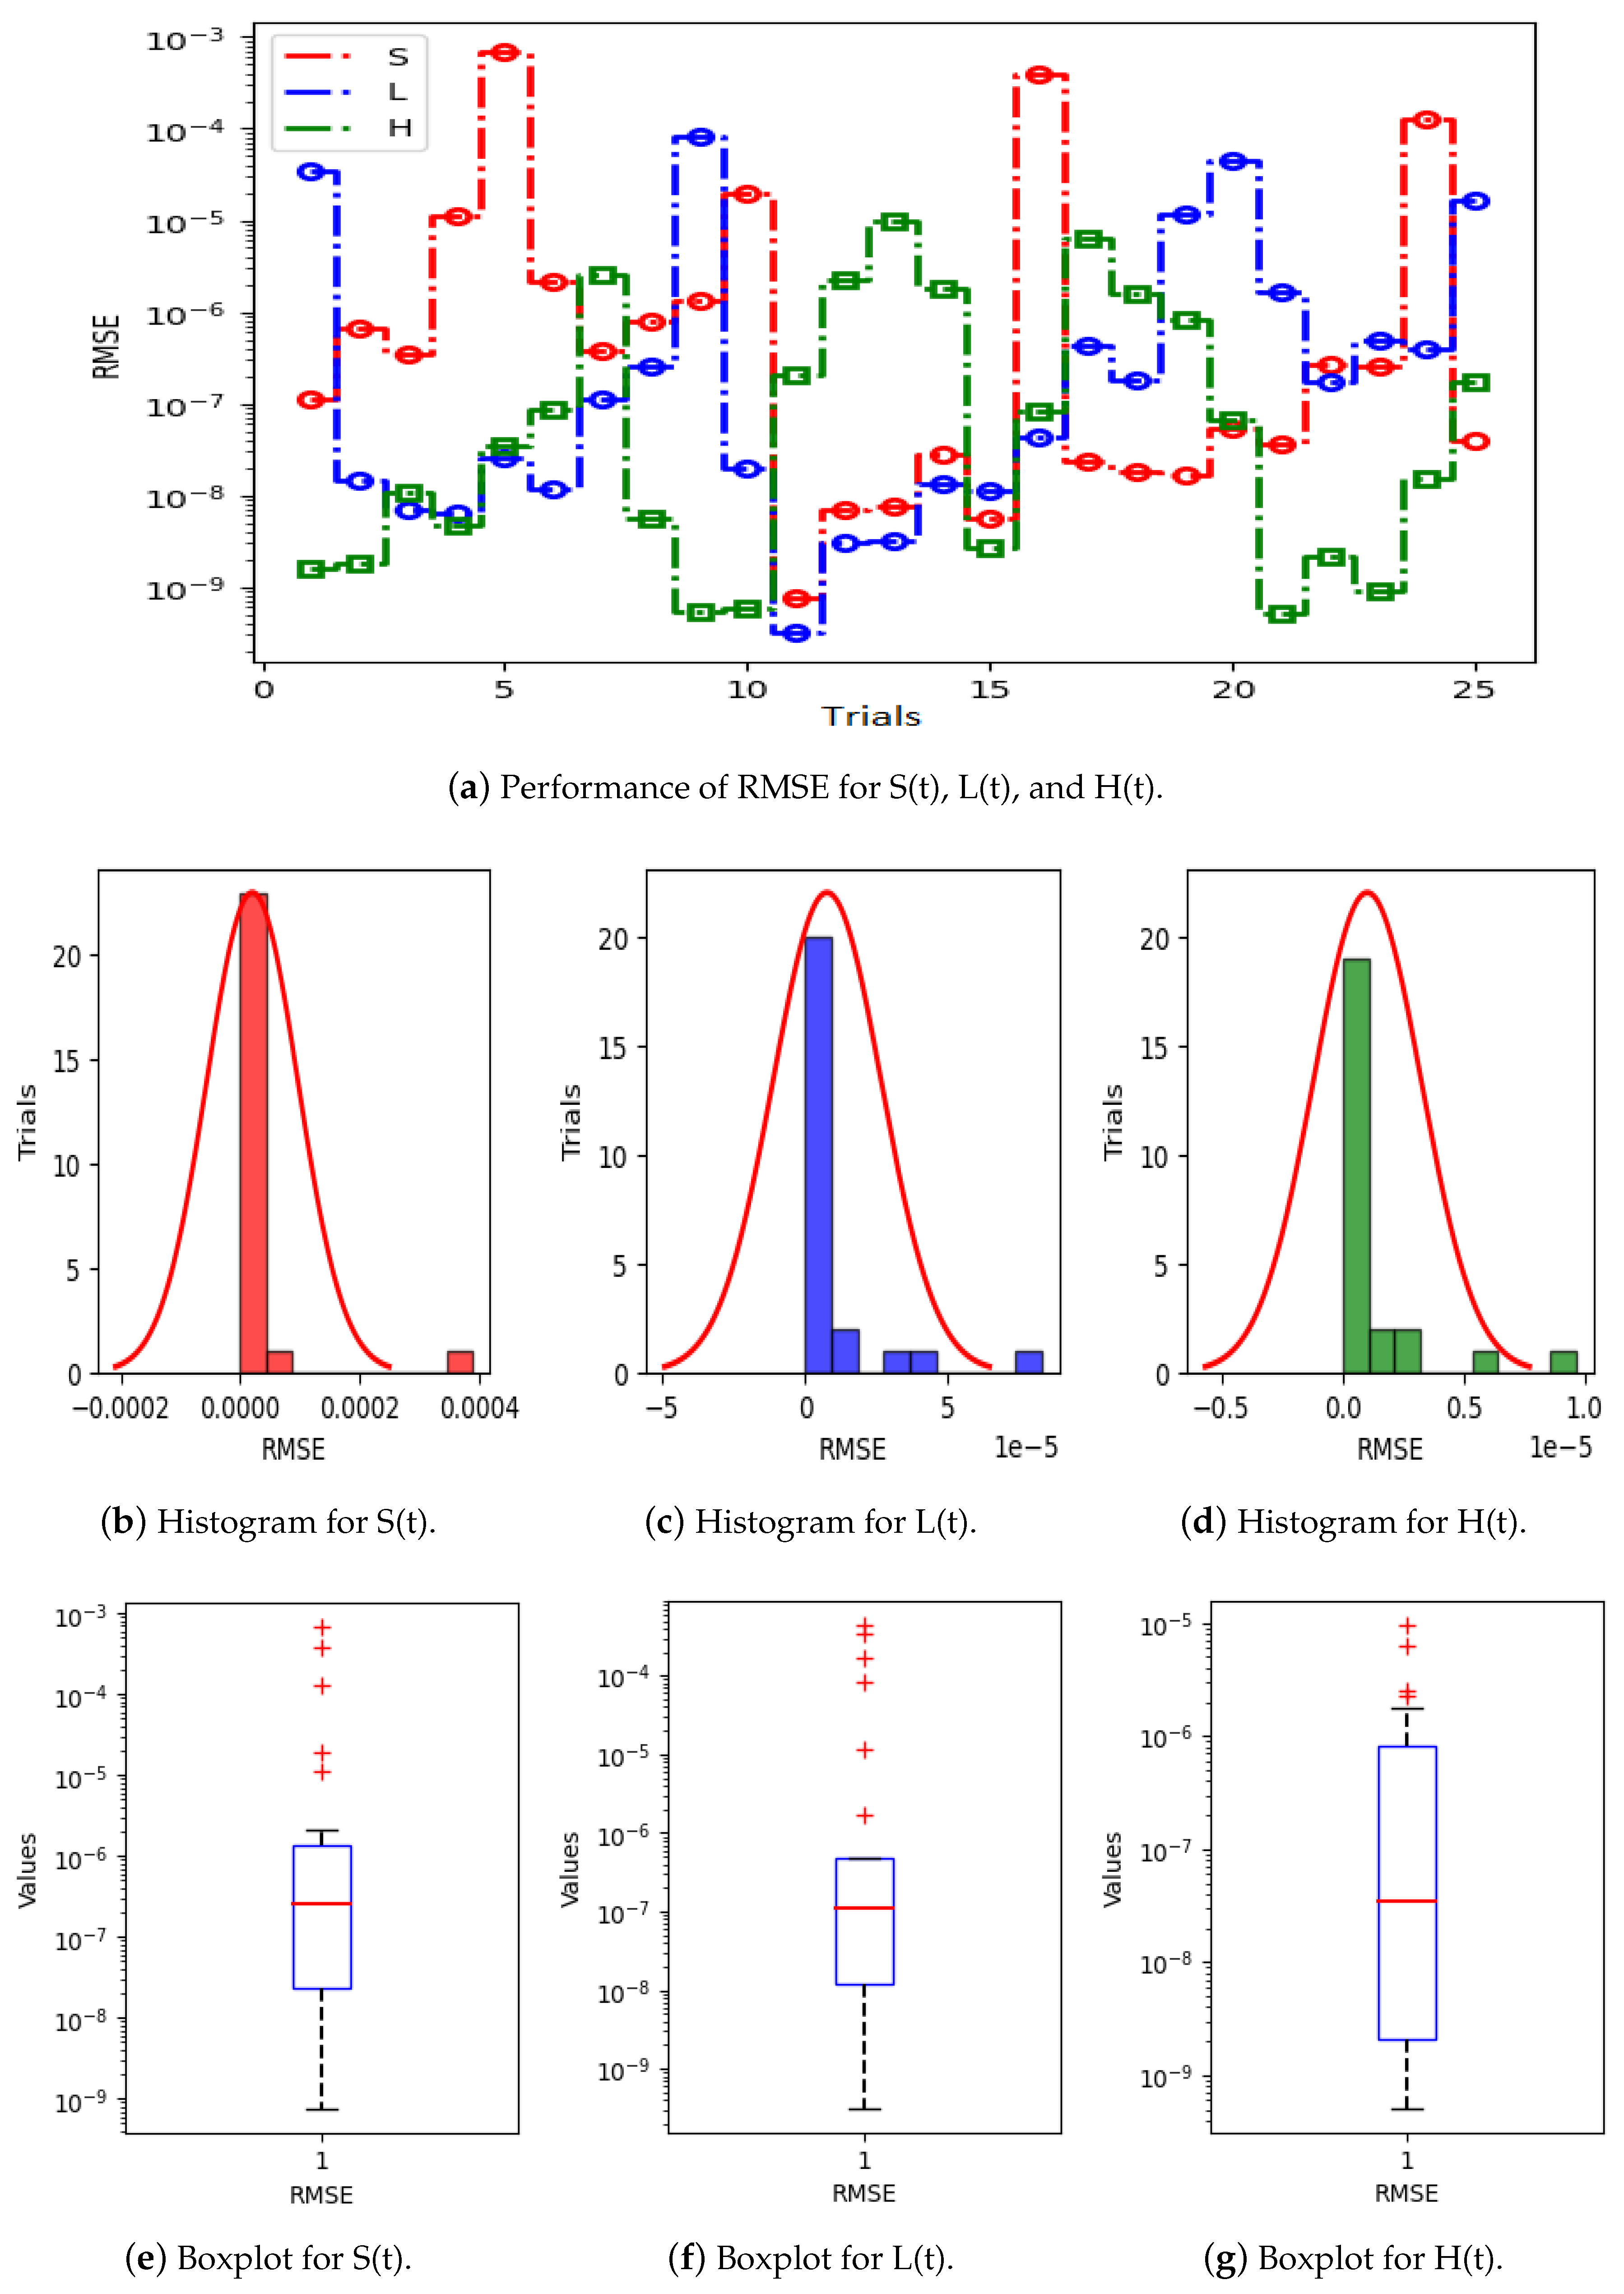
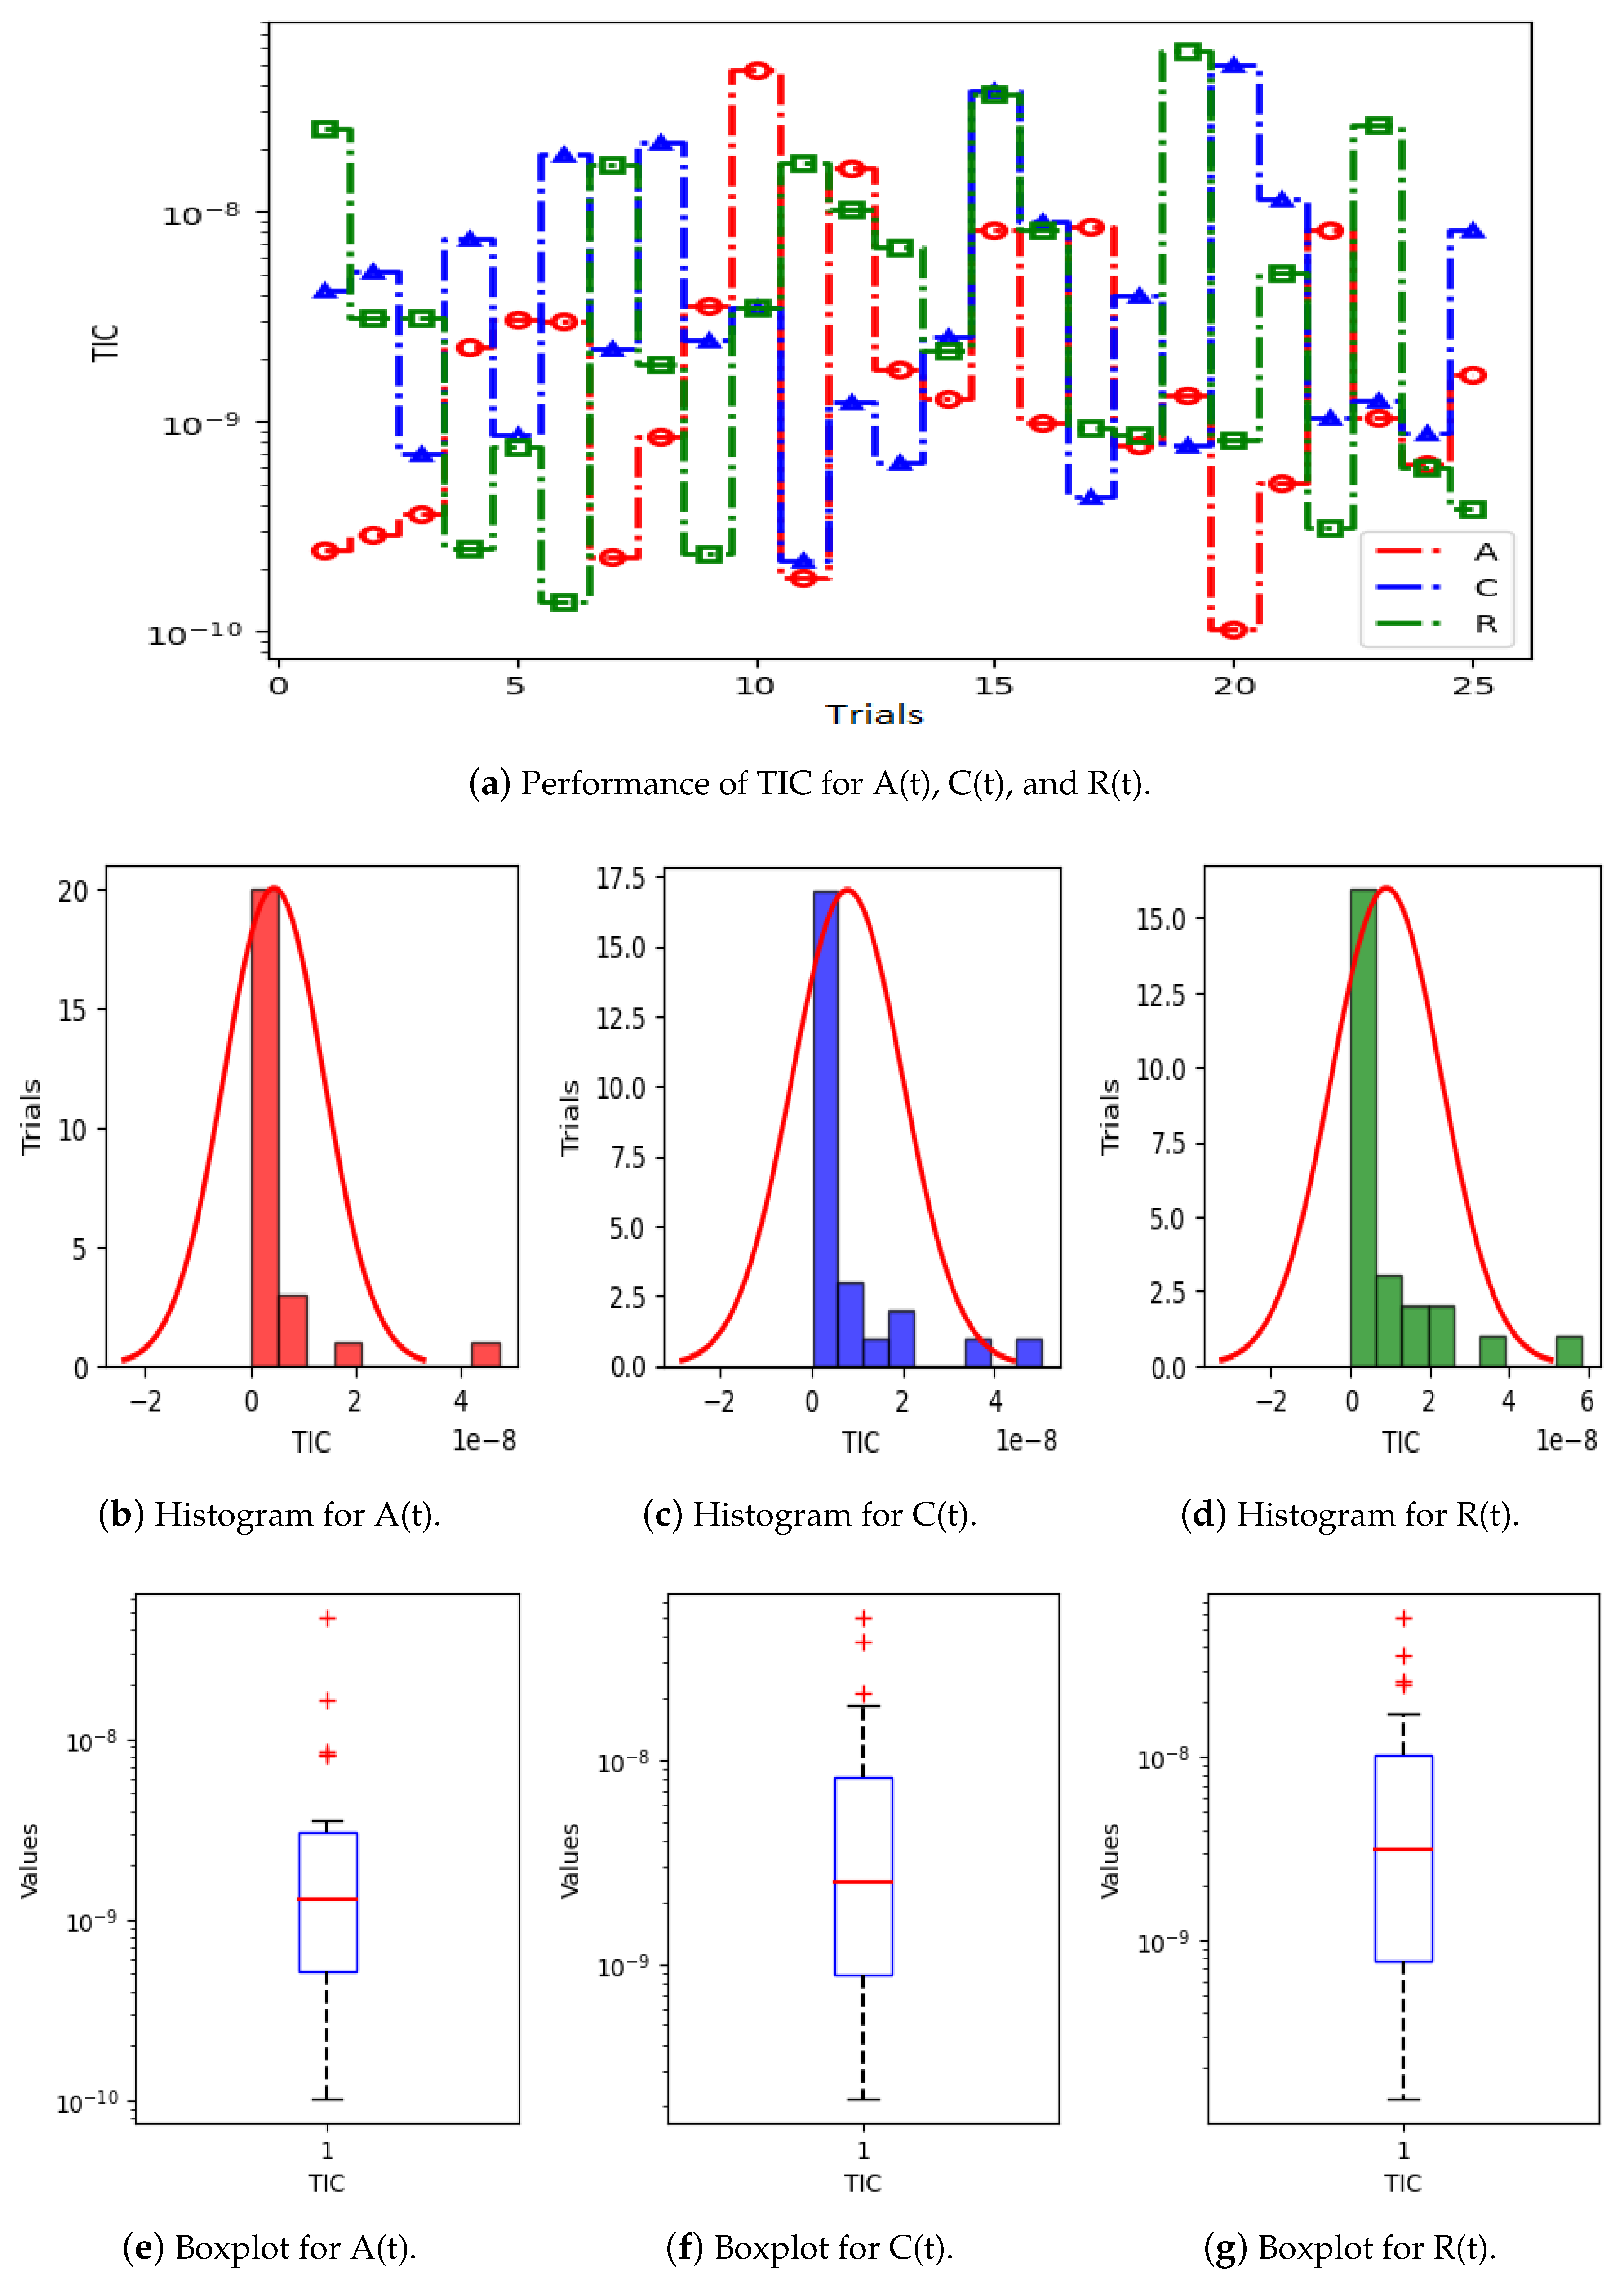
  • The performance and validation of the designed PNNs-GA-IPA is certified through statistical evaluations, including the mean absolute error (MAE) index, Theil’s inequality coefficient (TIC), and the root mean square error (RMSE) metric for multiple trails.
The other parts of this paper cover the following: The mathematical model is represented in Section 2. Section 3 describes the design of the PNNs-GA-IPA methodology. The mathematical representation of the statistical operators is given in Section 4. Section 5 represent the results, with a discussion of the comparison between the PNNs-GA-IPA results and reference results. The concluding remarks and future research directions are given in Section 6.

2. Mathematical Model

The mathematical model for the optimal control of HCV transmission under the effect of alcohol is presented in [39], which is defined in Equation (1). The six-equation system is an established HCV model, and our study focuses on solving it using the PNNs-GA-IPA technique. This approach enhances the solution’s accuracy and stability, demonstrating its effectiveness in handling complex nonlinear systems. Individuals infected with HCV recover from the disease more quickly; this is the basis of a mathematical framework for the monitoring of individuals who either have a habitually high alcohol consumption level (>2 shot) or a habitually low alcohol consumption level (<2 shot). Figure 1 shows the mathematical model, where S ( t ) represents the level of alcohol consumption, L ( t ) represents a low alcohol consumption level, H ( t ) represents a high alcohol consumption level, A ( t ) represents individuals who are acutely infected, C ( t ) represents individuals who are chronically infected, and R ( t ) represents recovered individuals. Figure 1 is described by the following set of nonlinear differential equations.
d S d t = D + λ S + θ 11 R θ 4 S θ 1 S θ 2 S μ S , d L d t = θ 1 S θ 5 L θ 3 L + θ 9 H μ L , d H d t = θ 2 S + θ 3 L θ 9 H θ 7 H θ 6 H μ H , d A d t = θ 5 L + θ 6 H + θ 4 S θ A μ A , d C d t = θ A + θ 7 H θ 8 C μ C , d R d t = θ 8 C θ 11 R μ .
where λ = α ( α 1 L + α 2 H + α 3 A + α 4 C ) N with S > 0 , L 0 , H 0 , C 0 , A 0 , R 0 , and S + L + H + A + C + R N .
In this model, the susceptible individuals (S) enter at a rate of λ S and D. Susceptible individuals (S) with a low level of alcohol consumption (L) enter at a rate of θ 1 , and those with a high level of alcohol consumption (H) enter at a rate of θ 2 . Susceptible individuals (S) also become acutely infected individuals (A) at a rate of θ 4 . Low alcohol consumption becomes high alcohol consumption at a rate of θ 3 , and high alcohol consumption becomes low alcohol consumption at a rate of θ 9 . Acutely infected individuals become chronic individuals (C) and chronic individuals recover at a rate of θ and θ 8 , respectively.
It is possible for the individuals who have recovered to become susceptible again at a rate of θ 11 . Here, D and μ represent the “new recruitment rate” and the “death rate” respectively. The parametric values of all parameters, taken from [39], are given in Table 1.

3. Proposed Methodology

This section consists of the proposed methodology, in which we present the structure of the novel approach PNNs-GA-IPA. An objective function is formulated based on the differential system and initial conditions of the nonlinear hepatitis C virus model. The visual representation of the PNNs-GA-IPA approach is presented in Figure 2. The required and basic settings are established using optimization procedures for GA-IPA, in order to solve the nonlinear hepatitis C virus model.
Figure 2 illustrates the architecture of the PNNs, designed and fine-tuned to solve the SLHACR model using the PNNs-GA-IPA framework. The genetic algorithm (GA) is a robust global optimization method that is particularly effective for stiff, complex, and nonlinear systems. In this study, GA is employed as the optimization technique to solve the HCV model, enhancing solutions iteratively through selection, crossover, reproduction, and mutation processes.

3.1. Framework of PNNs-GA-IPA

The mathematical formulation of the HCV-SLHACR model, as shown in Equation (1), is expressed using PNNs. This provides the estimated results along with their first derivatives, which are presented in Equation (2) and Equation (3), respectively.
[ S ^ ( t ) , L ^ ( t ) , H ^ ( t ) , A ^ ( t ) , C ^ ( t ) , R ^ ( t ) ] = u = 1 m p s , u Z w s , u t + q s , u , u = 1 m p l , u Z w l , u t + q l , u , u = 1 m p h , u Z w h , u t + q h , u , u = 1 m p a , u Z w a , u t + q a , u , u = 1 m p c , u Z w c , u t + q c , u , u = 1 m p r , u Z w r , u t + q r , u .
[ S ^ ( t ) , L ^ ( t ) , H ^ ( t ) , A ^ ( t ) , C ^ ( t ) , R ^ ( t ) ] = u = 1 m p s , u Z w s , u t + q s , u , u = 1 m p l , u Z w l , u t + q l , u , u = 1 m p h , u Z w h , u t + q h , u , u = 1 m p a , u Z w a , u t + q a , u , u = 1 m p c , u Z w c , u t + q c , u , u = 1 m p r , u Z w r , u t + q r , u .
In the above equations, m represents the total number of neurons in the hidden layer and [ p , w , q ] represents unknown weights, as follows: W = [ W s , W l , W h , W a , W c , W r ] for
W s = [ p s , w s , q s ] , W l = [ p l , w l , q l ] , W h = [ p h , w h , q h ] , W a = [ p a , w a , q a ] , W c = [ p c , w c , q c ] W r = [ p r , w r , q r ]
where
  • p s = p s , 1 , p s , 2 , , p s , m , w s = w s , 1 , w s , 2 , , w s , m , q s = q s , 1 , q s , 2 , , q s , m ,
  • p l = p l , 1 , p l , 2 , , p l , m , w l = w l , 1 , w l , 2 , , w l , m , q l = q l , 1 , q l , 2 , , q l , m ,
  • p h = p h , 1 , p h , 2 , , p h , m , w h = w h , 1 , w h , 2 , , w h , m , q h = q h , 1 , q h , 2 , , q h , m ,
  • p a = p a , 1 , p a , 2 , , p a , m , w a = w a , 1 , w a , 2 , , w a , m , q a = q a , 1 , q a , 2 , , q a , m ,
  • p c = p c , 1 , p c , 2 , , p c , m , w c = w c , 1 , w c , 2 , , w c , m , q c = q c , 1 , q c , 2 , , q c , m ,
  • p r = p r , 1 , p r , 2 , , p r , m , w r = w r , 1 , w r , 2 , , w r , m , q r = q r , 1 , q r , 2 , , q r , m .
We used the periodic activation function Z = s i n θ . To solve the nonlinear HCV-SLHACR model, the fitness/loss function was defined as follows:
L = L 1 + L 2 + L 3 + L 4 + L 5 + L 6 + L 7 ,
L 1 = 1 N i = 1 N d S ^ i d t D θ 11 R ^ i + θ 4 S ^ i + θ 1 S ^ i + θ 2 S ^ i + μ S ^ i 2 ,
L 2 = 1 N i = 1 N d L ^ i d t θ 1 S ^ i + θ 5 L ^ i + θ 3 L ^ i θ 9 H ^ i + μ L ^ i 2 ,
L 3 = 1 N i = 1 N d H ^ i d t θ 2 S ^ i θ 3 L ^ i + θ 9 H ^ i + θ 7 H ^ i + θ 6 H ^ i + μ H ^ i 2 ,
L 4 = 1 N i = 1 N d A ^ i d t θ 5 L ^ i θ 6 H ^ i θ 4 S + θ A ^ i + μ A ^ i 2 ,
L 5 = 1 N i = 1 N d C ^ i d t θ A ^ i θ 7 H ^ i + θ 8 C ^ i μ C ^ i 2 ,
L 6 = 1 N i = 1 N d R ^ i d t θ 8 C ^ i + θ 11 R ^ i + μ R ^ i 2 ,
L 7 = 1 6 i = 1 N ( S ^ 0 k 1 ) 2 + ( L ^ 0 k 2 ) 2 + ( H ^ 0 k 3 ) 2 + ( A ^ 0 k 4 ) 2 + ( C ^ 0 k 5 ) 2 + ( R ^ 0 k 6 ) 2 .
where N h = 1 , S ^ i = S ^ ( t i ) , L ^ i = L ^ ( t i ) , H ^ i = H ^ ( t i ) , A ^ i = A ^ ( t i ) C ^ i = C ^ ( t i ) , R ^ i = R ^ ( t i ) , and t i = i h . k 1 , k 2 , k 3 , k 4 , k 5 , and k 6 represent the initial conditions of the nonlinear HCV model. Furthermore, L 1 , L 2 , L 3 , L 4 , L 5 , and L 6 represent the loss functions corresponding to the differential system in Equation (1), while L 7 denotes the fitness function based on the initial conditions of the same system. The approximate solutions to the set of Equation (1) are obtained from the PNNs weights, where L 0 .

3.2. Optimization Procedure for GA-IPA

The performance of the proposed scheme is evaluated through the optimization of GA-IPA for solving the nonlinear HCV-SLHACR model. The GA is a well-known global search optimization method which can be effectively applied to solve both constrained and unconstrained models. It is commonly employed to determine precise population outcomes for solving various stiff and complex models through an optimal training process. Recently, GA has been applied in many notable applications, as referenced in [40,41,42,43].
IPA is a local search optimization method known for its rapid and efficient performance, used to solve various complex and non-stiff models effectively. IPA has been applied to a range of models, including the phase-field approach to brittle and ductile fracture [44], multistage nonlinear nonconvex programs [45], the susceptible, infected, treatment, and recovered (SITR) model for the dynamics of novel coronavirus [46] and viscoplastic fluid flows [47]. To address the limitations of the global search method GA, the process of hybridizing it with IPA is employed to solve the nonlinear smoke model.
The process of optimizing PNNs-GA-IPA to find and present the solution of the nonlinear HCV-SLHACR model is provided in Table 2.

4. Statistical Measures

The performance evaluations using various statistical metrics, including mean absolute error (MAE), Theil’s inequality coefficient (TIC), and root mean squared error (RMSE), aimed to validate the consistency and reliability of the proposed solution for the nonlinear HCV-SLHACR model: the PNNs-GA-IPA approach. The mathematical representation of these statistical operators is as follows:
[ MAE S , MAE L , MAE H ] = 1 n i = 1 n S i S ^ i , 1 n i = 1 n L i L ^ i , 1 n i = 1 n H i H ^ i .
[ MAE A , MAE C , MAE R ] = 1 n i = 1 n A i A ^ i , 1 n i = 1 n C i C ^ i , 1 n i = 1 n R i R ^ i .
[ RMSE S , RMSE L , RMSE H ] = 1 n i = 1 n ( S i S ^ i ) 2 , 1 n i = 1 n ( L i L ^ i ) 2 , 1 n i = 1 n ( H i H ^ i ) 2 .
[ RMSE A , RMSE C , RMSE R ] = 1 n i = 1 n ( A i A ^ i ) 2 , 1 n i = 1 n ( C i C ^ i ) 2 , 1 n i = 1 n ( R i R ^ i ) 2 .
[ T I C S , T I C L ] = 1 n i = 1 n ( S i S ^ i ) 2 1 n i = 1 n S i 2 + 1 n i = 1 n S ^ i 2 , 1 n i = 1 n ( L i L ^ i ) 2 1 n i = 1 n L i 2 + 1 n i = 1 n L ^ i 2 .
[ T I C H , T I C A ] = 1 n i = 1 n ( H i H ^ i ) 2 1 n i = 1 n H i 2 + 1 n i = 1 n H ^ i 2 , 1 n i = 1 n ( A i A ^ i ) 2 1 n i = 1 n A i 2 + 1 n i = 1 n A ^ i 2 .
[ T I C C , T I C R ] = 1 n i = 1 n ( C i C ^ i ) 2 1 n i = 1 n C i 2 + 1 n i = 1 n C ^ i 2 , 1 n i = 1 n ( R i R ^ i ) 2 1 n i = 1 n R i 2 + 1 n i = 1 n R ^ i 2 .

5. Results and Discussion

The current investigation focused on solving the nonlinear HCV-SLHACR model. The results of the Runge–Kutta methods of order four were taken as reference results because we have no analytical solutions for this model. The relative performance of the obtained solutions was assessed by comparing them with the RK4 results to demonstrate the accuracy of the PNNs-GA-IPA solver. Additionally, the performance of statistical operators was used to validate the accuracy, reliability, and precision of the proposed PNNs-GA-IPA solver. The updated form of the nonlinear HCV-SLHACR model, as presented in Equation (1) along with its initial conditions and appropriate parameter values, is shown as follows:
d S d t = 0.2 + 0.1 R 0.35 S 0.6 S 0.2 S 0.02 S , d L d t = 0.6 S 0.1 L 0.5 L + 0.3 H 0.02 L , d H d t = 0.2 S + 0.5 L 0.3 H 0.3 H 0.5 H 0.02 H , d A d t = 0.1 L + 0.5 H + 0.35 S 0.5 A 0.02 A , d C d t = 0.5 A + 0.3 H 0.6 C 0.02 C , d R d t = 0.6 C 0.1 R 0.02 .
where S 0 = 20 , L 0 = 6 , H 0 = 2 , A 0 = 6 , C 0 = 4 , and R 0 = 3 represent the initial conditions. The values shown were used to find the numerical solution for the HCV model. We only found a solution for small values but it is possible to use greater values. The loss function for the above system (the very last one) is given as follows:
L = 1 N i = 1 N d S ^ i d t 0.2 0.1 R ^ i + 0.35 S ^ i + 0.6 S ^ i + 0.2 S ^ i + 0.02 S ^ i 2 + d L ^ i d t 0.6 S ^ i + 0.5 L ^ i + 0.5 L ^ i 0.3 H ^ i + 0.02 L ^ i 2 + d R ^ i d t 0.6 C ^ i + 0.1 R ^ i + 0.02 R ^ i 2 + d H ^ i d t θ 2 S ^ i θ 3 L ^ i + θ 9 H ^ i + θ 7 H ^ i + 0.5 H ^ i + 0.02 H ^ i 2 + d A ^ i d t 0.1 L ^ i 0.5 H ^ i 0.35 S + 0.5 A ^ i + 0.02 A ^ i 2 + d C ^ i d t 0.5 A ^ i 0.3 H ^ i + 0.6 C ^ i 0.02 C ^ i 2 + 1 6 i = 1 N ( S ^ 0 20 ) 2 + ( L ^ 0 4 ) 2 + ( H ^ 0 5 ) 2 + ( A ^ 0 5 ) 2 + ( C ^ 0 4 ) 2 + ( R ^ 0 4 ) 2
The performance of the proposed solver on the nonlinear HCV-SLHACR model using PNNs-GA-IPA was evaluated across 25 independent executions, with 45 variables. The loss function, as presented in (20), was optimized using the hybridization of GA-IPA for the nonlinear HCV-SLHACR model. These 45 variables are the neural network parameters: we used fifteen neurons in a hidden layer and each neuron had three parameters (weights), so the parameters totaled 45. A comparison of the proposed solver’s results and the results of the reference Runge–Kutta methods for the solving of the HCV-SLHACR model are shown in Figure 3a. It is observed that the results produced by the PNNs-GA-IPA approach overlapped with the reference results for each group of the nonlinear HCV-SLHACR model, confirming the accuracy of the proposed PNNs-GA-IPA solver. Figure 3b represents the values of the AE for all compartments of the nonlinear HCV-SLHACR model. It is observed that the absolute error (AE) values lie approximately within the range of 10 6 10 10 . This shows the accuracy and reliability of the proposed PNNs-GA-IPA approach. Figure 4 visualizes the optimized weights of the PNNs-GA-IPA, demonstrating how the network adjusts its internal parameters to capture the nonlinear dynamics of the disease. The weight distribution highlights the effectiveness of GA-IPA in fine-tuning the network, ensuring accurate modeling of all compartments.
Figure 5a displays the results of 25 trials of MAE used to solve the S(t), L(t), and H(t) compartments of the nonlinear hepatitis C virus HCV-SLHACR model. The values of MAE for the compartments S(t), L(t), and H(t) lie between 10 4 and 10 7 , 10 4 and 10 8 , and 10 4 and 10 8 , respectively. Figure 5b–g display the graphic demonstrations based on the statistical performances along with histograms and boxplots to solve the S(t), L(t), and H(t) compartments of the HCV-SLHACR model and to find the convergence of MAE. Figure 6a displays the results of 25 trials of MAE used to solve the A(t), C(t), and R(t) compartments of the hepatitis C virus model. The values of MAE for the compartments A(t), C(t), and R(t) lie between 10 4 and 10 7 , 10 4 and 10 7 , and 10 4 and 10 8 , respectively. The histograms and boxplots in Figure 6b–g show the convergence in the performances of MAE for the A(t), C(t), and R(t) compartments of the nonlinear HCV-SLHACR model. The RMSE performances for 25 trials of the compartments S(t), L(t), and H(t) are represented in Figure 7a. It is observed that the RMSE values of the compartments S(t), L(t), and H(t) lie between 10 3 and 10 9 , 10 4 and 10 10 , and 10 5 and 10 9 respectively. The convergence of the performance of RMSE is represented using plotting histograms and boxplots in Figure 7b–g for the S(t), L(t), and H(t) compartments of the nonlinear HCV-SLHACR model. The RMSE values for the compartments A(t), C(t), and R(t) are represented in Figure 8a. It is observed that the RMSE values of the compartments A(t), C(t), and R(t) lie between 10 4 and 10 9 , 10 4 and 10 10 , and 10 2 and 10 10 , respectively. The convergence of the performances of RMSE is represented in Figure 8b–g in histograms and boxplots for the A(t), C(t), and R(t) compartments of the nonlinear HCV-SLHACR model. Figure 9a displays the results of 25 trials of TIC used to solve the S(t), L(t), and H(t) compartments of the nonlinear hepatitis C virus HCV-SLHACR model. The values of TIC for the compartments S(t), L(t), and H(t) lie between 10 7 and 10 10 , 10 8 and 10 10 , and 10 7 and 10 10 , respectively. Figure 9b–g display the visualizations of these statistical performances, along with histograms and boxplots, of solving the S(t), L(t), and H(t) compartments of the HCV-SLHACR model and aid in finding the convergence of TIC. Figure 10a displays the results of 25 trials of TIC used to solve the A(t), C(t), and R(t) compartments of the hepatitis C virus model. The values of TIC for the compartments A(t), C(t), and R(t) lie between 10 7 and 10 9 , 10 7 and 10 10 , and 10 7 and 10 10 , respectively. The histograms and boxplots in Figure 10b–g shows the convergence of the performances of TIC for the A(t), C(t), and R(t) compartments of the nonlinear HCV-SLHACR model. These performances show that there is a good overlap between the reference solution and the periodic neural network results. This demonstrates the accuracy and efficiency of the proposed solver.

6. Concluding Remarks

In this study, we successfully applied the PNNs-GA-IPA computational framework to solve the nonlinear HCV-SLHACR model, which accounts for the impact of alcohol consumption on hepatitis C virus progression. The proposed approach effectively leveraged periodic neural networks with genetic algorithms and the interior-point algorithm to achieve highly accurate numerical approximations, with absolute errors ranging from 10 7 to 10 10 . The use of a sine activation function and 15 hidden neurons contributed to capturing the model’s intricate dynamics, demonstrating the robustness of PNNs in handling nonlinear epidemiological systems. Comprehensive statistical analysis, including MAE, RMSE, and TIC, validated the reliability of our method, showing significant reductions in error compared to traditional numerical techniques. The optimized weight vectors and comparative simulations further reinforced the efficiency of the proposed scheme. Our findings suggest that this approach provides an effective alternative for solving complex biological models, offering improvements in precision and computational performance.
Beyond computational accuracy, this study highlights the applicability of neural network-based methods in disease modeling, particularly in understanding HCV progression under external influences like alcohol consumption. While our approach provides a strong mathematical foundation, future work should integrate real-world clinical data to enhance predictive capabilities and medical relevance. Furthermore, the PNNs-GA-IPA framework can be extended to study other infectious diseases, such as HIV and monkeypox, to explore its potential for broader epidemiological applications.

Author Contributions

A.M. conducted the mathematical model and computational simulations, methodology, software, generate graphical results, performed analysis and prepared initial draft. J.U.R. contributed to the conceptualization, methodology, validation of the results and reviewing and editing the final manuscript, supervising the research. Q.I. contributed to the conceptualization, validation of the results, reviewed the manuscript and provided critical feedback. R.Z. managed the parameter identification and justification, conceptualization, and reviewed the final draft. All authors have read and agreed to the published version of the manuscript.

Funding

There is no funding to support this article.

Data Availability Statement

The manuscript has no associated data.

Conflicts of Interest

The authors declare that they have no conflicts of interest.

References

  1. Bertino, G.; Ardiri, A.; Proiti, M.; Rigano, G.; Frazzetto, E.; Demma, S.; Ruggeri, M.I.; Scuderi, L.; Malaguarnera, G.; Bertino, N.; et al. Chronic hepatitis C: This and the new era of treatment. World J. Hepatol. 2016, 8, 92. [Google Scholar] [CrossRef] [PubMed]
  2. Platt, L.; Easterbrook, P.; Gower, E.; McDonald, B.; Sabin, K.; McGowan, C.; Yanny, I.; Razavi, H.; Vickerman, P. Prevalence and burden of HCV co-infection in people living with HIV: A global systematic review and meta-analysis. Lancet Infect. Dis. 2016, 16, 797–808. [Google Scholar] [CrossRef]
  3. WHO. Hepatitis C. 2021. Available online: https://www.who.int/publications/i/item/9789240053779 (accessed on 22 July 2022).
  4. WHO: Global Health Sector Strategy on Viral Hepatitis, 2016–2021. Available online: https://www.who.int/publications/i/item/WHO-HIV-2016.06 (accessed on 17 May 2016).
  5. Mohamed, A.A.; Elbedewy, T.A.; El-Serafy, M.; El-Toukhy, N.; Ahmed, W.; El Din, Z.A. Hepatitis C virus: A global view. World J. Hepatol. 2015, 7, 2676. [Google Scholar] [CrossRef]
  6. Huang, R.; Rao, H.; Yang, M.; Gao, Y.; Wang, J.; Jin, Q.; Ma, D.; Wei, L. Noninvasive measurements predict liver fibrosis well in hepatitis C virus patients after direct-acting antiviral therapy. Dig. Dis. Sci. 2020, 65, 1491–1500. [Google Scholar] [CrossRef]
  7. Fong, T.L.; Kanel, G.C.; Conrad, A.; Valinluck, B.; Charboneau, F.; Adkins, R.H. Clinical significance of concomitant hepatitis C infection in patients with alcoholic liver disease. Hepatology 1994, 19, 554–557. [Google Scholar] [CrossRef]
  8. Coelho-Little, M.E.; Jeffers, L.J.; Bernstein, D.E.; Goodman, J.J.; Reddy, K.R.; de Medina, M.; Li, X.; Hill, M.; La Rue, S.; Schiff, E.R. Hepatitis C virus in alcoholic patients with and without clinically apparent liver disease. Alcohol. Clin. Exp. Res. 1995, 19, 1173–1176. [Google Scholar] [CrossRef] [PubMed]
  9. Sata, M.; Fukuizmi, K.; Uchimura, Y.; Nakano, H.; Ishii, K.; Kumashiro, R.; Mizokami, M.; Lau, J.Y.; Tanikawa, K. Hepatitis C virus in patients with clinically diagnosed alcoholic liver disease. J. Viral. Hepat. 1996, 3, 143–148. [Google Scholar] [CrossRef]
  10. Poynard, T.; Bedrossa, P.; Opolon, P.; for the OBSVIRIC, METAVIR, CLINIVIR, and DOSVIRIC groups. Natural history of liver fibrosis progression in patients with chronic hepatitis C. Lancet 1997, 349, 825–832. [Google Scholar] [CrossRef]
  11. Bellentani, S.; Pozzato, G.; Saccoccio, G.; Crovatto, M.; Croce, L.S.; Mazzoran, L.; Masutti, F.; Cristianini, G.; Tiribelli, C. Clinical course and risk factors of hepatitis C virus related liver disease in the general population: Report from the Dionysos study. Gut 1999, 44, 874–880. [Google Scholar] [CrossRef]
  12. Wiley, T.E.; McCarthy, M.; Breidi, L.; Layden, T.J. Impact of alcohol on the histological and clinical progression of hepatitis C infection. Hepatology 1998, 28, 805–809. [Google Scholar] [CrossRef]
  13. Thomas, D.L.; Astemborski, J.; Rai, R.M.; Anania, F.A.; Schaeffer, M.; Galai, N.; Nolt, K.; Nelson, K.E.; Strathdee, S.A.; Johnson, L.; et al. The natural history of hepatitis C virus infection: Host, viral, and environmental factors. JAMA 2000, 284, 450–456. [Google Scholar] [CrossRef] [PubMed]
  14. Harris, D.R.; Gonin, R.; Alter, H.J.; Wright, E.C.; Buskell, Z.J.; Hollinger, F.B.; Seeff, L.B. The relationship of acute transfusion-associated hepatitis to the development of cirrhosis in the presence of alcohol abuse. Ann. Intern. Med. 2001, 134, 120–124. [Google Scholar] [CrossRef]
  15. Ohnishi, K.; Matsuo, S.; Matsutani, K.; Itahashi, M.; Kakihara, K.; Suzuki, K.; Ito, S.; Fujiwara, K. Interferon therapy for chronic hepatitis C in habitual drinkers: Comparison with chronic hepatitis C in infrequent drinkers. Am. J. Gastroenterol. 1996, 91, 1374–1379. [Google Scholar] [PubMed]
  16. Loguercio, C.; Di Pierro, M.; Di Marino, M.P.; Federico, A.; Disalvo, D.; Crafa, E.; Tuccillo, C.; Baldi, F.; del VecchioBlanco, C. Drinking habits of subjects with hepatitis C virus-related chronic liver disease: Prevalence and effect on clinical, virological and pathological aspects. Alcohol Alcohol. 2000, 35, 296–301. [Google Scholar] [CrossRef]
  17. Mahdy, A.M.S.; Sweilam, N.H.; Higazy, M. Approximate solution for solving nonlinear fractional order smoking model. Alex. Eng. J. 2020, 59, 739–752. [Google Scholar] [CrossRef]
  18. Mahdy, A.M.S. Numerical studies for solving fractional integro-differential equations. J. Ocean Eng. Sci. 2018, 3, 127–132. [Google Scholar] [CrossRef]
  19. Mahdy, A.M.S.; Higazy, M.; Gepreel, K.A.; El-Dahdouh, A.A.A. Optimal control and bifurcation diagram for a model nonlinear fractional SIRC. Alex. Eng. J. 2020, 59, 3481–3501. [Google Scholar] [CrossRef]
  20. Zhang, J.; Chen, C.; Yang, X.; Chu, Y.; Xia, Z. Efficient, non-iterative, and second-order accurate numerical algorithms for the anisotropic Allen–Cahn Equation with precise nonlocal mass conservation. J. Comput. Appl. Math. 2020, 363, 444–463. [Google Scholar] [CrossRef]
  21. Mahdy, A.M.S.; Lotfy, K.; Hassan, W.; El-Bary, A.A. Analytical solution of magneto-photothermal theory during variable thermal conductivity of a semiconductor material due to pulse heat flux and volumetric heat source. Waves Random Complex Media 2021, 31, 2040–2057. [Google Scholar] [CrossRef]
  22. Ul Rahman, J.; Danish, S.; Lu, D. Deep Neural Network-Based Simulation of Sel’kov Model in Glycolysis: A Comprehensive Analysis. Mathematics 2023, 11, 3216. [Google Scholar] [CrossRef]
  23. Ul Rahman, J.; Makhdoom, F.; Ali, A.; Danish, S. Mathematical modeling and simulation of biophysics systems using neural network. Int. J. Mod. Phys. B 2023, 38, 2450066. [Google Scholar] [CrossRef]
  24. Hassan, A.; Kamran, M.; Illahi, A.; Zahoor, R.M.A. Design of cascade artificial neural networks optimized with the memetic computing paradigm for solving the nonlinear Bratu system. Eur. Phys. J. Plus 2019, 134, 122. [Google Scholar] [CrossRef]
  25. Umar, M.; Sabir, Z.; Raja, M.A.Z. Intelligent computing for numerical treatment of nonlinear prey–predator models. Appl. Soft Comput. 2019, 80, 506–524. [Google Scholar] [CrossRef]
  26. Sabir, Z.; Raja, M.A.Z.; Umar, M.; Shoaib, M. Neuro-swarm intelligent computing to solve the second-order singular functional differential model. Eur. Phys. J. Plus 2020, 135, 474. [Google Scholar] [CrossRef]
  27. Sabir, Z.; Raja, M.A.Z.; Umar, M.; Shoaib, M. Design of neuro-swarming-based heuristics to solve the third-order nonlinear multi-singular Emden–Fowler equation. Eur. Phys. J. Plus 2020, 135, 410. [Google Scholar] [CrossRef]
  28. Cheema, T.N.; Raja, M.A.Z.; Ahmad, I.; Naz, S.; Ilyas, H.; Shoaib, M. Intelligent computing with Levenberg–Marquardt artificial neural networks for nonlinear system of COVID-19 epidemic model for future generation disease control. Eur. Phys. J. Plus 2020, 135, 932. [Google Scholar] [CrossRef]
  29. Umar, M.; Sabir, Z.; Raja, M.A.Z.; Sánchez, Y.G. A stochastic numerical computing heuristic of SIR nonlinear model based on dengue fever. Results Phys. 2020, 19, 103585. [Google Scholar] [CrossRef]
  30. Sabir, Z.; Saoud, S.; Raja, M.A.Z.; Wahab, H.A.; Arbi, A. Heuristic computing technique for numerical solutions of nonlinear fourth order Emden–Fowler equation. Math. Comput. Simul. 2020, 178, 534–548. [Google Scholar] [CrossRef]
  31. Sabir, Z.; Akkurt, N.; Said, S.B. A novel radial basis Bayesian regularization deep neural network for the Maxwell nanofluid applied on the Buongiorno model. Arab. J. Chem. 2023, 16, 104706. [Google Scholar] [CrossRef]
  32. Sabir, Z.; Said, S.B. Heuristic computing for the novel singular third order perturbed delay differential model arising in thermal explosion theory. Arab. J. Chem. 2023, 16, 104509. [Google Scholar] [CrossRef]
  33. Sabir, Z.; Said, S.B.; Guirao, J.L.G. A radial basis scale conjugate gradient deep neural network for the monkeypox transmission system. Mathematics 2023, 11, 975. [Google Scholar] [CrossRef]
  34. Raja, M.A.Z.; Umar, M.; Sabir, Z.; Khan, J.A.; Baleanu, D. A new stochastic computing paradigm for the dynamics of nonlinear singular heat conduction model of the human head. Eur. Phys. J. Plus 2018, 133, 364. [Google Scholar] [CrossRef]
  35. Bukhari, A.H.; Sulaiman, M.; Islam, S.; Shoaib, M.; Kumam, P.; Raja, M.A.Z. Neuro-fuzzy modeling and prediction of summer precipitation with application to different meteorological stations. Alex. Eng. J. 2020, 59, 101–116. [Google Scholar] [CrossRef]
  36. Sabir, Z.; Sadat, R.; Ali, M.R.; Said, S.B.; Azhar, M. A numerical performance of the novel fractional water pollution model through the Levenberg-Marquardt backpropagation method. Arab. J. Chem. 2023, 16, 104493. [Google Scholar] [CrossRef]
  37. Mustafa, N.; Ul Rahman, J.; Omame, A. Modelling of marburg virus transmission dynamics: A deep learning-driven approach with the effect of quarantine and health awareness interventions. Model. Earth Syst. Environ. 2024, 10, 7337–7357. [Google Scholar] [CrossRef]
  38. Ali, A.H.; Amir, M.; Rahman, J.U.; Raza, A.; Arif, G.E. Design of Morlet Wavelet Neural Networks for Solving the Nonlinear Van der Pol–Mathieu–Duffing Oscillator Model. Computers 2025, 14, 14. [Google Scholar] [CrossRef]
  39. Shah, N.H.; Shukla, N.; Satia, M.H.; Thakkar, F.A. Optimal Control of HCV transmission under liquoring. J. Theor. Biol. 2019, 465, 27–33. [Google Scholar] [CrossRef]
  40. Wei, H.; Bao, H.; Ruan, X. Genetic algorithm-driven discovery of unexpected thermal conductivity enhancement by disorder. Nano Energy 2020, 71, 104619. [Google Scholar] [CrossRef]
  41. Podvalny, S.L.; Chizhov, M.I.; Gusev, P.Y.; Gusev, K.Y. The crossover operator of a genetic algorithm as applied to the task of a production planning. Procedia Comput. Sci. 2019, 150, 603–608. [Google Scholar] [CrossRef]
  42. Gani, M.M.; Islam, M.S.; Ullah, M.A. Optimal PID tuning for controlling the temperature of electric furnace by genetic algorithm. SN Appl. Sci. 2019, 1, 880. [Google Scholar] [CrossRef]
  43. Parinam, S.; Kumar, M.; Kumari, N.; Karar, V.; Sharma, A.L. An improved optical parameter optimisation approach using Taguchi and genetic algorithm for high transmission optical filter design. Optik 2019, 182, 382–392. [Google Scholar] [CrossRef]
  44. Wambacq, J.; Ulloa, J.; Lombaert, G.; François, S. Interior-point methods for the phase-field approach to brittle and ductile fracture. Comput. Methods Appl. Mech. Eng. 2021, 375, 113612. [Google Scholar] [CrossRef]
  45. Zanelli, A.; Domahidi, A.; Jerez, J.; Morari, M. FORCES NLP: An efficient implementation of interior-point methods for multistage nonlinear nonconvex programs. Int. J. Control 2020, 93, 13–29. [Google Scholar] [CrossRef]
  46. Umar, M.; Sabir, Z.; Raja, M.A.Z.; Amin, F.; Saeed, T.; Guerrero-Sanchez, Y. Integrated neuro-swarm heuristic with interior-point for nonlinear SITR model for dynamics of novel COVID-19. Alex. Eng. J. 2021, 60, 2811–2824. [Google Scholar] [CrossRef]
  47. Bleyer, J. Advances in the simulation of viscoplastic fluid flows using interior-point methods. Comput. Methods Appl. Mech. Eng. 2018, 330, 368–394. [Google Scholar] [CrossRef]
Figure 1. The schematic diagram of the SLHACR model for HCV transmission.
Computation 13 00066 g001
Figure 2. A graphical representation of the PNNs-GA-IPA approach to solving the nonlinear HCV-SLHACR model.
Computation 13 00066 g002
Figure 3. The above graphs show the comparison between and absolute errors of the PNNs-GA-IPA results and the RK4 results.
Computation 13 00066 g003
Figure 4. The bar graphs show the best weights of PNNs-GA-IPA to approximate the nonlinear HCV-SLHACR model.
Computation 13 00066 g004
Figure 5. Visualizing the convergence of the MAE values through boxplots and histograms to validate nonlinear HCV model performance.
Computation 13 00066 g005
Figure 6. Visualizing convergence of the MAE values through boxplots and histograms to validate nonlinear HCV model performance.
Computation 13 00066 g006
Figure 7. Visualizing convergence of the RMSE values through boxplots and histograms to validate nonlinear HCV model performance.
Computation 13 00066 g007
Figure 8. Visualizing convergence of the RMSE values through boxplots and histograms to validate nonlinear HCV model performance.
Computation 13 00066 g008
Figure 9. Visualizing convergence of the TIC values through boxplots and histograms to validate the nonlinear HCV model performance.
Computation 13 00066 g009
Figure 10. Visualizing convergence of the TIC values through boxplots and histograms to validate the nonlinear HCV model performance.
Computation 13 00066 g010
Table 1. Model parameters.
ParameterValueParameterValueParameterValueParameterValue
D0.2 θ 4 0.35 θ 8 0.6 α 1
θ 0.5 θ 5 0.1 θ 9 0.3 α 1 0.4807
θ 1 0.6 θ 6 0.5 θ 11 0.1 α 2 0.3121
θ 2 0.2 θ 6 0.5 μ 0.02 α 3 0.0371
θ 3 0.5 θ 7 0.3 λ 0.40 α 4 0.2690
Table 2. GA-IPA optimization processes for the nonlinear HCV-SLHACR model.
GA Process
InputsParameters of the PNNs W = [ p , w , q ] .
ParametersAll parameters described as: W s = [ p s , w s , q s ] , W l = [ p l , w l , q l ] , W h = [ p h , w h , q d ] , W a = [ p a , w a , q a ] , W c = [ p c , w c , q c ] , W r = [ p r , w r , q r ] .
OutputsGA weights are denoted as W B G A .
InitializationAdjust W B G A .
Stopping CriteriaTerminate if any of the criteria is achieved [ L = 10 20 ] , [ TolCon = TolFun = 10 19 ] , [ Stall Limit = 150 ] , [ Generations = 99 ] , [ Population Size = 250 ] .
RankingRank precise W B G A in the specific population based on loss L.
SaveStore W B G A with time, trails, and loss.
GA Procedure Stop
Start the IPA
Inputs W B G A is taken as initial point.
InitializationInitialize W B G A , assignments, generations, and other standards.
Terminating StandardsStop if any of the following criteria are achieved: [ TolX = TolFun = 10 17 ] , [ Iterations = 900 ] , [ TolCon = 10 19 ] , [ L = 10 20 ] , [ MaxFunEvals = 274,000 ] .
Evaluation of lossFind the value of W and L taking by Equations (6)–(13).
TuningApply ‘fmincon’, update W and find loss L taking into consideration Equations (6)–(13).
SaveStore W G A I P A , loss L, function counts, and iterations with time.
IPA procedure
Disclaimer/Publisher’s Note: The statements, opinions and data contained in all publications are solely those of the individual author(s) and contributor(s) and not of MDPI and/or the editor(s). MDPI and/or the editor(s) disclaim responsibility for any injury to people or property resulting from any ideas, methods, instructions or products referred to in the content.

