Article

A Novel Artificial Multiple Intelligence System (AMIS) for Agricultural Product Transborder Logistics Network Design in the Greater Mekong Subregion (GMS)

by
Rapeepan Pitakaso
1,
Natthapong Nanthasamroeng
2,
Thanatkij Srichok
1,
Surajet Khonjun
1,
Nantawatana Weerayuth
3,
Thachada Kotmongkol
4,
Peema Pornprasert
4 and
Kiatisak Pranet
4,*
1
Artificial Intelligence Optimization SMART Laboratory, Industrial Engineering Department, Faculty of Engineering, Ubon Ratchathani University, Ubon Ratchathani 34190, Thailand
2
Artificial Intelligence Optimization SMART Laboratory, Engineering Technology Department, Faculty of Industrial Technology, Ubon Ratchathani Rajabhat University, Ubon Ratchathani 34000, Thailand
3
Artificial Intelligence Optimization SMART Laboratory, Mechanical Engineering Department, Faculty of Engineering, Ubon Ratchathani University, Ubon Ratchathani 34190, Thailand
4
Artificial Intelligence Optimization SMART Laboratory, Logistics Management Department, Faculty of Industrial Technology, Ubon Ratchathani Rajabhat University, Ubon Ratchathani 34000, Thailand
*
Author to whom correspondence should be addressed.
Computation 2022, 10(7), 126; https://doi.org/10.3390/computation10070126
Submission received: 18 June 2022 / Revised: 13 July 2022 / Accepted: 18 July 2022 / Published: 20 July 2022
(This article belongs to the Special Issue Transport and Logistics Optimization Solution)

Abstract

:
In recent years, agriculture products have contributed to 28.75% of Thailand’s GDP. China, Vietnam, Myanmar, Cambodia, Laos and Vietnam are the main markets for agricultural products. The annual export volume exceeds 119,222 million THB. The majority of them are shipped over Thailand’s land borders to its neighbors. Small and medium-sized farmers make up more than 85% of those who produce agricultural items. Numerous scholars have studied the transportation methods used by the Greater Mekong Subregion (GMS) nations along the economic corridor, but the majority of them have concentrated on import–export operations involving sizable firms, which are not applicable to the transportation of agricultural products, particularly when attention is paid to small and medium-sized farmers. In this study, mixed-integer programming (MIP) is presented to design an agricultural product logistics network. In order to prolong the lifespan of the container used, the MIP’s primary goal is to maximize the total chain profit while maintaining the lowest container usage possible. The approach was developed to increase small and medium-sized farmers’ ability to compete. Small and medium-sized farmers bring their products to an agricultural product collecting center, also known as a container loading facility. After that, skilled logistics companies distribute the goods. In order to convey the goods to the final clients in neighboring nations, the proper locations of the containing loading centers, the correct transportation option and the borders must be decided. The issue was identified as multi-echelon location–allocation sizing (MELLS), an NP-hard problem that cannot be handled in an efficient manner. To solve a real-world problem, however, efficient techniques must be supplied. AMIS, an artificial multiple intelligence system, was created to address the suggested issue. AMIS was developed with the goal of leveraging a variety of methods for local search and development. There are several well-known heuristics techniques employed in the literature, including the genetic algorithm (GA) and the differential evolution algorithm (DE). With respect to the improved solutions obtained, the computational results show that AMIS exceeds the present heuristics, outperforming DE and GA by 9.34% and 10.95%, respectively. Additionally, the system’s farmers made a total of 15,236,832 THB in profit, with an average profit per container of 317,434 THB and an average profit per farmer of 92,344.44 THB per crop. The container loading center uses 48 containers, with a 5.33 container average per container loading center (CLC). The farmers’ annual revenues were previously less than 88,402 THB per family per year, so we can predict that the new network may increase customers’ annual income by 4.459% for each crop.

1. Introduction

The GMS is one of the developing world’s most successful cases of economic integration and transition. While the rest of Asia was busy expanding and integrating with the global economy, the GMS remained extremely impoverished and isolated for a large part of the 1970s and early 1980s. This is the result of protracted conflict and centralized planning in Thailand, Cambodia, the Lao People’s Democratic Republic (Lao PDR), Myanmar and Vietnam (TCLMV).
However, the “TCLMV” nations started a slow process of reform and liberalization in the middle of the 1980s. As a result of the TCLMV nations’ shift to a market-based system, the GMS has become one of the most active subregions around the globe. The GMS has expanded more quickly over the past 20 years than all of East Asia and the Pacific combined, with the TCLMV nations being a major contributor to this growth. Despite the Asian financial crisis in 1997–1998, given their tenuous connections to the world’s financial systems at the time, the TCLMV countries continued to experience good growth. This led to a decade of increasing openness and integration with the global economy, though these countries were not as resistant to the more recent global financial crisis (GFC), with steep declines in growth that have only lately started to reverse. Agriculture, which historically made up the largest portion of value added in the TCLMV countries, gradually declined along with the steady economic expansion preceding the GFC. Industry, manufacturing and services now make up a larger portion of the value added in the subregion.
The Asian Development Bank (ADB) launched the GMS Economic Program in 1992. Cambodia, Lao PDR, Myanmar, Thailand, Vietnam and Yunnan Province of the People’s Republic of China (PRC) were the initial participants in the GMS initiative. The PRC’s Guangxi Zhuang Autonomous Region joined the GMS in 2004. A prime example of market integration, as opposed to institutional integration, is the GMS program. Market integration relies on unofficial institutions that provide public and quasi-public goods in order to lower the transaction costs related to the international movement of goods, services and other production factors, in contrast to institutional integration, which is characterized by legal agreements and institutional arrangements that promote preferential trade among members. The GMS agenda has focused on the supply of physical infrastructure with public good features as a program of market-based integration (e.g., cross-border infrastructure). In fact, most of the GMS economies still lack adequate infrastructure of any kind, and the GMS program has prioritized removing this obstacle. Through projects such as the East–West, North–South and Southern economic corridors, a network of roadways connecting the region is being built, lowering the cost of moving people and commodities from one end to the other.
Numerous academics have researched how to enhance the GMS region’s economy, environment, social conditions and cross-border trade. Paul et al. [1] examined the potential of crop–livestock integration to reduce trade-offs between the economic and environmental effects of smallholder farming systems in transition. Different stages of agricultural transition can be seen in Ratanakiri, Xieng Khouang and the Central Highlands. Economic and population growth, in conjunction with infrastructure development, improved market access, and government policies have resulted in a variety of profound and multifaceted transition pathways. These pathways differ geographically, with respect to characteristics and rate of change, and represent different stages of agricultural transition in Vietnam, Cambodia and Laos [2]. They are fueled by complex land use decision-making processes and have resulted in a diverse landscape mosaic throughout the region [3]. Yang et al. [4] showed that GMS regional power connectivity is a complicated undertaking that is influenced by a variety of mutually reinforcing and unpredictable factors. In such circumstances, it makes sense for policymakers to focus their attention on specifically defined internal electricity system problems such as inadequate infrastructure, a lack of techn--ical expertise, and disorganized regulatory procedures in order to enhance regional power connectivity. Wu et al. [5] examined useful remote sensing indicators for ecological and environmental assessments that can serve as a solid foundation for decision making in support of the sustainable development of the ecological environment in the greater Mekong subregion, as well as technological support for the creation of a biodiversity corridor.
The majority of research articles concern transportation planning in the GMS region, -with a focus on how to build infrastructure to effectively connect all the GMS countries. Shibasaki et al. [6] analyzed the potential effects of infrastructure improvement and other related policies on international logistics in Cambodia with a focus on the inland waterway transport (IWT) connecting Phnom Penh (PP) and Ho Chi Minh (HCM) via the Lower Mekong Delta, and they identified challenges and issues that need to be resolved to enhance barge navigation along the Mekong. They also revealed the current status of international transport in the GMS, particularly traffic routes to/from Cambodia.
The general map of the GMS’s economic corridors, which are utilized to carry commodities for both import and export purposes, is shown in Figure 1. The corridor construction of the main road is supported by ADB, and there is a yearly congress held to update the construction progress in every GMS region. The products have been moved around the GMS using all major roadways. The majority of transportation firms collaborate with large import–export companies. A few previous articles have covered the topic of how to encourage import–export to and from SMEs.
Today, exported agricultural products, including rice, cassava, sugarcane and rubber, increasingly play a significant role in the economic system of the Greater Mekong Subregion (GMS). More than 50% of GMS citizens are farmers, and 28.75% of their GDP is from the agricultural sector. According to the Department of Business Economics, the Ministry of Commerce and the Royal Thai Government, agricultural exports to Asian nations increased by 25.19% from 2005 to the year 2020, totaling 119,222,250,000 THB. Over 85% of these were exported through the borders of countries that are members of the GMS. In Thailand, 98.603% of farmers are small and medium operations; only 1.397% are large companies.
Morini et al. [8] investigated the relationship between internal and external hurdles in this context and identified the barriers affecting the export of small and medium-sized nontech enterprises in emerging countries. They discovered that the main factors impeding SME development in the import–export market were a lack of knowledge and scarce resources. According to the World Bank, import–export businesses need to boost their operations’ dependability, predictability, safety and competitiveness. Ports require a lot of land, and automated cranes and vehicles make stacking crane changeover zones more productive, allowing for more effective land use and allocation. Modern automated machinery also helps prevent crashes and other physical harm because it is quick, affordable and involves minimal maintenance. However, it is not simple for SMEs to join and take on a significant role in the import–export industry.
This article proposes the following contributions to logistics research.
(1)
We design a logistic network for the trade of agricultural products across GMS countries;
(2)
Small and medium (SMEs) farming operations are the research’s target group to promote the design of a logistical export network;
(3)
The design of a logistics network for SME’s trade of agricultural products is illustrated using mixed-integer programming;
(4)
The novel heuristics is presented for the first time in this study and is compared to well-known heuristics proposed in the literature;
(5)
A multi-objective artificial multiple intelligence system is used in conjunction with TOPSIS to optimize the total profit of the system while minimizing the number of containers used to extend the container’s lifetime.
The paper is structured as follows. Section 2 presents the related literature, and Section 3 presents the mathematical model that represents the network design. Section 4 and Section 5 present the proposed methods and computational results, and Section 6 presents the research’s conclusions and outlook.

2. Literature Review

The GMS is a group of six countries in the northeast of Southeast Asia: Cambodia, the Lao People’s Democratic Republic, Myanmar, Thailand, Vietnam and China [9]. Land transportation is the most popular transportation mode in the GMS. However, the operations management standard of land transportation in the GMS needs to be improved. The quality of roadway infrastructure in GMS countries is not the same. Road conditions in Thailand and China are significantly better than they are in the other countries. Tollways and ring roads are found only in Myanmar and Vietnam, where city congestion has obstructed the efficient flow of goods delivered by trucks during rush hour [10,11].
Ramachandran et al. [12] proposed a holistic, multifaceted approach to strengthening infrastructural linkages and facilitating cross-border trade by first building a transboundary road that connects two economic nodes across marginalized areas. Step two involves facilitating environmentally and socially responsible investment in the newly connected areas as a means of creating livelihoods. The North–South Economic Corridor Strategy and Action Plan describes investment potential as the corridor enters its second phase of development (SAP). Andersson et al. [13] examined factors affecting the efficacy of freight logistics services after the processes of economic liberalization and deregulation, with a focus on the development of the Lao freight logistics industry. The study focused on two important facets of the Lao freight logistics industry: (i) the development of a private freight logistics industry after the New Economic Mechanism (NEM), which gradually opened the Lao economy to the rest of the world; and (ii) the sector’s awareness of the opportunities and difficulties presented by the Lao PDR’s membership in the ASEAN, the GMS and hopefully the WTO. Munir et al. [14] proposed paying attention to mitigation strategies based on global standards to protect Pakistan’s ecosystem, wildlife, habitat and ecology if these economic corridors are to be considered green initiatives in the China–Pakistan Economic Corridor (CPEC). As previously mentioned, the majority of articles discussing GMS transportation focus on a variety of issues, including the impact on the environment, the social implications and the design of infrastructure. However, there is a dearth of research addressing the design of logistics networks, particularly for agricultural products, which require more attention than other types of products.
The design of a logistics network begins with the supplier and considers every step of the logistical process until the client receives the finished product. Information flow and the overall flow of goods are both logistically organized. This includes the management of distribution centers, warehouses, container yards, trailer yards, consignment shops, trans-shipment sites, hubs and consolidation centers, as well as all stages of the material flow. For businesses, network design is a crucial topic. It requires in-depth research to guide important choices, such as: establishing the physical flows between the various links in the supply chain and distribution flows, as well as the location of the right number of factories, platforms and warehouses and how to specialize (or not) factory production lines and stock goods for the best customer delivery terms. The purpose of this research is to design a logistics network for agricultural product trading between Thailand, Laos and Cambodia. Firstly, district agricultural cooperatives (AC) are determined as the collectors who received agricultural products from farmers in the district. Then, agricultural products are transported to the wholesaler agricultural markets (WSAM), the border checkpoint (BC) and the end markets in each country.
Logistics network design has been used in a variety of research fields, including railway freight station planning [15], port planning [16] and airport planning [17]. For instance, Teye et al. [16] investigated the location of a multimodal container port while considering several user preferences. Irawan et al. [18] presented a two-stage capacitated facility location issue with multicommodity and multilayer capacities, taking the order of decisions into account. These analyses were conducted from the viewpoint of enterprise logistics, including manufacturing companies and third-party logistics. The logistics park is a transfer or distribution location developed by the local logistics authority to satisfy urban development needs, in contrast to multimodal or intermodal logistics facilities. Despite the fact that logistics parks are essential components of these systems, little attention has been paid to them in the research [19].
The transportation problem for agricultural products has been widely studied by many researchers [20,21,22,23,24,25,26,27,28]. Agricultural products are typically perishable. Perishable products need intensive care during transportation to the destination. Distribution planning problems with stochastic and time-dependent travel times with time-varying temperatures were modelled [20,29,30,31]. Chueanun and Suwandechochai [32], Derigs et al. [33], Mendoza et al. [34] and Reis and Leal [35] proposed different shipping strategies, different numbers of actors in the transportation chain and different limitations of the transportation modes. In our study, the transportation time was (the time from the origin to the destination) needed to be within a certain limit. As our products need to be transported via border checkpoints, this can delay the transportation time, with a hold-up while documents are checked. We selected borders as candidates for the shipping route based on which were most convenient for international trade shipping.
Transported agricultural products pass through different actors in the supply chain, which form a transportation or service network. The service network design (SND) problem has been modeled and presented by Pedersen et al. [36], Andersen et al. [37,38,39], Moccia et al. [40], Thiongane et al. [41] and Li et al. [42].
Jiang et al. (2020) developed a bilevel optimization model to capture the decision-making behavior of stakeholders under the presumption that there was only one planner and one carrier in the regional logistics network. In this study, we improved the aforementioned characteristics and considered the salient characteristics of various local logistics agencies and their coordination framework in the creation of logistics parks. An increasing trend in logistics network design is to take coordinated procedures across various logistics companies into account [43]. Meng et al. [44] constructed a multimodal hub-and-spoke transport network for various stakeholders under the assumption that the budget was only managed and used by the central planner. Wang et al. [45] investigated a regional link capacity planning problem with numerous planners, considering user choice behavior, and examined the effects of noncooperation and centralized cooperation methods among these planners on the functionality of traffic networks. Neamatian Monemi et al. [46] looked at the location of a hub while considering the competition between two logistics service providers. For the logistics park placement issue, Rao et al. [47] offered an evaluation system based on cost and the environment. Jiang et al. [48] presented the formulation of a mathematical model to evaluate the impacts of non-budget-sharing, centralized budget-sharing and conditional budget-sharing methods on regional low-carbon logistics network architecture for numerous cities. Reduced CO2 emissions from freight transport activities inside a neighborhood logistics network are the main objective.
In conclusion, the objective function employed in earlier studies on logistical network design is mostly focused on the total cost, total profit and environmental impact. According to Youd [49], there was predicted to be a worldwide scarcity of shipping containers in 2020–2021. The COVID-19 pandemic, which was principally to blame, drastically increased the cost of shipping and containers and lengthened business turnaround times. Therefore, when creating the agricultural logistics network architecture for this research, we examined not only the overall profit but also how to use the fewest containers possible during shipping. According to another viewpoint from the literature, the design of an agricultural product logistics network, in particular a network that aims to improve the situation of small and medium farming enterprises in the model, has not been presented in the prior literature. As a result, this is the main contribution of this research.
Tang et al. [50] relaxed the fixed capacity assumption of the logistics park and proposed a hybrid Tabu search method to address this design problem with a variable capacity. Other methods that scholars have presented to solve logistics network design are a hybrid heuristic algorithm comprising an improved k-medoids clustering algorithm and an extended-reference-point-based nondominated genetic algorithm [48], iterated local search [51], hybrid GA (HGA) [52], hybrid variable neighborhood search and MOEA [53]. In this research, we develop novel metaheuristics to solve the problem, because the heuristics presented previously cannot be directly applied to solve the proposed problem. The proposed method is called an artificial multiple intelligence system (AMIS), which is discussed for the first time in this paper. AMIS is a novel heuristic that employs Gardner’s Theory of Multiple Intelligences [54]. The proposed method comprises four steps: (1) generate an initial set of work packages (WPs); (2) perform the WP execution process; (3) update the heuristics information; and (4) repeat steps (2)–(3) until the termination condition is met. Details of the proposed method are given in Section 3.

3. Problem Definition and Mathematical Model

3.1. Problem Definition

Fresh agricultural products are transported from the farmers or the farmer’s cooperative to the container loading center (CLC). The container loading center (CLC) or domestic distribution center is used as the agricultural product collecting and loading center. The products from the farmers or the farmers cooperation are packed here. The containers are shipped to the borders in order to pass through the base and the target country’s customs area. Afterward, the containers are transported using a trailer head from the country in which the end market is located. When the containers arrive at the end markets, the agricultural products are unloaded. The objectives are (1) to maximize profit for the entire agricultural chain, (2) to minimize the time until the container arrives with the end customers and (3) to minimize the number of containers used in the system. The framework of the proposed problem is shown in Figure 2.

3.2. Mathematical Model Formulation

In this section, a mathematical model of MELAP for agricultural water resources is introduced. The indices, parameters and decision variables used in the mathematical model to represent the problem are shown below.
  • Indices
i  Container loading center i (i = 1, 2, 3, …, I)
j  Farmers j (j = 1, 2, 3, …, J)
g  Container number g (g = 1, 2, 3, …, G)
k  Border k (k = 1, 2, 3, …, K)
l  End market l (l = 1, 2, 3, …, L)
v  Vegetable type v (v = 1, 2, 3, …, V)
  • Parameters
I  Number of Container Loading Centers (CLC)
J  Number of farmers
G  Total number of containers
K  Number of border checkpoints
L  Number of end markets
D j i  Distance from farmer j to CLC i (km)
T k l 1  Transportation fuel cost from border k to end market l (THB/km)
T i k 2  Transportation fuel cost from CLC i to border k (THB/km)
T j i 3  Transportation fuel cost from farmer j to CLC i (THB/km)
M v l  The demand of vegetable v at end market l (ton)
O v j 1  Available vegetable v at farmer j
H k l { 1   if   border   k   is   allowed   to   deliver   goods   to   end   market   l 0   otherwise
G G  Great number, which is set to 50,000
B v g 4  Loading cost of vegetable v to container g (THB/ton)
B g k 6  Operating time of trailer head changing of container g at border k
P g  Capacity of container g (m2)
E i k  Distance from CLC i to border k (km)
V  Total number of vegetable types
S v l  Sale price of vegetable v at end market l (THB)
N k l  Distance from border k to end market l (km)
P g k 2  Operating time of border k per one container
A  Traveling time per kilometer (min per km)
B g k 1  Operating cost of changing the trailer head at border k (THB)
B g i 2 { 1   if   container   g   is   located   at t   CLC   i 0   otherwise
B v 3  Space required to pack 1 ton of vegetable v (m2/ton)
B g i 5  Time that container g starts to load the vegetables at CLC i (min, starting at 6:00 a.m.)
B g l 7  Time that container g must arrive at end market l (number of min, counting from 6:00 a.m. that day)
  • Decision Variables
X j g i { 1   if   farmer   j   delivers   goods   to   container   g ,   located   at   CLC   i 0   otherwise
Z g i k l { 1   if   container   g   is   delivered   from   CLC   i   to   border   k   to   end   market   l           0   otherwise                              
Y g { 1   if   container   g   is   in   use 0   otherwise                    
O v j g i 2  Number of vegetable v delivered to container g located at CLC i and delivered from farmer j
O v g 3  Number of vegetable v packed in container g
O g l 8  Arrival time of container g at market l (min, starting at 6:00 a.m.)
There are two objective functions of the proposed problem, given in Equations (1) and (2). Equation (1) tries to maximize the total profit of the system. It is composed of five terms: (1) the income from selling vegetable v at end market l; (2) the total transportation cost of container g from CLC I to border k and from border k to end market l; (3) the trailer head changing cost at border k; (4) the transportation cost of vegetable v from farmer j to CLC i; and (5) the loading cost of vegetable v into container g. Equation (2), the second objective function, tries to minimize the number of containers used in the system in order to save on container circulation, therefore prolonging the lifetime of the containers. Moreover, when the number of containers in use is smaller, it means that the empty space in the container is reduced; therefore, the efficiency of the container is increased. All 2 objectives have been minimized and subjected to 11 constraints, as follows. Constraint (3) stipulates that container g located at CLC i delivers to at most one pair of borders and end markets and only when container g is located at CLC i. Constraint (4) stipulates that container g delivers to end market l only when end market l is allowed to ship via border k. Constraint (5) stipulates that vegetable v is shipped from farmer j to container g located at CLC i only when farmers j deliver the goods to container g. Constraint (6) stipulates that farmers can ship to container g located at CLC i only when container g is available at CLC i. Constraint (7) stipulates that vegetable v is shipped from farmer j if it does not exceed its availability at farm j. Constraint (8) defines the amount of vegetable v packed in container g. Constraint (9) stipulates that vegetable v is be shipped to market l more than its demand. Constraint (10) stipulates that container g’s vegetables do not exceed its capacity. Constraint (11) stipulates that farmer j must deliver container g to CLC i before loading can start. Constraint (12) stipulates that the container must arrive before its commitment time to market l, and constraint (13) stipulates that the arrival time of container g at market l must be less than the commitment time.
Objective Functions
M a x     Z = v , g , i , k , l S v l Z g i k l O v g 3 g , i , k , l Z g i k l ( T i k 2 E i k + T k l 1 N k l ) g i k l Z g i k l B k 1 j , g , i T j i 3   X j g i D j i v , g B v g 4 O v g 3
M i n   Z = g Y g
Subject to
k , l Z g i k l B g i 2 ( g = 1 , 2 , G   ;   i = 1 , 2 , 3 , , I )
 
Z g i k l   H k l ( g = 1 , 2 , G   ;   i = 1 , 2 , 3 , , I , k = 1 , 2 , , K ,   l = 1 , 2 , , L )
 
O v j g i 2 X j g i G G ( v = 1 , 2 , , V , g = 1 , 2 , G   ;   i = 1 , 2 , 3 , , I , j = 1 , 2 , , J )
 
j X j g i B g i 2   ( g = 1 , 2 , , G , i = 1 , 2 , , I )
 
g , i O v j g i 2 O v j 1   ( v = 1 , 2 , , V , j = 1 , 2 , , J )
 
O v g 3 = j , i O v j g i 2   ( v = 1 , 2 , , V , j = 1 , 2 , , J )
 
g , i , k Z g i k l O v g 3 M v l       ( v = 1 , 2 , , V , l = 1 , 2 , , L )
 
v B v 3 O v g 3 P g Y g   ( g = 1 , 2 , , G )
 
A D j i   X j g i B g i 5   ( g = 1 , 2 , , G , j = 1 , 2 , , J , i = 1 , 2 , , I )
 
Z g i k l ( P g k 2 + E i k + N k l + B g k 6 ) B g l 7 ( g = 1 , 2 , G   ;   i = 1 , 2 , 3 , , I , k = 1 , 2 , , K ,   l = 1 , 2 , , L )
 
B g l 8 B g l 7 ( g = 1 , 2 , G   ,   l = 1 , 2 , , L )
 

4. The Proposed Methods: Artificial Multiple Intelligence System (AMIS)

The AMIS is the novel metaheuristics inspired by Gardner’s Theory, or the Multiple Intelligences Theory [55,56,57,58]. The idea of fine-tuning the heuristic search space is to try to use multiple intelligences to operate the same task in order to obtain the most promising solution. We designed the choices of intelligences for the system to select a suitable one. The suitable one or the selected intelligence may change during the searching of the heuristics. The AMIS is composed of four steps: (1) generate an initial set of work packages (WPs); (2) perform the WP execution process; (3) update the heuristics information; and (4) repeat steps (2)–(3) until the termination condition is met. The AMIS can be explained stepwise, as follows.

4.1. Generate the Initial Set of Work Packages

The set of initial tracks was randomly generated. A track was decoded to represent the solution for the proposed problem. The encoding and decoding method were as follows.

4.2. Perform the WP Execution Process

Integer encoding was used to represent the proposed problem. Table 1 shows an example of the initial set of tracks ( X i j t ) . A WP has dimensions of 1 ×  D, and X i j t   . is WP number i with position j at iteration t. D is the total number of positions, set to be the number of farmers in the system plus the number of containers, the number of borders and the number of end markets. If we have 4 farmers, 8 containers, 3 borders, and 2 end markets, D equals 4 + 8 + 3 + 2 = 17. The example of the four WPs is given in Table 1.

4.3. Decode the Initial Work Package (WP)

The decoding method was used to mediate between the code shown in Table 2 and the network design problem or the proposed method. Basic information on the proposed problem is given in Table 2, Table 3, Table 4 and Table 5.
From the coded values shown in Table 1 and the basic data given in Table 2, Table 3, Table 4 and Table 5, the decoding method can be explained stepwise as follows.
(1)
Sort the position according to the value in position j of WP i ( X i j t ) in an increasing order. The results of the sorting are shown in Table 6.
(2)
Start the assigning process of all involved actors in the chain. The assigning process is as follows.
(2.1)
Fulfill the demand of goods from EM according to the sorting results. The first EM is the list of all needs.
(2.2)
The selection of the transportation network (border, CLC and farmers) uses the list as the rule (the first on the list is assigned first).
(2.3)
The amount of shipping based on the rule:
(1)
Try to use all space in the containers;
(2)
Farmers can split their product.
(2.4)
The assigning process stops when
(1)
There is no product available from the farmers;
(2)
All demand is fulfilled;
(3)
There are no containers available.
The results of the assignment process are shown in Table 7.
WPEp is the process whereby an individual WP selects the intelligence box (improvement box) to improve the solution quality. The WP was iteratively executed, independently of the previous iteration. The WP selected the WP in each iteration to perform WPEp. After the WPEp was executed, the heuristics information was updated. Selecting the intelligence boxes (IB selection) for WPEp was performed using Equations (14) and (15). Equations (14) and (15) involve the basic idea that the attractiveness for the IB depends on the previous history of the solution quality of the WPs that have been executed previously. The framework of the AMIS is shown in Figure 3.
S b t = F N b t 1 + ( 1 F ) A b t 1 + K I b t 1 b = 1 B F N b t 1 + ( 1 F ) A b t 1 + K I b t 1
P b t = { P M a x   i f   S b t P M a x S b t     i f   P M i n     S b t   P M a x P M i n   i f   S b t P M i n
Here, S b t is the attractiveness for IB b in iteration t. P b t is the probability of selecting IB b in iteration t. P M i n and P M a x are the minimum and maximum probability to select an IB (predefined parameters). P M i n is set to 0.2, and P M a x is set to 0.8 (obtained from the preliminary experiment). N b t 1 is the number of WPs that select an intelligence box (IB) b in the previous iteration. A b t 1 is the average objective value of all WPs that select IB b in the previous iterations. I b t 1 . is a reward value, which increases by 1 if IB b finds the optimal solution in the last iteration, but it is set to 0 otherwise. IB is the total number of IBs. F is the scaling factor (F = 2), and K is the improvement factor (K = 1).
The WP iteratively executes the selected IB. In our research, nine intelligence boxes were used. The basic idea for designing the intelligence boxes is to enhance the search capability. Three types of intelligence boxes were used: (1) diversification search intelligence boxes ( D i ), (2) intensification search intelligence boxes ( I n ) and (3) a search that has both D i and I n types. The intelligence boxes used in this research are shown in Table 8 and Equations (15)–(23).
In the above table, r j is a random real number in the range [−1, 1], and i j is a random number in the range [0, 1]. B j g b e s t is the best WP generated so far, and B h j p b e s t is the best WP of WP h. F1 and F2 are predefined scaling numbers. In this research, we used 0.5 and 0.5 as F1 and F2, respectively. If WP i uses IB b as the improvement method, WP i is defined as belonging to the set Z of WPs, and others are members of set A. I = ZA. I is the total number of WPs. We define sets Y n j t   a n d   Y m j t A   a n d   Y r j t Z . WP n and m are randomly chosen from the WP in set A, whereas WP r is randomly selected from set Z. The ρ position’s value evaporation rate is predefined and set to 0.05. The subiteration update position of Y i j q + 1 is executed using Equation (25), when q is a predefined parameter.
Y i j q + 1 = {     Y i j q   i f   f i r f i q     a n d   u p d a t e     f i r = f i q   a n d   Y r j q = Y i j q   Y r j q   o t h e r w i s e      
An IB execution process was used to improve the solution quality. Each IB executed q (constant predefined number) iterations. We call q a subiteration. CRh is an adaptive parameter that is set to be the crossover rate (CR). In this research, it is set to 0.95 and is gradually reduced to 0.6 depending on the current iteration and the number of iterations. The current best solution is unchanged by using Equations (26)–(29), where G, CRmax, CRmin, t and Tmax are the number of iterations, where the current best solution remains unchanged; the maximum value of CR (0.95); the minimum value of CR (0.6); the current iteration; and the maximum number of iterations, respectively.
S = C R m a x e x p [ [ G ( t / T m a x ) × 100 ] ]    
C R h = {       S                             i f   T m i n     D     T m a x T m a x   i f   D   T m a x                                                       T m i n   i f   D     T m i n                                                      
G = { G + 1                   i f   f i q f i q 1 1                         o t h e r w i s e
f i q = v = 1 V w v f i q v   ,  
Here, f i q  and f i q + 1 are the objective functions of Y i j q and Y i j q + 1 , respectively. f i q v is an objective function v ∈ (1,2,3,…,V) of track Y i j q , and V is the number of objectives of the model. wv is the weight of objective v and v = 1 V w v = 1 . In this case, there are two objectives: w1 represents the weight of objective 1, which is randomly selected from U [0.1, 0.9], and w2 is (1 − w1).
For each IB, q is a predefined parameter that is set to 100 iterations [59]. The Pareto front was used to keep the nondominated solution. f 1 ( y r ) and f 2 ( y r ) are the objective functions of objectives 1 and 2 of track r, respectively. Let ℜ represent a set of feasible solutions, with y = (y1, y2, , yi) giving the set of decision vectors and f v (y) = (   f 1 (y), f 2 (y),…, f V (y)) being the set of objective functions of vector y. y dominates y′ if, and only if, f v (y) ≤   f v (y′) for all v = 1,2,3,…,V.

4.4. Update the Heuristic Information

Some heuristic information needs to be updated in order to use it as information for the following iterations. The rule to update is shown in Table 9.

4.5. Repeat the Work Package Execution Process until the Termination Condition Is Met

The stopping criterion here is the maximum number of iterations, which is set to 1000–2000 (resulting from the preliminary test). The pseudocode of the AMIS is shown in Algorithm 1.
Algorithm 1. Artificial multiple intelligence system (AMIS)
Input: Population size (NP), Problem size (D), Mutation rate (F), Recombination rate (R), Number of intelligence boxes (NIB)
output: Best_Vector_Solution
begin
    Population = Initialize set of WPs
    IBPop = Initialize InformationIB(NIB)
    encode Population to WP
    while the stopping criterion is not met do
       for i = 1: NP
       Vrand1, Vrand2, Vrand3 = Select_Random_Vector (WP)
       for j = 1:D//Loop for the mutation operator
         Vy [j]= Vrand1 [j] + F (Vrand2 [j]+ Vrand3 [j])
       end for loop//end mutation operator
       for j = 1:D//Loop for recombination operation
         if (randj [0,1) < R) then
          u [j]= Vi [j]
         else
          u [j]= Vy [j]
       end for loop//end recombination operation
       //selected Intelligence box by RouletteWheelSelection
       selected_IB = RouletteWheelSelection(IBPop)
       if (selected_IB = 1) then
         new_u = AIM (u)
       else if (selected_IB = 2)
         new_u = PIM (u)
       else if (selected_IB = 3)
         new_u = DIM (u)
       else if (selected_IB = 4)
         new_u = BIM (u)
       elseif (selected_IB = 5)
         new_u = RT (u)
       else if (selected_IB = 6)
         new_u = IT (u)
       else if (selected_IB = 7)
         new_u = RT − AIM (u)
       else if (selected_IB = 8)
         new_u = SF (u)
       else if (selected_IB = 9)
         new_u = RESTART (u)
       if (CostFunction(new_u) ≤ CostFunction(Vi)) then
         Vi = new_u
       //Loop to update the heuristics information of the intelligence box
       for j = 1: NIB
          decode WP to obtain the solution for the problem
          Collect Pareto Front//Calculate TOPSIS
       end For Loop//End the update to the heuristics information
      end for Loop
   end
  return Best_Vector_Solution
end

4.6. The Methods Compared

We used two heuristics to compare with the AMIS: (1) the genetic algorithm (GA) and (2) the differential evolution algorithm. The GA algorithm used in this research was adopted from Metchell [60], and the DE was adopted from Pitakaso and Sethanan [24]. GA and DE use the Pareto front process, as explained in the previous section.

5. Computational Results and Framework

We coded the mathematical model in Lingo V.16 and coded the AMIS, DE and GA with C++, executing them using a PC Intel® Core™ i5-2467M CPU 1.6 GHz. Twenty-one randomly generated datasets and one case study were evaluated to compare the performance of the proposed methods. The computational results are divided into two groups: in Section 5.1, the effectiveness of the AMIS is revealed, and in Section 5.2, the behaviors of the AMIS in dealing with the proposed problem are described.

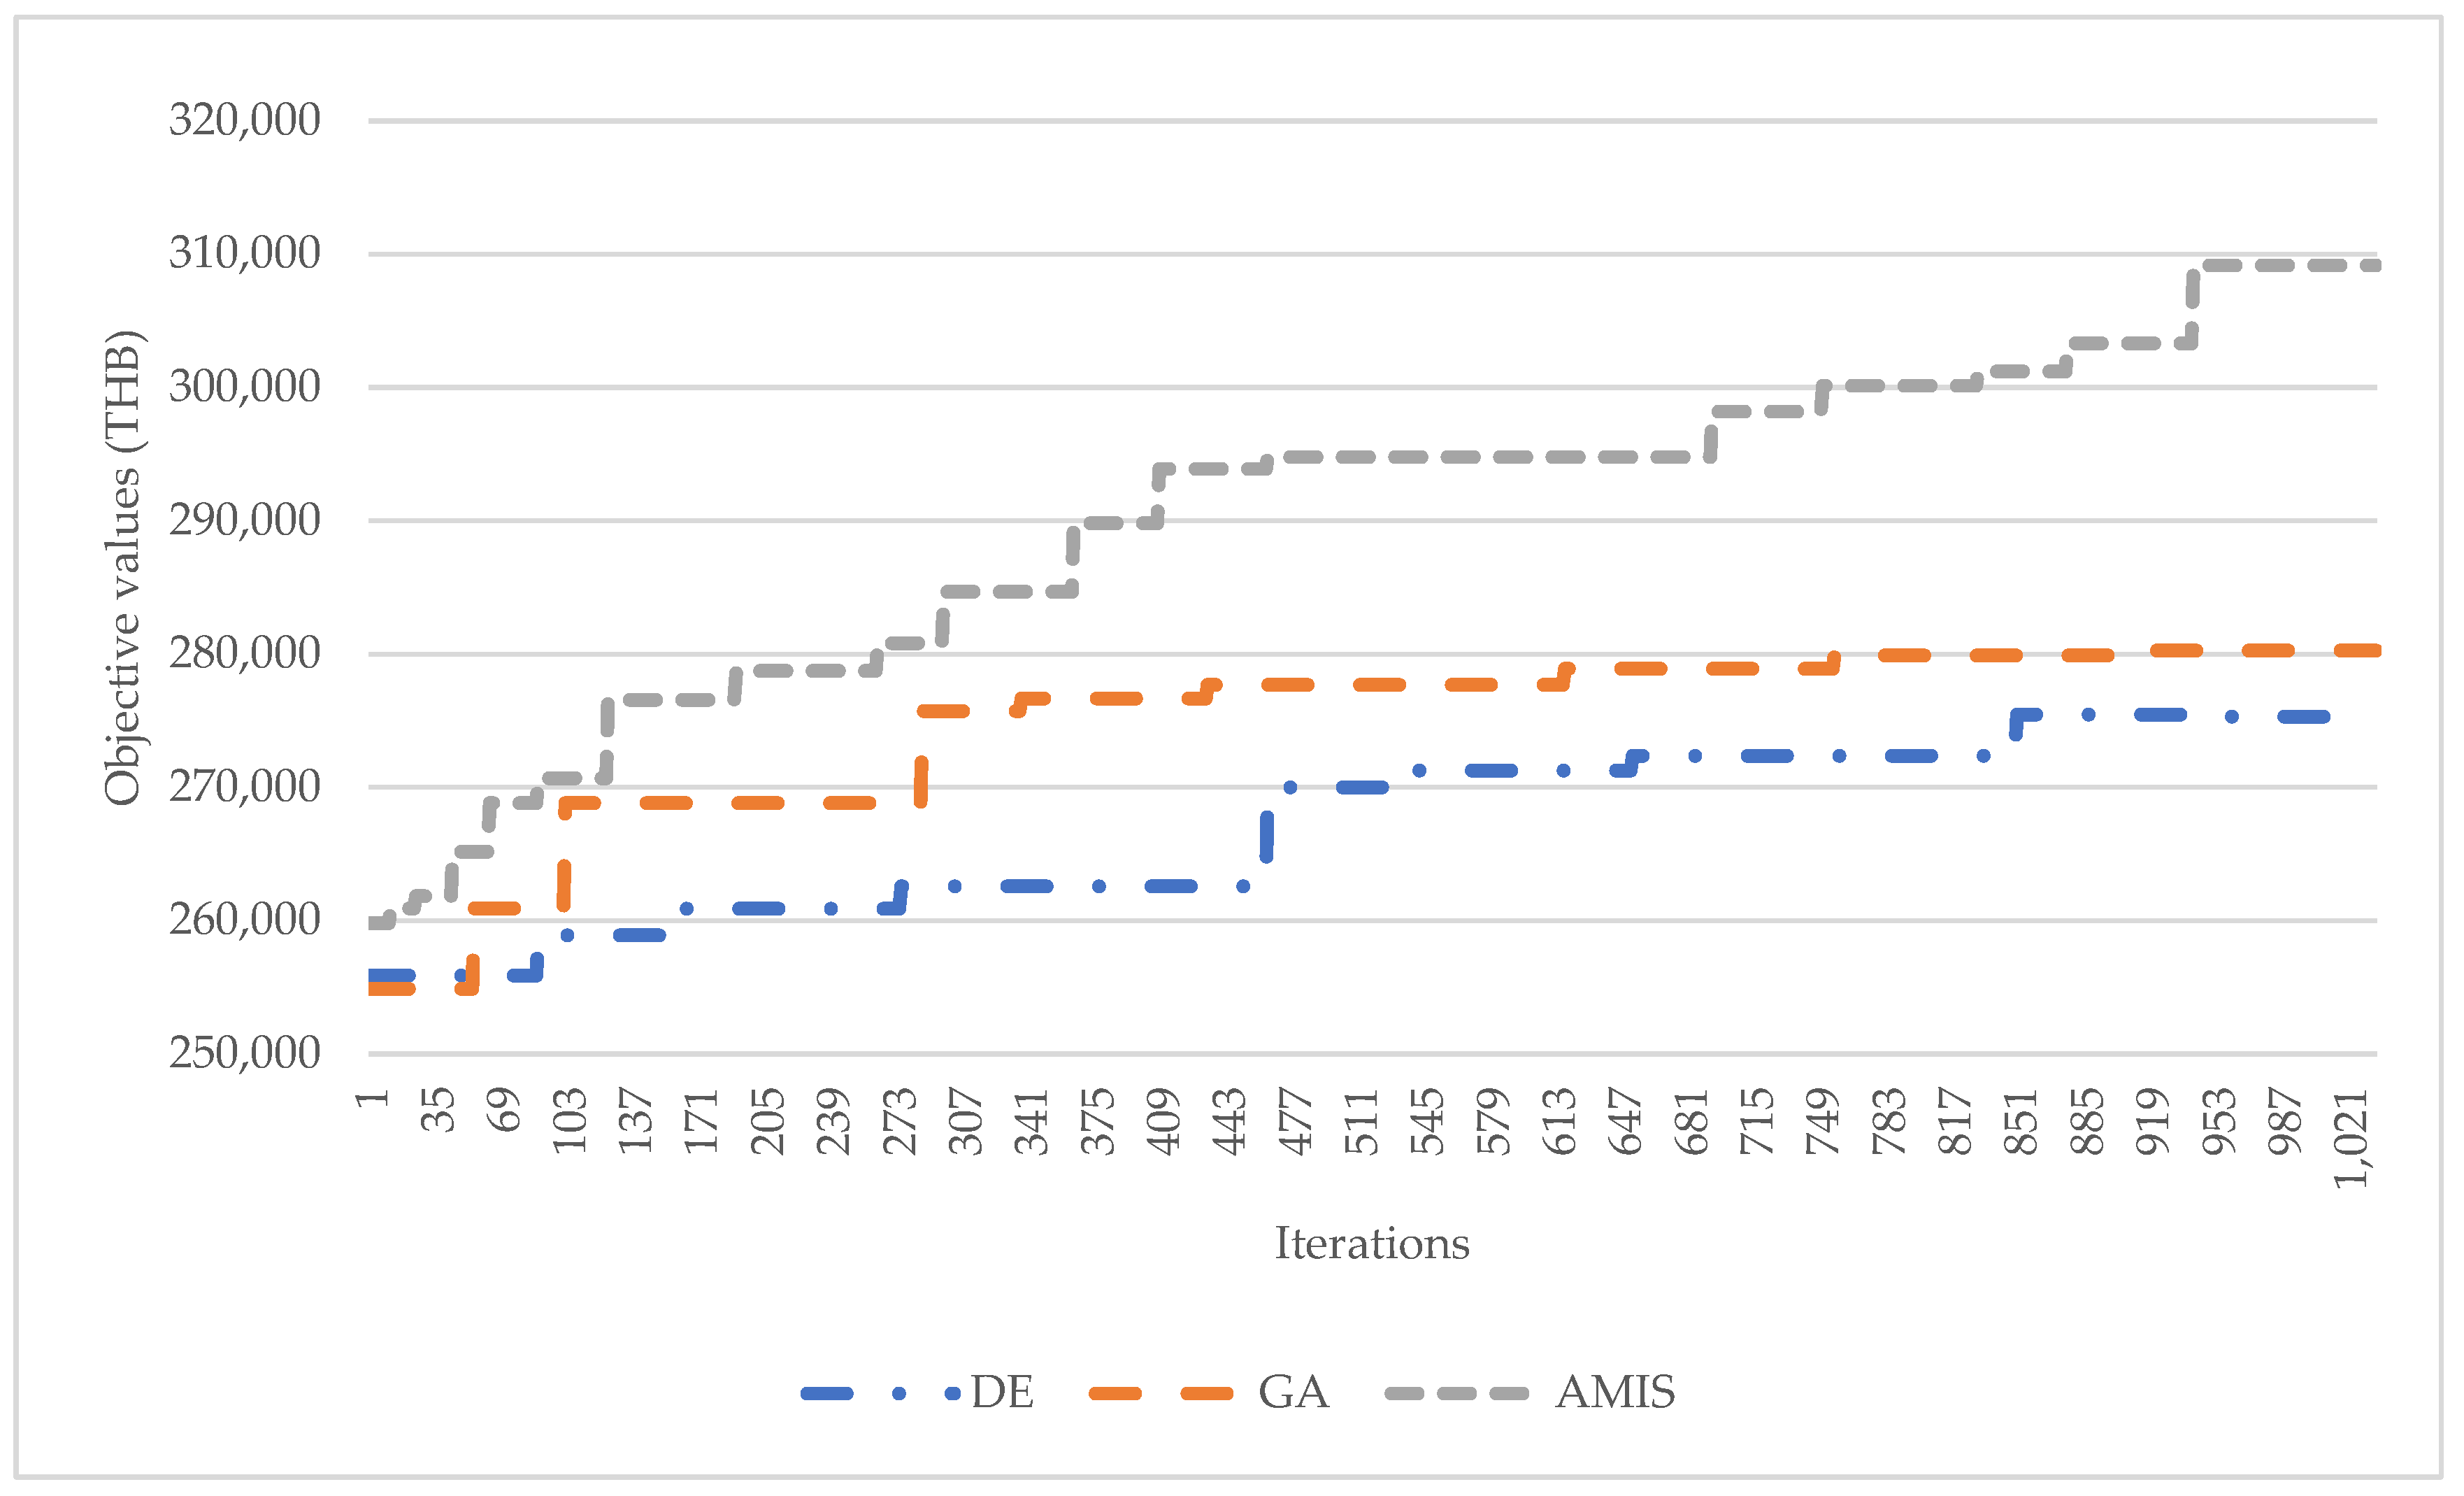
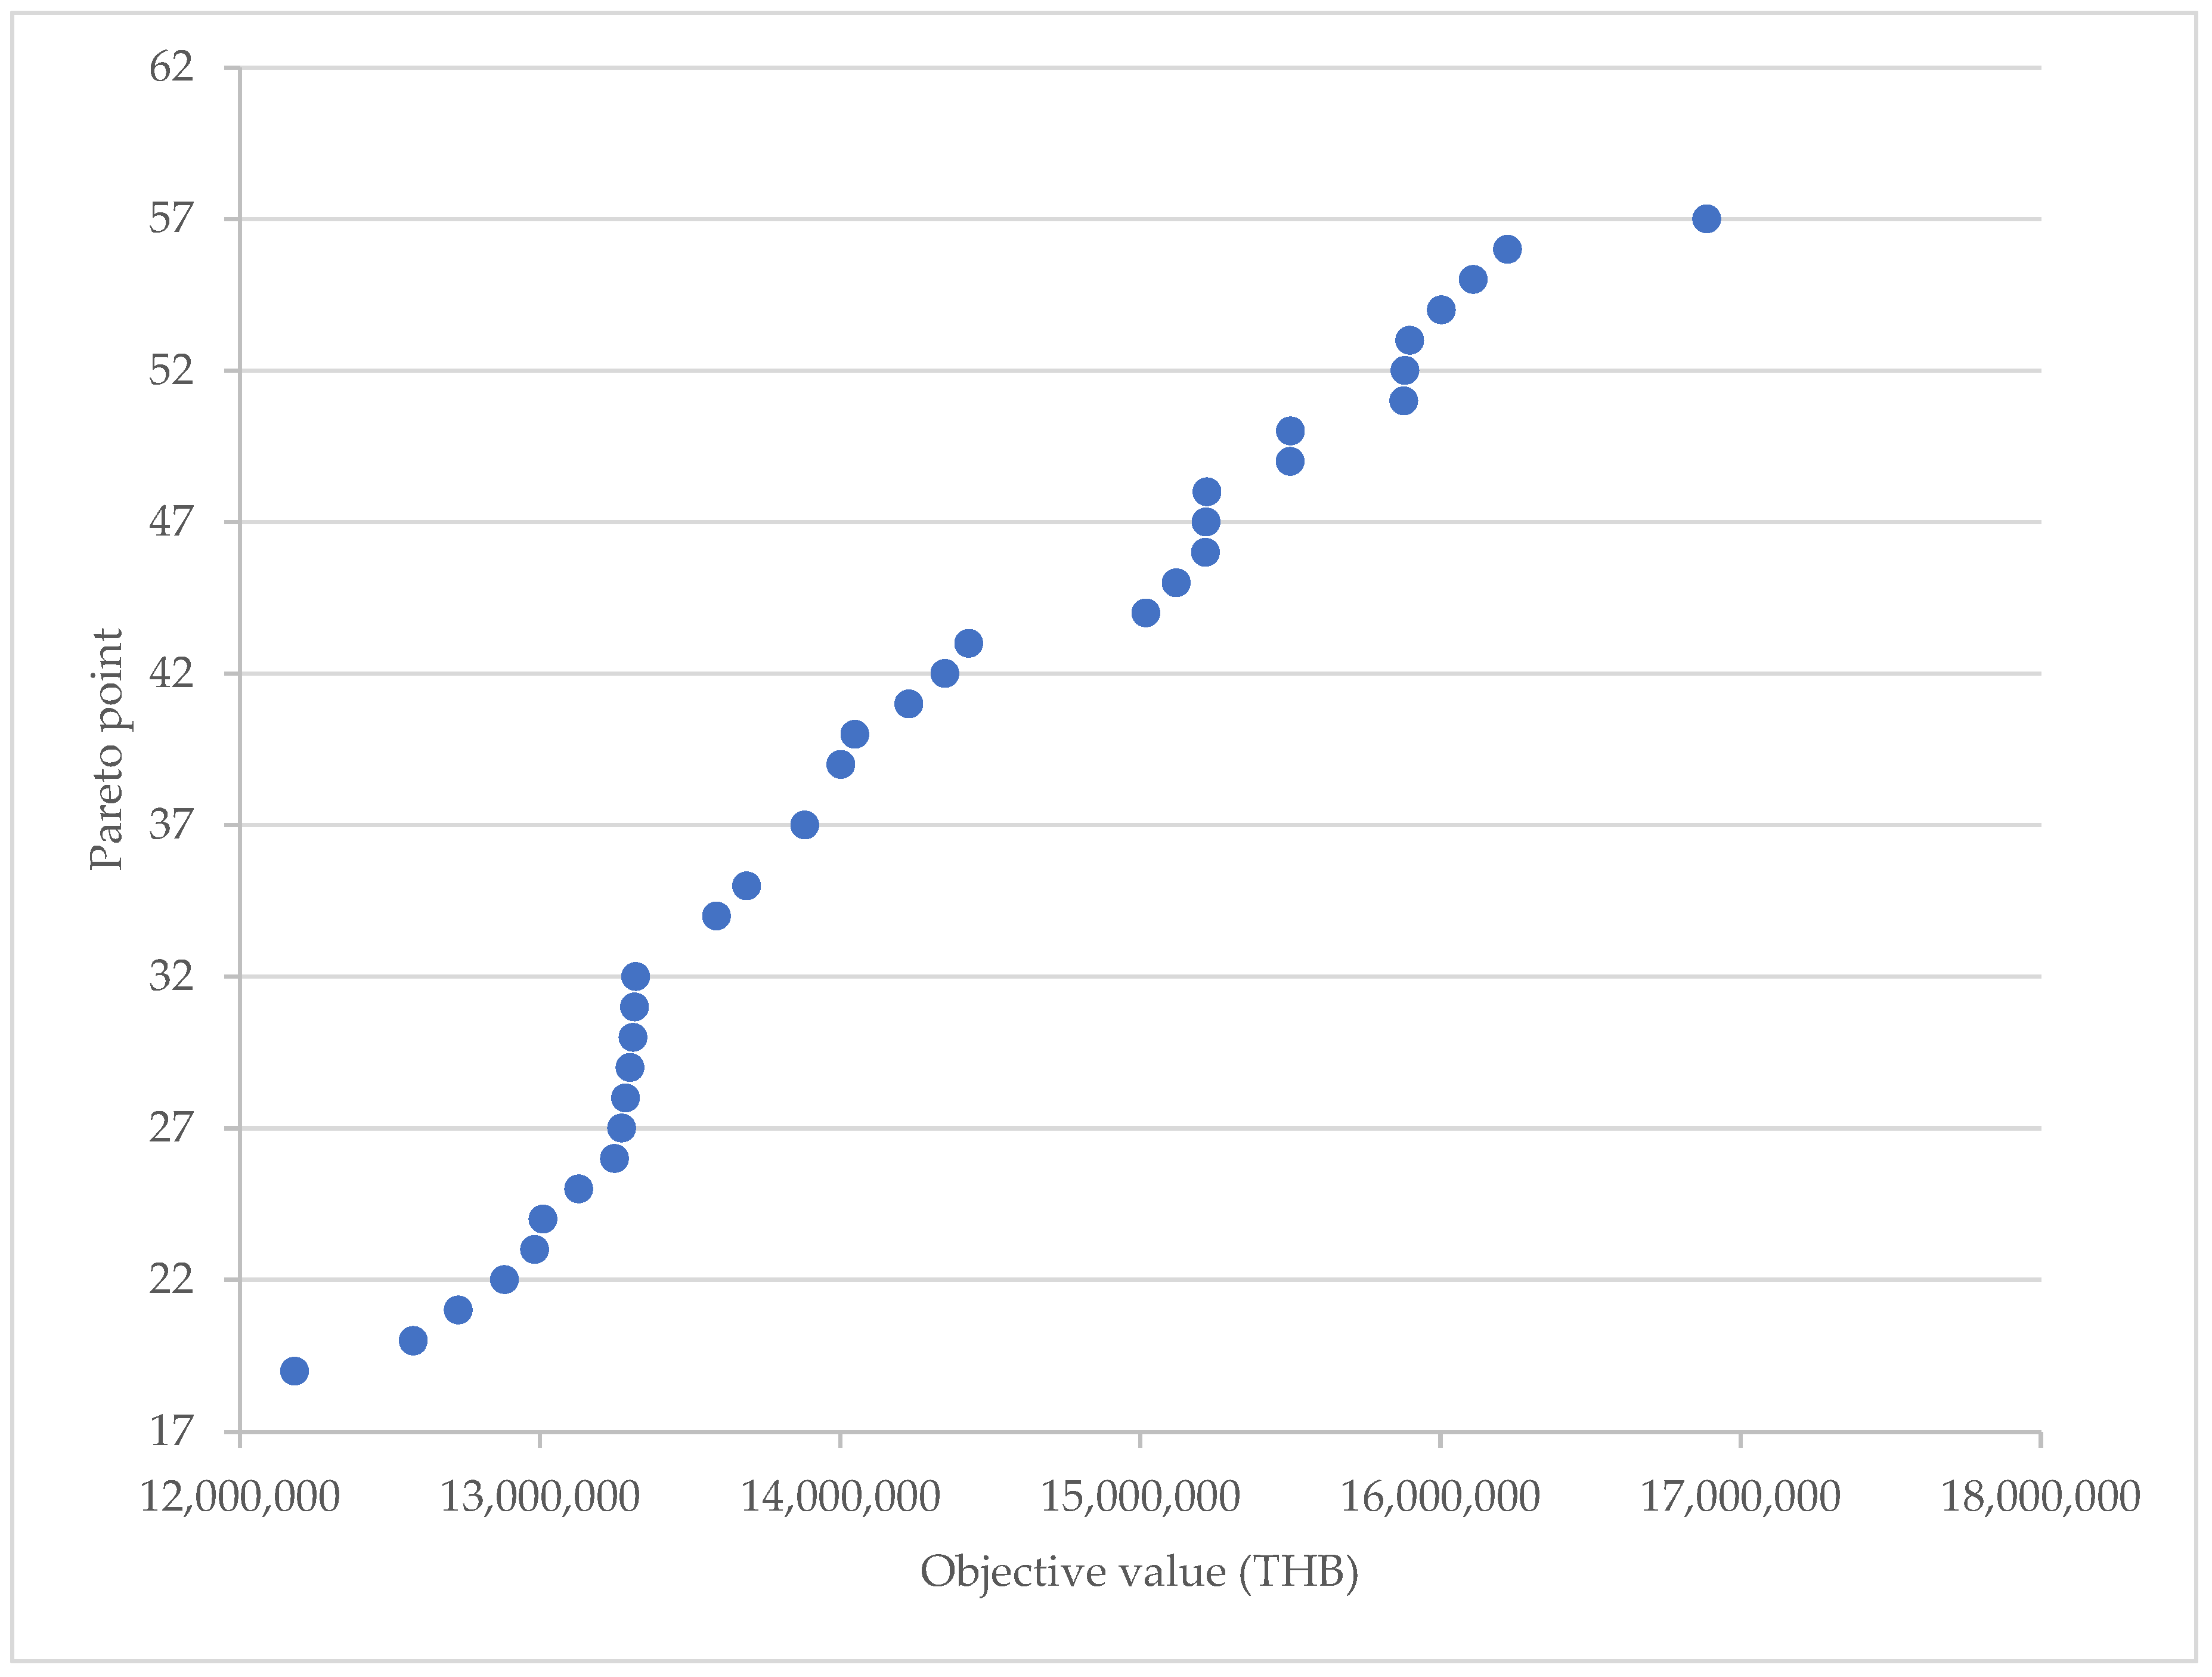
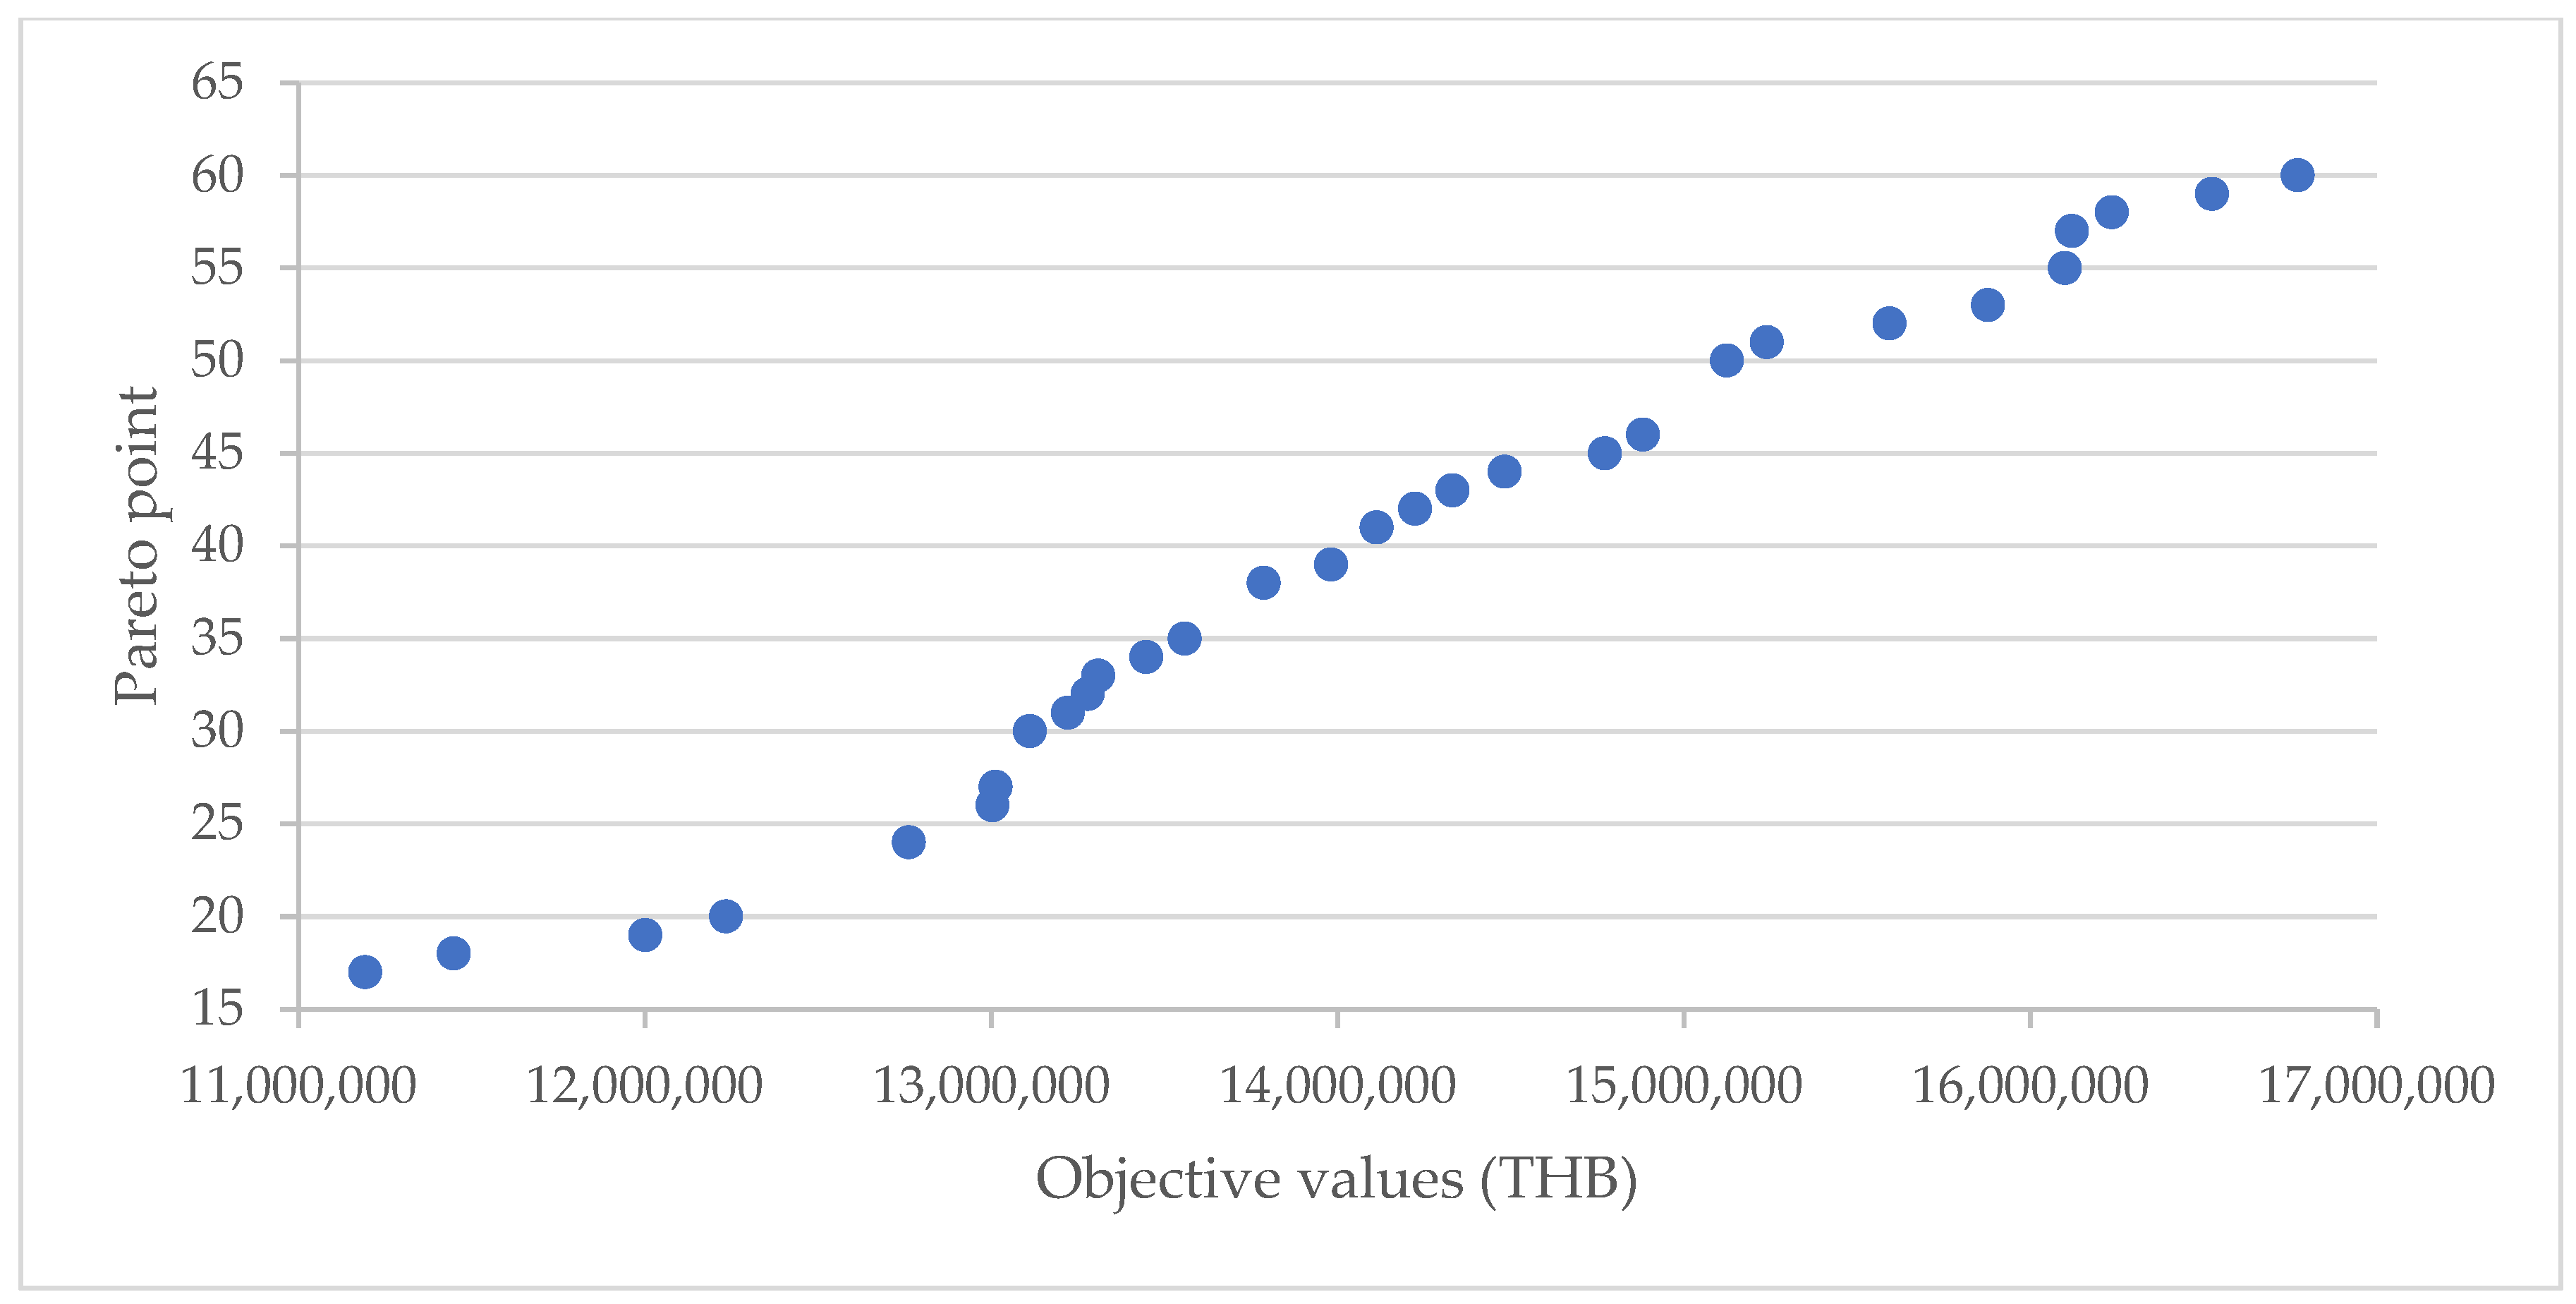
5.1. The AMIS’s Effectiveness

The effectiveness of the suggested technique (AMIS) was evaluated by comparing it to two existing heuristics: the differential evolution algorithm (DE) and the genetic algorithm (GA), both of which were derived from previous works [4,61]. In this section, we ran two different sets of experiments. A total of 22 test problems were used to gauge how well each algorithm, including the AMIS, performs. Each has a different number of vegetables, farmers, container loading centers, borders and end markets. The details of the test instances are given in Table 10. The problem instances were divided into two groups: (1) test instances with a small size(S-group) and (2) test instances with a large size (L-group). The small test instances are the test instances that can find an optimal solution within 24 h. The large test instances are the problems for which Lingo V.16 can find a lower bound, and the best solution was found for 480 h.
Instances S-1 to L-10 are randomly generated datasets, and L-11 is the case study in GMSG. The details of the data generated are given in Table 11.
The first experiment was performed on the small test instances. All 11 test instances were tested to optimality using equal weights of two objectives in Lingo V.16: the AMIS, DE and GA. Lingo V.16’s optimal solutions were recorded and are shown in Table 12. The AMIS, DE and GA used computational time as the stopping criterion, and it was set to 20 min. It was executed five times, and the best objectives out of five runs were taken as the representative of the method’s solution, as shown in Table 12.
Using the data in Table 12, we divided the profit generated from the entire chain by the number of containers used to obtain the average profit per container and to find the percentage difference of the proposed method with the optimal solution obtained by Lingo V.16; the results are shown in Table 13. The objective function in the mathematical model was modified to Equation (30). The results of the statistical test using the Wilcoxon signed-rank test are given in Table 13.
M a x   Z = v , g , i , k , l S v l Z g i k l O v g 3 g , i , k , l Z g i k l ( T i k 2 E i k + T k l 1 N k l ) g i k l Z g i k l B k 1 j , g , i T j i 3   X j g i D j i v , g B v g 4 O v g 3   g Y g
From the computational results in Table 12, Table 13 and Table 14, we can see that DE generates a profit per container that is on average 2.98% less than the optimal solution and the AMIS, and the profit per container generated by GA costs on average 2.88% less than that of Lingo and the AMIS.
Using the data in Table 14, we performed a further experiment to determine the effect of weight on the profit per container. In this experiment, the weight of profit (w1) was set to 0.2, 0.5 or 0.8. The results for the profit per container of each weight are shown in Table 15. The objective function was modified to create Equations (31) and (32).
M a x       A = w 1 [ v , g , i , k , l S v l Z g i k l O v g 3 g , i , k , l Z g i k l ( T i k 2 E i k + T k l 1 N k l ) g i k l Z g i k l B k 1 j , g , i T j i 3   X j g i D j i v , g B v g 4 O v g 3   ] w 2   g Y g
Z = A g Y g
From Table 15, we can see that the AMIS can find the optimal solution 100% of the time, even when using a different weight of w1, whereas DE and GA can find the optimal solution 24.24% and 30.30% of the time, respectively. We used the data from Table 13 to compute the average profit per container using various values of w1, ranging from 0.2 to 0.8. The average profit per container while using w1 equal to 0.2, 0.5 and 0.8 was, respectively, 377,292.30 THB, 390,933.27 THB and 405,787.28 THB. This indicates that the profit increases when using a higher value of w1. By 7.55 percent and 3.99 percent, respectively, using w1 equal to 0.2 and 0.5 differs from using w1 equal to 0.8. This is because the value of w1 is the concentration value of the model, focused on maximizing the average profit rather than minimizing the overall number of containers used in the system. When focusing on the average profit gained using various solution methods, we found that the average profit of Lingo V.16 [62], DE [61], GA [4] and the AMIS is 398,999.98 THB, 381,223.19 THB, 386,127.32 THB and 398,999.98 THB, respectively. When compared to the results from Lingo V.16, which always finds the optimal solution, the AMIS can find the optimal solution 100% of the time, whereas Lingo V.16 is not applicable to problems with a large size within an acceptable computational time. The AMIS can improve the solution quality of the GA proposed by [4] by 4.66% and the DE proposed by [61] by 3.33%.
The number of containers used in the system rises as w1’s value rises. The number of containers used increases when we focus more on making a profit, as previously mentioned, because the value of w1 directs the model to concentrate on finding the maximum profit, which is in conflict with the total number of containers used, because the rental and transportation costs of the containers used rise. The average number of containers used when utilizing different values of w1 was 11.23, 11.68 and 12.94, respectively. When employing the AMIS, DE and GA to solve the issue, the number of containers used exhibits a similar pattern to the results when using total profit as the criterion for analysis. Solutions generated by the AMIS are 12.92% and 13.01% better than those generated by the GA and DE, respectively.
The proposed problem is a special case of a capacitated network flow problem, which is defined as an NP-Hard problem [63]. However, it is not possible to solve the proposed problem by the exact methods within a reasonable computation time. Therefore, for test instances with a large size, the design of the experiment is different from that of test instances with a small size. The next experiment was performed on 11 large-sized test instances. The stopping criterion used in this experiment was computational time. Lingo V.16 ran for 480 h; if it could not find an optimal solution, the best objective found within the 480 h was used as a representative of the solution of Lingo V.16, and the DE, GA and AMIS used an equal execution time, which was set to 60 min. The computational results are shown in Table 16. The weight of w1 used in the experiment was 0.5, and thus the weight of w2 was also 0.5.
From the results shown in Table 16, we can discover the average profit per container (Table 17). The Wilcoxon signed-rank test results are shown in Table 16.
From the computational results in Table 16, Table 17 and Table 18, we can conclude that the AMIS significantly improves the solution quality of the proposed method, with the best objectives found by Lingo V.16 within 480 h. The AMIS, DE, and GA improve the solution quality by 20.24%, 10.95% and 9.34%, respectively.

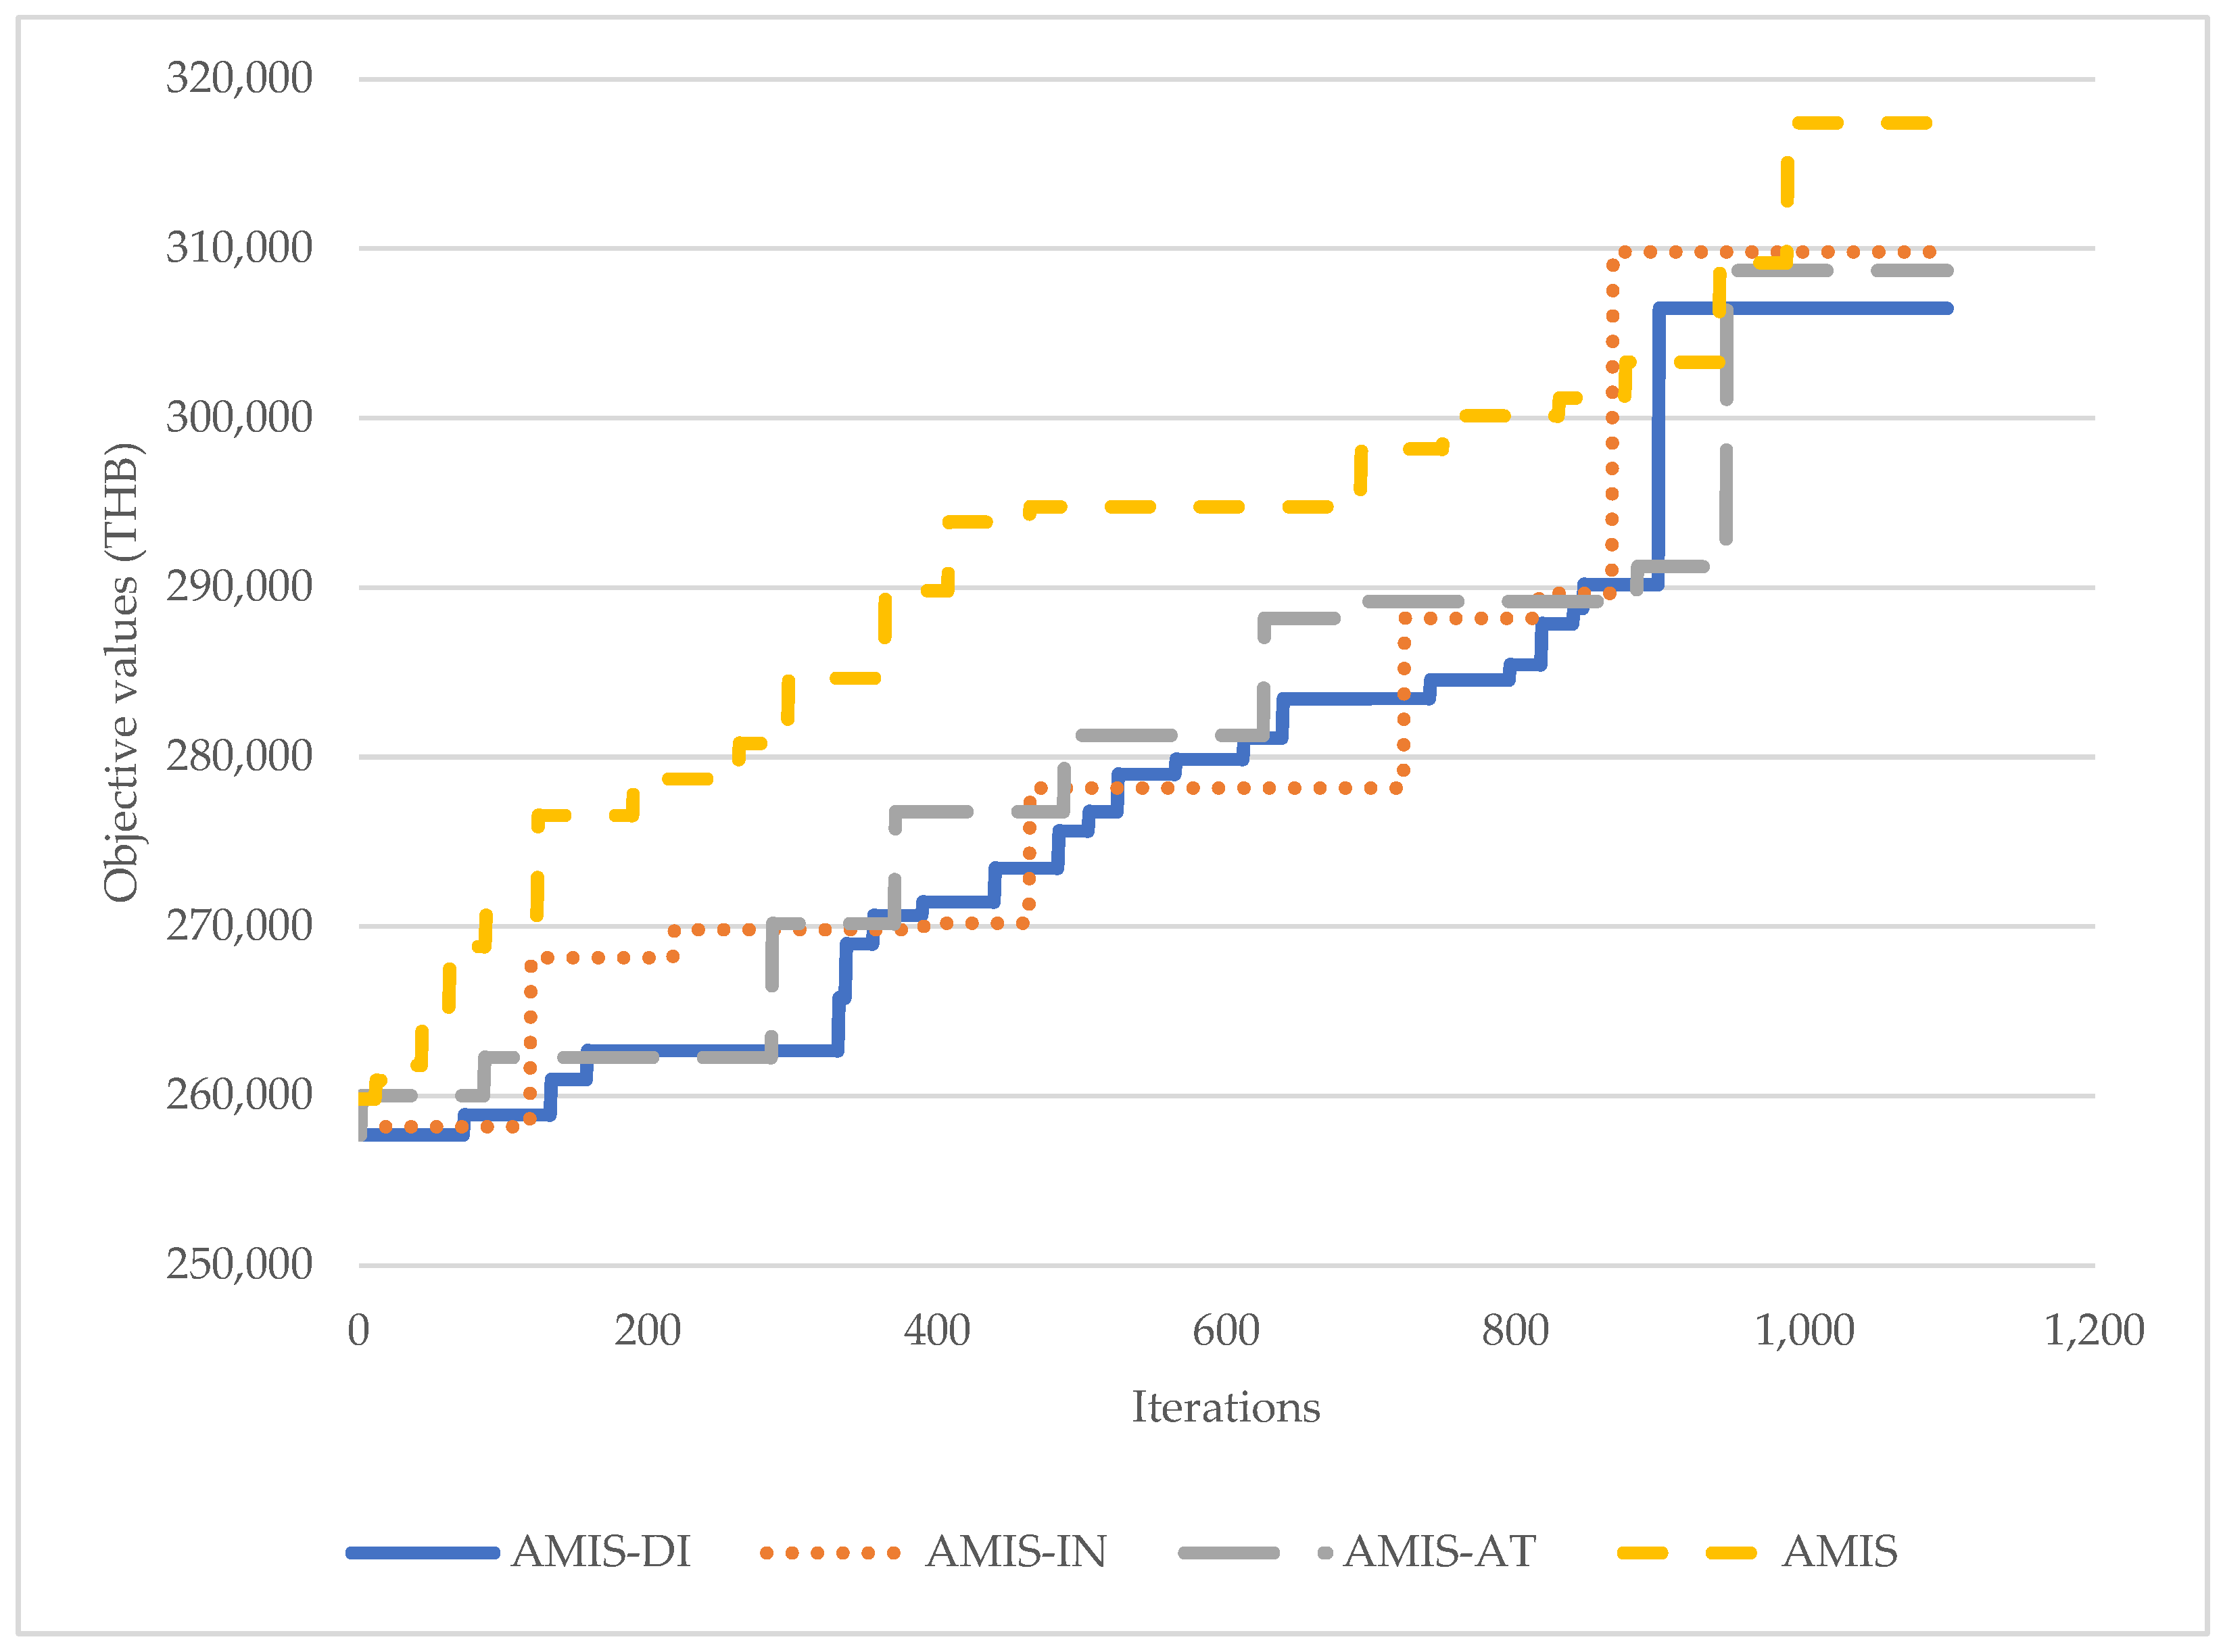
5.2. The AMIS’s Behavior in Resolving the Proposed Problem

In the next experiment, we ran the DE, GA and AMIS for 1050 iterations to track the progress of searching for the best results for each method with a case study that involved 165 farmers’ cooperation; the results are shown in Figure 4.
From Figure 4, we can see that the AMIS starts with a better solution than the other methods; it keeps searching for a good solution and rarely gets stuck on a local optimal compared with other methods. The AMIS finds a new solution during 1050 iterations 79 times, whereas the GA and DE find new best solutions 47 and 52 times, respectively. Even the DE more often finds a new best solution but gives a worse final solution compared with the GA. We can see that, in a small area, the DE search’s new best solution does not improve the current solution by much. This means that the DE search is good in a small area. The GA can find the new best solution, but when it gets stuck on a local optimal, it cannot escape from this area. The AMIS combines the good behavior of both methods. It can find a good solution and can find a new best solution, and it can escape from the local optimal, which makes it give better solutions than the other two methods.
In the next experiment, we assessed the effect of using three different types of intelligence boxes: (1) an intensification search group (IN), (2) a diversification search group (DI) and (3) a combination of IN and DI. The first group was composed of AIM, PIM, DIM and BIM, and the second group was composed of Restart, RT, IT and SF. The last group, the combination of DI and IN, composed only one box, AT-AIM. We decomposed the AMIS into four subalgorithms: AMIS-DI, AMIS-IN, AMIS-AT and AMIS. AMIS-DI is the AMIS that uses only DI as the intelligence boxes. AMIS-IN, AMIS-AT and AMIS are the AMIS types that use only IN as the intelligence boxes; that use AT-AIM, DIM, BIM, RT and IT as the intelligence boxes (details of the AMIS subalgorithms are given in Table 19); and that use all types of intelligence boxes as the IB, respectively. All algorithms were evaluated with large test instances. All algorithms were evaluated five times per instance, with the best solution from all five tests taken as the representative of the algorithm. The computational time was used as the stopping criterion and was set to 60 min for all algorithms. The computational results are shown in Table 20, and the statistical test is shown in Table 21.
From the computational results in Table 20 and Table 21, we can see that AMIS outperformed all the other AMIS that use different types of intelligence boxes. Using only a diversification search generates a solution not significantly different from using only an intensification search. Compared with the average profit per container generated from AMIS-DI, AMIS-IN and AMIS-AT, they generate a lower profit than the AMIS by 5.21%, 4.67% and 4.68%, respectively. Figure 5 shows the behavior of the AMIS using different types of intelligence boxes.
From Figure 5, we can see that AMIS-AT behaves the same as the AMIS but obtains worse results; this is because AMIS-AT uses fewer intelligence boxes than AMIS. However, the final solution is worse than that of AMIS. We can conclude that the number of IBs used in the AMIS plays an important role in obtaining a better solution. The types of IBs also play a major role in the solution quality. We can see that AMIS-DI, which uses only the DI type of intelligence boxes, can generate a lot of new solutions, but the solutions are not as good as from other methods due to the lack of intensification search; therefore, the final solution is worse than the other AMIS. AMIS-IN can find a good solution, but when it is stuck in the local optimal area, it cannot escape from that search area; therefore, the solution is also worse than the AMIS or AMIS-AT.
The performance of the metaheuristics is dependent on the exploration and exploitation behaviors of the heuristics [64]. Additionally, Lin et al. [65] stated that, by developing a solid balance between the exploration and exploitation of the overall framework, adopting local search approaches can increase the solution quality. This is consistent with our findings, as seen in Table 20 and Figure 5. The balance between exploratory and exploitative behaviors is improved when using a wider range of local search types. As a result, the answer clearly demonstrates that the AMIS performs better than the AMIS-DI, AMIS-IN and AMIS-AT subalgorithms, which use just one group of local searches. The findings of Mei et al. [66], Li et al. [67] and Li et al. [68], which developed local search-based heuristics to handle the traveling thief problem, the heterogeneous container loading problem and capacitated air cargo loading planning, respectively, are consistent with this conclusion. Even when the basic algorithm for the agricultural network design problem uses a number of local search techniques, it behaves in a manner similar to that in the previously discussed problem.
In general, comparing the solution approaches is a multi-objective task involving (1) the average Pareto-optimal solution (ANP) and (2) the average ratio of the Pareto-optimal solution (ARP). This defines N as the number of iterations in one experiment. n1, n2, … nk is the number of Pareto-optimal solutions found in the kth experiment, and K is the total number of experiments. ANP and ARP are calculated using Equations (33) and (34):
ANP = n 1 + n 2 + n 3 + + n k K
ARP = n 1 N + n 2 N + n 3 N + + n k N K .
For this experiment, we selected the L-11 problem (case study). We varied the number of iterations from 300 to 1500, and the Pareto points were collected and reported in Table 22.
From Table 22, we can conclude that the AMIS outperformed the other methods due to it finding a higher ratio of ARP and ANP. It has a higher ARP ratio than DE and GA by 23.92% and 26.17%, respectively, whereas ANP and the AMIS find a higher ratio than the DE and GA by 25.01% and 25.01%, respectively.
According to Meng et al. [69], utilizing various methods to locate the Pareto front results in varying degrees of solution quality. The likelihood of obtaining a better solution increases with the use of more efficient local search algorithms. As can be seen from the solution in Table 22, the AMIS provided a higher value for ARP than the GA or DE, as suggested in Yang et al. [4] and Pitakaso et al. [61], because it employed a more efficient local search method. This conclusion is in line with that of [59,70,71,72,73,74,75], which apply various local search techniques, such as the best transition methods, scaling factors and random transition methods, to solve various types of problems. The outcome demonstrates that using a more effective algorithm yields better results for the target problems. In this case, the DE and GA use four types of local searches, which enhance the search efficiency. The AMIS allows for the use of different local searches in each iteration, and the selection of the local search for subsequent iterations is independent of the current selection. Therefore, not only the local search can boost the solution quality of the AMIS to exceed that of the DE and GA. The goal and benefits of the AMIS can be achieved using this mechanism, which can simultaneously boost exploration and exploitation behavior. The studies by Meng et al. [69], Rahdar et al. [76] and Su et al. [77] that used switchable neighborhood search approaches to lend the primary algorithm better search behaviors ultimately produced results that surpassed the comparative heuristics and provided support to this theory.
From Figure 6, Figure 7 and Figure 8, we see than the AMIS can plug the gap of each Pareto front better than the other two methods. The GA and DE have a distance between some Pareto points that is greater than that of the AMIS, which means that the mechanism of the AMIS can discover more Pareto solutions than the GA and DE.
The next experiment is the result of L-11, or the case study. The case study includes 6 types of goods, 165 farmers, 9 container loading centers, 5 borders, 16 end markets and 60 available containers. The results are shown in Table 23.
From Table 23, we note that 165 farmers delivered their goods to 9 CLCs. CLC-1 to CLC-9 received different goods from different farmers. They received goods from 21, 27, 16, 16, 17, 18, 16, 13 and 21 farmers, respectively. The total profit of the system was 15,236,832 THB; the average profit per containers was 317,434 THB; and the average profit per farmer was 92,344.44 THB. The number of containers used was 48, and the average use by the CLC was 5.33 containers.
Figure 9 shows a logistics scheme of durian and maize from Thailand to the GMS countries. The network flow started from the farmers of each agricultural product in Thailand, connected to the agricultural center markets, moved to the border and finally was transported to the market in Lao PDR.

6. Conclusions and Future Outlook

In this research, we designed a road transportation network for international agricultural product trading. The case study took place in the GMS area and included international trading between Thailand, Laos and Cambodia. The maximum profit and the number of containers used in the system were taken into consideration due to the possibility of extending the lifetime of the containers. Small, medium and large-scale farmers, hubs for collecting and distributing agricultural products, borders, the main road in the GMS and the end consumer market in GMS countries were the actors in our model. As a result, this is the first time the logistics network design for agricultural products has included small and medium-sized farmers. This result is reinforced by the work of Xie et al. [78] and Codini et al. [79], which raised the competitiveness of the SME business in the whole country. The inclusion of small and medium-sized farmers in the model can increase the overall performance of the agricultural logistical network. The model created using mixed-integer programming includes small and medium-sized farmers. To increase their abilities to fulfill consumer demand, small and medium-sized farmers deliver their products to agricultural product collection and distribution centers or container loading hubs. This conclusion is supported by Vyt et al. [80] and Weng et al. [81], who found that using a collection/distribution center can lower unanticipated costs, such as time and penalties for running out of resources, and it can make it more convenient to have alternative resource origins from both suppliers or to choose the best mode of transportation. Choosing the correct locations for collecting centers leads to increased profits and quicker delivery, which is in line with our conclusions.
After we designed the network and identified potential modes of logistics and transportation, the next challenge was to choose the best logistical network to handle the problem. Four types of solution approaches were used to design the network. These were: (1) formulating a mathematical model and solving it to optimality by using optimization software Lingo V.16; (2) the differential evolution algorithm [61]; (3) the genetic algorithm [4]; or (4) the artificial multiple intelligence system. The computational results show that Lingo v.16 and the AMIS generated the best solutions for small test instances, but Lingo V.16 cannot solve to optimality for large test instances. Lingo V.16 and the AMIS gave at best a 15.24% better solution than the GA and DE for small test instances, whereas for large f test instances, the AMIS can find a better solution than the GA and DE by up to 20.22%. For the larger test instances, Lingo V.16 gave the best solution for the 480 h runtime, which is worse than that of the AMIS by 20.24%.
By concentrating on the AMIS, we can see that the type of intelligence box employed in the AMIS mechanism affects how effective the AMIS is. The results of simply using a diversification or intensification search are worse than those produced by combining all forms of intelligence. Additionally, using a different number of intelligence boxes results in a different outcome (in the experiments, we used five or nine intelligence boxes). In order to obtain the optimum solution, the algorithm designer must combine all types of intelligence boxes in the AMIS. Using nine intelligence boxes yields a better result than using five IBs. The GA and DE only employed four enhancement approaches each, and the AMIS used nine that were all based on the idea of balancing the exploration and exploitation behavior of the AMIS. This is the first factor that contributed to the AMIS’s superior solution quality compared to the GA’s and DE’s. Another reason is that the AMIS independently chooses iterative improvement approaches. According to Meng et al. [69], Rahdar et al. [76] and Su et al. [77], it can improve the search quality by employing a number of improvement techniques to strengthen the search functionality. This indicates that the AMIS’s performance is based on the effectiveness of the strategies for improving it, as described by earlier studies. We can now draw the conclusion that the AMIS, due to the search capabilities, considerably improves the solution quality to address the agricultural product logistical network design problem when compared to the current heuristics.
The AMIS was used to address a real-world case problem. The Pareto front’s probable locations were whittled down using TOPSIS in order to select the most advantageous spot. The use of TOPSIS in conjunction with the AMIS has been recommended by Chainarong et al. [74,75] as a method for choosing the most promising option. From the network design of the case study, we can conclude that the total profit of the system is 15,236,832 THB, which can be interpreted as an average profit per container of 317,434 THB. Each farmer obtains an average profit of 92,344.44 THB per day. In this article, one of the objective functions is initially used to determine the optimal number of containers employed in the logistics system. The computational results show that 48 of the 60 containers in the system are in use. Twenty percent of all containers should, therefore, have longer lifespans.
This research can be extended in the following ways: (1) including other types of transportation, such as by air and water, in the system; (2) extending the area of the case study to cover all types of transportation; and (3) covering more types of international trading products.

Author Contributions

Conceptualization, R.P. and N.N.; methodology, R.P.; software, R.P.; validation, N.N., T.S. and S.K.; formal analysis, R.P. and N.W.; investigation, N.W.; resources, T.K.; data curation, P.P., K.P. and T.K.; writing—original draft preparation, R.P.; writing—review and editing, N.N.; visualization, S.K.; supervision, R.P.; project administration, N.N.; funding acquisition, T.S. All authors have read and agreed to the published version of the manuscript.

Funding

This research was funded by Thailand Science Research and Innovation (TSRI) and the National Science, Research and Innovation Fund (NSRF) via grant no. 2450857.

Institutional Review Board Statement

Not applicable.

Informed Consent Statement

Not applicable.

Data Availability Statement

Not applicable.

Acknowledgments

This work was supported by (i) the Faculty of Engineering, Ubon Ratchathani University (UBU), (ii) the Faculty of Industrial Technology, Ubon Ratchathani Rajabhat University, (iii) Thailand Science Research and Innovation (TSRI), and (iv) the National Science, Research and Innovation Fund (NSRF).

Conflicts of Interest

The authors declare no conflict of interest. The funders had no role in the design of the study; in the collection, analyses or interpretation of data; in the writing of the manuscript; or in the decision to publish the results.

References

  1. Paul, B.K.; Epper, C.A.; Tschopp, D.J.; Long, C.T.M.; Tungani, V.; Burra, D.; Hok, L.; Phengsavanh, P.; Douxchamps, S. Crop-Livestock Integration Provides Opportunities to Mitigate Environmental Trade-Offs in Transitioning Smallholder Agricultural Systems of the Greater Mekong Subregion. Agric. Syst. 2022, 195, 103285. [Google Scholar] [CrossRef]
  2. Ritzema, R.S.; Douxchamps, S.; Fraval, S.; Bolliger, A.; Hok, L.; Phengsavanh, P.; Long, C.T.M.; Hammond, J.; van Wijk, M.T. Household-Level Drivers of Dietary Diversity in Transitioning Agricultural Systems: Evidence from the Greater Mekong Subregion. Agric. Syst. 2019, 176, 102657. [Google Scholar] [CrossRef]
  3. Burra, D.D.; Parker, L.; Than, N.T.; Phengsavanh, P.; Long, C.T.M.; Ritzema, R.S.; Sagemueller, F.; Douxchamps, S. Drivers of Land Use Complexity along an Agricultural Transition Gradient in Southeast Asia. Ecol. Indic. 2021, 124, 107402. [Google Scholar] [CrossRef]
  4. Yang, M.; Sharma, D.; Shi, X.; Mamaril, K.; Jiang, H.; Candlin, A. Power Connectivity in the Greater Mekong Subregion (GMS)—The Need for a Wider Discourse. Energy Policy 2022, 165, 112994. [Google Scholar] [CrossRef]
  5. Wu, J.; Wang, X.; Zhong, B.; Yang, A.; Jue, K.; Wu, J.; Zhang, L.; Xu, W.; Wu, S.; Zhang, N.; et al. Ecological Environment Assessment for Greater Mekong Subregion Based on Pressure-State-Response Framework by Remote Sensing. Ecol. Indic. 2020, 117, 106521. [Google Scholar] [CrossRef]
  6. Shibasaki, R.; Shimada, T.; Suzuki, M. Greater Mekong Subregion: Is the Mekong River Shipping Competitive with Other Modes? In Global Logistics Network Modelling and Policy; Elsevier: Amsterdam, The Netherlands, 2021. [Google Scholar]
  7. GMS Environment Operations Center Greater Mekong Subregion—Environment Operations Center. Available online: http://www.gms-eoc.org/ (accessed on 3 July 2022).
  8. Morini, C.; Polis, M.C.B.; da Silva, D.; Junior, E.I. Export Barriers for SMEs from Emerging Market: A Model of Analysis for Non-Tech Companies. BAR—Braz. Adm. Rev. 2021, 18, 1–31. [Google Scholar] [CrossRef]
  9. Junpen, A.; Roemmontri, J.; Boonman, A.; Cheewaphongphan, P.; Thao, P.T.B.; Garivait, S. Spatial and Temporal Distribution of Biomass Open Burning Emissions in the Greater Mekong Subregion. Climate 2020, 8, 90. [Google Scholar] [CrossRef]
  10. Banomyong, R. The Greater Mekong Sub-Region of Southeast Asia: Improving Logistics Connectivity. In International Series in Operations Research and Management Science; Springer: New York, NY, USA, 2013; Volume 181, pp. 69–96. [Google Scholar]
  11. Banomyong, R.; Sopadang, A.; Ramingwong, S. Logistics Benchmark Study of the East West Economic Corridor. Bus. Manag. Q. 2010, 1, 1–13. [Google Scholar]
  12. Ramachandran, P.; Linde, L. Integrating Spatial Support Tools into Strategic Planning-SEA of the GMS North-South Economic Corridor Strategy and Action Plan. Environ. Impact Assess. Rev. 2011, 31, 2. [Google Scholar] [CrossRef]
  13. Andersson, M.; Banomyong, R. The Implications of Deregulation & Liberalization on the Logistics Service Industry in Lao PDR. Int. J. Prod. Econ. 2010, 128, 68–76. [Google Scholar]
  14. Munir, R.; Khayyam, U. Ecological Corridors? The Case of China-Pakistan Economic Corridor. Geoforum 2020, 117, 281–284. [Google Scholar] [CrossRef]
  15. Ozturk, O.; Patrick, J. An Optimization Model for Freight Transport Using Urban Rail Transit. Eur. J. Oper. Res. 2018, 267, 1110–1121. [Google Scholar] [CrossRef]
  16. Teye, C.; Bell, M.G.H.; Bliemer, M.C.J. Urban Intermodal Terminals: The Entropy Maximising Facility Location Problem. Transp. Res. Part B Methodol. 2017, 100, 64–81. [Google Scholar] [CrossRef]
  17. Rezaei, J.; Hemmes, A.; Tavasszy, L. Multi-Criteria Decision-Making for Complex Bundling Configurations in Surface Transportation of Air Freight. J. Air Transp. Manag. 2017, 61, 95–105. [Google Scholar] [CrossRef]
  18. Irawan, C.A.; Jones, D. Formulation and Solution of a Two-Stage Capacitated Facility Location Problem with Multilevel Capacities. Ann. Oper. Res. 2019, 272, 41–67. [Google Scholar] [CrossRef]
  19. Woudsma, C.; Jakubicek, P. Logistics Land Use Patterns in Metropolitan Canada. J. Transp. Geogr. 2020, 88, 102381. [Google Scholar] [CrossRef]
  20. Hsu, C.I.; Hung, S.F.; Li, H.C. Vehicle Routing Problem with Time-Windows for Perishable Food Delivery. J. Food Eng. 2007, 80, 465–475. [Google Scholar] [CrossRef]
  21. Osvald, A.; Stirn, L.Z. A Vehicle Routing Algorithm for the Distribution of Fresh Vegetables and Similar Perishable Food. J. Food Eng. 2008, 85, 285–295. [Google Scholar] [CrossRef]
  22. Tarantilis, C.D.; Kiranoudis, C.T. Distribution of Fresh Meat. J. Food Eng. 2002, 51, 85–91. [Google Scholar] [CrossRef]
  23. Tarantilis, C.D.; Kiranoudis, C.T. A Meta-Heuristic Algorithm for the Efficient Distribution of Perishable Foods. J. Food Eng. 2001, 50, 1–9. [Google Scholar] [CrossRef]
  24. Sethanan, K.; Pitakaso, R. Differential Evolution Algorithms for Scheduling Raw Milk Transportation. Comput. Electron. Agric. 2016, 121, 245–259. [Google Scholar] [CrossRef]
  25. Seyyedhasani, H.; Dvorak, J.S. Dynamic Rerouting of a Fleet of Vehicles in Agricultural Operations through a Dynamic Multiple Depot Vehicle Routing Problem Representation. Biosyst. Eng. 2018, 171, 63–77. [Google Scholar] [CrossRef]
  26. Shahabi-Shahmiri, R.; Asian, S.; Tavakkoli-Moghaddam, R.; Mousavi, S.M.; Rajabzadeh, M. A Routing and Scheduling Problem for Cross-Docking Networks with Perishable Products, Heterogeneous Vehicles and Split Delivery. Comput. Ind. Eng. 2021, 157, 107299. [Google Scholar] [CrossRef]
  27. Akpinar, M.E. A Logistic Optimization for the Vehicle Routing Problem through a Case Study in the Food Industry. Logforum 2021, 17, 387–397. [Google Scholar] [CrossRef]
  28. Soczówka, P.; Zochowska, R.; Karoń, G. Method of the Analysis of the Connectivity of Road and Street Network in Terms of Division of the City Area. Computation 2020, 8, 54. [Google Scholar] [CrossRef]
  29. Doerner, K.F.; Gronalt, M.; Hartl, R.F.; Kiechle, G.; Reimann, M. Exact and Heuristic Algorithms for the Vehicle Routing Problem with Multiple Interdependent Time Windows. Comput. Oper. Res. 2008, 35, 3034–3048. [Google Scholar] [CrossRef]
  30. Ma, Z.J.; Wu, Y.; Dai, Y. A Combined Order Selection and Time-Dependent Vehicle Routing Problem with Time Widows for Perishable Product Delivery. Comput. Ind. Eng. 2017, 114, 101–113. [Google Scholar] [CrossRef]
  31. Zulvia, F.E.; Kuo, R.J.; Nugroho, D.Y. A Many-Objective Gradient Evolution Algorithm for Solving a Green Vehicle Routing Problem with Time Windows and Time Dependency for Perishable Products. J. Clean. Prod. 2020, 242, 118428. [Google Scholar] [CrossRef]
  32. Chueanun, S.; Suwandechochai, R. Effect of Additional Order in Two-Stage Supply Chain Contract under the Demand Uncertainty. Computation 2021, 9, 37. [Google Scholar] [CrossRef]
  33. Derigs, U.; Gottlieb, J.; Kalkoff, J.; Piesche, M.; Rothlauf, F.; Vogel, U. Vehicle Routing with Compartments: Applications, Modelling and Heuristics. OR Spectr. 2011, 33, 885–914. [Google Scholar] [CrossRef]
  34. Mendoza, J.E.; Castanier, B.; Guéret, C.; Medaglia, A.L.; Velasco, N. Constructive Heuristics for the Multicompartment Vehicle Routing Problem with Stochastic Demands. Transp. Sci. 2011, 45, 346–363. [Google Scholar] [CrossRef]
  35. Reis, S.A.; Leal, J.E. A Deterministic Mathematical Model to Support Temporal and Spatial Decisions of the Soybean Supply Chain. J. Transp. Geogr. 2015, 43, 48–58. [Google Scholar] [CrossRef]
  36. Pedersen, M.B.; Crainic, T.G.; Madsen, O.B.G. Models and Tabu Search Metaheuristics for Service Network Design with Asset-Balance Requirements. Transp. Sci. 2009, 43, 158–177. [Google Scholar] [CrossRef]
  37. Andersen, J.; Christiansen, M.; Crainic, T.G.; Grønhaug, R. Branch and Price for Service Network Design with Asset Management Constraints. Transp. Sci. 2011, 45, 33–49. [Google Scholar] [CrossRef]
  38. Andersen, J.; Crainic, T.G.; Christiansen, M. Service Network Design with Asset Management: Formulations and Comparative Analyses. Transp. Res. Part C Emerg. Technol. 2009, 17, 197–207. [Google Scholar] [CrossRef]
  39. Andersen, J.; Crainic, T.G.; Christiansen, M. Service Network Design with Management and Coordination of Multiple Fleets. Eur. J. Oper. Res. 2009, 193, 377–389. [Google Scholar] [CrossRef]
  40. Moccia, L.; Cordeau, J.F.; Laporte, G.; Ropke, S.; Valentini, M.P. Modeling and Solving a Multimodal Transportation Problem with Flexible-Time and Scheduled Services. Networks 2011, 57, 53–68. [Google Scholar] [CrossRef]
  41. Thiongane, B.; Cordeau, J.F.; Gendron, B. Formulations for the Nonbifurcated Hop-Constrained Multicommodity Capacitated Fixed-Charge Network Design Problem. Comput. Oper. Res. 2015, 53, 1–8. [Google Scholar] [CrossRef]
  42. Li, X.; Wei, K.; Aneja, Y.P.; Tian, P. Design-Balanced Capacitated Multicommodity Network Design with Heterogeneous Assets. Omega 2017, 67, 145–159. [Google Scholar] [CrossRef]
  43. Irannezhad, E.; Prato, C.G.; Hickman, M. The Effect of Cooperation among Shipping Lines on Transport Costs and Pollutant Emissions. Transp. Res. Part D Transp. Environ. 2018, 65, 312–323. [Google Scholar] [CrossRef]
  44. Meng, Q.; Wang, X. Intermodal Hub-and-Spoke Network Design: Incorporating Multiple Stakeholders and Multi-Type Containers. Transp. Res. Part B Methodol. 2011, 45, 724–742. [Google Scholar] [CrossRef]
  45. Wang, H.; Zhang, X. Game Theoretical Transportation Network Design among Multiple Regions. Ann. Oper. Res. 2017, 249, 97–117. [Google Scholar] [CrossRef]
  46. Neamatian Monemi, R.; Gelareh, S.; Hanafi, S.; Maculan, N. A Co-Opetitive Framework for the Hub Location Problems in Transportation Networks. Optimization 2017, 66, 2089–2106. [Google Scholar] [CrossRef]
  47. Rao, C.; Goh, M.; Zhao, Y.; Zheng, J. Location Selection of City Logistics Centers under Sustainability. Transp. Res. Part D Transp. Environ. 2015, 36, 29–44. [Google Scholar] [CrossRef]
  48. Jiang, J.; Zhang, D.; Meng, Q. Impact Analysis of Investment Coordination Mechanisms in Regional Low-Carbon Logistics Network Design. Transp. Res. Part D Transp. Environ. 2021, 92, 102735. [Google Scholar] [CrossRef]
  49. Youd, F. Global Shipping Container Shortage: The Story so Far—Ship Technology. Available online: https://www.ship-technology.com/analysis/global-shipping-container-shortage-the-story-so-far/ (accessed on 3 July 2022).
  50. Tang, J.; Tang, L.; Wang, X. Solution Method for the Location Planning Problem of Logistics Park with Variable Capacity. Comput. Oper. Res. 2013, 40, 406–417. [Google Scholar] [CrossRef]
  51. Allahyari, S.; Yaghoubi, S.; van Woensel, T. The Secure Time-Dependent Vehicle Routing Problem with Uncertain Demands. Comput. Oper. Res. 2021, 131, 105253. [Google Scholar] [CrossRef]
  52. Fan, H.; Zhang, Y.; Tian, P.; Lv, Y.; Fan, H. Time-Dependent Multi-Depot Green Vehicle Routing Problem with Time Windows Considering Temporal-Spatial Distance. Comput. Oper. Res. 2021, 129, 105211. [Google Scholar] [CrossRef]
  53. Wang, Y.; Li, Q.; Guan, X.; Xu, M.; Liu, Y.; Wang, H. Two-Echelon Collaborative Multi-Depot Multi-Period Vehicle Routing Problem. Expert Syst. Appl. 2021, 167, 114201. [Google Scholar] [CrossRef]
  54. Howard, E. Gardner Intelligence Reframed: Multiple Intelligences for the 21st Century; Basic Books: Hachette UK, 2000. [Google Scholar]
  55. Conway, A.R.A.; Kovacs, K.; Hao, H.; Rosales, K.P.; Snijder, J.P. Individual Differences in Attention and Intelligence: A United Cognitive/Psychometric Approach. J. Intell. 2021, 9, 34. [Google Scholar] [CrossRef]
  56. Kelly, D.; Tangney, B. Adapting to Intelligence Profile in an Adaptive Educational System. Interact. Comput. 2006, 18, 385–409. [Google Scholar] [CrossRef]
  57. Moseley, D.; Baumfield, V.; Elliott, J.; Gregson, M.; Higgins, S.; Miller, J.; Newton, D. Frameworks for Thinking: A Handbook for Teaching and Learning; Cambridge University Press: Cambridge, UK, 2005. [Google Scholar]
  58. Gardner, H.; Hatch, T. Educational Implications of the Theory of Multiple Intelligences. Educ. Res. 1989, 18, 4–10. [Google Scholar] [CrossRef]
  59. Pitakaso, R.; Sethanan, K.; Jirasirilerd, G.; Golinska-Dawson, P. A Novel Variable Neighborhood Strategy Adaptive Search for SALBP-2 Problem with a Limit on the Number of Machine’s Types. Ann. Oper. Res. 2021, 1–25. [Google Scholar] [CrossRef]
  60. Mitchell, M. An Introduction to Genetic Algorithms; MIT Press: Boston, MA, USA, 2020. [Google Scholar]
  61. Pitakaso, R.; Sethanan, K. Modified Differential Evolution Algorithm for Simple Assembly Line Balancing with a Limit on the Number of Machine Types. Eng. Optim. 2016, 48, 82. [Google Scholar] [CrossRef]
  62. LINDO Systems, Inc. LINGO and Optimization Modeling. Available online: https://www.lindo.com/index.php/products/lingo-and-optimization-modeling (accessed on 3 July 2022).
  63. Chen, S.G. An Optimal Capacity Assignment for the Robust Design Problem in Capacitated Flow Networks. Appl. Math. Model. 2012, 36, 5272–5282. [Google Scholar] [CrossRef]
  64. Gupta, A.K.; Smith, K.G.; Shalley, C.E. The Interplay between Exploration and Exploitation. Acad. Manag. J. 2006, 49, 693–706. [Google Scholar] [CrossRef]
  65. Lin, J.; Zhang, S.X.; Zheng, S.Y.; Pan, Y.M. Differential Evolution with Fusion of Local and Global Search Strategies. J. Comput. Sci. 2022, 63, 101746. [Google Scholar] [CrossRef]
  66. Mei, Y.; Li, X.; Yao, X. Improving Efficiency of Heuristics for the Large Scale Traveling Thief Problem. In Simulated Evolution and Learning; Lecture Notes in Computer Science (Including Subseries Lecture Notes in Artificial Intelligence and Lecture Notes in Bioinformatics); Springer: Berlin/Heidelberg, Germany, 2014; p. 8886. [Google Scholar] [CrossRef]
  67. Li, Y.; Chen, M.; Huo, J. A Hybrid Adaptive Large Neighborhood Search Algorithm for the Large-Scale Heterogeneous Container Loading Problem. Expert Syst. Appl. 2022, 189, 115909. [Google Scholar] [CrossRef]
  68. Li, Y.; Tao, Y.; Wang, F. A Compromised Large-Scale Neighborhood Search Heuristic for Capacitated Air Cargo Loading Planning. Eur. J. Oper. Res. 2009, 199, 553–560. [Google Scholar] [CrossRef]
  69. Meng, F.; Cao, B.; Chu, D.; Ji, Q.; Zhou, X. Variable Neighborhood Search for Quadratic Multiple Constraint Variable Sized Bin-Packing Problem. Comput. Oper. Res. 2022, 143, 105803. [Google Scholar] [CrossRef]
  70. Pitakaso, R.; Sethanan, K.; Theeraviriya, C. Variable Neighborhood Strategy Adaptive Search for Solving Green 2-Echelon Location Routing Problem. Comput. Electron. Agric. 2020, 173, 105406. [Google Scholar] [CrossRef]
  71. Jirasirilerd, G.; Pitakaso, R.; Sethanan, K.; Kaewman, S.; Sirirak, W.; Kosacka-Olejnik, M. Simple Assembly Line Balancing Problem Type 2 by Variable Neighborhood Strategy Adaptive Search: A Case Study Garment Industry. J. Open Innov. Technol. Mark. Complex. 2020, 6, 21. [Google Scholar] [CrossRef] [Green Version]
  72. Worasan, K.; Sethanan, K.; Pitakaso, R.; Moonsri, K.; Nitisiri, K. Hybrid Particle Swarm Optimization and Neighborhood Strategy Search for Scheduling Machines and Equipment and Routing of Tractors in Sugarcane Field Preparation. Comput. Electron. Agric. 2020, 178, 105733. [Google Scholar] [CrossRef]
  73. Nitisiri, K.; Sethanan, K.; Pitakaso, R.; Gen, M. Edge Boundary Variable Neighborhood Strategy Adaptive Search for a Vegetable Crop Land Allocation Problem. Int. J. Manag. Sci. Eng. Manag. 2022, 1–9. [Google Scholar] [CrossRef]
  74. Chainarong, S.; Srichok, T.; Pitakaso, R.; Sirirak, W.; Khonjun, S.; Akararungruangku, R. Variable Neighborhood Strategy Adaptive Search for Optimal Parameters of Ssm-Adc12 Aluminum Friction Stir Welding. Processes 2021, 9, 1805. [Google Scholar] [CrossRef]
  75. Chainarong, S.; Pitakaso, R.; Sirirak, W.; Srichok, T.; Khonjun, S.; Sethanan, K.; Sangthean, T. Multi-Objective Variable Neighborhood Strategy Adaptive Search for Tuning Optimal Parameters of Ssm-Adc12 Aluminum Friction Stir Welding. J. Manuf. Mater. Process. 2021, 5, 123. [Google Scholar] [CrossRef]
  76. Rahdar, S.; Ghanbari, R.; Ghorbani-Moghadam, K. Tabu Search and Variable Neighborhood Search Algorithms for Solving Interval Bus Terminal Location Problem[Formula Presented]. Appl. Soft Comput. 2022, 116, 108367. [Google Scholar] [CrossRef]
  77. Su, S.; Xiong, D.; Yu, H.; Dong, X. A Multiple Leaders Particle Swarm Optimization Algorithm with Variable Neighborhood Search for Multiobjective Fixed Crowd Carpooling Problem. Swarm Evol. Comput. 2022, 72, 101103. [Google Scholar] [CrossRef]
  78. Xie, X.; Han, Y.; Anderson, A.; Ribeiro-Navarrete, S. Digital Platforms and SMEs’ Business Model Innovation: Exploring the Mediating Mechanisms of Capability Reconfiguration. Int. J. Inf. Manag. 2022, 65, 102513. [Google Scholar] [CrossRef]
  79. Codini, A.P.; Abbate, T.; Messeni Petruzzelli, A. Business Model Innovation and Exaptation: A New Way of Innovating in SMEs. Technovation 2022, 102548. [Google Scholar] [CrossRef]
  80. Vyt, D.; Jara, M.; Mevel, O.; Morvan, T.; Morvan, N. The Impact of Convenience in a Click and Collect Retail Setting: A Consumer-Based Approach. Int. J. Prod. Econ. 2022, 248, 108491. [Google Scholar] [CrossRef]
  81. Wang, B.C.; Qian, Q.Y.; Gao, J.J.; Tan, Z.Y.; Zhou, Y. The Optimization of Warehouse Location and Resources Distribution for Emergency Rescue under Uncertainty. Adv. Eng. Inform. 2021, 48, 101278. [Google Scholar] [CrossRef]
Figure 1. Overview of logistics in the Greater Mekong Subregion corridors [7] (Sources: ESRI, HERE, Garmin, FAO, NOAA, USGS, OpenStreetMap contributors and the GIS user community).
Computation 10 00126 g001
Figure 2. Proposed problem definition [7] (Sources: ESRI, HERE, Garmin, FAO, NOAA, USGS, OpenStreetMap contributors, the GIS user community and Projection UTM WGS1984 Zoon 48N).
Computation 10 00126 g002
Figure 3. Framework of the AMIS.
Computation 10 00126 g003
Figure 4. Behavior of the proposed method.
Computation 10 00126 g004
Figure 5. Behavior of AMIS subalgorithms.
Computation 10 00126 g005
Figure 6. Pareto front of AMIS.
Computation 10 00126 g006
Figure 7. Pareto front of DE.
Computation 10 00126 g007
Figure 8. Pareto front of GA.
Computation 10 00126 g008
Figure 9. Transportation route and network for durians and maize [7] (Sources: ESRI, HERE, Garmin, FAO, NOAA, USGS, OpenStreetMap contributors, the GIS user community and Projection UTM WGS1984 Zoon 48N).
Computation 10 00126 g009
Table 1. Three examples of WPs.
WPFarmerContainerBorderEM
12341234567812312
0.320.700.820.530.320.230.680.260.160.400.780.860.210.250.910.690.23
10.660.450.460.780.650.760.970.930.670.470.070.780.430.090.590.680.50
20.270.390.790.140.401.000.310.430.110.160.200.440.150.110.960.010.44
30.320.700.820.530.320.230.680.260.160.400.780.860.210.250.910.690.23
Table 2. Demand for vegetables.
Demand
Vegetable AVegetable B
End market 115002000
End market 218001800
Table 3. Selling price of vegetables.
Price
Vegetable AVegetable B
End market 1910880
End market 2920860
Table 4. Amount of product available from each farmer.
Amount
Farmer 1Farmer 1Farmer 2Farmer 1
Vegetable A1500250000
Vegetable B0025002000
Table 5. Container capacity.
Capacity
12345678
CLC 170060010008000000
CLC 200008007009001000
Table 6. Results of the sorting of WP number 1.
Before Sorting
FarmerContainerBorderEM
12341234567812312
0.320.700.820.530.320.230.680.260.160.400.780.860.210.250.910.690.23
After Sorting
FarmerContainerBorderEM
14235241637812321
0.320.530.700.820.160.230.260.320.400.680.780.860.210.250.910.230.69
Table 7. Results of the assignment process of WP number 1.
VegetableContainerFarmerBorderTotal ProfitMakespanTotal Number of Containers Used
EM 2A5, 2, 41–1500 tons
2–300 tons
11,656,0003983
B4, 1, 64–1800 tons13,186,0004013
EM 1A3, 72–200021,840,0003572
B84–200
3–700
22,632,0002761
Total 5,818,0004018
Table 8. Intelligence box details.
IB OperatorsGroupValue of
ACO-inspired move (AIM) I n Y i j q = ρ Y r j q + F 1 B j gbest Y r j t + F 2 Y m j t Y r j t
 
PSO-inspired move (PIM) I n Y i j q = Y r j q + F 1 B j gbest Y r j t + F 2 B h j pbest Y r j t
 
DE-inspired move (DIM) I n Y i j q = Y r j q + F 1 Y mjt Y njt
 
ABCO-inspired move (BIM) I n Y i j q = Y r j q + r j Y mjt Y njt
 
Restart D i Y i j q = R i j
 
Random transit (RT) D i Y i j q = Y i j q 1 i f R i j C R h R i j q o t h e r w i s e
 
Intertransit (IT) D i Y i j q = Y i j q 1 i f R i j C R h Y n j q o t h e r w i s e
 
Scaling factor (SF) D i Y i j q = Y i j q 1 i f R i j C R h R i j Y i j q 1 o t h e r w i s e
 
RT-AIM I n / D i Y i j q = { ρ Y r j q + F 1 ( B j g b e s t Y r j t ) + F 2 ( Y m j t Y r j t )     i f   i j C R h   Y i j q 1             o t h e r w i s e (24)
Table 9. The updated role of the heuristic information.
VariablesUpdated Procedure
N b t Total number of WPs that select IB b from iteration 1 to iteration t
A b t Average objective value of all IBs that select IB b   ( i = 1 N b t f i t N b t )
I b t I b t = I b t 1 = G
 when G = { 1   if   black   box   contains   the   global   best   solution   in   iteration   t 0   otherwise
B j g b e s t Update global best WP
B h j p b e s t Upde IB’s best WP
R i j q Randomly select the value in the position of all WPs, all positions
Table 10. Details of the test instances.
# of Instances # of Vegetables# of Farmers# of CLS# of Borders# of End Markets# of Containers# of Instances # of Vegetables# of Farmers# of CLS# of Borders# of End Markets# of Containers
S-13853412L-14110541127
S-231053412L-24120641127
S-341664614L-34130641132
S-441665614L-44140741132
S-542065614L-54140741232
S-642265615L-64150741243
S-742275616L-75150841243
S-842265717L-85165841243
S-942375717L-95165851450
S-1042475818L-105165851550
S-1142575818L-116165951660
Table 11. Range of data randomly generated for each problem instance.
ParametersValue
D j i (km)U [10, 130]
E i k   (km)U [10, 120]
N k l     (mm)U [20, 150]
T k l 1   (THB/km)U [3, 5]
T i k 2 Transportation fuel cost from CLC i to border k (THB/km)U [3, 5]
T j i 3 Transportation fuel cost from farmer j to CLC i (THB/km)U [3, 5]
M v l (kg)U [800, 1500]
O v j 1 (kg)U [200, 600]
B v g 4 (THB/kg)U [4, 9]
B g k 6 (min)U [15, 25]
P g   (m2)U [500, 800]
S v l (THB/kg)U [1000, 1500]
P g k 2   ( min ) U [10, 45]
B g k 6   ( min ) U [15, 25]
B v 3 (m2/kg)U [0.2, 0.8]
B v g 4   ( THB / kg ) U [3, 10]
B g l 7 (min)U [400, 550]
B g k 1 (THB/kg)U [1000, 2500]
Table 12. Objective functions of small test instances.
LingoDEGAAMIS
Profit (THB)Number of Containers UsedComputational Time (min)Profit (THB)Number of Containers UsedProfit (THB)Number of Containers UsedNumber of Containers UsedNumber of Containers Used
S-11,506,483743.341,506,48371,506,48371,506,4837
S-21,396,667748.821,396,66771,396,66771,396,6677
S-32,953,586975.282,934,17192,953,58692,953,5869
S-43,287,7811080.133,287,781103,267,148103,287,78110
S-53,952,2721092.453,944,837103,952,272103,952,27210
S-65,430,1741199.845,430,174125,409,188125,430,17411
S-76,337,06613117.376,278,967136,337,066136,337,06613
S-86,630,97913124.946,630,979136,630,979136,630,97913
S-96,724,51314187.566,698,138156,687,127156,724,51314
S-106,929,79615230.186,845,673166,855,643166,929,79615
S-117,147,34415256.696,991,436167,021,286167,147,34415
Table 13. Average profit per container of all methods.
Profit (THB)% Difference from the Optimal SolutionProfit (THB)Time (min)Number of Containers Used
LingoDEGAAMISLingoDEGAAMIS
S-1215,211.86215,211.86215,211.86215,211.860.000.000.000.00
S-2199,523.86199,523.86199,523.86199,523.860.000.000.000.00
S-3328,176.22326,019.00328,176.22328,176.220.000.660.000.00
S-4328,778.10328,778.10326,714.80328,778.100.000.000.630.00
S-5395,227.20394,483.70395,227.20395,227.200.000.190.000.00
S-6493,652.18452,514.50450,765.67493,652.180.008.338.690.00
S-7487,466.62482,997.46487,466.62487,466.620.000.920.000.00
S-8510,075.31510,075.31510,075.31510,075.310.000.000.000.00
S-9480,322.36446,542.53445,808.47480,322.360.007.037.190.00
S-10461,986.40427,854.56428,477.69461,986.400.007.397.250.00
S-11476,489.60436,964.75438,830.38476,489.600.008.307.900.00
Avg.397,900.88383,724.15384,207.10397,900.880.002.982.880.00
Table 14. Statistical testing using the Wilcoxon signed-rank test on the results in Table 13.
DEGAAMIS
Lingo0.0280.0361.00
DE 0.4080.038
GA 0.36
Table 15. Average profit per container using different weights w1.
No.w1 = 0.2w1 = 0.5w1 = 0.8
LingoDEGAAMISLingoDEGAAMISLingoDEGAAMIS
1205,819.2205,819.2205,819.2205,819.2215,211.9215,211.9215,211.9215,211.9231,287.4231,287.4231,287.4231,287.4
2192,837.7192,837.7192,837.7192,837.7199,523.9199,523.9199,523.9199,523.9212,891.7212,891.7212,891.7212,891.7
3326,200.4324,490.6325,837.2326,200.4328,176.2326,019328,176.2328,176.2332,934.1329,018.6328,995.2332,934.1
4327,012.8325,989.7326,089.6327,012.8328,778.1328,778.1326,714.8328,778.1338,912.5329,981.7330,192.9338,912.5
5382,824.2387,168.2387,181.9382,824.2395,227.2394,483.7395,227.2395,227.2401,288.6400,192.3401,288.6401,288.6
6479,813.5443,326.8443,476.1479,813.5493,652.2452,514.5450,765.7493,652.2501,230.7501,230.7499,817.1501,230.7
7467,618.7451,298.3458,719.5467,618.7487,466.7482,997.5487,466.7487,466.7494,817.2488,192.8494,817.2494,817.2
8487,891.4467,791.1469,810.8487,891.4510,075.3510,075.3510,075.3510,075.3524,892.7511,248.2512,391.8524,892.7
9477,918.1439,817.9448,199.3477,918.1480,322.4446,542.5445,808.5480,322.4498,814.8468,172.9469,812.3498,814.8
10458,981.5412,394.8419,289.5458,981.5461,986.4427,854.6428,477.7461,986.4488,918.3451,092.1451,998.7488,918.3
11458,991.8422,129.4425,982.1458,991.8476,489.6436,964.8438,830.4476,489.6498,192.1470,291.3479,187.5498,192.1
Avg.387,809.9360,527.3373,022.1387,809.9397,900.9383,724.2384,207.1397,900.9411,289.1399,418.2401,152.8411,289.1
Table 16. Computational results of test instances with a large size.
Lingo V.16
(Best Solution Found within 480 h)
DEGAAMIS
Profit (THB)No. of ContainersProfit (THB)No. of ContainersProfit (THB)No. of ContainersProfit (THB)No. of Containers
L-15,981,728216,012,384216,118,891226,345,98120
L-25,991,827236,329,541236,499,819236,761,89222
L-36,234,198247,171,828237,299,818237,419,28223
L-46,549,182267,412,947267,587,129267,887,81725
L-56,771,274277,539,981277,689,912267,901,24825
L-68,981,928399,338,127389,488,7123810,981,72837
L-79,123,8473910,081,7243810,188,1843811,012,94736
L-89,421,1784110,281,7213910,398,4713911,367,91937
L-910,238,1234211,482,7494010,898,1834012,128,37840
L-1010,871,2814510,898,1274411,998,2744412,239,17742
L-1112,398,7195514,059,2795014,388,7125015,236,83248
Table 17. Average profit per container.
LingoDEGAAMIS
L-1284,844.2286,304.0278,131.4317,299.1
L-2260,514.2275,197.4282,600.8307,358.7
L-3259,758.3311,818.6317,383.4322,577.5
L-4251,891.6285,113.3291,812.7315,512.7
L-5250,787.9279,258.6295,765.8316,049.9
L-6230,305.8245,740.2249,702.9296,803.5
L-7233,944.8265,308.5268,110.1305,915.2
L-8229,784.8263,633.9266,627.5307,241.1
L-9243,764.8287,068.7272,454.6303,209.5
L-10241,584.0247,684.7272,688.0291,409.0
L-11225,431.3281,185.6287,774.2317,434.0
Avg.246,601.1275,301.2280,277.4309,164.5
Table 18. Statistical test using the Wilcoxon signed-rank test on the results in Table 17.
DEGAAMIS
Lingo0.00380.00440.0038
DE 0.11560.0038
GA 0.0038
Table 19. Details of the AMIS subalgorithms.
Types of AMISAMIS-DIAMIS-INAMIS-ATAMIS
ACO-inspired move (AIM)
PSO-inspired move (PIM)
DE-inspired move (DIM)
ABCO-inspired move (BIM)
Restart
Random transit (RT)
Intertransit (IT)
Scaling factor (SF)
RT-AIM
Remark: ● represented the subalgorithm used in each type of AMIS.
Table 20. Average profit per container using different AMIS algorithms.
AMIS-DIAMIS-INAMIS-ATAMIS
L-1287,239.0289,918.5291,827.8317,299.1
L-2283,018.8289,137.6287,139.3307,358.7
L-3311,082.4312,018.2312,811.7322,577.5
L-4306,719.1305,891.5304,879.3315,512.7
L-5307,718.5306,081.4307,918.6316,049.9
L-6278,909.7282,389.9283,918.5296,803.5
L-7284,438.4283,369.2282,399.1305,915.2
L-8281,298.6288,183.9287,183.5307,241.1
L-9292,398.9291,928.5290,148.7303,209.5
L-10282,398.4283,391.7284,712.4291,409.0
L-11308,471.5309,812.4308,712.3317,434.0
Avg.293,063.0294,738.4294,695.6309,164.6
Table 21. Statistical testing using the Wilcoxon signed-rank test of the results in Table 20.
AMIS-INAMIS-ATAMIS
AMIS-DI0.10960.10960.0034
AMIS-IN 0.10960.0034
AMIS-AT 0.0034
Table 22. ANP and ARP of all proposed methods.
#IterationsDEGAAMIS
#Pareto PointsRatio#Pareto PointsRatio#Pareto PointsRatio
1150180.12170.11240.16
2150200.13190.13250.17
3250220.09240.10320.13
4250250.10230.09300.12
5400280.07300.08370.09
6400310.08270.07390.10
7650330.05320.05430.07
8650320.05330.05440.07
9920370.04350.04510.06
10920380.04360.04540.06
ARP0.08 0.07 0.10
ANP0.06 0.06 0.08
Table 23. Computational results of the case study.
FarmersVegetable TypesBordersEnd MarketsProfit (THB)Number of Containers Used
CLC-16, 7, 18, 26, 47, 48, 49, 50, 60, 74, 86, 87, 114, 115, 116, 131, 132, 133, 134, 163, 1641, 4, 62, 4, 55, 10, 12, 16168,8276
CLC-22, 15, 24, 37, 38, 39, 59, 66, 71, 72, 90,
102, 103, 104, 105, 127, 128, 129, 130, 143, 144, 145, 146, 160, 161, 162,
165
1, 4, 5, 62, 3, 4, 53, 5, 7, 9, 132,049,8357
CLC-35, 21, 29, 30, 31, 56, 69, 70, 77, 88, 89, 112, 113, 147, 148, 1492, 3, 4, 51, 2, 41, 3, 4, 101,782,9105
CLC-43, 17, 40, 43, 44, 45, 46, 78, 79, 80, 81, 82, 117, 118, 119, 1201, 3, 4, 63, 4, 58, 11, 13, 141,698,1295
CLC-58, 9, 10, 11, 25, 65, 67, 68, 91, 92, 93, 94, 110, 111, 150, 151, 1522, 3, 4, 51, 2, 3, 32, 4, 7, 81,495,6435
CLC-616, 22, 51, 52, 53, 54, 55, 83, 84, 85,
121, 122, 123, 124, 153, 154, 155, 156
1, 4, 61, 2, 31, 4, 5, 61,769,1545
CLC-71, 19, 27, 28, 57, 61, 62, 73, 74, 106,
107, 108, 109, 157, 158, 159
3, 4, 5, 63, 4, 58, 12, 13, 161,625,2335
CLC-812, 20, 32, 33, 34, 35, 36, 42, 95, 96, 97, 125, 1263, 5, 63, 4, 57, 8, 9, 141,311,3894
CLC-94, 13, 14, 23, 41, 58, 63, 64, 75, 76, 98,
99, 101, 135, 136, 137, 138, 139, 140, 141, 142
2, 4, 5, 61, 2, 3, 4, 51, 5, 6, 12, 151,825,7126
Total15,236,83248
Maximum2,049,8357
Average1,692,9815.33
Publisher’s Note: MDPI stays neutral with regard to jurisdictional claims in published maps and institutional affiliations.

