Abstract
The water content in fuel–water emulsions can vary from 10% to 30%, and is under control during the process of emulsification. The main task of this study was to obtain near-linear static function for a water-cut meter with capacitive sensors, and to provide it with effective type-uncertainty compensation during the process of water–fuel emulsion moisture control. To fulfill the capacitive measurements, two capacitive sensors in the measuring channel and two capacitive sensors in the reference channel were used. The method of least squares and general linear regression instruments were used to obtain robust and near-linear transfer function of the capacitive water-cut meter. The prototype product of the water-cut meter was developed with the purpose of fulfilling multiple moisture measurements and checking the workability of the new transfer function. Values of moisture content for the new transfer function and the closest analog were compared with the help of dispersion analysis. The new transfer function provided minimal dispersions of repeatability and adequacy, and minimal F-test values, proving its better capability for type-uncertainty compensation and better adequacy for the nominal linear transfer function of the water-cut meter.
1. Introduction
Emulsified fuels have a clear effect on the combustion process, and are one of the modern combustible systems that offer prospects for new technologies. This has been exploited recently in diesel engines, which have been used for a long time as the main source of driving power due to their reliable design and high fuel-saving economy [1,2]. Significant results in the toxicity reduction of diesel engines’ exhaust fumes were achieved by the application of fuels with water and alcohol additives [3]. Hence, emulsified fuels are mixtures of a combustible liquid, either oil or fuel as a continuous phase, and a smaller amount of water with or without a surfactant as a dispersed phase. Emulsion of petroleum fuel in water is the most common form of such emulsion [4]. In emulsified diesel fuel, the heat absorption by water vaporization causes a decrease in the local adiabatic flame temperature, and this reduces the chemical reaction in the gas phase to produce thermal NOx [5]. Moreover, this helps to reduce the formation of soot, PM, CO, and HC [6,7]. Water–fuel emulsion is a system that includes water (dispersed phase with 0.1…10 μm diameter of droplets) and diesel fuel as a dispersion medium [8,9,10], and the volumetric water content in the fuel–water emulsions can vary from 5% to 30%, and is an object of strict control during the process of emulsification [4,11,12,13].
Methods of moisture measurement can be divided into direct—based on dividing the substance under research into free water and dry material—and indirect, where moisture content can be defined based on the values of other measurements functionally connected with moisture [14,15,16]. To identify popular principles of moisture measurement, a detailed analysis of the world moisture meter market, produced in a recent period, was carried out for bulk substances and oil products as objects of measurement. In total, 358 moisture meters for bulk materials and 64 moisture meters for oil products were detected. The dielcometer (capacitive) principle of moisture measurement remains forward-looking among all indirect methods [17].
A large number of factors influence moisture measurement accuracy. Among them, we traditionally emphasize the physicochemical composition of the combustible liquid (oil fuel as a continuous phase of the emulsion) [16,18,19]. It is not only the type of fuel that has an effect on its physicochemical composition, but the conditions of extraction and processing, etc., and obtaining a full list of factors for analytic forecasting is usually complicated.
A list of analytical methods has been developed to determine the moisture content of oils, based on the fact that water has appreciably different bulk physical characteristics than the oil matrix, e.g., density, dielectric permittivity, or refractive index. These methods are usually only suitable for the analysis of substances in which the composition of the oil matrix does not change significantly, but where the water-to-oil ratio of the matrix changes. For example, the water content of an oil-in-water emulsion can be determined by measuring the density or dielectric permittivity, because the density and dielectric permittivity of water are significantly higher than those of oil. If the composition of the oil matrix changes as well as the water content, then it may not be possible to accurately determine the moisture content of the oil, because more than one oil composition may give the same value for the physical property being measured. Unfortunately, it is impossible to obtain an analytic forecast of the chemical composition and different features of all of the emulsified fuels under research. This is why most indirect methods of moisture measurement have local effectiveness, and are not versatile.
At present, approximately 33% of moisture meters are represented by dielcometer measuring instruments with capacitive sensors. Moisture meters of this type have method error (type uncertainty), the value of which directly depends on the dielectric permittivity of the dry oil as a continuous phase of the emulsion under research (oil type, for example) [16,18]. The influence of type uncertainty on the result of moisture measurement is usually significant, and traditional methods of compensation can be effective when we know the composition of a substance. Such compensation, in general, can be fulfilled using a secondary measuring transducer by using complementary reference capacitors, dedicated analytic calculations, reference calibration curves stored in the secondary measuring transducers’ memory, etc. It can all be used for the limited number of materials under research, and does not allow the moisture meter to be versatile for a wide range of fuel substances. In other cases, the effectiveness of traditional compensation methods essentially decreases, because of which further improvement of the existing methods of moisture measurement with a view to solving the problem of type-uncertainty compensation is a relevant and perspective mission [20]. In-depth analysis of modern moisture control approaches with the purpose of further development and improvement is still a relevant task, and the process of searching for new methods of water-cut sensing optimization is under constant continuation [21,22,23].
“Successful” modifications of capacitive moisture meters with capacitive sensors appeared years ago [24,25,26]. An idea to obtain capacitive measurements using two or more positions for one of the capacitor plates, with further direct comparison, seemed to be of special interest [27,28]. This approach helps to eliminate parasitic capacitances almost completely, compensate for leakage currents, and reduce the influence of fringe electric fields. The main task of this research is in achieving robust, near-linear transfer function for the comparison of methods of moisture measurement, as described in [17], and to provide effective type-uncertainty compensation during the process of water–fuel emulsion moisture control.
2. Materials and Methods
In capacitive sensors, where one of the capacitor plates should be placed in two or more positions [27], we first take an empty sensor, where a change in electric capacitance ΔC0 should be defined before and after the distance between two plates is changed. Then, we define the change in electric capacitance ΔC1 when a capacitive sensor is filled with a tested substance for the same positions of the capacitor plates. After that, the relation ΔC1/ΔC0 should be calculated. In this method, only the accuracy of the capacitor plates’ positioning would influence the uncertainty of the measurements. Thus, the transfer function of the moisture meter should be described with the following formula:
where K is a normalizing coefficient [17] equal to K = 28.599 when we take the values of electric capacitances, equal to 15 pF for C1 and C4, and 50 pF for C2 and C3 when the capacitive sensors are empty.
The suggested design of the capacitive instrument measuring transducer is described below (Figure 1). As we can see, both of its sensors consist of a system of flat plates (1), where two pairs of flat plates belong to measuring capacitors C1 and C4, and the rest of the flat plates create another pair of measuring capacitors C2 and C3. All flat plates of equal length l are assembled inside two fluoroplastic rings (2) at an equal gap, designated as Z.
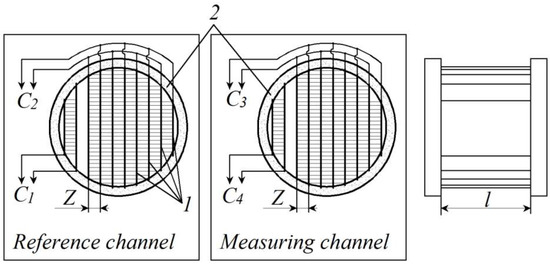
Figure 1.
Capacitive instrument measuring transducer for moisture content (1—system of flat electrodes, 2—fluoroplastic rings).
The measuring channel should be filled with a probe of liquid fuel under moisture control, and the reference channel should be filled with the same substance, but previously dehydrated. Using the method mentioned above, it is necessary to measure the values of electric capacitances C1, C2, C3, and C4, and then to calculate the differences C2 − C1 and C3 − C4. When this is done, we can calculate the relationship of these differences (C3 − C4)/(C2 − C1), and this would be an informative parameter for further processing, directly connected with moisture content.
To implement this idea in practice, moisture content measuring instruments should have a structure, as given in Figure 2. As we can see, four capacitive sensors of the measuring transducer are connected to the inputs of corresponding monostable multivibrators MMV1…MMV4, designed to convert values of electric capacitance into a duration of rectangular pulses. The microcontroller CPU controls the monostable multivibrators’ work by generating rectangular pulses of a stable frequency on one of its output pins.
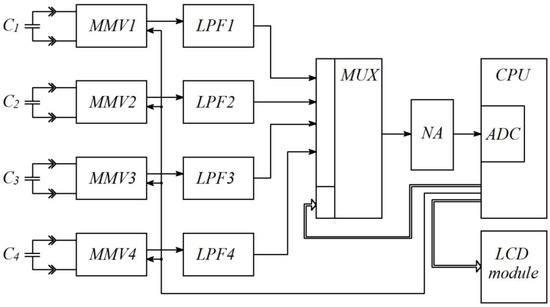
Figure 2.
Structural electric circuit of the moisture meter (MMV1…MMV4—monostable multivibrators, LPF1…LPF4—low-pass filters, MUX—multiplexer, NA—normalizing amplifier, ADC—analog-to-digital converter).
Each monostable multivibrator generates a sequence of rectangular pulses, the duration of which is in direct proportion with the value of electric capacitance, connected to its input (diagrams in Figure 3).
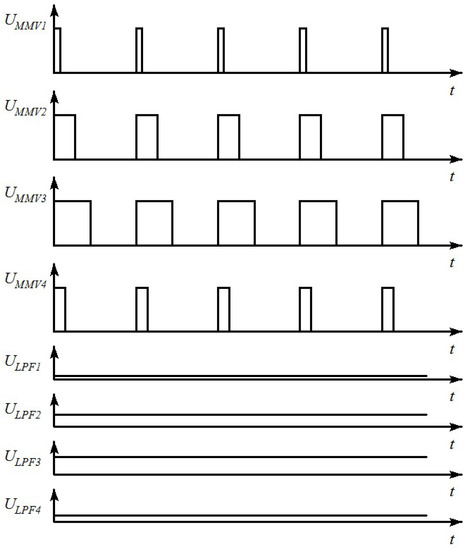
Figure 3.
Operating diagrams for the analogue part of the moisture meter.
Low-pass filters convert pulse duration into DC voltage in proportion to the pulse duration amplitude. The multiplexer MUX, controlled by the CPU, commutes the outputs of the low-pass filters LPF1…LPF4 with the input of the normalizing amplifier NA which, in turn, provides levels of DC voltage compatible with the measuring range of the analog-to-digital converter ADC embedded in the CPU. The microcontroller CPU, after having four values of DC voltage proportional to the values of the four electric capacitances C1, C2, C3, and C4, calculates the moisture content of the substance under research, and displays the results on the LCD module’s screen. To check the behavior of the transfer function (1) with different types of moist substances, we took four values of dielectric permittivity for imaginary dehydrated fuels (εn = 2.0; εn = 2.5; εn = 3.0; εn = 3.5) and four values of moisture content (W = 0%; W = 10%; W = 20%; W = 30%). The values of dielectric permittivity for moist substances, necessary to calculate the values of the four sensors’ capacitances, were estimated with the help of the universal Wiener equation [29,30,31,32]. The values of capacitances C1, C2, C3, and C4, and the calculated values of moisture content defined with the help of the static function (1), are given in Table 1.

Table 1.
Calculated values of sensors’ capacitances and moisture content for the transfer function (1).
Graphs of received transfer functions for different moist substances, and their comparison with an ideal linear transfer function, are given in Figure 4.
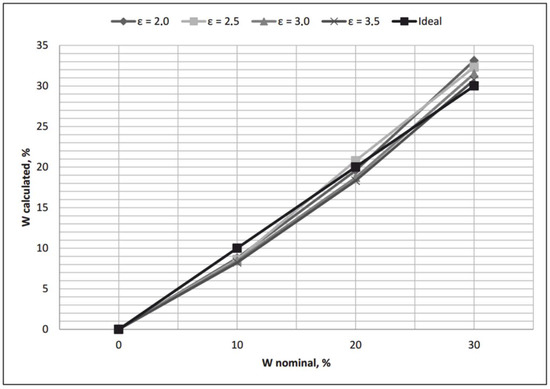
Figure 4.
Calculated transfer functions, placed together with an ideal transfer function of the water-cut meter.
As we can see, all transfer functions received with the help of Equation (1) are nonlinear, and the calculated values of moisture content are significantly different from nominal in all points, except for W = 0%. Hence, at first, Equation (1) should be linearized.
To achieve near-linear dependence between moisture content W and the (C3 − C4)/(C2 − C1) relationship, the method of least squares and instruments of general linear regression were used. The modified transfer function for the water-cut meter is given in Equation (2), where a and b are coefficients preliminarily defined in [33] (a = 0.9622, b = 0.0371):
New values of moisture content, calculated using Formula (2), are given in Table 2.
Table 2.
Calculated values of a static function (2).
The graphs of received transfer functions for different moist substances can be seen in Figure 5. If we compare Figure 4 and Figure 5, it would be possible to say that the modified transfer function (2) is far more effective than the initial transfer function (1).
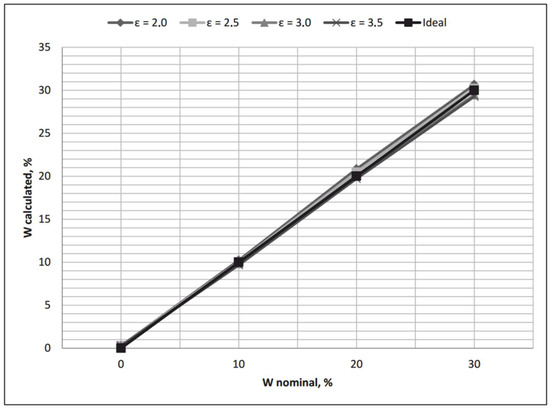
Figure 5.
Modified transfer functions together with an ideal transfer function of the water-cut meter.
To prove this analytically, it seemed to be rational to calculate one of the goodness-of-fit parameters, e.g., root mean estimator (Equation (3)):
For the data in Table 1, we can write:
For the data in Table 2, the result would be S = 0.4158%.
To carry out experimental research with the purpose of checking the workability of a transfer function (2), and to estimate the provided level of uncertainty in the moisture content measurements, it was necessary to obtain stable reference samples of oil products with different dielectric permittivity values εn in a dehydrated state, and values of moisture content equal to W = 0%, W = 10%, W = 20%, and W = 30%. We used diesel fuel with εn = 2.01 and mazut with εn = 2.67 for this purpose. Stable reference samples of diesel fuel and mazut with 10 µm diameter of water particles were obtained by adding appropriate volumes of water, with the help of a second-class precision pipette [34] and 30 min of mechanical mixing at n = 3200 rpm [35,36].
Sensors of a measuring transducer were assembled from four identical fluoroplastic rings with slots to insert flat stainless steel plates, which were glued to the internal surface of the appropriate pair of fluoroplastic rings with the help of superglue gel, and soldered with wires to create four capacitive sensors (Figure 6).
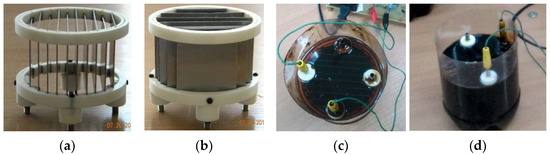
Figure 6.
Prototype product of the capacitive measuring transducer: (a,b) in an empty state, (c) filled with diesel fuel (εn = 2.01), and (d) filled with mazut (εn = 2.67).
The process of moisture measurement was performed following the substitution method, where the value of the quantity being measured is not found directly from a reading of the measuring instrument, but rather from the magnitude of the standard, which is regulated in such a way that the reading of the measuring instrument remains the same when the quantity being measured is replaced by the standard. Commonly known, this method eliminates systematic errors and provides high accuracy, and the substitution method is extensively used in measuring electrical quantities, such as resistance, capacitance, and inductance. The connection scheme of the devices involved in the process of moisture measurement is given in Figure 7.
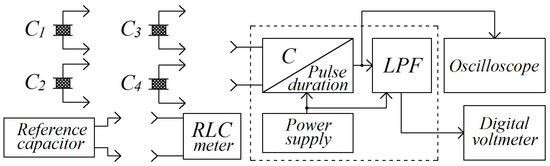
Figure 7.
Connection of the devices involved in the moisture measurement: experimental setup.
The setup consists of four capacitive sensors, designated as C1, C2, C3, and C4, one channeled capacitance into a DC-voltage transducer that performs a sequence of transformations “capacitance–pulse duration–dc voltage”, a variable air capacitor (reference capacitor), an oscilloscope, a digital voltmeter, and an RLC meter.
From the very beginning, a part of the measuring transducer with two capacitive sensors C1 and C2 (reference channel) was filled with the original (with traces of water) sample of oil product (Figure 8a). Both capacitive sensors of the reference channel were connected one by one to the input of capacitance into the DC-voltage transducer, and appropriate DC voltage values were taken from the screen of a digital voltmeter and fixed by the operator. Then, the variable air capacitor (reference capacitor or standard) was connected instead of the capacitive sensors. Its capacitance was slowly changed in correspondence with the method of substitution until the moment when the DC voltage value on the voltmeter’s screen became equal to the values detected previously (Figure 8b).
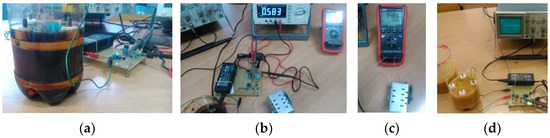
Figure 8.
Process of moisture measurement: (a) connection of the first part of the measuring transducer (sensors C1 and C2 with dehydrated diesel fuel) to the input of a secondary capacitance into the DC-voltage transducer; (b) the reference capacitor’s connection instead of sensors C1 and C2; (c) measuring the capacitance of a reference capacitor with the help of the RLC meter; (d) connection of the second part of the measuring transducer (sensors C3 and C4 with moist diesel fuel, W = 20%) to the input of a secondary capacitance into the DC-voltage transducer.
After that, the standard capacitor was disconnected from the transducer, and its capacitance was measured with the help of an accurate RLC meter at a 10 kHz frequency. The same process took place for the capacitive sensors in the measuring channel, filled with moist samples of oil products (Figure 8d). As a result, 10 measurements of electric capacitance were received from each capacitive sensor. The oscilloscope helped to control the correct operation of the capacitance into the pulse duration transducer. At first, this helped to choose the correct operating mode of the secondary transducer, when the duration of rectangular pulses was in direct proportion with the C1, C2, C3, and C4 capacitance values in the whole range of their variation. Furthermore, the presence of the oscilloscope was necessary to detect possible oscillation stops when measuring high moisture contents (i.e., over 20%).
3. Theory/Calculation
The next step was to check the ability of the new transfer function (2) to retain stability when working with experimental results of measurements with natural random variation. The values of electric capacitances taken from capacitive sensors were not the ideal deterministic values used in Table 1, but would always have some random variation. The presence of random variation (i.e., capacitance measurement uncertainty) influences the uncertainty of the calculated moisture content values; it can decrease the robustness of the transfer function (2) up to the moment when it becomes irrelevant [37,38,39]. To check the robustness of the transfer function (2) theoretically, we introduced symmetric variation into the values of electric capacitance. The range of variation was set at a level of 0.01% from the values of electric capacitance after the analysis of metrological performance for modern capacitance and RLC meters. The calculated values of electric capacitance for capacitive sensors placed in the reference channel are shown in Table 3, while those for the sensors of the measuring channel are shown in Table 4 (initial values of electric capacitance calculated for different substances are marked with bold print).
Table 3.
Capacitance values for the sensors in the reference channel, with 0.01% variation.
Table 4.
Capacitance values for the sensors in the measuring channel, with 0.01% variation.
The robustness of the transfer function (2) was checked for the conditions when each value of sensors’ capacitance was the maximum or minimum within the symmetric variation range ±0.01%. The signs “+” and “−” in later designations represent the maximal or minimal values of electric capacitance. As we had four sensors, 16 different combinations were possible (Table 5). For example, the designation “+–++” means that the electric capacitances C1, C3, and C4 take maximal values, while C2 is minimal [40].
Table 5.
Calculated moisture values with 0.01% variation of capacitances C1, C2, C3, and C4.
As we can see from Table 5, it would be nearly impossible to use separate random results of capacitance measurements together with Formula (2), because the relative full-scale error of moisture content would be rather large. Here, it would be rational to use such robust estimators as the mean (average), median, and truncated mean—in other words, to increase the accuracy of the moisture measurements, we would have to use some kind of estimator, the uncertainty of which would be many times smaller compared with the uncertainty of separate measurements.
Table 6.
Measured values of capacitance for the sensors C1, C2, C3, and C4 with diesel fuel and mazut.
Calculated values of moisture content with mean and median values of the sensors’ capacitances for the transfer functions (1) and (2) can be found in Table 7.
Table 7.
Calculated results of the transfer functions (1) and (2), with mean and median values.
To compare the robustness of the results in Table 7, it would be rational to use dispersion analysis. At first, four values of mean square error (dispersions of repeatability) should be calculated (4):
Formula (4) requires the mean values of moisture content to be calculated for the results in Table 7. Appropriate calculations are given in Table 8.
Table 8.
Arithmetic mean values of moisture content.
After the application of Formula (4), we receive:
where is a dispersion of repeatability for the transfer function (1) with mean values of C1, C2, C3, and C4; is a dispersion of repeatability for the transfer function (1) with median values; is a dispersion of repeatability for the transfer function (2) with mean values; and is a dispersion of repeatability for the transfer function (2) with median values.
Then four dispersions of adequacy (for the data in Table 8) should be calculated as follows (5):
where N is the total number of moisture content values Wcalculated; and m is the number of nominal points of moisture content Wnom.
where is a dispersion of adequacy for the transfer function (1) with mean values; is a dispersion of adequacy for the transfer function (1) with median values; is a dispersion of adequacy for the transfer function (2) with mean values; and is a dispersion of adequacy for the transfer function (2) with median values.
To compare the dispersions of adequacy with the dispersions of repeatability, we used the following F-test: All calculations for the results given in Table 7 and Table 8 can be found in Table 9.
Table 9.
Results of robustness verification for the transfer functions (1) and (2).
4. Results/Discussion
As mentioned in the “Materials and Methods” section, the first attempt to provide effective “type uncertainty” compensation for capacitive moisture meters was described in [8], and transfer function (1) is the result.
The calculated values of the sensors’ capacitances and moisture content for the transfer function (1) were received with a help of the universal Wiener equation as one of the most popular dielectric mixture models (6):
where εmix is the dielectric permittivity of a binary material–water mixture; εn is the dielectric permittivity of dry material; εW = 80, and is the dielectric permittivity of water; and W is the volumetric moisture content, taken in absolute values.
If we apply the universal Wiener equation to the values of dielectric permittivity given in Table 1, and use it as the water-cut meter’s transfer function, we obtain a family of curves (Figure 9).
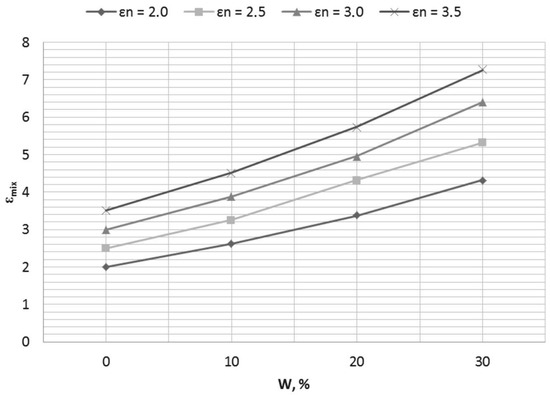
Figure 9.
Influence of the changes in the composition of a dry substance εn on the value of the dielectric permittivity of a binary mixture εmix.
Figure 9 illustrates the situation when the oil matrix composition changes as well as the water content (oil type uncertainty). If no type-uncertainty compensation happens, we have a family of transfer functions for the water-cut meter instead of one, taken as a nominal.
The transfer function (1) helps to solve this problem, and provides the possibility of measurements in emulsified fuels, where the dielectric permittivity of a dry oil εn varies in a wide range from 2 to 3.5, without any preliminary calibration.
However, Figure 1 illustrates that a transfer function received with the help of Equation (1) is still nonlinear, the influence of fuel type uncertainty remains significant, and the calculated values of moisture content do not correspond to the nominal linear model.
To determine the linear dependence between moisture content W and the (C3 − C4)/(C2 − C1) relationship, we used the method of least squares:
where a and b are unknown coefficients of a first-order polynomial (7).
To build a system of conditional equations, we had to choose average values of the (C3 − C4)/(C2 − C1) relationship (Table 10).
Table 10.
Average values for the (C3 − C4)/(C2 − C1) relationship.
A system of linear conditional equations, based on the first-order polynomial (7), is given below.
.
It was solved in a traditional way:
.
Calculated values of moisture Wcalc, received from a first-order polynomial (7):
are given in Table 11.
Table 11.
Values of moisture content W’ obtained from a first-order polynomial (7).
After obtaining the results of Table 11, it was possible to conclude that the least squares method is not effective for our case, as it was expected to obtain the linear transfer function of the water-cut meter (Figure 10). The next step of the linearization was to calculate the discrepancies ΔW between nominal points of moisture content and values from Table 11, and to approximate them by applying the instruments of general linear regression. Discrepancies between nominal points of moisture content and values from Table 11, taken for εn = 3.0, are given in Table 12.
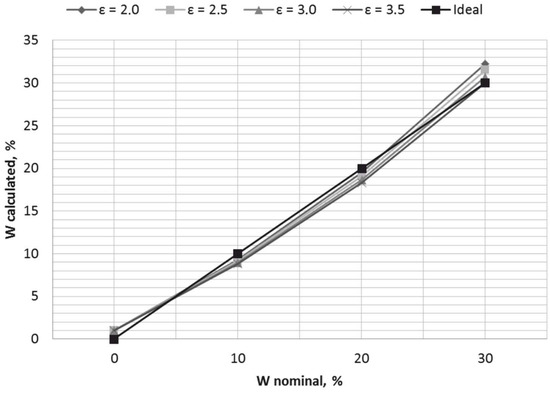
Figure 10.
Graphs of a first-order polynomial (7), placed together with an ideal transfer function of the water-cut meter.
Table 12.
Values of moisture content W’ obtained from a first-order polynomial (7).
To approximate the values of discrepancies ΔW from Table 11, a sum of four functions (1, W, W 2, and W 3) was taken with appropriate coefficients, defined with the help of Mathcad software (linfit function (x, y, Y)):
where W is a volumetric moisture content taken from the first-order polynomial (7). Formula (8) provides an ideal approximation of the discrepancies ΔW, as can be seen in Table 13.
Table 13.
Approximated values of discrepancies ΔWcalc.
Taking into account Equations (7) and (8), we received a modified transfer function of a water-cut meter (function 2), as displayed in Figure 5.
During the comparison of the water-cut meter’s transfer functions (1) and (2), it was necessary to estimate how both of them compensated for the type uncertainty, and how close both of them were to the nominal linear transfer function. Dispersions of repeatability, calculated for transfer function (1) and transfer function (2) with mean and median values, describe a possible variation in the measured moisture values for two chosen substances (diesel fuel and mazut). We can see that the values of and are approximately 1.35 times greater in comparison with and . This means that transfer function (2) provides a lower level of variability of the measured values, depending on the type of oil fuel under research. In other words, transfer function (2) is not as sensitive to fuel type as transfer function (1).
Dispersions of adequacy reflect the correspondence of experimental transfer functions (1) and (2) (taken for diesel fuel and mazut as dielectric substances with a significant difference in relative permittivity) with the nominal linear transfer function of a water-cut meter (the ideal transfer function given in Figure 4 and Figure 5). Again, it is possible to see that dispersions of adequacy calculated for the transfer function (2) give us values that are approximately 4.5 times smaller in comparison with the dispersions of transfer function (1). This means that Equation (2) provides 4.5 times better adequacy to the ideal than Equation (1).
As a general result, we can conclude that it would be rational to choose transfer function (2) with median values of moisture content as a nominal transfer function of the water-cut meter, because it has the smallest F-test value (F = 6.19).
Moisture measurement uncertainty can be estimated by using the method of mathematical programing [41]. If the function f(x) is continuous, it is possible to find maximal and minimal values of f(x) within the limit value of the function’s argument error. Absolute uncertainty of moisture measurement can be calculated as a half difference Δf = (fmax(x) − fmin(x))/2. Maximal and minimal capacitance values were taken from the results of 10 random measurements in mazut with 30% moisture content: C1min = 41.16 pF, C1max = 41.40 pF, C2min = 127.56 pF, C2max = 128.09 pF, C3min = 270.41 pF, C3max = 271.04 pF, C4min = 87.39 pF, and C4max = 88.26 pF. After substituting these capacitances into Formula (2), we received the following maximal and minimal values of moisture content: Wmax = 30.235%, and Wmin = 29.633%. The value of absolute moisture measurement’s extended uncertainty was equal to U(W) = (30.235 − 29.633)/2 = 0.3%, which is very good for a capacitive water-cut meter, because modern accuracy limits are mostly no lower than 0.5% (in [20,24], we have 1%; in [26], −0.67%; in [21], −3%...)
5. Conclusions
At first, the workability of a transfer function suggested in [17] with different types of oil fuels was checked. Four values of dielectric permittivity for dehydrated substances (εn = 2.0; εn = 2.5; εn = 3.0; εn = 3.5) and four values of moisture content (W = 0%; W = 10%; W = 20%; W = 30%) were taken for that purpose. The obtained graphs of transfer functions for the mentioned substances happened to be nonlinear, and the calculated values of moisture content were significantly different from the nominal at all points, except for W = 0%. To achieve near-linear transfer function of the capacitive water-cut meter, the method of least squares was used. The next step of linearization was in calculating discrepancies between the nominal points of moisture content and values received after the application of the LS method, with their approximation using general linear regression instruments.
Analyzing the graphs of the modified transfer functions for different moist substances, it was possible to say that they happened to be far more effective than the initial transfer function suggested in [17]. The root mean estimator was calculated for the initial transfer function, and the static function—received after general linear regression—as an integral difference between the nominal and calculated values of moisture content. The corresponding root mean estimator values were 1.3062% and 0.4158%, proving the effectiveness of transfer function (2), modified with the help of general linear regression instruments.
To check the workability of the modified transfer function in real conditions, two different fuels were taken: diesel fuel and mazut. The values of moisture content for two transfer functions, calculated for the mean and median values of C1, C2, C3, and C4, were compared with the help of dispersion analysis. After the dispersions of repeatability and adequacy had been calculated and compared, it was possible to conclude that the modified transfer function of a water-cut meter, calculated for median values of C1, C2, C3, and C4, provided minimal dispersions of repeatability and adequacy, and a minimal F-test value. Values of both dispersions for the modified transfer function were significantly smaller, as were the F-test values, proving its more robust properties (i.e., capacity for type-uncertainty compensation) and better adequacy to the nominal linear transfer function of the water-cut meter.
Author Contributions
Conceptualization, O.Z. and N.K.; methodology, O.Z.; validation, O.Z. and V.Z.; formal analysis, O.Z. and N.K.; investigation, O.Z. and V.Z.; resources, V.Z.; data curation, O.Z. and N.K.; writing—original draft preparation, O.Z.; writing—review and editing, N.K.; visualization, V.Z.; supervision, O.Z.; project administration, O.Z.; funding acquisition, O.Z. and V.Z. All authors have read and agreed to the published version of the manuscript.
Funding
This research received no external funding.
Conflicts of Interest
The authors declare no conflict of interest.
References
- Girin, O. Dynamics of the emulsified fuel drop microexplosion. At. Sprays 2017, 27, 407–422. [Google Scholar] [CrossRef]
- Abdollahi, M.; Ghobadian, B.; Najafi, G.; Hoseini, S.S.; Mofijur, M.; Mazlan, M. Impact of water–biodiesel–diesel nano-emulsion fuel on performance parameters and diesel engine emission. Fuel 2020, 280, 118576. [Google Scholar] [CrossRef]
- Kadota, T.; Yamasaki, H. Recent advances in the combustion of water fuel emulsion. Prog. Energy Combust. Sci. 2002, 28, 385–404. [Google Scholar] [CrossRef]
- Allaa, M.; Soulayman, S.; Abdelkarim, T.; Walid, Z. Water/Heavy fuel oil emulsion production, characterization and combustion. Int. J. Renew. Energy Dev. 2021, 10, 597–605. [Google Scholar] [CrossRef]
- Gopidesi, R.K.; Rajaram, P.S. A review on emulsified fuels and their application in diesel engine. Int. J. Ambient. Energy 2019, 43, 732–740. [Google Scholar] [CrossRef]
- Badran, O.; Emeish, S.; Abu-Zaid, M.; Abu-Rahma, T.; Al-Hasan, M.; Al-Ragheb, M. Impact of Emulsified Water/Diesel Mixture on Engine Performance and Environment. Int. J. Therm. Environ. Eng. 2011, 3, 1–7. [Google Scholar] [CrossRef]
- Woo, S.; Kim, W.; Lee, J.; Lee, K. Fuel properties of water emulsion fuel prepared using porous membrane method for low pollutant engine at various temperatures. Energy Rep. 2021, 7, 6638–6650. [Google Scholar] [CrossRef]
- Vellaiyan, S.; Amirthagadeswaran, K.S. The role of water-in-diesel emulsion and its additives on diesel engine performance and emission levels: A retrospective review. Alex. Eng. J. 2016, 55, 2463–2472. [Google Scholar] [CrossRef] [Green Version]
- Sugeng, D.A.; Ithnin, A.M.; Yahya, W.J.; Kadir, H.A. Emulsifier-free water-in-biodiesel emulsion fuel via steam emulsification: Its physical properties, combustion performance, and exhaust emission. Energies 2020, 13, 5406. [Google Scholar] [CrossRef]
- Salih, S.Y. Water-diesel emulsion: A review. Int. J. Adv. Eng. Technol. 2017, 10, 429–436. [Google Scholar]
- Zabolotnyi, O.; Zabolotnyi, V.; Koshevoy, N. Oil products moisture measurement using adaptive capacitive instrument measuring transducers. In Lecture Notes in Networks and Systems, Integrated Computer Technologies in Mechanical Engineering-2020; Nechyporuk, M., Pavlikov, V., Kritskiy, D., Eds.; Springer: Cham, Switzerland, 2020; Volume 188, pp. 81–89. [Google Scholar] [CrossRef]
- Khanjani, A.; Sobati, M.A. Performance and emission of a diesel engine using different water/waste fish oil (WFO) biodiesel/diesel emulsion fuels: Optimization of fuel formulation via response surface methodology (RSM). Fuel 2021, 288, 119662. [Google Scholar] [CrossRef]
- Suryadi, J.; Winardi, S.; Nurtono, T. The effect of water contents to diesel fuel-water emulsion fuel stability. IPTEK J. Technol. Sci. 2019, 30, 28–31. [Google Scholar] [CrossRef]
- Kane, J.M.; Prat-Guitart, N. Fuel moisture. In Encyclopedia of Wildfires and Wildland-Urban Interface (WUI) Fires; Manzello, S., Ed.; Springer: Cham, Switzerland, 2018. [Google Scholar] [CrossRef]
- Sharma, P.; Yeung, H. Recent advances in water cut sensing technology. In Advances in Measurements and Instrumentation: Reviews; Yuris, S.Y., Ed.; IFSA Publishing: Barselona, Spain, 2018; Volume 1, pp. 147–170. [Google Scholar]
- Teixeira, C.E.; da Silva, L.E.B.; Veloso, G.F.; Lambert-Torres, G.; Campos, M.M.; Noronha, I.; Bonaldi, E.L.; de Oliveira, L.E.L. An ultrasound-based water-cut meter for heavy fuel oil. Measurement 2019, 148, 106907. [Google Scholar] [CrossRef]
- Zabolotnyi, O.; Koshevoi, M. An effective method of bulk materials moisture measurement using capacitive sensors. J. Stored Prod. Res. 2020, 89, 101733. [Google Scholar] [CrossRef]
- Königer, F.; Stacheder, M.; Kaden, H.; Schuhmann, R. Electrophysical principles of moisture measurement. In Proceedings of the Innovative Feuchtemessung in Forschung und Praxis: Materialeigenschaften und Prozesse, Berichtsband zur Tagung, Karlsruhe, Germany, 12–14 October 2011. [Google Scholar]
- Yang, Q.; Pei, X.; Liu, F.; Wang, L.; Yan, J.; Wang, J. An electromagnetic wave based water cut meter and the influence factors of measuring accuracy. In Proceedings of the SPE/IATMI Asia Pacific Oil & Gas Conference, Nusa Dua, Bali, Indonesia, 22–25 October 2015. [Google Scholar] [CrossRef]
- Deng, X.; Yang, L.; Fu, Z.; Du, C.; Lyu, H.; Cui, L.; Zhang, L.; Zhang, J.; Jia, B. A calibration-free capacitive moisture detection method for multiple soil environments. Measurement 2021, 173, 108599. [Google Scholar] [CrossRef]
- Osadchuk, O.V.; Semenov, A.O.; Zviahin, O.S.; Semenova, O.O.; Rudyk, A.V. Increasing the sensitivity of measurement of a moisture content in crude oil. Nauk. Visnyk Natsionalnoho Hirnychoho Universytetu 2021, 5, 49–53. [Google Scholar] [CrossRef]
- Aslam, M.Z.; Tang, T.B. A high resolution capacitive sensing system for the measurement of water content in crude oil. Sensors 2014, 14, 11351–11361. [Google Scholar] [CrossRef] [Green Version]
- Campos, M.M.; Borges-da-Silva, L.E.; Arantes, D.d.A.; Teixeira, C.E.; Bonaldi, E.L.; Lambert-Torres, G.; Ribeiro Junior, R.F.; Krupa, G.P.; Sant’Ana, W.C.; Oliveira, L.E.L.; et al. An ultrasonic-capacitive system for online characterization of fuel oils in thermal power plants. Sensors 2021, 21, 7979. [Google Scholar] [CrossRef]
- Corach, J.; Galván, E.F.; Sorichetti, P.A.; Romano, S.D. Broadband permittivity sensor for biodiesel and blends. Fuel 2019, 254, 115679. [Google Scholar] [CrossRef]
- Vello, T.P.; de Oliveira, R.F.; Silva, G.O.; de Camargo, D.H.S.; Bufon, C.C.B. A simple capacitive method to evaluate ethanol fuel samples. Sci. Rep. 2017, 7, 43432. [Google Scholar] [CrossRef] [Green Version]
- Delfino, J.R.; Pereira, T.C.; Costa Viegas, H.D.; Marques, E.P.; Pupim Ferreira, A.A.; Zhang, L.; Zhang, J.; Brandes Marques, A.L. A simple and fast method to determine water content in biodiesel by electrochemical impedance spectroscopy. Talanta 2018, 179, 753–759. [Google Scholar] [CrossRef] [PubMed] [Green Version]
- Hegg, M.C.; Mamishev, A.V. Influence of variable plate separation on fringing electric fields in parallel-plate capacitors. In Proceedings of the IEEE International Symposium on Electrical Insulation, Indianapolis, IN, USA, 19–22 September 2004. [Google Scholar] [CrossRef]
- Zabolotny, A.V.; Koshevoi, M.D. Improving efficiency of the quality control of substances with dielectric properties. Telecommun. Radio Eng. 2002, 57, 177–190. [Google Scholar] [CrossRef]
- Hanai, T.; Koizumi, N.; Goto, R.; Koizumi, N.; Goto, R. Dielectric Constants of Emulsions. Bull. Inst. Chem. Res. 1962, 40, 240–271. [Google Scholar]
- Wobschall, D. A theory of the complex dielectric permittivity of soil containing water: The semidisperse model. IEEE Trans. Geosci. Electron. 1977, 15, 49–58. [Google Scholar] [CrossRef]
- Nandi, N.; Bhattacharyya, K.; Bagchi, B. Dielectric relaxation and solvation dynamics of water in complex chemical and biological systems. Chem. Rev. 2000, 100, 2013–2046. [Google Scholar] [CrossRef]
- Goncharenko, A.V.; Lozovski, V.Z.; Venger, E.F. Lichtenecker’s equation: Applicability and limitations. Opt. Commun. 2000, 174, 19–32. [Google Scholar] [CrossRef]
- Zabolotnyi, O. Moisture content control in heavy fuel during the process of emulsification with a help of capacitive sensors. In Proceedings of the 25th International Scientific Conference ‘Transport Means 2021′, Part 1, Kaunas, Lithuania, 6–8 October 2021. [Google Scholar]
- ISO 835:2007; Laboratory Glassware–Graduated Pipettes. ISO: Geneva, Switzerland, 2007; 12 p.
- Li, Y.; Feng, Y.; Yu, G.; Li, J.; Zhou, Y.; Liu, Y. Preparation and characterization of oil-in-water emulsion based on eco-friendly emulsifiers. Colloids Surf. A Physicochem. Eng. Asp. 2020, 602, 125024. [Google Scholar] [CrossRef]
- Chen, G.; Tao, D. An experimental study of stability of oil-water emulsion. Fuel Process. Technol. 2005, 86, 499–508. [Google Scholar] [CrossRef]
- Apley, D.W.; Kim, J. A cautious approach to robust design with model parameter uncertainty. IIE Trans. 2011, 43, 471–482. [Google Scholar] [CrossRef]
- Marandi, A.; den Hertog, D. When are static and adjustable robust optimization problems with constraint-wise uncertainty equivalent? Math. Program. 2018, 170, 555–568. [Google Scholar] [CrossRef] [Green Version]
- Meniailov, I.; Ugryumov, M.; Chumachenko, D.; Bazilevych, K.; Chernysh, S.; Trofymova, I. Non-linear estimation methods in multi-objective problems of robust optimal design and diagnostics of systems under uncertainties. In Lecture Notes in Networks and Systems, Integrated Computer Technologies in Mechanical Engineering-2020; Nechyporuk, M., Pavlikov, V., Kritskiy, D., Eds.; Springer: Cham, Switzerland, 2020; Volume 1113, pp. 198–207. [Google Scholar] [CrossRef]
- Zabolotnyi, O.V.; Zabolotnyi, V.A.; Koshevoi, M.D. Conditionality examination of the new testing algorithms for coal-water slurries moisture measurement. Sci. Bull. Nat. Min. Univ. 2018, 1, 51–59. [Google Scholar] [CrossRef]
- Chen, H.-Y.; Lee, A.C.; Lee, C.F. Alternative Methods to Deal with Measurement Error. In Handbook of Financial Econometrics, Mathematics, Statistics, and Machine Learning; World Scientific Publishing Co. Pte Ltd.: Singapore, 2020; pp. 1439–1484. [Google Scholar] [CrossRef]
Publisher’s Note: MDPI stays neutral with regard to jurisdictional claims in published maps and institutional affiliations. |
© 2022 by the authors. Licensee MDPI, Basel, Switzerland. This article is an open access article distributed under the terms and conditions of the Creative Commons Attribution (CC BY) license (https://creativecommons.org/licenses/by/4.0/).