Abstract
China has numerous relics from tomb murals. Over 70 years (1949–2019), 1495 relic sites were excavated. Distributed across more than two-thirds of China’s provincial administrative regions, the relics of tomb murals span from the Han Dynasty (206 BC–220 AD) to the Qing Dynasty (1644–1911). In previous studies, scholars focused on the qualitative analysis of tomb murals. In this paper, we applied GIS tools to visualize these relics and analyze their density values for the first time. In terms of academic standards, we propose the material distribution index, the regional distribution index, and the temporal distribution index for relics. The academic innovation of this paper is threefold. First, with regard to the distribution of relic sites, this paper draws a distribution map of the relic sites of Chinese tomb murals and explores the preliminary significance of these relic sites in the culture of the Yellow River basin and its ancient political center. Second, in terms of synchronic viewpoints, this paper designs a material distribution map and a kernel density distribution map based on the distribution map of relic sites. Third, from a diachronic viewpoint, this paper sketches the secondary-level distribution map of six historical periods for the overall kernel density distribution map of relic materials in nine provinces, whereby it outlines the general trend of the development of Chinese tomb murals and the contributions of nine provinces. In brief, with the use of the GIS tool, this paper obtains information on the distribution of relics and reveals the characteristics of tomb murals in terms of their regional and temporal distributions through the ranking of various density values. This paper aims to construct a frame of reference for testing traditional theoretical achievements from the two perspectives of information acquisition and theoretical analysis.
1. Introduction
In the historical development of global art, tomb murals represent a unique phenomenon within religious art. Tomb murals are found underground; their theme involves the imagination of the afterlife, and their content concerns the description of the present life. Accordingly, tomb murals are concerned with juxtaposed relationships. In terms of their spatial location, tomb murals exist underground, in parallel with ground art. In the communication model, tomb murals remain intact after being created and become popular after being excavated by archaeologists in later generations, in parallel with open-air art. In terms of content, tomb murals depict how tomb owners and tomb builders envisage the afterlife, depicting religious art in parallel with secular art. The combination of these three juxtaposed relationships endows tomb murals with distinctive value for spatial research.
This paper considers the explicitly religious attributes of tomb murals. All of the images on tomb murals imagine the tomb owner and related people in the other world. Specifically, a tomb mural has three religious attributes. First, thematically speaking, it often shows that the tomb owner hopes to experience the rebirth of life extension in the other world. Second, considering the participants in tomb murals, the tomb owner and other participants in the tomb recognize the transformation of life and death, and their behavior is religious. Third, in terms of artistic characteristics, tomb murals exist underground. This is a closed structure, which is different from an open structure at ground level. In other words, tomb murals are underground mural relics that express the experience of rebirth.
China has the largest number of tomb mural relics in the world. At present, 1495 relic sites have been excavated. Chinese scholars have also achieved highly significant results in their research on tomb murals. In the CNKI database, under the theme “tomb mural”, 1235 papers published since 2010 can be retrieved. Foreign scholars show less interest than their Chinese peers. In the JSTOR database, under the theme “Chinese tomb mural”, only 143 papers dating from 2010 can be retrieved. In the WOS (Web of Science) database, under the theme “Chinese tomb mural”, just 119 papers written after 2010 can be retrieved. In the ResearchGate database, under the theme “Chinese tomb mural”, only 90 papers written after 2010 can be retrieved.
Situated in the field of the theoretical study of world religions, this paper is the first to use the GIS tool to research Chinese tomb murals. Jeanne Halgren Kilde observes that “In the past few decades, scholars’ interest in and understanding of the many roles played by space in the construction of religious meaning has advanced significantly. Drawing upon analytical models from a variety of disciplines—sociology and social theory, geography and architecture, and literary and critical theory in particular—scholars have interrogated the role of space as a constitutive component in the formation of religious meaning and experience.” (Kilde 2014). Despite their theoretical achievements, they fail to address Chinese tomb murals.
In terms of spatial research, there are a substantial number of Chinese tomb mural relics with complete geographical information. Synchronically, these relic sites are scattered across 27 provincial administrative regions. Diachronically, these relic sites span from the Han Dynasty to the Qing Dynasty. Therefore, this paper emphasizes the importance of relic sites to spatial research, aiming to visualize the distribution of Chinese tomb mural relic sites.1
With a long history and wide distribution, Chinese tomb murals offer a deeply material sense of national identity. In Spatiality and Religion, John Corrigan argues that “Indeed, religion has a way of developing in conjunction with national identity so that a national landscape often is contoured in explicitly religious ways.” (Warf and Arias 2009). This paper uses the GIS tool to analyze tomb mural relics and explore the national landscape composing of a large number of relics. To this end, this paper designs three basic index systems. The first is the distribution index of the types of relics. Chinese tomb murals encompass complex types. Concerning materials, tomb murals are largely made of mud, stone, and brick. To put it another way, the material is used as an index to divide the three types of tomb murals, i.e., the mud type, the stone type, and the brick type. In “Materializing the Bible: A Digital Scholarship Project from the Anthropology of Religion”, James S. Bielo and Claire Vaughn affirm that: “Religious actors use material forms to address the central problems that define their religious tradition (s), such as authority, belonging, and presence.” (Cantwell and Petersen 2021). Scholars hold the view that tomb murals denote a religious act, and the division of material means the division of the “corporeal form”. In this way, the distribution characteristics of Chinese tomb mural relics can be scrutinized. The second index system is the regional distribution index of relics. China comprises a vast territory with complex regional divisions. The name of this one place varies across ancient and contemporary periods. This paper refers to the current administrative units. Simultaneously, as the excavation of tomb murals was mainly carried out during the last century, current administrative units present the contemporary distribution of relic sites. Therefore, this paper chooses 34 current provincial administrative regions (provinces) to assess the regional distribution index of relics. The third index is the temporal distribution index of relics. The existing scholarship of Chinese tomb murals takes the horizontal cave tomb (from the Han Dynasty) as its primary research object (Huang 1996). Moreover, Chinese history generally consists of six stages, i.e., the Han Dynasty; the Wei, Jin, Southern, and Northern Dynasties; the Sui, Tang, and Five Dynasties; the Song, Liao, Jin, and Western Xia Dynasties; the Yuan Dynasty; and the Ming and Qing Dynasties (Wang 2018). To clearly determine its temporal boundaries, this paper takes these six stages as the temporal distribution index for relics. The three index systems help to effectively identify materials for spatial research and to discuss tomb murals (as visual images).
2. Design and Analysis of the Distribution Map of the Number of Relic Sites
The following map displays the distribution of the number of Chinese tomb mural relic sites.
2.1. Data Source
In terms of information sources, this paper collects data from “Research on Archaeological Chronicles of Chinese Religious Arts (1949–2019)2, a National Social Science Fund of China Key Project (No.: 17AZJ002), which was concluded in 2020. The project surveys 70 years of archaeological materials related to Chinese tomb murals from 1949 to 2019, and therefore currently provides the most complete dataset.
2.2. Index of Numerical Distribution
This paper designs two indexes: a data index, which refers to the number of Chinese tomb mural relic sites (1495); and a spatial index, generated according to contemporary provincial administrative regions in China (34).
Based on these two indexes, this paper draws a distribution map of the number of Chinese tomb mural relic sites using the GIS tool (see Figure 1).
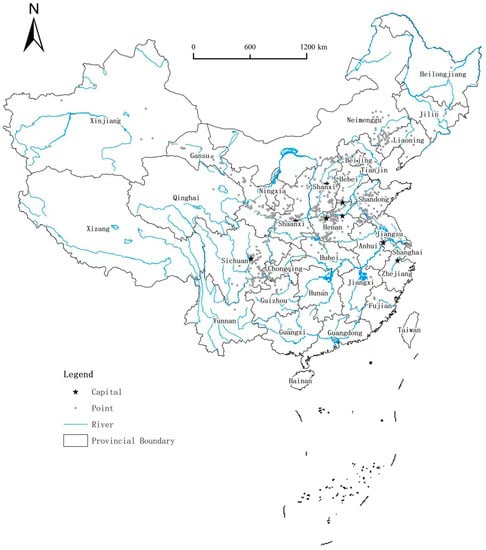
Figure 1.
Distribution map of Chinese tomb mural relic sites.
2.3. Analysis of the Numerical Distribution Map
Relic sites are found widely across China. Tomb mural relics have been found in 27 of the 34 provincial administrative regions, demonstrating that tomb murals are a nationwide religious phenomenon.3
Moreover, a large number of relic sites are distributed in the Yellow River basin. The Yellow River basin winds through nine provinces, i.e., Qinghai, Gansu, Ningxia (the upper reaches), Shanxi, Sha’anxi, Inner Mongolia (the middle reaches), and Henan and Shandong (the lower reaches), accounting for 78.80% of the total relic sites. It is clear that the cultural regions near the Yellow River basin played a significant role in fostering the development of Chinese tomb murals (see Table 1).

Table 1.
Survey of tomb mural relic sites in provinces near the Yellow River basin.
The distribution of relic sites shows a positive correlation with areas considered political centers. Among the 27 provinces with tomb mural relic sites, this paper introduces the index of ten ancient capitals4. The proportion of tomb mural relics in ancient capitals constitutes 60.74% of the total. Therefore, the distribution of tomb mural relics has close ties with the political centers of various dynasties (see Table 2). In particular, Henan has the largest number of ancient capital relics, accounting for 17.79% of the total.

Table 2.
Statistics related to tomb mural relic sites in the provinces where ten ancient capitals are located.
3. Distribution of the Types of Relic Sites and the Kernel Density Distribution in Major Regions
In synchronic terms, this paper discusses the distribution of the types of relic sites and the kernel density distribution in major regions.
Having drawn the distribution map of Chinese tomb mural relic sites, this paper attains a general understanding of the number of relics, and is therefore able to calculate the differences between the selected provinces. Notably, the sizes and types of these provinces vary. This raises the question of how these two factors influence the sites in each province. To solve this problem, we drew a distribution map and a distribution density table based on the types of tomb mural relic sites to accurately measure the contributions of these provinces.
Distribution Map Index and Basic Density Statistics.
3.1. Distribution Map Index
Based on “The Distribution Map of the Number of Chinese Tomb mural Relic Sites” (the number of relic sites and provinces), this paper adds the three deep-analysis indexes of mud density, brick density, and stone density and recollects the statistical data, so as to obtain a more accurate understanding via data visualization (see Figure 2).
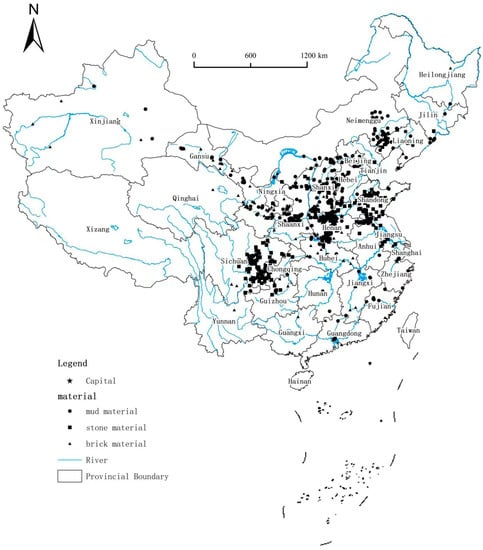
Figure 2.
Distribution map of the types of Chinese tomb mural relics.
The visual expression of the data reveals that the distribution of mud and stone tomb murals shows a south–north trend, while the distribution of brick tomb murals is proportionate. To better explain the distribution of types, we produced basic density statistics.
3.2. Basic Density Statistics of the Distribution of Types
We drafted a distribution density table for the types of Chinese tomb murals (see Table 3) and analyzed the density values of these provinces in descending order. The average density values of the indexes are as follows: overall density 3.00, mud density 1.46, brick density 0.66, and stone density 0.91. The shaded parts in the table indicate the provinces with lower-than-average density values.

Table 3.
Distribution density of the types of Chinese tomb murals.
- ①
- Rankings of the Contributions of the Type Density Distribution
There are seven provinces with above-average values for mud density: Shanxi, Beijing, Henan, Sha’anxi, Liaoning, Hebei, and Shandong (in descending order).
There are eight provinces with above-average values for brick density: Henan, Shanxi, Gansu, Sichuan, Jiangsu, Ningxia, Hubei, and Guizhou (in descending order).
There are seven provinces with above-average values for stone density: Henan, Sichuan, Chongqing, Shandong, Jiangsu, Sha’anxi, Shanxi, and Guizhou (in descending order).
In general, Henan and Shanxi rank in the top two in terms of overall density, with values two to three times higher than those of the other provinces.
- ②
- Ranking the Choice of Types in Terms of the Density Distribution
Using the table of type density distributions, we ranked the chosen types of tomb murals in various provinces. The mud type ranked first. Mud was chosen in 22 regions, accounting for 81.48% of the tomb murals. Mud-type tomb murals were not found in Chongqing, Guizhou, Anhui, Qinghai, or Guangxi. The brick type ranked second. Brick was evidenced in 23 provinces, accounting for 85.18%; it was not found in Beijing, Jilin, Hunan, and Heilongjiang. The stone type ranked third. Stone was found in 19 provinces, accounting for 70.37% of tomb murals, but was not evidenced in Beijing, Fujian, Jilin, Xinjiang, Hunan, Qinghai, Heilongjiang, or Guangxi. The reasons remain unclear.
- ③
- Henan and Shanxi Take the Lead in the Distribution of the Type Density
The distribution data of the ten ancient capitals mentioned above revealed that the density values for Henan and Shanxi were very high, which can be associated with their roles as political centers. The relics of tomb murals in these regions are usually large in scale. This suggests that the tomb owners were very wealthy or enjoyed high political status. Henan and Shanxi served as capitals during the course of Chinese history. In Henan, Luoyang was the capital of the Eastern Han Dynasty, the Western Jin Dynasty, and the Northern Wei Dynasty. Kaifeng was the capital of the Northern Song Dynasty. In Shanxi, Pingcheng (present-day Datong) was the capital of the Northern Wei Dynasty, and Taiyuan was the capital of the Five Dynasties and Ten Kingdoms. The high-density values of Henan and Taiyuan attest to the connection between the development of tomb murals and political evolution, as stated in Approaching Religious Space: An Overview of Theories, Methods, and Challenges in Religious Studies: “Space, as any reading of the recent literature on identity will show (in terms such as the politics of location, the critical space of the margin, third space, etc.), is also a mental or conceptual dimension, one which may float free of any physical mooring, but which uses the notion of space metaphorically and may provide a means of imagining and giving expression to human possibility, cultural difference, the imagination itself, as well as social relations.” Kilde (2014).
- ④
- Analysis of High-Density Regions
There are nine provinces with above-average-density values, which are referred to as high-density regions. Therefore, this paper analyzes the high-density regions (Figure 3).
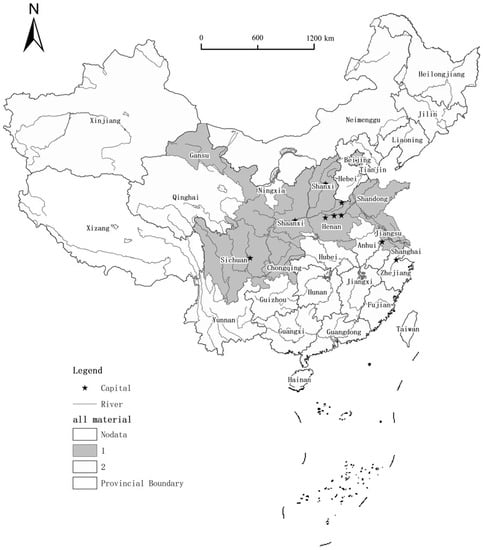
Figure 3.
Distribution map of the density of types of relic sites in nine provinces.
In descending order, the provinces with above-average overall density are Henan, Shanxi, Beijing, Sha’anxi, Sichuan, Shandong, Chongqing, Jiangsu, and Gansu. The Yellow River passes through six of these provinces, and ten provinces have ancient capital cities (barring Gansu). Notably, Gansu cities served as capitals historically. For instance, in the Sixteen Kingdoms, Lanzhou was the capital of the Western Qin Dynasty (385–400) and the capital of the Later Liang Dynasty (386–403). Meanwhile, Jiuquan was the capital of the Western Liang Dynasty (400–421).
As stated above, the distribution map of the density of the types of relic sites in nine provinces shows the major distribution regions of Chinese tomb murals and clarifies the correlation between regional cultures and the contributions of relic sites. Describing space in her Spatial Theory and Method for the Study of Religion, Kim Knott stated that “social and cultural theory has reconceived ‘space’ as dynamic, in terms of its relationship to power, history and time, its condition of simultaneity and the various ways in which it is experienced and represented. No longer is it seen as the passive container or backdrop for human activity. It is thoroughly enmeshed in embodiment and everyday practice, knowledge and discourse, and in processes of production and reproduction, and consequently it is enmeshed in religion no less than in other areas of social and cultural life” (Knott 2005). As such, it is necessary to further consider the spatial relationship between the relics. To address this problem, we analyzed the kernel density of these regions to further investigate the spatial distribution of various types.
Selection and Calculation Methods for Kernel Density Regions:
- ①
- Selection Index for Kernel Density Data
As calculated above, the number of relics in nine provinces account for 77.19% of the total (Table 4), showing a typical trend. In terms of historical periods, the Han Dynasty relic sites account for the highest proportion, reaching 86.82%, while relics from the Wei and Jin Dynasties account for the lowest proportion, totaling 68.02%. In terms of type, stone tomb murals account for 89.24% (the highest), brick tomb murals account for 80.87%, and mud tomb murals account for 65.82%. Generally speaking, the relics in the nine provinces under consideration account for more than two-thirds of the total number. Additionally, in the top nine regions in terms of overall density, there are three top provinces in each type of density. We therefore conclude that case studies of nine provinces reveal differences in the spatial and temporal distributions of the relic sites.

Table 4.
Statistics of the proportion of the types of relic sites found in nine provinces.
- ②
- Method for Calculating the Kernel Density
The kernel density analysis tool was used to calculate the density of elements in their surrounding neighborhoods. The tool can calculate the density of both point features and line features.
The calculation method for point features is as follows. Kernel density analysis is used to calculate the density of point features around each output grid pixel. By default, the units are selected according to the linear units defined by the projection of the input point feature data, or otherwise specified in the output coordinate system environment settings. If the area unit is selected, the calculated pixel density will be multiplied by the corresponding factor and then written to the output grid.
The kernel density can calculate the sample’s point density and determine the element distribution’s concentration area. The formula for calculating kernel density is
In particular, K stands for the kernel function, (x − xi)2 + (y − yi)2 stands for the square of the distance between the point (x − xi) and the point (y − yi), n stands for the number of samples, and h stands for the bandwidth. Given the geographical characteristics of relic sites, this paper sets the bandwidth as the default bandwidth.
Taking nine provinces as targeted regions, we separately screened their point data among national data using a comparative approach. We used ArcGIS, a kernel density analysis tool, to analyze the kernel density. For the regional statistical analysis, the regional statistical analysis tool in ArcGIS was used to combine kernel density values with the panel data of nine provinces and calculate the average kernel density value of each province. With regard to the data classification of nine provinces, the data classification method of the natural point of discontinuity was used to divide the data into high-density, medium-density, and low-density categories, and the visual distribution is marked with colors ranging from dark to light.
- ③
- Analysis of the Kernel Density Distribution Map
Regarding the kernel density of the overall type distribution in nine provinces, there were three main characteristics. First, Henan and Shanxi constitute the regions with the highest kernel densities (Figure 4a), and the surrounding areas are in the regions with medium densities. This substantiated the growing influence of the entire region that centers on Henan and Shanxi. Second, Henan has the highest kernel density for all four types, indicating that Henan is representative of tomb mural relic sites as a whole. Third, Henan and Shanxi boast high-density regions for the overall type, which overlap with the regions shaded with high densities of mud-type (Figure 4b) and brick-type (Figure 4c) relics. Sha’anxi (Figure 4b) is a region with high-density mud-type relics, but has medium density (Figure 4a) in the overall distribution, suggesting that mud distribution is closely related to widespread distribution.
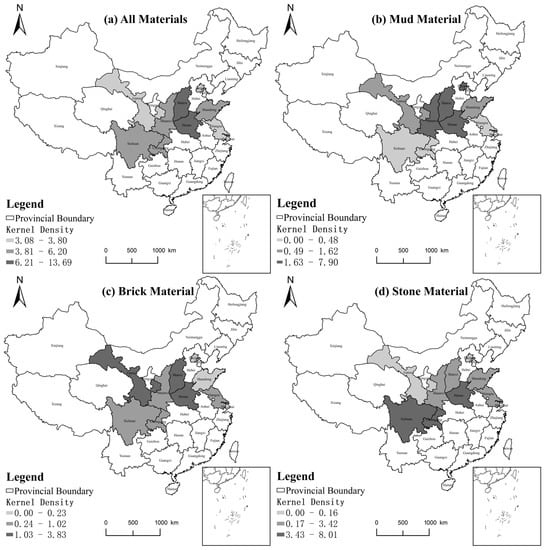
Figure 4.
Overall kernel density distribution map of the types of relic sites in nine provinces.
Based on separate investigations of the three types of high-density regions, except for Sha’anxi and Shanxi, three regional characteristics can be identified. First, for mud materials (Figure 4b), the high-density regions include Henan, Shanxi, Sha’anxi, and Beijing. Second, for brick materials (Figure 4c), the high-density regions include Henan, Shanxi, and Gansu. Third, for stone materials (Figure 4d), the high-density regions include Henan (the highest) and Sichuan and Chongqing (southwestern China), exclusive of Shanxi.
4. Analysis of the Kernel Densities of Various Types of Major Relic Sites
From a diachronic perspective, we carried out an analysis of the kernel densities of the various types of major relic sites.
The GIS tool allows for the visualization of relics from Chinese tomb murals and alters our understanding of these murals. Based on our overall understanding of the relics, we generated a distribution map of the various types in order to interpret the diversity of the material distribution. Focusing on major relic sites, we attempted to identify the consistencies and differences in the distribution of relic types in the development of Chinese tomb murals. Kim Knott states that “social relations exist in and through space, and ‘the spatial is socially constituted’. Religion, then, which is inherently social, must also exist and express itself in and through space, and must play its part in the constitution of spaces (Knott 2014)”. Therefore, we generated kernel density maps for six historical periods and examined the spatial distribution of relics in order to offer synchronic and diachronic assessments of the influence of different types. According to the ranking of density values, we defined the nine provinces with above-average density values as major relic sites and analyzed the kernel density of the types of relic sites in these nine provinces in different periods.
4.1. Kernel Density Analysis of the Types of Han Dynasty Relic Sites in Nine Provinces (Figure 5)
As the information in Figure 5 suggests, the type distribution of the Han Dynasty relic sites shows two characteristics. Firstly, Shandong, Henan, and Sichuan have the highest distribution densities of the overall type (Figure 5a). Compared with the maps of various types in the same period, the stone material (Figure 4d) accords with this type, meaning that stone tomb murals prevailed in the Han Dynasty. Secondly, the three types of high-density regions (Figure 5a–c) all center on Henan, which shows that Henan represented the mainstream of tomb murals in the Han Dynasty and that the three types coexisted in an inclusive way.
On the relationship between the four secondary-level distribution maps, we noted some differences after ranking the kernel density of the three types. First, Henan is the only high-density region for brick density (Figure 5c), in contrast to the low-density regions around it, indicating the limited influence of brick-type tombs in the Han Dynasty. Second, in terms of the distribution of mud materials (Figure 5b), although Henan is the only high-density region, the surrounding areas are all medium-density regions, indicating the spatial influence of mud-material tombs. Third, in terms of high-density regions, stone differs from mud and brick. High-density regions include Henan, Shandong, Sichuan, and Chongqing. Notably, Shandong and Sichuan both belong to the category of high-density regions for all of the types (Figure 4a), which demonstrates their widespread influence.
We also compared the correlations of the secondary-level distribution map. First, in terms of regional contributions, regions with various high-density types in the Han Dynasty include Henan, which affirms that Henan played a core role in the development of the Han Dynasty tomb murals. Second, the density of stone materials in the Han Dynasty basically tallies with the high-density region of the overall stone material (Figure 4d). This shows that on the one hand, stone material as a type emerged during the Han Dynasty; on the other hand, Shandong does not belong to the overall high-density stone material regions (Figure 4d), implying that Shandong developed distinctive characteristics during the Han Dynasty.
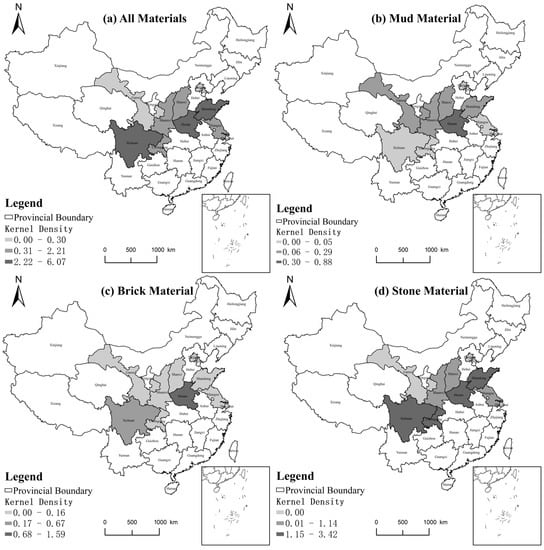
Figure 5.
Kernel density distribution map of the types of Han Dynasty relic sites.
4.2. Analysis of the Kernel Density of the Types of Relic Sites in the Wei, Jin, Southern, and Northern Dynasties in Nine Provinces
As Figure 6 suggests, the type density of nine provinces in the Wei, Jin, Southern, and Northern Dynasties has two characteristics. First, for the main types, the regions with the highest kernel densities are Jiangsu, Shanxi, and Gansu (Figure 6a). Compared with the maps of various types in the same period (Figure 6b–d), the brick material type (Figure 6c) best matches the overall type, indicating that brick material had the greatest influence in the Wei and Jin Dynasties. Secondly, in terms of regional influence, Shanxi is a region with high-density distribution in the map of overall types in this period (Figure 6a). Shanxi is a low-density region in the distribution of brick material (Figure 6c), yet a high-density region in the distribution of mud and stone materials (Figure 6b,d). Taking the overall kernel density map of the nine provinces (Figure 4b,d) into account, these two types belong to high-density regions. Evidently, since the Wei and Jin Dynasties, mud- and stone-type relics in Shanxi have exerted an important influence.
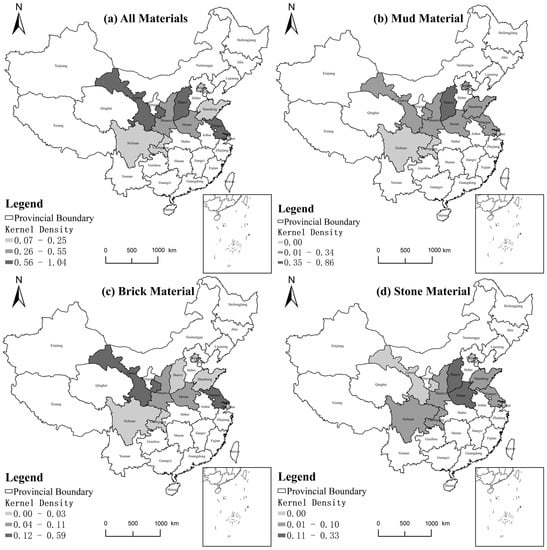
Figure 6.
Distribution map of the kernel density of types of relics sites in the Wei, Jin, Southern, and Northern Dynasties.
Regarding brick material density, Henan transformed from a high-density region to a low-density region during the Han Dynasty (Figure 5c), forming a sharp contrast. Moreover, Jiangsu became a high-density region, but constituted a medium-density region in the distribution map of the overall type in nine provinces (Figure 4c). This indicates that this type represents the mainstream style in the Wei and Jin Dynasties. Additionally, in comparing the overall type map for brick material (Figure 4c), we demonstrate for the first time that Gansu showed an upward trend in brick material relics in the Wei and Jin Dynasties.
We also compared the correlations of the secondary-level distribution map. The high-density regions shifted from Shandong, Henan, and Sichuan (Figure 5a) to Jiangsu, Shanxi, and Gansu (Figure 6a) between the Wei, Jin, Southern, and Northern Dynasties and the Han Dynasty. Moreover, in the high-density distribution of various types, Henan is not the center for mud and brick materials as it was during the Han Dynasty (Figure 5b,c). The distribution region of high-density stone material diminishes remarkably, from four (Shandong, Henan, Sichuan, and Chongqing) to two (Henan and Shanxi).
4.3. Analysis of the Kernel Density of the Types of Relic Sites in the Sui, Tang, and Five Dynasties in Nine Provinces
As Figure 7 suggests, in the overall type of the Sui, Tang, and Five Dynasties (Figure 7a), the high-density region includes only Sha’anxi, which signals its significant difference from the regions in the Han, Wei, Jin, Southern, and Northern Dynasties. Secondly, with inconsistent density values, the distribution areas of mud material in high-, medium- and low-density regions (Figure 7b) coincide with the overall type (Figure 7a), indicating that mud relics prevailed in this period.
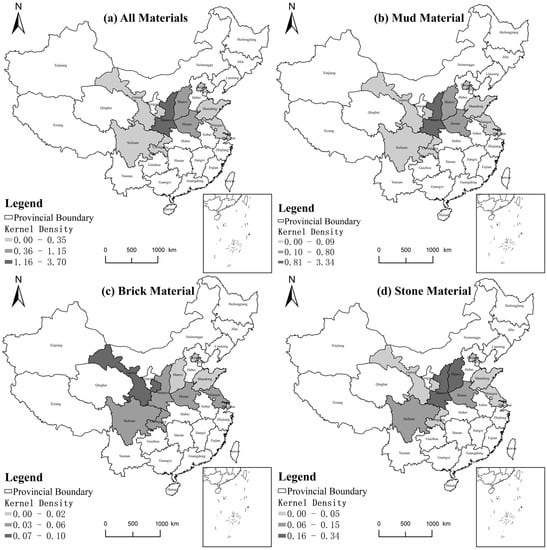
Figure 7.
Distribution map of the kernel density of the types of relic sites in the Sui, Tang, and Five Dynasties.
This paper also compares the correlations of the secondary-level distribution map, making the following findings. First, in terms of mud materials, Sha’anxi becomes a high-density region for the first time and belongs to a high-density region in terms of the overall mud-material type in the nine provinces (Figure 4b), which signifies that Sha’anxi was highly influential in the Sui, Tang, and Five Dynasties. Second, early-stage accumulation plays an important role. For example, as a high-density brick material region (Figure 7c), Gansu remains consistent with the Wei and Jin Dynasties (Figure 6c). As a high-density stone material region (Figure 7d), Shanxi also remains consistent with the Wei and Jin Dynasties (Figure 6d). Third, in this period, Sha’anxi became a high-density stone-material region for the first time, which indicates that stone material was increasingly prevalent during this time (Figure 7b).
4.4. Analysis of the Kernel Density of the Types of Relic Sites in the Song, Liao, Jin, and Western Xia Dynasties in Nine Provinces
As Figure 8 suggests, Shanxi and Henan belong to the group of regions with the highest density (Figure 8a), as shown in the distribution maps for mud (Figure 8b) and brick materials (Figure 8c). This illustrates that these two types were dominant in this period. The density value in this period is higher than that in other periods. The high-density value reaches 0.90–4.28, the medium-density value reaches 0.31–0.89, and the low-density value reaches 0.00–0.30, with a high coverage rate of the relics in this period. Moreover, the high-density regions in this period differ from those in the Sui, Tang, and Five Dynasties (Figure 7), shifting from Sha’anxi to Shanxi and Henan.
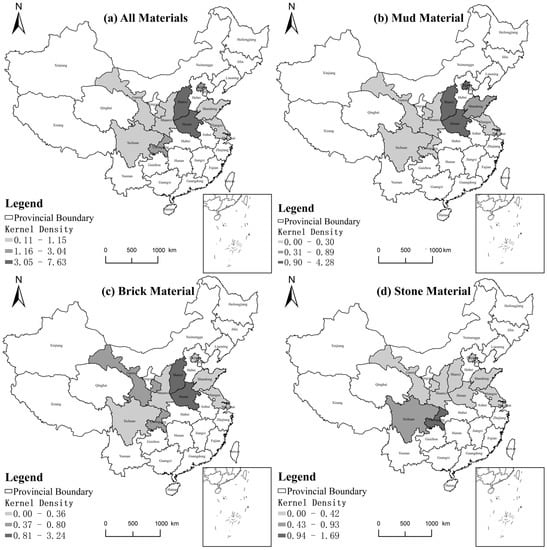
Figure 8.
Distribution map of the kernel density of the types of relic sites in the Song, Liao, Jin, and Western Xia Dynasties.
By comparing the correlations of the secondary-level distribution map, we found that the major high-density mud material regions include Shanxi and Henan (ranking in the top two) and Beijing (Figure 8b); this is the only time that Beijing was a region with a high density of relics. For stone-type relics, Sichuan and Chongqing constitute high-density regions (Figure 5d), which means that they had widespread influence in the Song, Liao, and Jin Dynasties. For high-density brick material, the landscape undergoes a radical change between the Wei, Jin, Southern, and Northern Dynasties (Figure 6c) and the Sui, Tang, and Five Dynasties (Figure 7c) and starts to encompass Henan and Shanxi (Figure 8c), as shown in the overall map of high-density regions in the nine provinces (Figure 4c); this indicates that high-density brick regions were influential in this period. Notably, Henan boasted a high-density region for brick material during the Han Dynasty (Figure 5c), while Shanxi became a high-density brick-material region for the first time.
4.5. Analysis of the Kernel Densities of the Types of Relic Sites in the Yuan Dynasty in Nine Provinces
Figure 9 suggests that in terms of the overall type of relic sites in the Yuan Dynasty (Figure 9), Shanxi constituted a high-density region for the three types, indicating that Shanxi had a pronounced influence in this period.
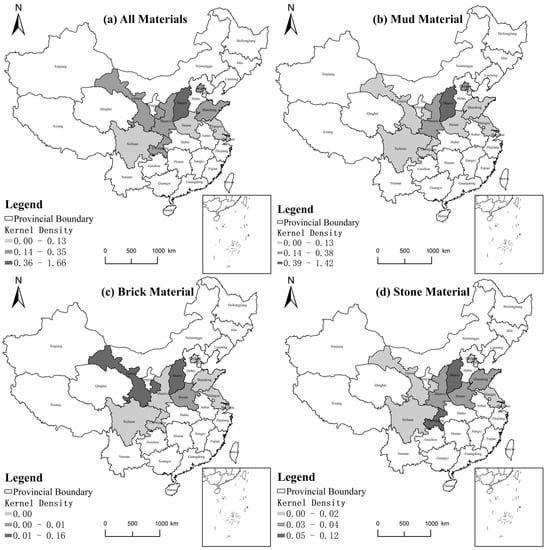
Figure 9.
Distribution map of the kernel density of the types of relic sites in the Yuan Dynasty.
Additionally, a comparison of the correlations of the secondary-level distribution map indicates that the high-density mud material region (Figure 9b) entirely coincided with the high-density region (Figure 9a) for the overall type map of the same period, indicating that mud material was mainstream during this period. Moreover, brick and stone materials were distributed in other high-density regions. The former includes Gansu, as shown in the high-density brick material regions in the Wei, Jin, Southern, and Northern Dynasties (Figure 6c) and the Sui, Tang, and Five Dynasties (Figure 7c). The latter includes Chongqing, as shown in the high-density region in the Song, Liao, Jin, and Western Xia Dynasties (Figure 8c).
4.6. Analysis of the Kernel Density of the Types of Relic Sites in the Ming and Qing Dynasties in Nine Provinces
Figure 10 shows that Henan, Sichuan, and Chongqing (Figure 10a) ranked in the top three in the overall type of high-density relic sites in the Ming and Qing Dynasties (Figure 10a). Stone material has the highest contact ratio, and the relevant regions included Sichuan and Chongqing, indicating that stone material had the largest influence in the Ming and Qing Dynasties.
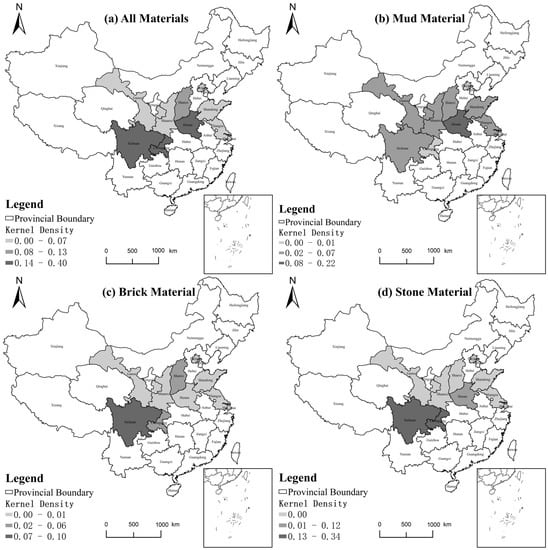
Figure 10.
Distribution map of the kernel density of the types of relic sites in the Ming and Qing Dynasties.
A comparison of the correlations of the secondary-level distribution map also indicates that the high-density regions (Figure 10a) in the map of the total types of the Ming and Qing Dynasties accord with the high-density regions in the map of the total types of stone in the nine provinces (Figure 4d), demonstrating the influence of stone material in this period. Moreover, according to the distribution density of mud material, the medium-density regions center around Henan, a high-density region (Figure 10b). Additionally, for the distribution of brick, Sichuan constitutes a high-density region, as shown in the distribution of brick density in the Han Dynasty (Figure 5c). However, according to the brick distribution map of the nine provinces, Sichuan belongs to a medium-density region, with brick material having a limited influence.
5. Conclusions
Chinese tomb murals have developed over a long time period; the tombs have many types and a wide distribution. There are more than 1000 relic sites of Chinese tomb murals, and these numbers are increasing with the continuous progress of archaeological activities. This signals that such tombs constituted a significant religious phenomenon; many complex phenomena are synthesized in the distribution relationship, affecting the academic understanding of the distribution of Chinese tomb murals. The existing scholarship has achieved no satisfactory results in the spatial research into tomb murals. This paper uses the GIS tool to visualize 1495 sites of Chinese tomb murals excavated from 1949 to 2019 in order to gain more significant results for spatial research.
In methodological terms, visual distribution maps of relic sites were produced to establish an information acquisition system. In particular, four basic indexes, i.e., the distribution of relic sites, the distribution of mud relic sites, the distribution of stone relic sites, and the distribution of brick relic sites, were designed to draw the distribution map, obtain various kinds of information, and form an information model for spatial research. A total of four primary-level distribution maps and six secondary-level distribution maps were constructed.
In theoretical terms, the distribution of relics in provincial administrative regions was determined in line with the quantity distribution and density value level, and an information analysis system was established. This paper clarifies the following: (1) In terms of quantity distribution, the influence of the Yellow River basin is greater than that of the Yangtze River basin. (2) In terms of the density value, the national average density values were obtained to rank the distribution of relics in 27 provinces. Among these provinces, nine provinces with above-average values make the greatest contributions to the development of Chinese tomb murals, and Henan and Shanxi lead the list. (3) In terms of kernel density, this paper acquired different types of information on the selection of material types in different provinces, both synchronically and diachronically.
In summary, by designing a visual distribution map of Chinese tomb murals, this paper establishes a superimposed information acquisition model, accounting for the overall distribution of relics, the overall material distribution, the overall kernel density distribution, and the kernel density distribution at each stage of the tomb murals’ development. In other words, this paper forges a new path for spatial research and obtains a new understanding in this regard. One limitation of this paper concerns the fact that the theoretical results obtained from the visual distribution map have not been compared with traditional academic theoretical results. Future research will comprehensively evaluate the results of this spatial research.
Author Contributions
Conceptualization, Y.S.; methodology, Y.S.; software, Y.S. and X.W.; validation, Y.S.; formal analysis, Y.S.; investigation, Y.S.; resources, X.W.; data curation, Y.S.; writing—original draft preparation, Y.S.; writing—review and editing, X.W.; visualization, Y.S.; supervision, X.W.; project administration, X.W. All authors have read and agreed to the published version of the manuscript.
Funding
This research received no external funding.
Institutional Review Board Statement
Not applicable.
Informed Consent Statement
Not applicable.
Data Availability Statement
This project, which was presided over by Xiaoyang Wang, has been completed. The project comprehensively assesses the archaeological achievements of Confucian, Buddhist, and Taoist arts from 1949 to 2019; tomb murals represent Confucian art. The achievements of the project will be published by Science Press in the form of a series of books in 2023, titled Archaeological Chronicles of Chinese Religious Arts (1949–2019) (12 Volumes).
Conflicts of Interest
The authors declare no conflict of interest.
Notes
| 1 | All maps in this paper are based on the standard map with the GIS review number (2016) no. 1595, as downloaded from the standard map service website of the National Administration of Surveying, Mapping and Geoinformation. The base map is not modified. |
| 2 | This project, which was presided over by Xiaoyang Wang, has been completed. The project comprehensively assesses the archaeological achievements of Confucian, Buddhist, and Taoist arts from 1949 to 2019; tomb murals represent Confucian art. The achievements of the project will be published by Science Press in the form of a series of books in 2023, titled Archaeological Chronicles of Chinese Religious Arts (1949–2019) (12 Volumes). The data presented in this paper originated from the volume Overview and have been authorized by Xiaoyang Wang, the leader of the project. All the table data have been further sorted based on the information provided by the data source. |
| 3 | So far, tomb mural relic sites have not been found in the Chinese provincial administrative regions of Tibet, Shanghai, Tianjin, Hainan, Hong Kong, Macao, and Taiwan. |
| 4 | On 25 October 2016, the China Ancient Capital Research Summit Forum was staged in Chengdu, in which Chengdu was officially listed in “Chinese Great Ancient Capitals”. The Chinese Society for Ancient Capital Studies is a national academic organization that comprises groups and individuals from various domestic institutions of higher learning, scientific research institutions and cultural groups. Previously, the Society recognized “nine ancient capitals”, i.e., Xi’an, Luoyang, Nanjing, Beijing, Kaifeng, Hangzhou, Anyang, Zhengzhou and Datong. Together with Chengdu, there are ten ancient capitals in China. For the official report of Famous Ancient Capital of China, see http://gdmc.snnu.edu.cn/info/1003/1108.htm (accessed on 19 December 2022). |
References
- Cantwell, Christopher D., and Kristian Petersen. 2021. Digital Humanities and Research Methods in Religious Studies. Berlin: De Gruyter, vol. 2, p. 122. [Google Scholar]
- Editorial Department of Encyclopedia of China Press, ed. 1992. Water Conservancy. In Encyclopedia of China. Beijing: Encyclopedia of China Press, p. 167. [Google Scholar]
- Huang, Xiaofen. 1996. The Transformation of the Han-Dynasty Tomb Form: An Analysis of the Evolution from the Vertical Cave-Style Outer Coffin Tomb to the Horizontal Cave-Style Chamber Tomb. Archaeology and Cultural Relics 1: 49–69. [Google Scholar]
- Kilde, Jeanne Halgren. 2014. Approaching Religious Space: An Overview of Theories, Methods, and Challenges in Religious Studies. Religion and Theology 20: 183–201. [Google Scholar] [CrossRef]
- Knott, Kim. 2005. Spatial Theory and Method for the Study of Religion. Temenos 41: 153–84. [Google Scholar] [CrossRef]
- Knott, Kim. 2014. The Location of Religion: A Spatial Analysis. Abingdon-on-Thames: Routledge, p. 21. [Google Scholar]
- Wang, Xiaoyang. 2018. On the History of Chinese Tomb Murals. Beijing: Science Press, p. 18. [Google Scholar]
- Warf, Barney, and Santa Arias, eds. 2009. The Spatial Turn: Interdisciplinary Perspectives. Abingdon-on-Thames: Routledge, p. 171. [Google Scholar]
Disclaimer/Publisher’s Note: The statements, opinions and data contained in all publications are solely those of the individual author(s) and contributor(s) and not of MDPI and/or the editor(s). MDPI and/or the editor(s) disclaim responsibility for any injury to people or property resulting from any ideas, methods, instructions or products referred to in the content. |
© 2023 by the authors. Licensee MDPI, Basel, Switzerland. This article is an open access article distributed under the terms and conditions of the Creative Commons Attribution (CC BY) license (https://creativecommons.org/licenses/by/4.0/).